lopez-santiago_et_al 2011 revised ii final
TRANSCRIPT
1
Na+ CHANNEL SCN1B REGULATES DORSAL ROOT GANGLION NOCICEPTOR EXCITABILITY IN VIVO
Luis F. Lopez-Santiago, William J. Brackenbury1, Chunling Chen, and Lori L. Isom From Department of Pharmacology, University of Michigan, Ann Arbor, MI 48109-0632
1Present Address: Department of Biology, University of York, Heslington, York, YO10 5DD, UK
Running head: Scn1b regulates nociceptor excitability Address correspondence to: Lori L. Isom, Ph.D., Department of Pharmacology, University of
Michigan, 1301 MSRB III, 1150 W. Medical Center Dr., Ann Arbor, MI 48109-0632, Telephone: 734-936-3050, Fax: 734-763-4450, [email protected]
Nociceptive dorsal root ganglion (DRG) neurons express tetrodotoxin-sensitive (TTX-S) and -resistant (TTX-R) Na+ current (INa) mediated by voltage-gated Na+ channels (VGSCs). In nociceptive DRG neurons VGSC β2 subunits, encoded by Scn2b, selectively regulate TTX-S α subunit mRNA and protein expression, ultimately resulting in changes in pain sensitivity. We hypothesized that VGSCs in nociceptive DRG neurons may also be regulated by β1 subunits, encoded by Scn1b. Scn1b null mice are models of Dravet Syndrome, a severe pediatric encephalopathy. Many physiological effects of Scn1b deletion on CNS neurons have been described. In contrast, little is known about the role of Scn1b in peripheral neurons in vivo. Here we demonstrate that Scn1b null DRG neurons exhibit a depolarizing shift in the voltage-dependence of TTX-S INa inactivation, reduced persistent TTX-R INa, a prolonged rate of recovery of TTX-R INa from inactivation, and reduced cell surface expression of Nav1.9 compared to their wildtype (WT) littermates. Investigation of action potential (AP) firing shows that Scn1b null DRG neurons are hyperexcitable compared to WT. Consistent with this, transient outward K+ current (Ito) is significantly reduced in null DRG neurons. We conclude that Scn1b regulates the electrical excitability of
nociceptive DRG neurons in vivo by modulating both INa and IK. VGSCs comprise one pore-forming α subunit and two β subunits (β1 – β4, encoded by Scn1b – Scn4b) that do not form the pore but play critical roles in channel subcellular localization, regulation of INa, VGSC gene transcription, and cell adhesive interactions leading to cytoskeletal modulation, changes in cell morphology, and cellular migration [1-3].
All four mammalian VGSC β subunit gene products are expressed in DRG neurons [4], however, little is known about their roles in nociception. The role of Scn1b in DRG neurons in vivo has not been investigated. Scn1b mRNA is expressed in DRG neurons [4] and the Scn1b splice variant β1B is expressed in adult rat DRG neurons as assessed by immunohistochemistry [5]. Scn1b mRNA expression changes in the dorsal horn of the spinal cord in a model of neuropathic pain in rats [6], suggesting that β1/β1B are important in nociception. In spite of this, the effects of β1 on the functioning of heterologously over-expressed sensory neuronal VGSCs are controversial. Initial reports of Nav1.7 expression showed no functional effects of β1 [7, 8]. Later, it was reported that co-expression of β1 with Nav1.7 resulted in more rapid inactivation, hyperpolarizing shifts in the voltage-dependence of activation and inactivation, and accelerated recovery from inactivation [9]. Similarly, Nav1.8 was originally reported to be
http://www.jbc.org/cgi/doi/10.1074/jbc.M111.242370The latest version is at JBC Papers in Press. Published on May 9, 2011 as Manuscript M111.242370
Copyright 2011 by The American Society for Biochemistry and Molecular Biology, Inc.
by guest on February 12, 2018http://w
ww
.jbc.org/D
ownloaded from

2
unaffected by β1 [10]. In the hands of another group, however, β1 plus Nav1.8 co-expression resulted in more rapid inactivation, hyperpolarizing shifts in the voltage-dependence of activation and inactivation, accelerated recovery from inactivation, and rapid entry into the slow inactivated state [9, 11]. Heterologous expression of Nav1.9 has been reported, but the effects of β subunits on this channel are not known [12]. Our goal here was to investigate the role of Scn1b in small DRG neurons in vivo. Taken together, our results suggest that Scn1b has complex effects on TTX-S and TTX-R INa as well as IK in nociceptors and thus may be a reasonable target for future drug development. These data represent the first report of the physiological role of Scn1b in DRG neurons in vivo.
EXPERIMENTAL PROCEDURES Preparation of DRG neurons - The generation of Scn1b null mice was described previously [13]. Animals used in the present study were bred from a congenic strain of Scn1b+/- mice that had been repeatedly backcrossed to C57BL/6 for at least 15 generations. Animals of both sexes were used. All animal experiments were performed in accordance with the guidelines of the University of Michigan Committee on Use and Care of Animals. L4/5 DRG neurons were acutely dissociated from P17-19 WT or null littermate mice as reported previously [4]. Dissociated neurons were incubated for 2-10 h prior to electrophysiological recording, with the first 2 h used to allow cells to settle and adhere to the bottom of the culture dishes or coverslips. The remaining 8 h recording period was sufficiently short to minimize changes in electrical properties that may occur in long-term cultures. Voltage clamp recording - Voltage clamp recordings were performed in the standard whole-cell configuration as described previously [4]. Small DRG neurons were
defined as those with 12 pF < Cm < 42 pF. All cells were examined within 10-60 min after removal from the cell culture incubator.
Currents were low-pass filtered at 5 kHz with a four-pole Bessel filter and digitally sampled at 20 kHz or 40 kHz. Capacitive transients were canceled with the amplifier circuitry and linear leakage currents were digitally subtracted on-line with P/4 routines. Patch electrodes had resistances of 0.8–2.5 MΩ and the series resistance was typically in the range of 1–5 MΩ. When appropriate, this was reduced by 40–60% using the compensation circuit of the amplifier. The holding potential (HP) was always -80 mV. Recordings were performed using pClamp 9 software (Axon Instruments).
To analyze the voltage dependence of channel activation, the Na+ conductance (GNa) was calculated. Peak current data for each cell were divided by the respective driving force (Vm-Vrev) and plotted against Vm and fit to a Boltzmann equation of the form
GNa = Gmax/(1+exp(-(Vm-V½)/k)) where Gmax is the maximum GNa, V½ is the voltage at which 50% of the VGSCs are activated, and k is the slope of the curve. Steady-state inactivation was measured by applying a double pulse protocol, consisting of a 500 ms prepulse ranging from -120 to 20 mV (in 5 and 10 mV increments), followed by a test pulse to 0 mV. Each data set (a plot of peak INa during the 0 mV test pulse versus prepulse voltage) was fit with the summation of two Boltzmann equations of the form
INa = F1 /[1 + exp((Vm-V1 ½)/k1)] + F2 /[1 + exp((Vm-V2 ½)/k2)]
where F1 and F2 are the fractions of the first and second components of inactivation, respectively. The most negative component (component 1) results from the TTX-S INa whilst the other results from TTX-R INa. V½ is the potential at which half of the INa was inactivated and k is the slope factor for each component. The sum of both fractions is the calculated maximum INa (F1 + F2 = Imax). Data
by guest on February 12, 2018http://w
ww
.jbc.org/D
ownloaded from

3
points were then normalized with respect to Imax to obtain the inactivation curve.
To examine the rate of channel recovery from inactivation, a protocol was designed comprising a 500 ms prepulse to -120 mV, followed by a test pulse to 0 mV, and then returning to -120 mV for a variable time period (0.25, 0.5, 1, 2, 4, 6, 8, 10, 20, 30, 40, 50, 75, 100, 200, 300, 400, 500 and 750 ms) before application of a second test pulse to 0 mV. The INa amplitude from the second 0 mV pulse was divided by the amplitude of the corresponding first test pulse to obtain the fraction of INa recovered after the recovery time. The data were fit with a double exponential equation of the form
INa p2 / INa p1 = f1*[1-exp(-t/τ1)] + f2*[1-exp(-t/τ2)]
where, INa p2 / INa p1 is the fraction of current recovered, f1 and f2 are the fractions of fast and slow recovery components, respectively, t is recovery time, and τ1 and τ2 are the time constants for each recovery component. AP measurements - Isolated DRG neurons were bathed at RT in 1× HBSS (Invitrogen, Carlsbad, Ca) supplemented with 20 mM HEPES, pH 7.3. Patch pipettes (1.0–3.0 MΩ) were filled with (in mM): 135 KCl, 10 NaCl, 1 CaCl2, 10 EGTA, and 10 HEPES, pH 7.4 with KOH. The resting potential (Vrest) was determined under current clamp at zero current. The stimulus to elicit an AP (threshold current) was determined by application of 3 ms test pulses every 2.5 s, starting at 0.1 nA and increasing by 0.1 nA until an AP was observed. Subsequent APs were evoked by application of 12X3 ms test pulses at 1.5X threshold [14]. DRGs were paced at 1, 10, 6.6, 3.3, and finally 1 Hz, for every cell the same sequence of protocols was used. Data from the threshold, 1, and 10 Hz protocols are reported. Current clamp recording was performed on I-Clamp fast mode on an Axopatch 200B amplifier (Molecular Devices, CA). To quantify AP duration, the maximal spike amplitude was
calculated as the voltage from overshoot to the afterhyperpolarization (AHP) value followed by calculation of the absolute duration between depolarization and repolarization at 50 % of the maximal spike amplitude (ADP50) (Fig. 6B). Finally, the maximum rates of depolarization and repolarization were measured from the differentiated waveform. Isolated K+ currents (IK) – IK were recorded from single, small DRG neurons at RT in the presence of a bath solution that contained (in mM): 150 choline-Cl, 5 KCl, 1 MgCl2, 0.1 CdCl2, 10 HEPES, 10 glucose (pH 7.3 with KOH) and 1µM TTX. Fire-polished patch pipettes filled with an internal solution containing (in mM): 100 KCl, 30 NMDG, 1 CaCl2, 1 MgCl2, 10 EGTA, 4 MgATP, 10 HEPES, and 10 glucose (pH 7.3 with HCl). To isolate Ito a protocol with 150 ms test pulses ranging from -40 to 60 mV (in 10 mV increments) was applied twice, first with a prepulse to -110 and then with prepulse to -40 mV. Subtracting currents obtained using the -40 mV prepulse protocol from those obtained using the -110 mV prepulse protocol resulted in Ito. Analysis of Electrophysiological Data - Data were analyzed using pClamp 9 (Axon Instruments) and Sigma Plot 10 or 11 (SPSS Inc, Chicago, IL). The statistical significance of differences between mean values for null and WT neurons was evaluated by Student’s unpaired t test or Chi-square, as indicated, with P < 0.05 considered significant. Results are presented as means ± SEM. Immunohistochemistry - L4/5 DRGs from P14-P16 WT or null mice were fixed in 4 % paraformaldehyde for 15 min, followed by cryoprotection in 10 % and 30 % sucrose, respectively, for 24 h. DRGs were then frozen in M1 embedding medium (Thermo Fisher Scientific, Waltham, MA). Sections were cut to a thickness of 20 µm on a Leica CM1850 cryostat, mounted on glass slides and stored at -20 ˚C until use. Tissue sections were washed 3 times in 0.1 M phosphate buffer (PB),
by guest on February 12, 2018http://w
ww
.jbc.org/D
ownloaded from

4
followed by blocking for 1 h in PBTGS (10 % normal goat serum and 0.3 % Triton X-100 in 0.1 M PB). Sections were incubated overnight with primary antibodies diluted in PBTGS: polyclonal rabbit anti-Nav1.8 (1:200; Alomone, Jerusalem, Israel), polyclonal rabbit anti-Nav1.9 (1:400; a gift from Dr. Patrick Delmas, Laboratoire de Neurophysiologie Cellulaire, Faculté de Médecine IFR Jean Roche, Marseille, France), or monoclonal mouse anti-peripherin (1:200; Millipore, Temecula, CA). After 3 washes in 0.1 M PB, sections were incubated for 2 h with Alexafluor 488 anti-mouse and Alexafluor 594 anti-rabbit antibody (1:500 in PBTGS; Invitrogen, Carlsbad, CA). Sections were then washed once in 0.1 M PB, then incubated for 5 min in 4’,6-diamidino-2-phenylindole (DAPI; 10 µg/ml; Sigma), followed by two additional washes in 0.1 M PB. The sections were dried and mounted (Gel/Mount; Biomeda, Foster City, CA). Confocal microscopy and image analysis - Samples were viewed using an Olympus Fluoview 500 confocal laser scanning microscope with 100X objectives in the University of Michigan Department of Pharmacology. Images (512 x 512 pixels) were initially processed with the Olympus Optical Fluoview software, and then exported into ImageJ (NIH) and/or Adobe Photoshop. Ten images each of DRG sections colabeled with anti-Nav1.8 or anti-Nav1.9 and anti-peripherin were analyzed per mouse, for a total of 3 WT and 3 null mice. The percentage of small DRG neurons expressing Nav1.8 or Nav1.9 was calculated from those images. In addition, for each image, the number of peripherin-positive neurons that also expressed Nav1.8 or Nav1.9 was counted and expressed as a percentage. Data were combined to provide an overall mean and SEM.
The subcellular distribution of Nav1.8 and Nav1.9 labeling in small neurons was analyzed using a method similar to [15-17].
Briefly, for each image and using ImageJ software (NIH), two straight lines were drawn across well-defined cells, avoiding the nucleus. A profile of signal intensity was obtained for each line, and then using Clampfit 9.2 software (Axon Instruments), the signal intensity was calculated as the area under the curve. Signal intensity in the plasma membrane region, defined as 0.75 µm inward from the outer edge of labeling, was compared with average the cytoplasmic signal intensity of equivalent internal length.
RESULTS
Identification and definition of neuronal size - We measured mean cell capacitance (Cm) of 20.0 ± 1.6 pF (n = 34) for WT and 16.28 ± 0.9 pF (n = 29) for null neurons (p = 0.051) [4, 18, 19]. On average, Scn1b null neurons exhibited a slightly smaller Cm than WT neurons. This difference may reflect the overall small size of Scn1b null mice compared to their WT littermates [13].
Using a well established voltage clamp protocol based on previously observed differences in voltage gating properties between TTX-S and TTX-R VGSCs expressed in DRG neurons [4, 20], two types of INa were dissected from the total INa. Briefly, a current-voltage (I-V) protocol with a 500 ms prepulse to -120 or -50 mV followed by a test pulse from -100 to +40 mV was applied, with steps of 5 and 10 mV, waiting 10 s between each step (Fig. 1A, inset). Following application of a -120 mV prepulse, total INa, the sum of TTX-S and TTX-R INa, was recorded (Fig. 1A, upper traces). A second I-V protocol was then applied to the same cell, but with a -50 mV prepulse to inactivate TTX-S INa, resulting in the TTX-R component of INa (Fig. 1A, middle traces). TTX-S INa was subsequently calculated by digital subtraction (Fig. 1A, lower traces). The holding potential was -80 mV for all the recordings. This experiment classified small DRG neurons into two subgroups: “small-
by guest on February 12, 2018http://w
ww
.jbc.org/D
ownloaded from
5
fast” and “small-slow”, as previously described for Scn2b null neurons [4]. If the maximum amplitude of TTX-S INa was greater than 70% of the total INa for a given cell, that cell was placed in the small-fast subgroup [4, 18]. These cells made up 65% (13/20) of the WT small cell population and 44% (10/23) of the Scn1b null small neurons. Cells placed in the small-slow subgroup had TTX-R INa greater than 70% of the total INa. These cells made up 30% (6/20) of the WT and 48% (11/23) of the Scn1b null small cells. Cells that did not clearly fall into either category (5-8%) were not included in our analysis. The proportions of small-fast and small-slow cells between genotypes were not statistically significant (Chi-square, p = 0.1838). Effect of Scn1b deletion on INa voltage-dependent properties - INa densities for both genotypes as a function of command voltage are plotted in Fig. 1B for small-fast neurons and in Fig. 1C for small-slow neurons. We did not observe significant changes in the density of TTX-S (squares) or TTX-R (circles) INa for either small-fast (Fig. 1B; n = 13 for WT, black, solid symbols; n = 10 for Scn1b null, gray, open symbols) or small-slow DRG neurons (Fig. 1C; n = 6 for WT, black, solid symbols; n = 11 for Scn1b null, gray, open symbols). There were no differences in the total INa (TTX-S plus TTX-R) for small fast (Inset Fig. 1B) or small slow neurons (data not shown) between genotypes. Further, we observed no differences in the current-voltage curves between Scn1b null and WT neurons when small DRG neurons were pooled, regardless of fast or slow classification. These results suggested that there were no compensatory changes in the expression of VGSCs responsible for transient INa resulting from Scn1b deletion. Based on these data, all subsequent electrophysiological results in this study are reported for the pooled group (slow plus fast) of small neurons. Analyses of each subgroup were performed with similar conclusions, but not shown.
To analyze the voltage-dependence of channel activation, the Na+ conductance (GNa) was calculated as described in Experimental Procedures. For WT (solid symbols, n = 19) and Scn1b null (open symbols, n = 21) small DRGs neurons (Fig. 2A and C) all mean values for current activation, Gmax, V½ (Fig. 2C) and k, were similar for both TTX-R (gray) and TTX-S (black) INa between groups. These results again suggested that Scn1b does not regulate cell surface levels of VGSCs that contribute to transient INa in DRG neurons.
Steady-state inactivation was measured as described in Experimental Procedures. An example of INa obtained from a typical small WT neuron in response to a test pulse to 0 mV is shown in the inset to Fig. 2B. In this example, as in practically all small DRG neurons tested, and previous reports [4, 18, 20], the fast INa (TTX-S) inactivated at more negative voltages than the slow INa (TTX-R). Inactivation curves shown were generated from the same cells used to calculate activation curves in Fig 2A. The corresponding V½ are compared in Fig. 2D. The V½ of inactivation for TTX-R INa (in small Scn1b null neurons (open symbol) was not significantly different from that measured in small WT neurons (solid symbol) (p = 0.088, Fig. 2D). In contrast, V½ for TTX-S INa in the Scn1b null neurons was shifted 10.8 mV in the depolarizing direction (p = 0.048, Fig. 2 B and D) compared with WT. Similar results were obtained using an alternative analysis in which independent inactivation curves for TTX-S and TTX-R INa were calculated (not shown) [4].
The rate of channel recovery from inactivation was measured as described in Experimental Procedures (Fig. 2E). In agreement with previous reports, the time course of recovery from inactivation exhibited two components, with TTX-R INa recovering faster than TTX-S INa [20, 21]. The time constants for recovery were: WT τfast = 0.80 ± 0.09 ms and τslow = 105.03 ± 19.96 ms; Scn1b
by guest on February 12, 2018http://w
ww
.jbc.org/D
ownloaded from
6
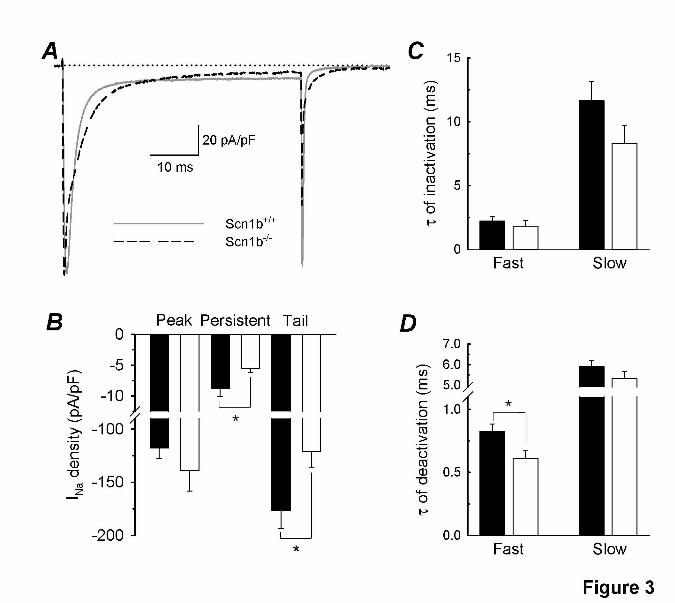
null τfast = 1.47 ± 0.30 ms and τslow = 56.55 ± 12.26 ms. τfast was significantly prolonged for Scn1b null compared with WT neurons (p = 0.043), suggesting a change in the kinetics of TTX-R INa in response to the null mutation. In contrast, τslow, as well as the fractions of each component present in each genotype, were not significantly different (p > 0.05). Persistent INa is altered in Scn1b null neurons - DRG neurons express both transient and persistent INa, with the TTX-R channels Nav1.8 and Nav1.9 contributing significantly to these two components, respectively [22, 23]). To examine changes in persistent INa in response to Scn1b deletion we first applied a 50 ms long depolarizing pulse to 0 mV to record both transient and persistent INa (Fig. 3A). We observed no changes in the density of INa in Scn1b null neurons compared to WT at the peak of the transient INa (p = 0.413, Fig. 3B). In contrast, the persistent INa, measured as the average density of current during the last 2 ms of the test pulse, was reduced approximately 40% in Scn1b null neurons compared to WT (p = 0.025, Fig. 3B). We confirmed this difference by analyzing the density of the tail current, measuring VGSCs that were available to conduct at the end of the test pulse (Fig. 3A). The density of the tail INa was smaller in Scn1b null neurons (-121.3 ± 14.6 pA/pF, n = 21) compared with WT (-176.4 ± 17.0 pA/pF, n = 19), and this difference was statistically significant (p = 0.018, Fig. 3B).
To evaluate the kinetics of current inactivation, the decaying phase of INa was fit with a double exponential function, obtaining two inactivation time constants, τfast and τslow. We observed no significant changes in the values of either of these constants between genotypes (Fig. 3C, p = 0.334 and p = 0.123). Further, there were no changes in the proportion of the fast or slow components between genotypes (not shown). To quantify the rate of deactivation, the decaying phase of the tail INa was fit with a double exponential
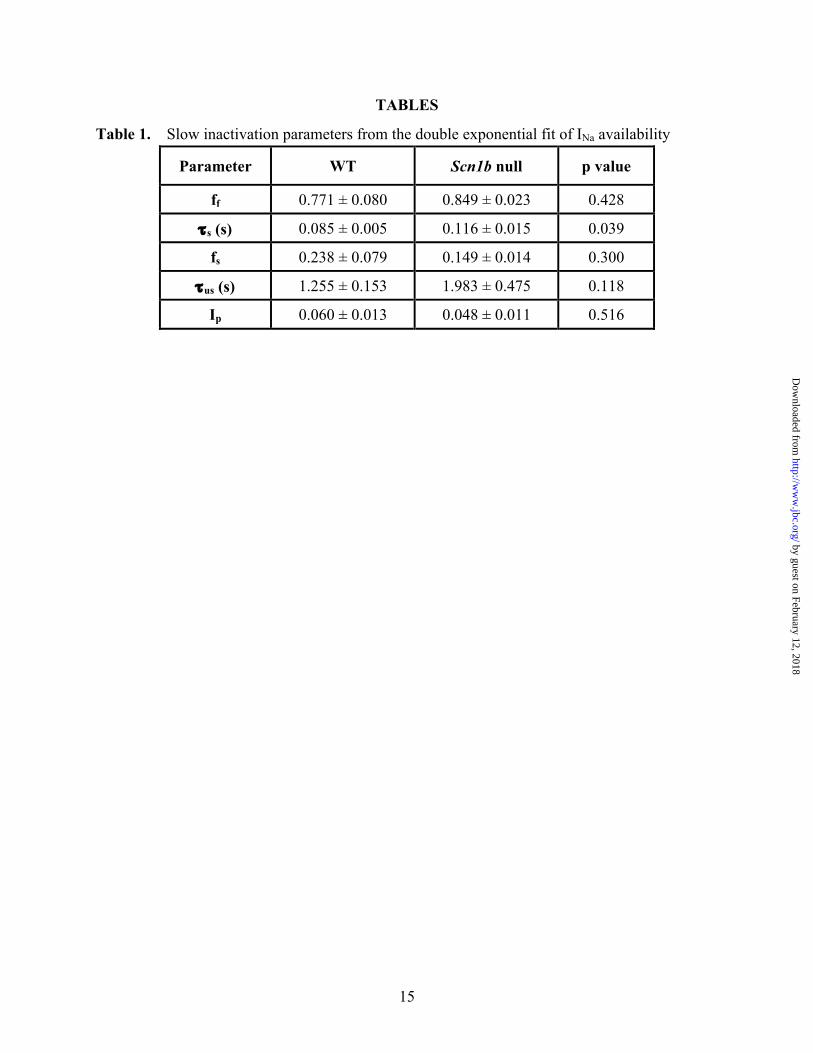
function (Fig. 3D). While there were no changes in τslow for deactivation, we observed that τfast for deactivation was significantly smaller for Scn1b null neurons compared to WT (p = 0.015). The proportions of slow and fast deactivating current were unchanged between genotypes (not shown). These results suggested that Scn1b deletion may affect the expression or subcellular localization of the VGSC known to be responsible for persistent or slow inactivating INa in DRG neurons, Nav1.9 [24]. Scn1b modulates slow inactivating INa - To analyze the role of Scn1b in regulation of persistent or slow inactivating INa in greater detail, we used 2 s ramp protocols from -100 to 50 mV with a change of 0.075 mV/ms (Fig. 4A, top trace) to record instantaneous IV curves of very slow inactivating and persistent currents (Fig. 4A). Using this method, we observed a 42% reduction in the maximum amplitude of this current in Scn1b null neurons compared with WT, with no change in voltage dependence. In a second series of experiments we used a double pulse protocol consisting of a pulse to 0 mV followed by a conditioning pulse of variable duration (10 ms to 16 s) and a test pulse of 25 ms duration (Fig. 4B, inset). The current generated from the second pulse (not inactivated) was normalized to the first pulse (total current). Data were fit with a double exponential equation, resulting in two constants for inactivation: one on the order of 100 ms for slow inactivation and another on the order of 1.5 s for ultraslow inactivation (Fig. 4B). Slowly inactivating INa was observed to constitute the largest fraction of the total INa measured using this method for both genotypes (Table 1). Further, this current was modulated by Scn1b expression (36% increase, p = 0.039). In contrast, the ultraslow and persistent INas recorded using this double pulse protocol were not significantly changed in the absence of Scn1b (p = 0.118 and 0.516 respectively; Table 1; Fig. 4B).
by guest on February 12, 2018http://w
ww
.jbc.org/D
ownloaded from

7
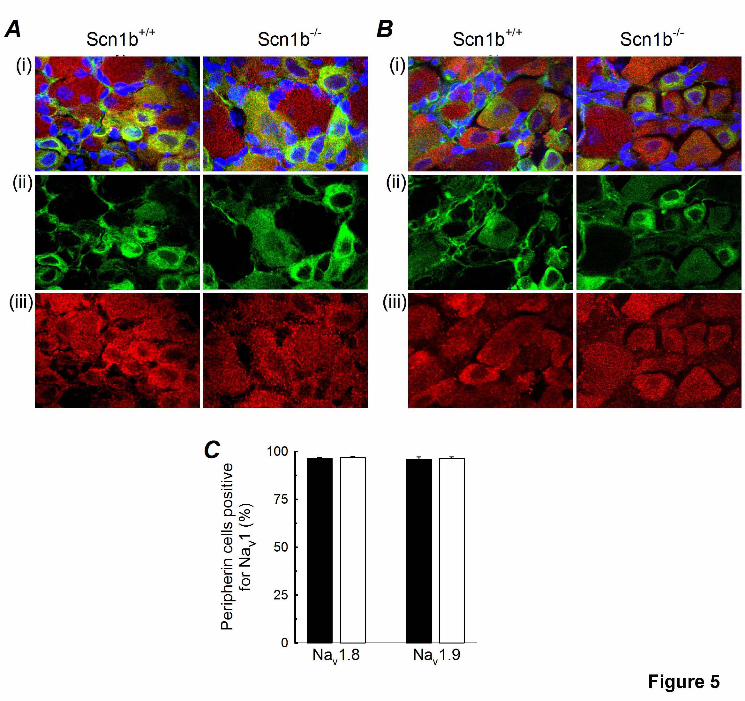
Nav1.9 expression and subcellular localization are altered in Scn1b null neurons – Our electrophysiological measurements predicted that Scn1b deletion may result in a change in expression or subcellular localization of Nav1.9. Using specific antibodies recognizing Nav1.8, Nav1.9, or peripherin, immunohistochemistry was performed on 20 µm L4/5 DRG sections isolated from Scn1b null or WT mice (Fig. 5). Double labeling with anti-peripherin was used to analyze the populations of neurons expressing these two TTX-R channels in small DRG neurons [25]. As reported previously ([26]), we observed that Nav1.8 (Fig. 5A, red) and Nav1.9 (Fig. 5B, red) are expressed in both large and small DRG neurons, with anti-peripherin (Fig. 5A and B, green) identifying the small neurons. DAPI staining (blue) was used to identify cell nuclei. The percentages of peripherin-positive Nav1.8 labeled cells and peripherin-positive Nav1.9 labeled cells were similar for WT and Scn1b null sections, calculated for 30 DRG images from 3 mice of each genotype (Fig. 5C), suggesting that these neuronal populations were not altered by the Scn1b null mutation.
We next quantified the intensity of anti-Nav1.8 or anti-Nav1.9 labeling in small, peripherin-positive neurons using a technique previously reported to calculate a densitometry profile of VGSCs across the cell (Fig. 6A, inset) [15-17]. We defined the area within 0.75 µm of the cell surface as the plasma membrane region. The results of this measurement for a typical WT cell are shown in Fig. 6A. The areas in gray, delimited by the red lines on either side of the plot, are defined as the plasma membrane regions. Using this method, we observed a reduction in the localization of Nav1.9 to the defined plasma membrane region in peripherin-positive Scn1b null DRG neurons compared to WT (p = 0.00002). Fig. 6B shows the results of a single experiment (n = 8 cells per genotype), in which we observed a significant reduction in
anti-Nav1.9 signal intensity (p = 0.0054) in the defined plasma membrane region for Scn1b null neurons compared to WT. Further, we observed a significant reduction in anti-Nav1.9 signal intensity inside the cell (area to the right of the red line in panel B) (p = 0.047). The data reached greater significance when the results of 3 independent experiments were averaged (Fig. 6C, n = 24 cells per genotype), in which we observed a 30% reduction in Nav1.9 plasma membrane signal intensity in the null neurons compared to WT (p = 5.27 x 10⁻⁶) as well as a 25% reduction in Nav1.9 signal intensity in the defined intracellular region (p = 2.27 x 10⁻⁶). Similar analysis of anti-Nav1.8 labeling in peripherin-positive neurons (Fig. 6D) revealed no significant changes in the localization of this channel to the defined plasma membrane region (p = 0.55), even though we did observe a reduction in the defined intracellular anti-Nav1.8 signal intensity in the null neurons compared to WT (p = 0.006). These results suggested that the overall expression levels of Nav1.8 and Nav1.9 protein are reduced in Scn1b null neurons. However, of these two channels, only the cell surface expression of Nav1.9 appears to be affected by the null mutation, consistent with the observed functional reduction in persistent INa. Excitability of small DRG neurons is altered in Scn1b null mice - To assess the contribution of Scn1b to resting membrane potential and AP properties, we performed current clamp recordings from acutely dissociated small DRG neurons of both genotypes. APs were induced by injecting depolarizing current pulses into the cell. We observed large APs with characteristic shoulders, as previously described for nociceptors [27]. The current necessary to evoke a single AP (threshold current) was similar for WT (0.282 ± 0.018 nA, n = 11) and Scn1b null (0.250 ± 0.029 nA, n = 12) neurons, however, the shape of the resulting APs was altered between genotypes (Fig. 7A). The values for the resting potential
by guest on February 12, 2018http://w
ww
.jbc.org/D
ownloaded from

8
(Vrest), overshoot amplitude, and after hyperpolarization (AHP) were similar for neurons of both genotypes (Fig. 7B). However, the absolute difference between Vrest and AHP was significantly smaller for null neurons (20.8 ± 2.1 mV for WT vs. 14.7 ± 1.7 mV for Scn1b null, p = 0.038), suggesting that null neurons become less hyperpolarized at the end of the AP than WT and are thus more available to fire subsequent APs. Further, the AP duration measured at the midpoint of the maximal spike amplitude (ADP50) was significantly reduced in the null neurons (5.96 ± 0.44 ms for WT; and 4.39 ± 0.38 ms for null, p = 0.014), again suggesting greater availability for subsequent AP firing. To analyze these changes in greater detail, the maximum rates of depolarization and repolarization were calculated from the differentiated waveform of the AP (Fig. 7C). The first derivative of Vm showed a single depolarizing peak (INa) and two repolarizing peaks, similar to previous results [27, 28]. Consistent with our immunohistochemistry results showing no changes in cell surface expression of Nav1.8, we observed no significant changes in the rate of the AP upstroke in the absence of Scn1b (Fig. 7D, p = 0.111). In contrast, the rate of the first component of the repolarizing phase was increased in Scn1b null small DRG neurons compared to WT (Fig. 7D, p = 0.0001).
To determine how the observed increased rate of repolarization would affect the excitability of Scn1b null neurons, we applied a 1000 ms depolarizing pulse of 1.5 times the threshold current to examine neuronal firing. We observed that 8 of 9 WT cells fired a single AP in response to this stimulus. A typical WT result is shown in Fig. 8A (black trace). In contrast, 7 of 9 Scn1b null neurons fired a train of more than 20 APs in response to the stimulus (Fig 8B, bottom panel). A typical Scn1b null recording is shown in Fig. 8A (gray trace). These results are quantified in Fig. 8B. We calculated a
mean of 1.3 ± 0.3 APs per cell for WT vs. 23.3 ± 5.5 APs per cell for Scn1b null (Fig. 8B, top panel; p = 0.00099). We next applied a train of 12 pulses to 1.5X threshold current, 3 ms long, paced at 10 Hz. Under these conditions both genotypes generated APs with similar properties (Fig. 8C). Results of analysis of the differentiated AP waveforms generated at this frequency showed that the initial upstroke rate was increased slightly in null neurons compared to WT (Fig. 8D, upper panel, first AP; p = 0.054). Repeating the same pulse every 100 ms, we observed that the upstroke rate of the 12th AP was significantly increased for Scn1b null neurons compared to WT (Fig. 8D, upper panel, twelfth PA; p = 0.009), reflecting less accumulation of INa inactivation in null neurons compared to WT. In addition, the rate of repolarization was increased for null neurons compared to WT for the first threshold pulse as well as for the twelfth pulse (Fig. 8D, lower panel; p = 0.009 and p = 0.008, respectively). Effect of Scn1b deletion on Ito density. Ito serves to repolarize the neuronal membrane following depolarizing events and to stabilize the membrane potential below the firing threshold [29]. Thus, differential regulation of this current is expected to modify neuronal excitability. Because K+ channels responsible for Ito in heart have been shown to be modified by Scn1b in vitro [30, 31], we asked whether Ito may be modulated by Scn1b deletion in DRGs in vivo and thus contribute to hyperexcitability. Ito was recorded as described in Experimental Procedures. We observed a 40-50% reduction in Ito density in Scn1b null compared with WT neurons (Fig. 8E, n = 7 WT and n = 10 null). We postulate that this reduction in Ito may underlie the observed hyperexcitability of Scn1b null DRG neurons.
DISCUSSION The overall conclusion of this work is
that Scn1b null nociceptive neurons are
by guest on February 12, 2018http://w
ww
.jbc.org/D
ownloaded from

9
hyperexcitable, suggesting that Scn1b plays an important role in maintaining normal excitability, and with that pain sensation, in WT DRGs. Scn1b deletion results in complex effects on INa and IK expression which, taken together, tip the balance toward increased excitability in DRG neurons in vivo. A depolarizing shift in the voltage-dependence of VGSC inactivation (resulting in greater channel availability), decreased persistant INa, decreased τdeact,fast, and a decreased proportion of slow inactivated INa, are all consistent with changes in the AP favoring hyperexcitability, including the observed shortened APD50 and increased rate of AP repolarization. Decreased levels of Nav1.9 at the plasma membrane in response to Scn1b deletion are also consistent with hyperexcitability, as this change is predicted to result in reduced levels of slow-inactivating or non-inactivating INa. Finally, the observation of decreased levels of Ito in DRG neurons in our model is consistent with previous reports in other sensory neuron models, including suppression of A-type (transient outward) IK leading to enhanced excitability of pancreas-specific afferent neurons in chronic pancreatitis [32] , and reduced A-type IK in gastric sensory ganglion neurons leading to hyperexcitability in a model of inflammation and gastric ulcers [33]. Interestingly, our observation of slowed VGSC recovery from inactivation in Scn1b null DRG neurons would suggest hypoexcitability if examined in isolation. However, this effect is out-weighed by other changes in vivo, as overall the sum of the observed effects of Scn1b deletion result in DRG neuron hyperexcitability. We conclude that the role of Scn1b in DRG neurons in vivo is to dampen excitability by predominantly shifting the voltage-dependence of INa inactivation in the hyperpolarizing direction and increasing the level of persistent INa. In addition, through a mechanism that is not yet understood, Scn1b increases Ito.
While the severe and ultimately lethal phenotype of Scn1b null mice [13] precludes a behavioral study of pain, our results predict that these mice have allodynia. Importantly, our data may be translated to imply that human patients with inherited SCN1B-mediated GEFS+ epilepsies [34], especially patients with two inherited functional null SCN1B mutant alleles resulting in Dravet Syndrome [35], may have increased sensitivity to pain.
Scn1b null mice display a hyperexcitable CNS phenotype [13]. Using a combination of heterologous cells and native CNS neurons, we reported previously that Scn1b effectively imposes a “break” on excitability in brain, stabilizing VGSC closed states at hyperpolarized potentials and inactivated states at depolarized potentials [36]. The present study further supports the idea that Scn1b exerts critical controls to limit neuronal excitability and extends this knowledge to the peripheral nervous system. A growing body of evidence suggests that Scn1b and the K+ channel subunits underlying Ito are structurally and functionally associated. In a heterologous system, β1 increases IK density and modulates IK gating generated by Kv4.3 expression [31]. In neonatal rat ventricular myocytes, Scn1b silencing results in reduction of KChIP2 mRNA and protein as well as Kv4.x proteins, with the outcome of decreased Ito in addition to decreased INa [30]. Our observation of decreased Ito in Scn1b null DRGs supports these previous studies and extends those results to include peripheral neurons. Taken together, these data suggest that INa and IK may be structurally associated through VGSC β1 subunits, further, that Scn1b plays a critical role in regulating AP properties in addition to modulation of INa, thus exerting sensitive and multifaceted control over neuronal excitability. Because of this, we propose that β1 and/or β1B, encoded by SCN1B, may be
by guest on February 12, 2018http://w
ww
.jbc.org/D
ownloaded from
10
novel targets for development of pain therapeutics.
REFERENCES 1. Brackenbury, W.J., M.B. Djamgoz, and L.L. Isom, An emerging role for voltage-gated
Na+ channels in cellular migration: regulation of central nervous system development and potentiation of invasive cancers. Neuroscientist, 2008. 14(6): p. 571-83.
2. Brackenbury, W.J. and L.L. Isom, Voltage-gated Na+ channels: potential for beta subunits as therapeutic targets. Expert Opin Ther Targets, 2008. 12(9): p. 1191-203.
3. Patino, G.A. and L.L. Isom, Electrophysiology and Beyond: Multiple roles of Na+ channel β subunits in development and disease. Neuroscience Letters, 2010. in press.
4. Lopez-Santiago, L.F., M. Pertin, X. Morisod, C. Chen, S. Hong, J. Wiley, I. Decosterd, and L.L. Isom, Sodium channel β2 subunits regulate tetrodotoxin-sensitive sodium channels in small dorsal root ganglion neurons and modulate the response to pain. J. Neurosci., 2006. 26: p. 7984-7994.
5. Kazen-Gillespie, K.A., D.S. Ragsdale, M.R. D’Andrea, L.N. Mattei, K.E. Rogers, and L.L. Isom, Cloning, localization, and functional expression of sodium channel β1A subunits. J. Biol. Chem., 2000. 275: p. 1079-1088.
6. Blackburn-Munro, G. and S.M. Fleetwood-Walker, The sodium channel auxiliary subunits β1 and β2 are differentially expressed in the spinal cord of neuropathic rats. Neurosci., 1999. 90(1): p. 153-64.
7. Klugbauer, N., L. Lacinova, V. Flockerzi, and F. Hofmann, Structure and functional expression of a new member of the tetrodotoxin- sensitive voltage-activated sodium channel family from human neuroendocrine cells. Embo J, 1995. 14(6): p. 1084-90.
8. Sangameswaran, L., L.M. Fish, B.D. Koch, D.K. Rabert, S.G. Delgado, M. Ilnicka, L.B. Jakeman, S. Novakovic, K. Wong, P. Sze, E. Tzoumaka, G.R. Stewart, R.C. Herman, H. Chan, R.M. Eglen, and J.C. Hunter, A novel tetrodotoxin-sensitive, voltage-gated sodium channel expressed in rat and human dorsal root ganglia. J Biol Chem, 1997. 272(23): p. 14805-9.
9. Vijayaragavan, K., M.E. O'Leary, and M. Chahine, Gating properties of Na(v)1.7 and Na(v)1.8 peripheral nerve sodium channels. J Neurosci, 2001. 21(20): p. 7909-18.
10. Sangameswaran, L., S.G. Delgado, L.M. Fish, B.D. Koch, L.B. Jakeman, G.R. Stewart, P. Sze, J.C. Hunter, R.M. Eglen, and R.C. Herman, Structure and function of a novel voltage-gated, tetrodotoxin-resistant sodium channel specific to sensory neurons. J. Biol. Chem., 1996. 271(11): p. 5953-6.
11. Vijayaragavan, K., A.J. Powell, I.J. Kinghorn, and M. Chahine, Role of auxiliary beta1-, beta2-, and beta3-subunits and their interaction with Na(v)1.8 voltage-gated sodium channel. Biochem Biophys Res Commun, 2004. 319(2): p. 531-40.
12. Dib-Hajj, S., J.A. Black, T.R. Cummins, and S.G. Waxman, NaN/Nav1.9: a sodium channel with unique properties. Trends Neurosci, 2002. 25(5): p. 253-9.
13. Chen, C., R.E. Westenbroek, X. Xu, C.A. Edwards, D.R. Sorenson, Y. Chen, D.P. McEwen, H.A. O'Malley, V. Bharucha, L.S. Meadows, G.A. Knudsen, A. Vilaythong, J.L. Noebels, T.L. Saunders, T. Scheuer, P. Shrager, W.A. Catterall, and L.L. Isom, Mice lacking sodium channel beta1 subunits display defects in neuronal excitability, sodium channel expression, and nodal architecture. J Neurosci, 2004. 24(16): p. 4030-42.
14. Lopez-Santiago, L.F., L.S. Meadows, S.J. Ernst, C. Chen, J.D. Malhotra, D.P. McEwen, A. Speelman, J.L. Noebels, S.K. Maier, A.N. Lopatin, and L.L. Isom, Sodium channel Scn1b null mice exhibit prolonged QT and RR intervals. J Mol Cell Cardiol, 2007.
15. Brackenbury, W.J. and M.B. Djamgoz, Activity-dependent regulation of voltage-gated Na+ channel expression in Mat-LyLu rat prostate cancer cell line. J Physiol, 2006. 573(Pt 2): p. 343-56.
by guest on February 12, 2018http://w
ww
.jbc.org/D
ownloaded from

11
16. Okuse, K., M. Malik-Hall, M.D. Baker, W.Y. Poon, H. Kong, M.V. Chao, and J.N. Wood, Annexin II light chain regulates sensory neuron-specific sodium channel expression. Nature, 2002. 417(6889): p. 653-6.
17. Shah, B.S., A.M. Rush, S. Liu, L. Tyrrell, J.A. Black, S.D. Dib-Hajj, and S.G. Waxman, Contactin associates with sodium channel Nav1.3 in native tissues and increases channel density at the cell surface. J Neurosci, 2004. 24(33): p. 7387-99.
18. Abdulla, F.A. and P.A. Smith, Changes in Na(+) channel currents of rat dorsal root ganglion neurons following axotomy and axotomy-induced autotomy. J Neurophysiol, 2002. 88(5): p. 2518-29.
19. Abdulla, F.A. and P.A. Smith, Axotomy- and autotomy-induced changes in Ca2+ and K+ channel currents of rat dorsal root ganglion neurons. J Neurophysiol, 2001. 85(2): p. 644-58.
20. Cummins, T.R. and S.G. Waxman, Downregulation of tetrodotoxin-resistant sodium currents and upregulation of a rapidly repriming tetrodotoxin-sensitive sodium current in small spinal sensory neurons after nerve injury. J Neurosci, 1997. 17(10): p. 3503-14.
21. Rush, A.M., M.E. Brau, A.A. Elliott, and J.R. Elliott, Electrophysiological properties of sodium current subtypes in small cells from adult rat dorsal root ganglia. J Physiol (Lond), 1998. 511(Pt 3): p. 771-89.
22. Wood, J.N., J.P. Boorman, K. Okuse, and M.D. Baker, Voltage-gated sodium channels and pain pathways. J Neurobiol, 2004. 61(1): p. 55-71.
23. Akopian, A.N., V. Souslova, S. England, K. Okuse, N. Ogata, J. Ure, A. Smith, B.J. Kerr, S.B. McMahon, S. Boyce, R. Hill, L.C. Stanfa, A.H. Dickenson, and J.N. Wood, The tetrodotoxin-resistant sodium channel SNS has a specialized function in pain pathways. Nature, 1999. 2(6): p. 541-548.
24. Priest, B.T., B.A. Murphy, J.A. Lindia, C. Diaz, C. Abbadie, A.M. Ritter, P. Liberator, L.M. Iyer, S.F. Kash, M.G. Kohler, G.J. Kaczorowski, D.E. MacIntyre, and W.J. Martin, Contribution of the tetrodotoxin-resistant voltage-gated sodium channel NaV1.9 to sensory transmission and nociceptive behavior. Proc Natl Acad Sci U S A, 2005. 102(26): p. 9382-7.
25. Goldstein, M.E., S.B. House, and H. Gainer, NF-L and peripherin immunoreactivities define distinct classes of rat sensory ganglion cells. J Neurosci Res, 1991. 30(1): p. 92-104.
26. Decosterd, I., R.R. Ji, S. Abdi, S. Tate, and C.J. Woolf, The pattern of expression of the voltage-gated sodium channels Na(v)1.8 and Na(v)1.9 does not change in uninjured primary sensory neurons in experimental neuropathic pain models. Pain, 2002. 96(3): p. 269-77.
27. Blair, N.T. and B.P. Bean, Roles of tetrodotoxin (TTX)-sensitive Na+ current, TTX-resistant Na+ current, and Ca2+ current in the action potentials of nociceptive sensory neurons. J Neurosci, 2002. 22(23): p. 10277-90.
28. Bean, B.P., The action potential in mammalian central neurons. Nat Rev Neurosci, 2007. 8(6): p. 451-65.
29. Safronov, B.V., U. Bischoff, and W. Vogel, Single voltage-gated K+ channels and their functions in small dorsal root ganglion neurones of rat. J Physiol, 1996. 493 ( Pt 2): p. 393-408.
30. Deschenes, I., A.A. Armoundas, S.P. Jones, and G.F. Tomaselli, Post-transcriptional gene silencing of KChIP2 and Navbeta1 in neonatal rat cardiac myocytes reveals a functional association between Na and Ito currents. J Mol Cell Cardiol, 2008. 45(3): p. 336-46.
31. Deschenes, I. and G.F. Tomaselli, Modulation of Kv4.3 current by accessory subunits. FEBS Lett, 2002. 528(1-3): p. 183-8.
32. Xu, G.Y., J.H. Winston, M. Shenoy, H. Yin, and P.J. Pasricha, Enhanced excitability and suppression of A-type K+ current of pancreas-specific afferent neurons in a rat model of chronic pancreatitis. Am J Physiol Gastrointest Liver Physiol, 2006. 291(3): p. G424-31.
by guest on February 12, 2018http://w
ww
.jbc.org/D
ownloaded from

12
33. Dang, K., K. Bielefeldt, and G.F. Gebhart, Gastric ulcers reduce A-type potassium currents in rat gastric sensory ganglion neurons. Am J Physiol Gastrointest Liver Physiol, 2004. 286(4): p. G573-9.
34. Scheffer, I.E., L.A. Harkin, B.E. Grinton, L.M. Dibbens, S.J. Turner, M.A. Zielinski, R. Xu, G. Jackson, J. Adams, M. Connellan, S. Petrou, R.M. Wellard, R.S. Briellmann, R.H. Wallace, J.C. Mulley, and S.F. Berkovic, Temporal lobe epilepsy and GEFS+ phenotypes associated with SCN1B mutations. Brain, 2007. 130(Pt 1): p. 100-9.
35. Patino, G.A., L.R. Claes, L.F. Lopez-Santiago, E.A. Slat, R.S. Dondeti, C. Chen, H.A. O'Malley, C.B. Gray, H. Miyazaki, N. Nukina, F. Oyama, P. De Jonghe, and L.L. Isom, A functional null mutation of SCN1B in a patient with Dravet syndrome. J Neurosci, 2009. 29(34): p. 10764-78.
36. Aman, T.K., T.M. Grieco-Calub, C. Chen, R. Rusconi, E.A. Slat, L.L. Isom, and I.M. Raman, Regulation of persistent Na current by interactions between beta subunits of voltage-gated Na channels. J Neurosci, 2009. 29(7): p. 2027-42.
FOOTNOTES
*This work was supported by NIH R01MH059980 to LLI, NIH 2P30DK34933 from the University of Michigan Gastrointestinal Peptide Research Center to LLS, and a University of Michigan Center for Organogenesis Non-Traditional Postdoctoral Fellowship to WJB. Abbreviations used: VGSC, voltage-gated Na+ channel; INa, Na+ current; IK, K+ current; Ito, transient outward current; GNa, Na+ conductance; DRG, dorsal root ganglion; TTX, tetrodotoxin; TTX-S, tetrodotoxin-sensitive; TTX-R, tetrodotoxin-resistent; AP, action potential; APD50, action potential duration 50%; AHP, after hyperpolarization; WT, wild-type.
FIGURE LEGENDS Fig. 1. Current-voltage relationships. A. Protocol for separation of TTX-R and TTX-S INas is shown. A 500 ms prepulse to -120 or -50 mV was applied before a 50 ms test pulse from -100 to 40 mV with steps of 5 or 10 mV (inset). Currents evoked from a typical WT small-fast DRG neuron by test pulses from -50 to 0 mV are shown. Both TTX-S and TTX-R INas were apparent after the -120 mV prepulse (upper traces). Only TTX-R INas were obtained following the -50 mV prepulse (middle traces). The TTX-S component was obtained (lower traces) by digitally subtracting the TTX-R INa from the total INa B. Average peak INa density-voltage relationships for TTX-R INas (circles) and TTX-S INas (squares) of small-fast DRG neurons, WT (closed symbols, n = 13) or Scn1b null (open symbols, n = 10). Inset: I-V curves of total INa from the same cells as in Fig. 1B: WT (closed symbols) and Scn1b null (open symbols). C. Similar to B, but for small-slow neurons, WT (closed symbols, n = 6) or Scn1b null (open symbols, n = 11). For this and all figures, data are presented as mean ± SEM. Fig. 2. Voltage-dependence of activation and inactivation curves and recovery from inactivation. A. Activation curve of peak Na+ conductance: TTX-R (circles) and TTX-S (squares) obtained from the same neurons as in Fig. 1: WT (closed symbols, n = 19); Scn1b null (open symbols, n = 21). Smooth lines are fits to a Boltzmann function for TTX-R (dashed lines) and TTX-S (solid lines) currents, respectively. C. Midpoint potential (V½) of fitted activation curves. B. Steady-state inactivation curves: peak INa at 0 mV, normalized to its maximal value (inset), as a function of voltage during 500 ms prepulse. INas were measured from the same WT
by guest on February 12, 2018http://w
ww
.jbc.org/D
ownloaded from

13
(closed symbols) and Scn1b null (open symbols) small DRG neurons as in A. Each data set was fit with a double Boltzmann function (lines). Inset: Example of INa at 0 mV, from one small WT cell, after 500 ms prepulses from -90 to -10 mV. D. V1/2 of fitted inactivation curves shown in B; squares represent the first component (TTX-S) and circles represent the second component (TTX-R). *Values significantly different from WT, p < 0.05. E. Scn1b null small DRG neurons exhibit delayed recovery from inactivation. Top panel: τslow and τfast for recovery from inactivation for WT (closed symbols) and Scn1b null (open symbols) neurons. Bottom panel: Average time course of recovery from inactivation for total INa for WT (closed symbols; n = 13) and Scn1b null (open symbols; n = 13) neurons. The protocol used included two test pulses to 0 mV with prepulse and interpulse Vms of -120 mV, and recovery intervals from 0.25 to 750 ms. Data were fitted with a double exponential (lines). Significant differences from WT are indicated as * p < 0.05, or *** p < 0.001. Fig. 3. INa density and kinetics at 0 mV. A. Representative INas evoked by a test pulse to 0 mV from a holding potential of -80 mV: WT, solid gray line; Scn1b null, dashed black line). B. Peak, persistent, and tail INa density. Peak is defined as the maximum INa after applying a test pulse to 0 mV. Persistent INa is the average current density measured from 48 - 50 ms following the test pulse. Tail INa is the current measured at the end of the test pulse in response to repolarization to -80 mV. The data were obtained from same neurons used in Fig. 1 and Fig. 2. WT: black bars. Scn1b null: white bars. C. Time constants of INa inactivation. The two time constants of inactivation (τfast and τslow) were obtained by fitting the decay phase of the INa with a double exponential function. WT: black bars. Scn1b null: white bars; not significant differences. D. Time constants of INa deactivation. Similar to C, the two time constants were obtained by fitting the decay phase of the tail INa with a double exponential function. WT: black bars. Scn1b null: white bars. * Indicates a significant difference from WT, p < 0.05. Fig. 4. Persistent and slow inactivating INa. A. Average instantaneous IV curves of slow inactivating INa from WT (n =5 ) and Scn1b null (n = 6) neurons. INa recorded using 2s voltage ramp (gray line). B. INa availability as function of prepulse duration in WT (black circles; n = 12) and Scn1b null (open circles; n = 9) neurons. Slow inactivation was induced by holding the cells at 0 mV for increasing durations of prepulse followed by a test pulse after brief repolarization. Data were fitted with a double exponential equation; solid line for WT and dashed line for Scn1b null. Fig. 5. TTX-R VGSC expression in small DRG neurons. A. Confocal images (100X) of 20 µm DRG sections from WT (left) or Scn1b null (right) mice, stained with anti-Nav1.8 (red, iii) or peripherin (green, ii). The merged image (i) includes nuclear staining by DAPI (blue). B. Similar to A, except row iii demonstrates anti-Nav1.9 labeling. C. Percentage of cells positive for peripherin and Nav1.8 or Nav1.9, as indicated, for WT (black) or Scn1b null (white) DRGs. 30 images from 3 mice of each genotype for each VGSC α subunit antibody were analyzed. Fig. 6. Surface expression of Nav1.9 is reduced in Scn1b null small DRG neurons. A. Typical densitometry profile in arbitrary units (AU) calculated along the white line drawn across the WT cell shown in the inset. In the plot, the areas in gray are defined as the plasma membrane region (0.75 µm from each edge of the cell). Inset: WT neuron inmunopositive for peripherin (green) and Nav1.9 (red). Nuclear staining by DAPI (blue) B. Average profile of
by guest on February 12, 2018http://w
ww
.jbc.org/D
ownloaded from

14
Nav1.9 expression for one experimental group of cells. Plasma membrane area for WT is shown in black and for Scn1b null in gray (n = 32 edges for 8 cells of each genotype). C. Summary of anti-Nav1.9 staining in peripherin-positive cells calculated as in A and B for 3 experiments. WT (black bars) and Scn1b null (white bars) (n = 24 cells/genotype). D. Summary of anti-Nav1.8 staining in peripherin-positive cells, calculated as in A and B for 3 experiments. WT (black bars) and Scn1b null (white bars) (n = 24 cells/genotype). Significant differences from WT are indicated as * p < 0.05, ** p < 0.01, *** p < 0.001. Fig. 7. Scn1b null neurons have altered AP kinetics. Representative APs recorded from one WT (black) and one Scn1b null (gray) neuron. APs were evocated by a 3 ms current pulse (lower trace) to threshold. B. AP parameters, including resting potential (Vrest), overshoot, and afterhyperpolarization (AHP), expressed in mV, for WT (n = 11, black symbols) or Scn1b null (n = 12, gray symbols) small DRG neurons. AP duration at half of the maximal spike amplitude (ADP50, diamonds) indicted in the top x-axis. The AP trace shown is taken from A (Scn1b null). C. Corresponding dVm/dt of the APs shown in panel A. D. Maximum upstroke rate and maximum rate of the first repolarization phase (first negative peak in C). Same symbols and cells as in B. ** Indicates a significant difference from WT at p < 0.01. Fig. 8. Scn1b null neurons are hyperexcitable. A. Typical recordings from WT (black) or Scn1b null (gray) small DRG neurons in response to a depolarizing current pulse (1.5X threshold current) with a duration of 1000 ms (bottom trace) B. Bottom: Histogram of the number of APs fired for each WT (black bars) or Scn1b null (gray bars) cell recorded in response to the depolarizing pulse described in A; numbers represent the center of each bin, and each bin is 10 APs wide. Top: average of firing, (n = 9 neurons per group). C. AP recordings in response to a train of depolarizing pulses (12 pulses, 10 Hz, 1.5X threshold current). The first two and last two APs are shown for a cell of each genotype (top panel) with the corresponding dVm/dt traces (bottom panel). The base line has been displaced for presentation proposes only. D. Maximum upstroke rate and the maximum rate of the repolarization phase measured from the first and twelfth AP recordings using the 10 Hz train protocol for WT (n = 7, black circles) or Scn1b null (n = 8, gray circles) small DRG neurons. E. Ito density for WT (n = 7, black circles) or Scn1b null (n = 10, gray circles) small DRG neurons. Significant difference from WT: # p < 0.06, * p < 0.05, ** p < 0.01, *** p < 0.001; and significant difference from the first AP: & p < 0.06.
by guest on February 12, 2018http://w
ww
.jbc.org/D
ownloaded from
15
TABLES
Table 1. Slow inactivation parameters from the double exponential fit of INa availability
Parameter WT Scn1b null p value
ff 0.771 ± 0.080 0.849 ± 0.023 0.428
τ s (s) 0.085 ± 0.005 0.116 ± 0.015 0.039
fs 0.238 ± 0.079 0.149 ± 0.014 0.300
τus (s) 1.255 ± 0.153 1.983 ± 0.475 0.118
Ip 0.060 ± 0.013 0.048 ± 0.011 0.516
by guest on February 12, 2018http://w
ww
.jbc.org/D
ownloaded from


Luis F. Lopez-Santiago, William J. Brackenbury, Chunling Chen and Lori L. IsomNa+ channel SCN1B regulates dorsal root ganglion nociceptor excitability in vivo
published online May 9, 2011J. Biol. Chem.
10.1074/jbc.M111.242370Access the most updated version of this article at doi:
Alerts:
When a correction for this article is posted•
When this article is cited•
to choose from all of JBC's e-mail alertsClick here
by guest on February 12, 2018http://w
ww
.jbc.org/D
ownloaded from