looking back: are career talks with outside speakers associated with higher wages? an analysis of...
TRANSCRIPT
LOOKING BACK: ARE CAREER TALKS WITH OUTSIDE SPEAKERS ASSOCIATED WITH HIGHER WAGES? AN ANALYSIS OF THE BRITISH COHORT STUDY
Gathered by: Elnaz T. Kashefpakdel, Christian Percy

We’re testing a principle from the literature, that there should be a link from employer contacts to labour market outcomes
School-mediated employer contact …
• Employer mentoring• Enterprise education• Career talks from
external speakers• Work experience /
shadowing• Work-place visits
… through several possible channels
• Better understandingo Which career you
might want to doo Career pathways;
how to succeedo What you are well-
suited to• Better networks to
aid labour market entry + signalling
• More work-focused attitude
… can support labourmarket outcomes …
• Less time unemployed
• Higher wage outcomes
• More job satisfaction• Making the right
career choices earlier (balancing achievability, ambition, flexibility etc.)
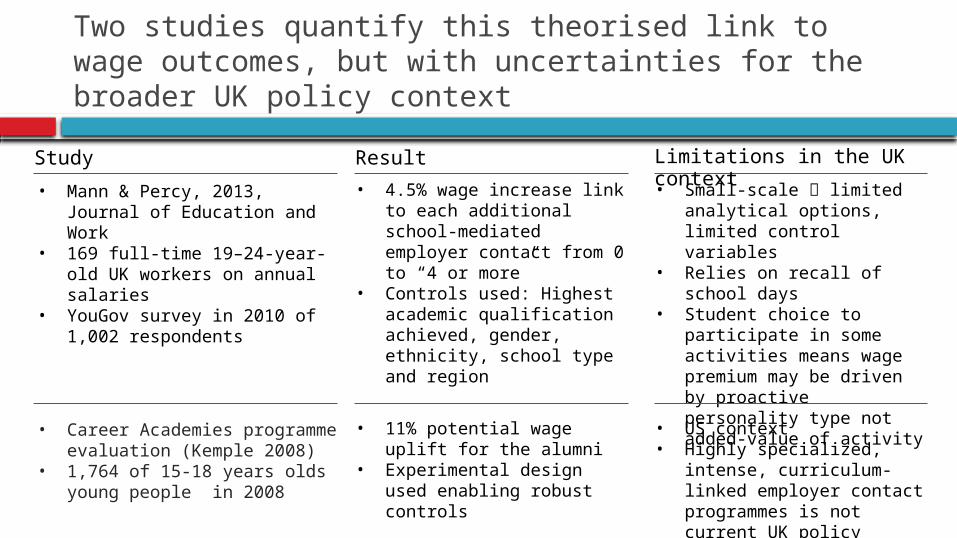
Two studies quantify this theorised link to wage outcomes, but with uncertainties for the broader UK policy context
Study
• Mann & Percy, 2013, Journal of Education and Work
• 169 full-time 19–24-year-old UK workers on annual salaries
• YouGov survey in 2010 of 1,002 respondents
Result
• 4.5% wage increase link to each additional school-mediated employer contact from 0 to “4 or more”
• Controls used: Highest academic qualification achieved, gender, ethnicity, school type and region
Limitations in the UK context• Small-scale limited
analytical options, limited control variables
• Relies on recall of school days
• Student choice to participate in some activities means wage premium may be driven by proactive personality type not added-value of activity
• Career Academies programme evaluation (Kemple 2008)
• 1,764 of 15-18 years olds young people in 2008
• 11% potential wage uplift for the alumni
• Experimental design used enabling robust controls
• US context • Highly specialized, intense,
curriculum-linked employer contact programmes is not current UK policy

The 1970 British Cohort Study provides a large, robust longitudinal dataset to explore pathways to labour market
Survey background
• Follows ~17,000 people born in England, Scotland and Wales in a single week of 1970
• Data is available at Birth, age 5, 10, 16, 26, 30, 34, 38 and 42 - most recent data from 2012
• We gather data for background variables at birth to age 16
• Survey attrition means ~48% loss of respondents from birth to age 26
Birth 5 10 16 26
16,571
12,981
14,350
11,206
8,654
Survey attrition rate
Longitudinal observed sample

Exploring Variables of Interest
Full-time weekly income in 1996 (age 26) [nominal £]
0 - 50 50 - 100
100 - 150
150 - 200
200 - 300
300 - 400
400 - 500
500 - 600
600 - 700
700 - 800
800+0
500
1000
1500
2000
2500
210
432
1232
19192066
544
13650 30 5 18
Weekly income at age 26
• Following Mann & Percy part-time wage earners were excluded (n=710) in order to identify a more internally comparable set of labour market participants
• Approximately 38% of full time employed individuals reported a weekly income between £200 and £300; Male earns more than female on average (£238 vs. £192 per week)
• Academic ability at age 16 is strongly associated with earning at age 26; the high achievers on average earn more. (on average 7%)
• Young people ‘s wage from more privileged families is higher than families with lower social classes ( on average 4.3%)

Career talks were the most common employer activity and afford the best opportunity to add to the UK research base
# Career talks with outside speakers aged 15-16
• 66% did at least one, with many doing two or more, allowing us to test the idea: “more is more”
• Typically held during school day, decided by school – less individual agency
None
1 2 3 4 5 6 plus
951 921
423
17991 70
190
# Work experience placements
• 33% participated but few did 2+. Limited variation is a restriction on detailed regression analysis
• Prior to policy decisions widening work experience participation, so individuals had more choice about participation
None 1 2 3 or more
4218
1832
173 56
Workplace visits with school
• Simplistic binary variable• BCS questions do not allow us
to unpack different types of visit, e.g. vocational course-linked, careers linked or research field trips, which could obscure the theorised link between employer contact and income
No Yes
4092
1842
Em
plo
yer
eng
ag
em
ent
act
ivit
ies
measu
red
in B
CS
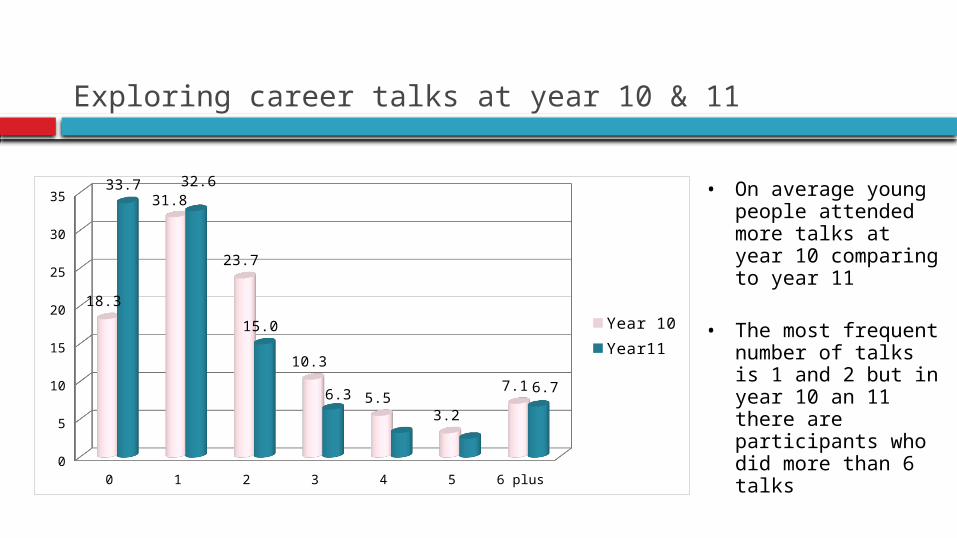
Exploring career talks at year 10 & 11
• On average young people attended more talks at year 10 comparing to year 11
• The most frequent number of talks is 1 and 2 but in year 10 an 11 there are participants who did more than 6 talks
0 1 2 3 4 5 6 plus0
5
10
15
20
25
30
35
18.3
31.8
23.7
10.3
5.53.2
7.1
33.7 32.6
15.0
6.3 6.7
Year 10Year11
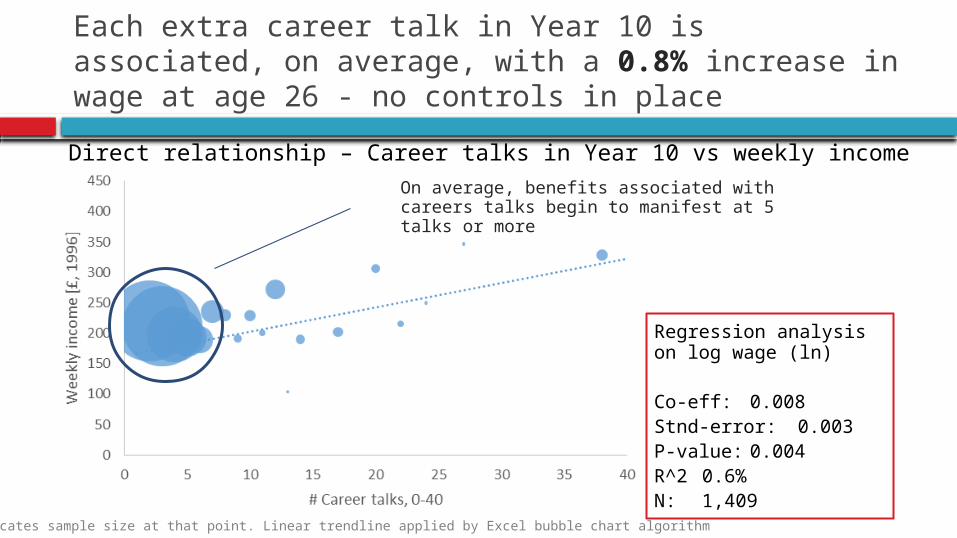
Each extra career talk in Year 10 is associated, on average, with a 0.8% increase in wage at age 26 - no controls in place
Direct relationship – Career talks in Year 10 vs weekly income age 26On average, benefits associated with careers talks begin to manifest at 5 talks or more
Regression analysis on log wage (ln)
Co-eff: 0.008Stnd-error:0.003P-value: 0.004R^2 0.6%N: 1,409Bubble size indicates sample size at that point. Linear trendline applied by Excel bubble chart algorithm
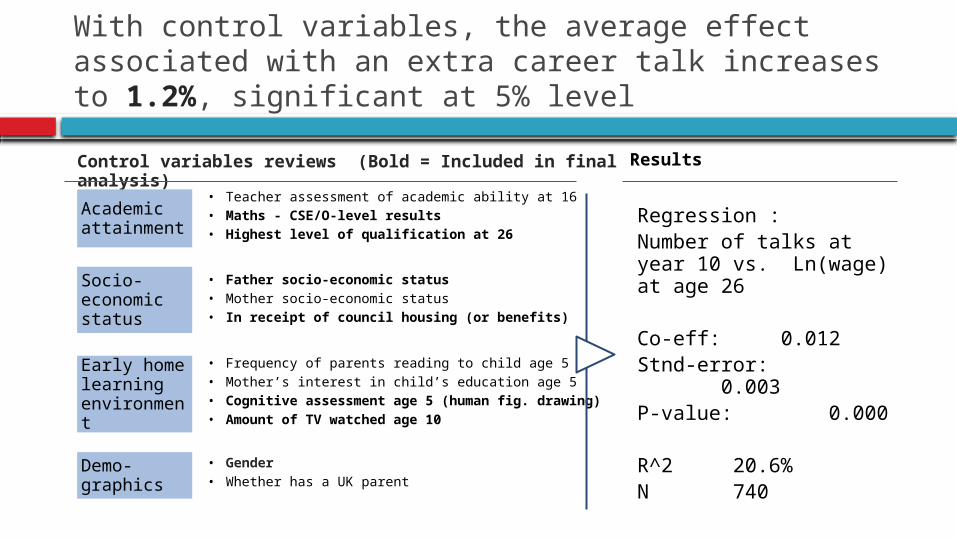
With control variables, the average effect associated with an extra career talk increases to 1.2%, significant at 5% level
Control variables reviews (Bold = Included in final analysis)
Results
Academic attainment
Socio-economic status
Early home learning environment
Demo-graphics
• Teacher assessment of academic ability at 16• Maths - CSE/O-level results• Highest level of qualification at 26
• Frequency of parents reading to child age 5• Mother’s interest in child’s education age 5• Cognitive assessment age 5 (human fig. drawing)• Amount of TV watched age 10
• Father socio-economic status• Mother socio-economic status• In receipt of council housing (or benefits)
• Gender• Whether has a UK parent
Regression : Number of talks at year 10 vs. Ln(wage) at age 26
Co-eff: 0.012Stnd-error: 0.003P-value: 0.000
R^2 20.6%N 740

At year 11, the direct relationship is still present at 0.3% on average, but much weaker and less statistically significant
Direct relationship – Career talks in Year 11 vs weekly income age 26
Regression: Analysis on log wage (ln)
Co-eff: 0.003Stnd-error: 0.002P-value: 0.145R^2 0.1%N: 2,854
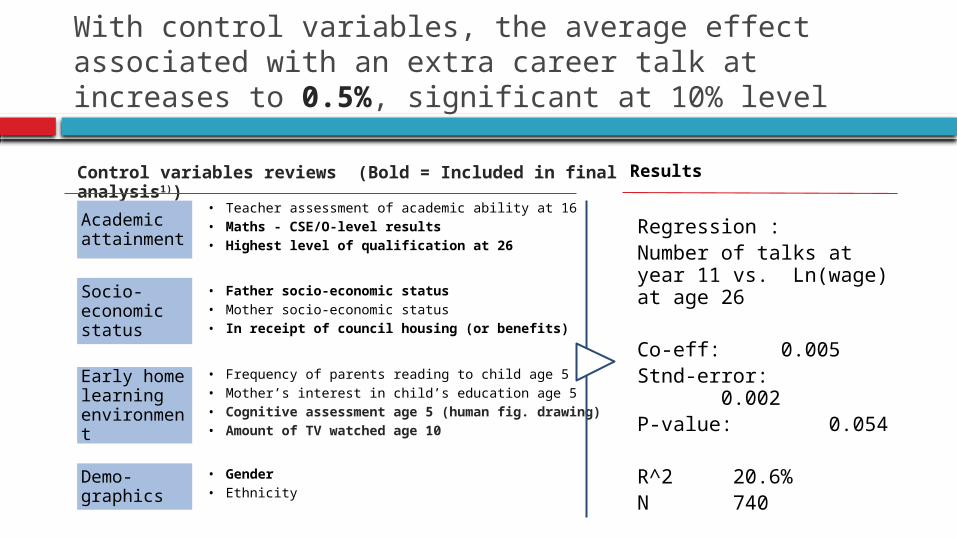
With control variables, the average effect associated with an extra career talk at increases to 0.5%, significant at 10% level
Control variables reviews (Bold = Included in final analysis1))
Results
Academic attainment
Socio-economic status
Early home learning environment
Demo-graphics
• Teacher assessment of academic ability at 16• Maths - CSE/O-level results• Highest level of qualification at 26
• Frequency of parents reading to child age 5• Mother’s interest in child’s education age 5• Cognitive assessment age 5 (human fig. drawing)• Amount of TV watched age 10
• Father socio-economic status• Mother socio-economic status• In receipt of council housing (or benefits)
• Gender• Ethnicity
Regression : Number of talks at year 11 vs. Ln(wage) at age 26
Co-eff: 0.005Stnd-error: 0.002P-value: 0.054
R^2 20.6%N 740

Individuals who found the career talks very useful display a stronger wage premium, but sample sizes are small
Did you find the careers talks useful?Regression output, Co eff 1)
Not helpful at all
Not very helpful
Quite helpful
Very helpful
0
200
400
600
800
1000
1200
1400
1600
79
446
1521
598
ModelDid not find helpful
Found very helpful
Yr 10 – No controls 1.7%** N = 144
1.1% *N = 231
Yr 10 – With Controls 1.0% N = 85
1.5%** N = 117
Yr 11 – No controls 0.4% N = 423
0.6% N=501
Yr 11 – With Controls 0.3% N = 234
1.1% **N=243
1) If we include Quite Helpful alongside Very Helpful answers as positive experiences, the slight difference between the two cohorts shown in this table disappears. Both analyses are indicative only due to the small sample sizes. * significant at 10% and ** significant at 5%

Concluding remarks
We used the large-scale, British longitudinal dataset (BCS70) to explore whether careers talks with outside speakers in the mid 1980s have a positive association with the wages of full-time employees in 1996
We found a strong association between the number of career talks and wage premium. Results are statistically significant at the 5% or 10% level
Earlier is better, with a 1.2% wage premium for each talk in Year 10 vs 0.5% for each talk in Year 11
Analysis of the direct relationship suggests that the beneficial association begins to manifest from around 5 or more career talks on average. This may relate to the general need for repetition in education for learning and attitudinal shift or the need to hear about several pathways before one happens to gel

Concluding remarks
Individuals who found the career talks ‘very helpful‘ overall were more likely to earn more than those who did not find them useful, given the decreased sample size
Comparison with the literature adds weight to the intepretation via social capital and via weak ties, in particular the value of trusted, non-redundant information that can be obtained through multiple, diverse channels, even in brief encounters: If done right, a lot of a little can make a big difference.
Given how careers talks with outside speakers, particularly in significant numbers, are coordinated within schools, our findings are likely to reflect the influence of talks taking place in the context of overall school-based and professional careers provision.
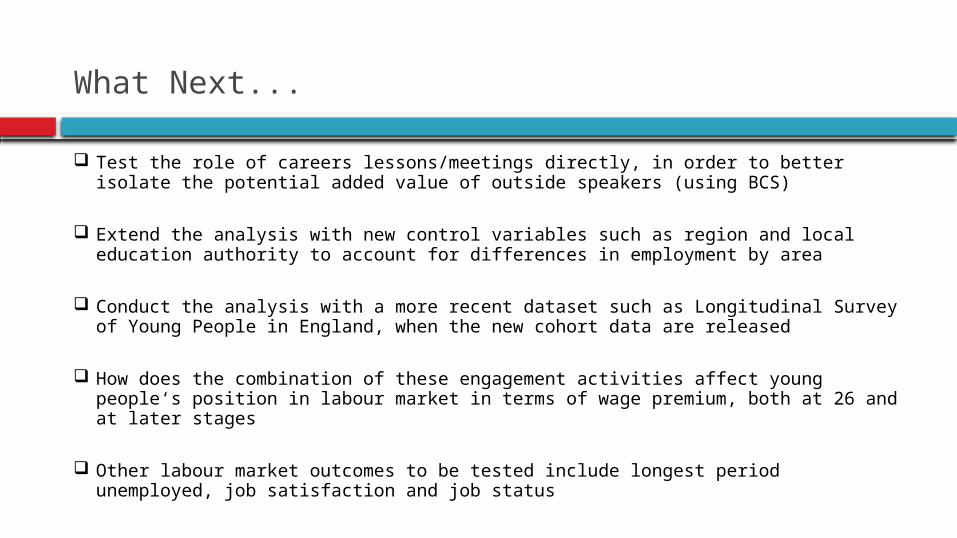
What Next...
Test the role of careers lessons/meetings directly, in order to better isolate the potential added value of outside speakers (using BCS)
Extend the analysis with new control variables such as region and local education authority to account for differences in employment by area
Conduct the analysis with a more recent dataset such as Longitudinal Survey of Young People in England, when the new cohort data are released
How does the combination of these engagement activities affect young people‘s position in labour market in terms of wage premium, both at 26 and at later stages
Other labour market outcomes to be tested include longest period unemployed, job satisfaction and job status

We welcome your comments and suggestions

• Control variables descriptive
Appendix

Control variable descriptive
Score Percentage
O level A 11
O level B 14.6
O level C/ CSE 1 22
O level D/ CSE 2 15.5
O level E/ CSE 3 17.7
CSE 4 12.8
CSE 5 5.8
Fail 0.5
Academic ability assessed by teacher at 16 Standardised Math Score age 16
Assessment Percentage
Top 5% 4.8
Well above average
12.7
Above average 26.9
Average 34.6
Bellow average 13.5
Well below average
5.4
Bottom 5% 1.7
*N=3716 *N=5428

Control variable descriptive
Score Percentage
I 7.6
II 28
III non-manual 9.7
III manual 38.1
IV 8.8
V 2.3
Student 2
Dead 3.5
Highest level of qualification at age 26
Father social class
*N=6735
No Qualification
CSE 2-5/NVQ1
O Level/NVQ2
A Level/NVQ3
Higher Qual/NVQ4
Degree +/NVQ5 OR 6
0 5 10 15 20 25 30 35 40 45
6
17
41
11
4
21
Percent...*N=8399
Control variable descriptive
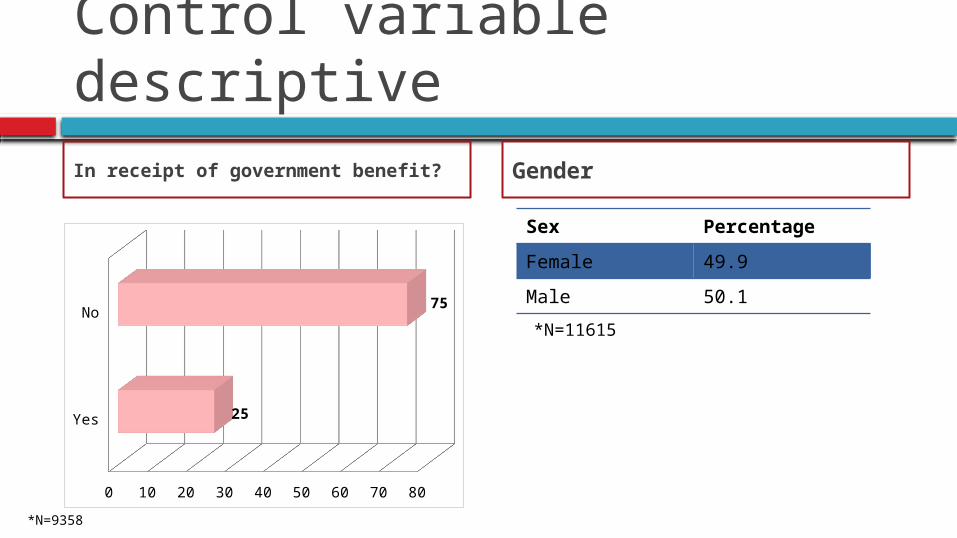
Sex Percentage
Female 49.9
Male 50.1
In receipt of government benefit?
Gender
*N=11615
Yes
No
0 10 20 30 40 50 60 70 80
25
75
*N=9358