looking back and thinking ahead - cuna councils€¢ high spread at origination (sato) • servicer...
TRANSCRIPT

Ryan W. Hayhurst - Managing Director, Financial Strategies Group [email protected]
Looking Back and Thinking Ahead:Managing Through The Turn In Rates
22nd Annual CUNA CFO Council Conference
May 17th, 2016

Interest Rate Risk Remains a Top Priority for NCUA in 2016
2

NCUA Adding “S” to CAMEL Rating(“S” = Sensitivity to Market Risk, aka IRR)
3

Net Interest Change: All IRRM Clients Net Interest Change - All Institutions on The Baker Group’s Interest Rate Risk Monitor (550)
• Average Net Interest Change for all IRRM Clients:o Unchanged Rates = 0.09%o +300bps = 2.37%o Non-Parallel (+400/+100bps) = 2.31%
• Note: For non-parallel simulations, cash flow prepays are driven by long-end shift
Average -0.09%Median -0.05%
Max 10.50%Min -10.44%
StDev 1.87%
Average 2.37%Median 1.80%
Max 21.90%Min -10.07%
StDev 4.52%
4

Despite Limited IRR, Some Institutions Still Falling Short on Exams
Common IRR Examination Findings to FDIC & NCUA
• Insufficient evidence of board and senior management discussion of IRR
• Policy limits unrealistic or uninformed• Use of default (not bank-specific) model assumptions• Inadequate documentation or support of assumptions• Lack of (assumption) sensitivity testing• Lack of 300bp or 400bp interest rate shock scenarios• Lack of nonparallel yield curve shift scenarios• Lack of backtesting or backtesting over an insufficient period of
time (3 mo. Vs. 12 mo.)• Need for regular independent reviews• Independent reviews do not cover all required areas• Lack of independent review expertise• Outdated or missing Model Validation
5

6
A significant rise in NMS funding raises potential IRR and liquidity concerns if those funds migrate to higher cost sources (e.g. certificates) or disintermediate as rates rise. Regulators want credit unions to simulate a “migration” of NMS to assess the impact on IRR and liquidity. Management should understand the potential impact of this migration to better prepare for the next rate cycle.

Estimating NMS Betas Using Call Report DataCan be easily generated for any credit union - call to request
7

Sensitivity Testing: Non-Maturity DepositsWhatever Baseline Assumptions You Use, Stress Test Them
“Institutions should incorporate “stressed” assumptions for non-maturity deposits in IRR models” …FFIEC
• Three Ways to Stress NMS Assumptions (Sensitivity Tests)1. Ratchet up pricing betas (shift sensitivities) and reduce time
lags in order to mimic an aggressively competitive environment for NMD
2. Reduce Average Life (and Duration) Assumptions in order to assess the EVE impact of lower duration liabilities
3. Simulate a “migration” of NMS balances into more rate sensitive funding (time deposits or wholesale funding)… considered to be the most realistic depiction of what may happen in the next rate cycle
8
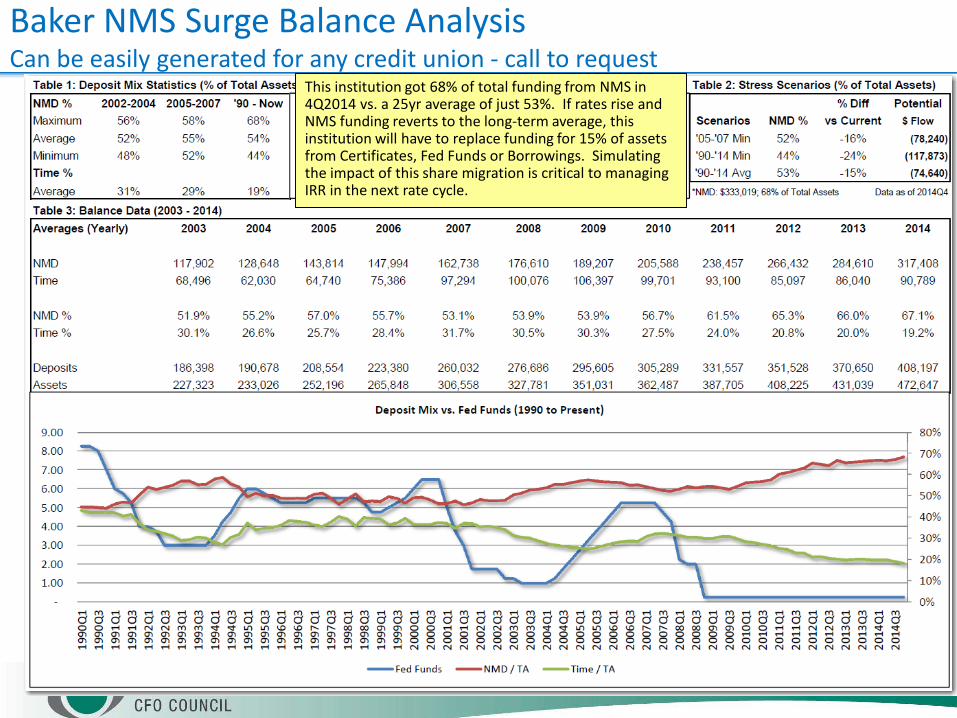
Baker NMS Surge Balance AnalysisCan be easily generated for any credit union - call to request
9
This institution got 68% of total funding from NMS in 4Q2014 vs. a 25yr average of just 53%. If rates rise and NMS funding reverts to the long-term average, this institution will have to replace funding for 15% of assets from Certificates, Fed Funds or Borrowings. Simulating the impact of this share migration is critical to managing IRR in the next rate cycle.

NMS Migration Case Study
• This institution decided to simulate the impact of NMS funding returning to the 25 year average
• They ran two simulations showing 15% of total assets migrating out of NMS and into higher cost, more rate sensitive liabilities
• For Earnings at Risk simulation, migration occurred over 12 months. For NEV simulation, migration occurred immediately.
Simulation # 1All funds into overnight borrowings at 0.25%
Simulation # 245% into FHLB 1yr Advances @ 0.60%33% into FHLB 2yr Advances @ 1.05%22% into FHLB 3yr Advances @ 1.40%
10

NMS Migration Case Study: Earnings at Risk Impact
11
Simulation # 1 (Overnight Borrowings)
Simulation # 2 (FHLB Laddered Funding)

Liquidity Risk Management: Then and Now
12
2016

Complying with Regulatory Expectations for Liquidity
2010 Interagency Policy Statement on Funding and Liquidity Risk Management
• Investment Price Risk Limits
• Sources & Uses Reporting
• Stress Testing
• Contingency Funding Plans
• Cushion of Highly Liquid, Unencumbered Assetso High grade credit qualityo Easily converted into cash – marketable
• US Government, Agency (including MBS), or high-grade municipals• Stable and predictable cash flows
o Security selection is criticalo Beware of too much negative convexity (options risk)
13

Callable Agency FocusMay 2013
Projected Cashflow Volatility Comparison: Callables vs MBS
Callable Agency FocusJune 2013
MBS/CMO FocusMay 2013
MBS/CMO FocusJune 2013 14

Five Possible Liquidity Risks from Rising Rates
1. Reduced Mortgage Payments Refinance incentive goes away
2. Reduced Share/Deposit Levels Migration / Disintermediation
3. Increased Loan Demand Local economic activity improves
4. Options Risk (Callable Bonds and MBS/CMOs) Call Options no longer “in-the-money”
5. Reduced Asset Valuations Can no longer painlessly liquidate securities / monetize loans
6. Reduced Borrowing Capacity (Can be related to #5) Increased haircuts / requirements for REPO lines, etc.
15
16

17
Large Deposits
Large Deposit Outflow
Investment cash flows drop, callables and MBS extend
Stress: Rates +200bp, 5% new deposits, 10% NMD runoff, 10% new loans, 90% CD/Loan renewal

18
19
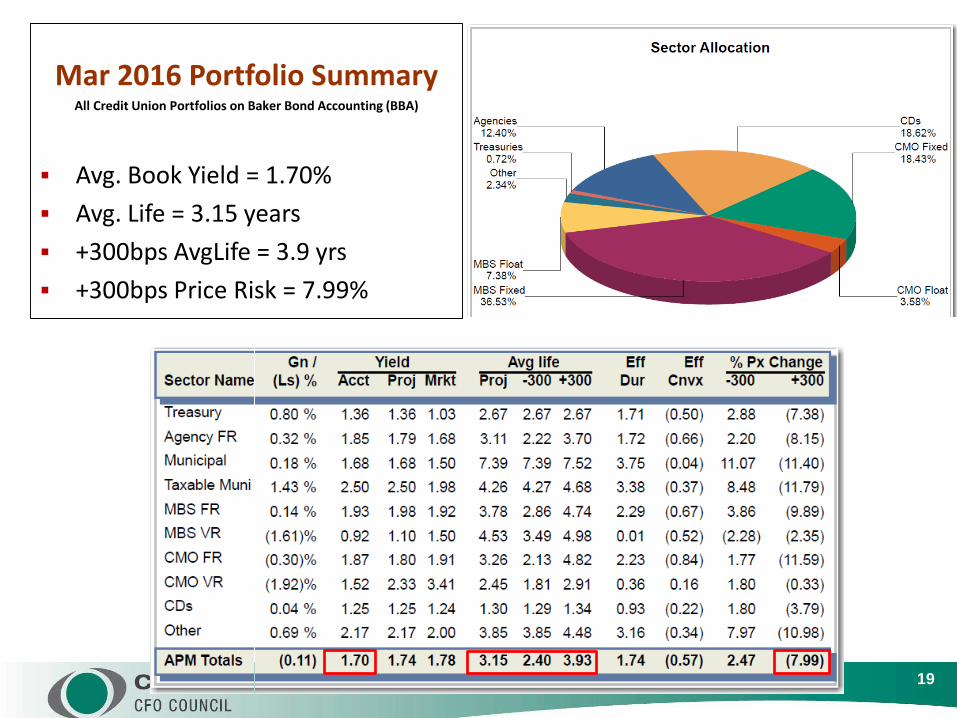
Mar 2016 Portfolio SummaryAll Credit Union Portfolios on Baker Bond Accounting (BBA)
Avg. Book Yield = 1.70% Avg. Life = 3.15 years +300bps AvgLife = 3.9 yrs +300bps Price Risk = 7.99%

Investment Portfolio Management:Characteristics of High Performance
• Use The Investment Portfolio To Fight Margin Erosion– The bond portfolio is the only place we can increase margin without hurting the membership
• Define, Measure & Manage– Define your portfolio objectives & risk tolerance– Measure your risk exposure – quality analytics and easy to understand reporting is essential!– Manage your risk – actively manage the portfolio in the context of the entire balance sheet
• Develop a Written Investment Strategy– Build a portfolio, don’t be sold one– Be proactive, not reactive with a disciplined investment strategy
• Diversify The Portfolio Across Sectors and Within Sectors– Each sector has its pros & cons, diversity protects against a range of interest rate scenarios
• Minimize Cash/CD’s in Favor of Bonds (esp. MBS/CMO)– High performance portfolios tend to own less Cash/CDs/Agencies, more MBS/CMO– Bottom quartile portfolios tend to own a lot of Cash/CDs/Agencies
• Build a Portfolio of Stable, Predictable Cash Flow– Steady, consistent cash flow is the best natural hedge against rising rates– Overreliance on volatile cash flows (e.g. callable agencies) will force you to reinvest too much cash
flow when rates are low and not enough when rates are high
20

Portfolio Transition: Short CD’s => Diversified Cash Flow Ladder
21
Many credit unions start with a short ladder of CD’s. This case study institution had a 1.37% yield in 2012. Had they maintained this ladder, their yield today would be about 0.85%.+300bp price volatility = 5%
Instead, this institution wrote an investment strategy and built a diversified portfolio of stable cash flow. Their yield today is 1.59% which is nearly twice as much portfolio income as they would have had with the previous strategy. +300bp price voaltility = 7%

NCUA: Manage Investment Portfolio Price Volatility
22

23
During the 2013 market selloff, Municipals had the greatest amount of price depreciation while CMOs had the least. From peak to trough, Munis fell about 8%, Agencies fell 4.5%, MBS fell 3.75% and CMOs fell about 1.5%

24
10yr Amortization MBS offer a good shorter duration, fixed rate option for the short end of a cash flow barbell. The characteristics of the 10yr borrower normally produces an MBS with more stable cash flow, minimal prepayment risk and limited extension risk. Lower coupons, less “seasoned” pools and higher average loans sizes are acceptable and should still produce a stable cash flow profile.
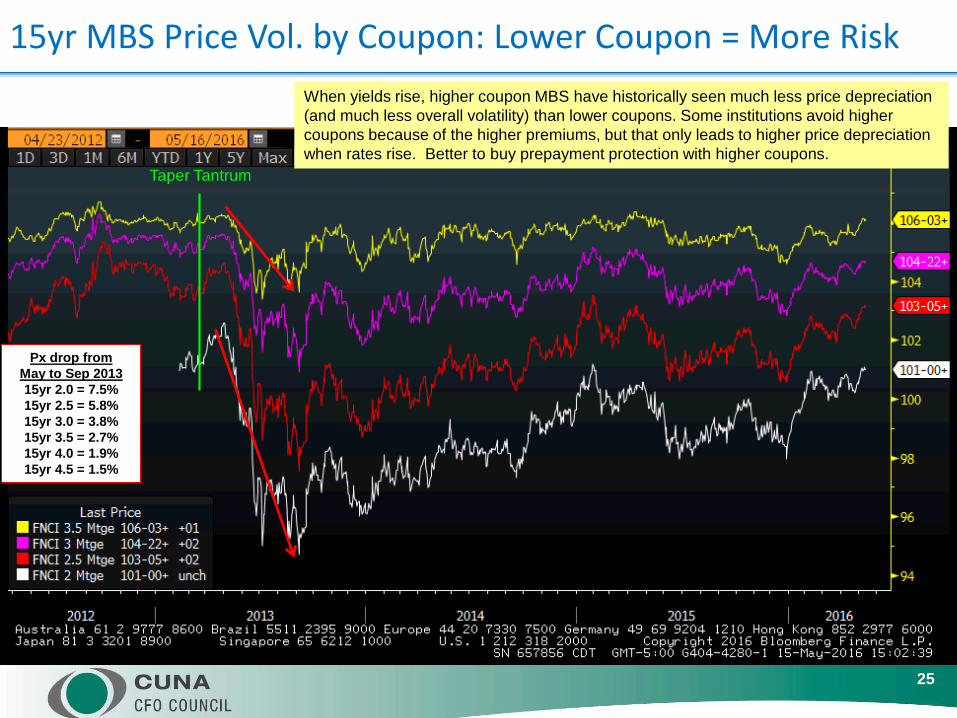
15yr MBS Price Vol. by Coupon: Lower Coupon = More Risk
25
Px drop fromMay to Sep 201315yr 2.0 = 7.5%15yr 2.5 = 5.8%15yr 3.0 = 3.8%15yr 3.5 = 2.7%15yr 4.0 = 1.9%15yr 4.5 = 1.5%
When yields rise, higher coupon MBS have historically seen much less price depreciation (and much less overall volatility) than lower coupons. Some institutions avoid higher coupons because of the higher premiums, but that only leads to higher price depreciation when rates rise. Better to buy prepayment protection with higher coupons.
Taper Tantrum

Prepayment Protection AttributesAll of these loan characteristics reduce the risk of prepayment spikes
• Short Amortization• Low Loan Balance• Investor/Vacation Properties (NOO)• High LTV HARP Loans (> 95 LTV)• Retail Origination Channel (not Third Party, aka TPO) • Purchase % (vs. Refi %)• Geographic Concentration – NY, TX• High Spread at Origination (SATO)• Servicer (avoid Quicken, focus on big banks)• GNMA (higher LTV, lower FICO limits refi potential)
26

Loan Balance is Biggest Influence on Prepayment Volatility
27
When rates fall and homeowners refinance their mortgages, the size of the loan is the single biggest determinant of how quickly and how often refinancings occur. The chart above shows the historical 1mo CPR of FNMA 30yr 4% MBS issued in 2010. The blue line is the average of all those type of MBS, the grey line is only the jumbo loans and the red line is only those loans < $85,000. Clearly LLB MBS have the least prepayment volatility.
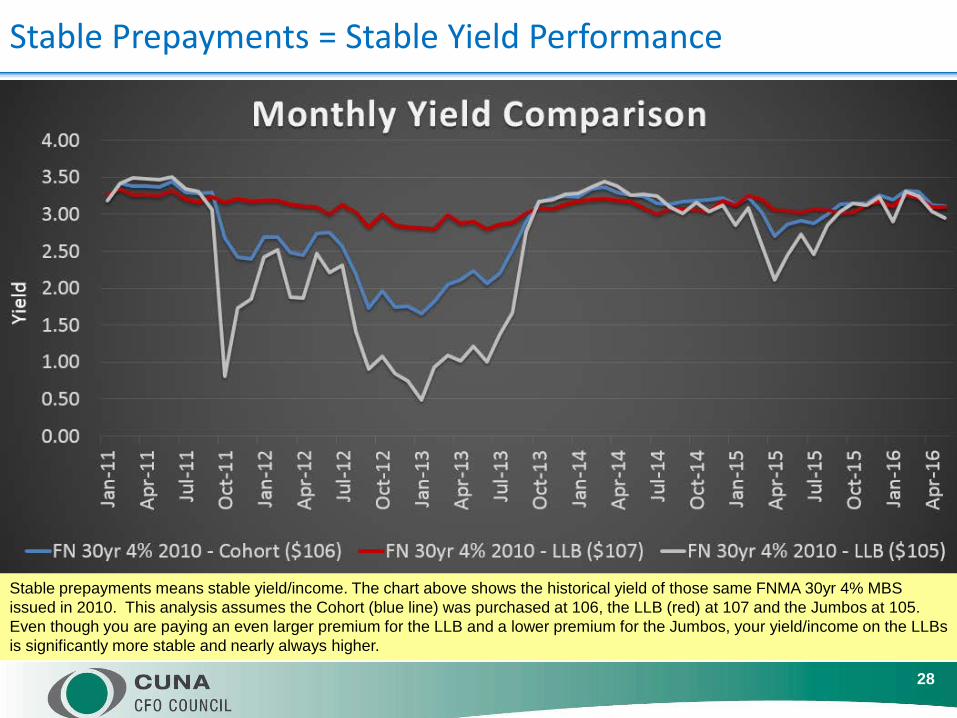
Stable Prepayments = Stable Yield Performance
28
Stable prepayments means stable yield/income. The chart above shows the historical yield of those same FNMA 30yr 4% MBS issued in 2010. This analysis assumes the Cohort (blue line) was purchased at 106, the LLB (red) at 107 and the Jumbos at 105. Even though you are paying an even larger premium for the LLB and a lower premium for the Jumbos, your yield/income on the LLBs is significantly more stable and nearly always higher.

Loans Serviced By Quicken Experience Significant Call Risk
29

30
CMOs offer many more options than “pass-through” MBS. In this case, a low coupon CMO was created from higher coupon MBS. The result is an investment with a lower premium (100-25) than the underlying collateral would have (107-24). This CMO also has a shorter average life (3.7yrs vs. 5.5yrs) than the underlying collateral and less extension risk (0.8yrs vs. 4.2yrs). The result is a low premium investment, with good yield spread, stable cashflows and limited price depreciation.
High WAC, Low Coupon CMO

Flatter Yield Curve Makes ARMs More Attractive
31
A flatter yield curve makes ARMs a more attractive option today than in prior years. The 1-year part of the curve (where many ARMs are indexed) has risen 40bp+ since 2013 while the 5-10yr part of the curve (where many fixed MBS are priced) has fallen 40-120bp. This combined with tighter spreads has significantly reduced the “yield give-up” for buying ARMs over Fixed Rate MBS.

1Yr CMT & 1Yr LIBOR Have Both Jumped in Recent Years
32
1Yr LIBOR
1Yr CMT
1-Year LIBOR has doubled since 2014 and 1-Year CMT is up 5 fold! LIBOR is consistently higher than CMT and has more “stickiness” during rate rallies. Rising short-term rates, a flatter yield curve and tight mortgage spreads make ARMs an attractive alternative to 10yr and Seasoned 15yr fixed rate MBS

33
FN/FH Annual ARMs based on 1Yr LIBOR or 1yr CMT offer better yields than several months ago and provide a decent option if an institution needs true rate sensitivity. Premium are higher than on lower coupon Hybrids and prepayment volatility creates the potential for yield volatility, but well seasoned pools provide reasonable stability and depreciation potential is limited.
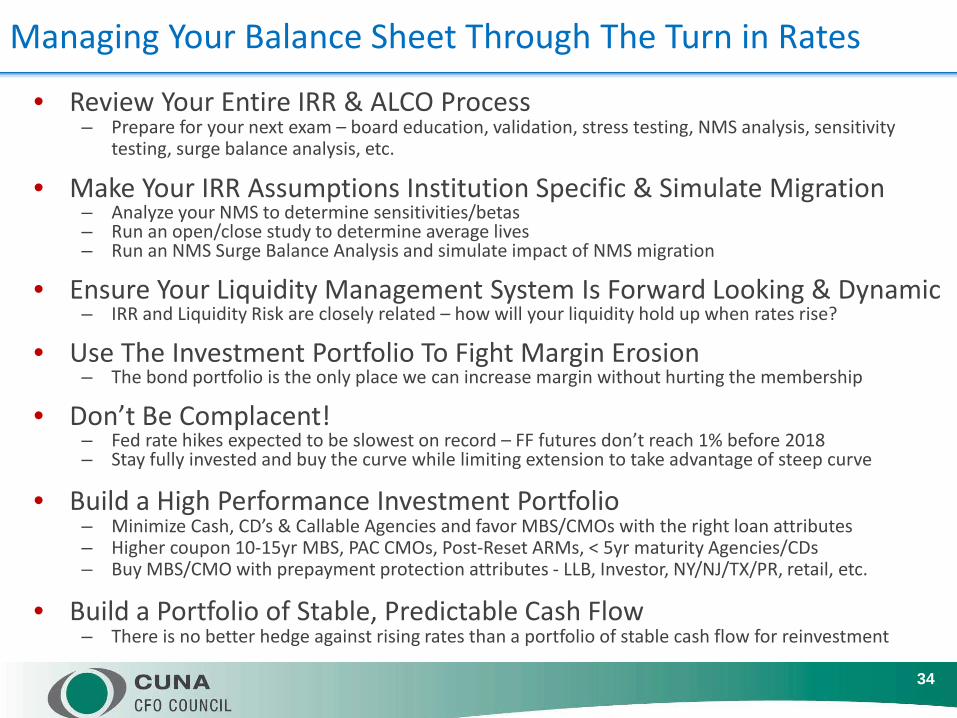
Managing Your Balance Sheet Through The Turn in Rates
34
• Review Your Entire IRR & ALCO Process– Prepare for your next exam – board education, validation, stress testing, NMS analysis, sensitivity
testing, surge balance analysis, etc.
• Make Your IRR Assumptions Institution Specific & Simulate Migration– Analyze your NMS to determine sensitivities/betas– Run an open/close study to determine average lives– Run an NMS Surge Balance Analysis and simulate impact of NMS migration
• Ensure Your Liquidity Management System Is Forward Looking & Dynamic– IRR and Liquidity Risk are closely related – how will your liquidity hold up when rates rise?
• Use The Investment Portfolio To Fight Margin Erosion– The bond portfolio is the only place we can increase margin without hurting the membership
• Don’t Be Complacent!– Fed rate hikes expected to be slowest on record – FF futures don’t reach 1% before 2018– Stay fully invested and buy the curve while limiting extension to take advantage of steep curve
• Build a High Performance Investment Portfolio– Minimize Cash, CD’s & Callable Agencies and favor MBS/CMOs with the right loan attributes– Higher coupon 10-15yr MBS, PAC CMOs, Post-Reset ARMs, < 5yr maturity Agencies/CDs– Buy MBS/CMO with prepayment protection attributes - LLB, Investor, NY/NJ/TX/PR, retail, etc.
• Build a Portfolio of Stable, Predictable Cash Flow– There is no better hedge against rising rates than a portfolio of stable cash flow for reinvestment