looking at data: relationships scatterplots ips chapter 2.1 © 2006 w. h. freeman and company
Post on 21-Dec-2015
213 views
TRANSCRIPT

Looking at data: relationships Scatterplots
IPS chapter 2.1
© 2006 W. H. Freeman and Company

Objectives (IPS chapter 2.1)
Scatterplots
Scatterplots
Explanatory and response variables
Interpreting scatterplots – form, direction and strength
Outliers
Categorical variables in scatterplots
Scatterplot smoothers

Student Beers Blood Alcohol
1 5 0.1
2 2 0.03
3 9 0.19
6 7 0.095
7 3 0.07
9 3 0.02
11 4 0.07
13 5 0.085
4 8 0.12
5 3 0.04
8 5 0.06
10 5 0.05
12 6 0.1
14 7 0.09
15 1 0.01
16 4 0.05
Here, we have two quantitative
variables for each of 16
students.
1) How many beers they
drank, and
2) Their blood alcohol level
(BAC)
We are interested in the
relationship between the two
variables: How is one affected
by changes in the other one?

Student Beers BAC
1 5 0.1
2 2 0.03
3 9 0.19
6 7 0.095
7 3 0.07
9 3 0.02
11 4 0.07
13 5 0.085
4 8 0.12
5 3 0.04
8 5 0.06
10 5 0.05
12 6 0.1
14 7 0.09
15 1 0.01
16 4 0.05
ScatterplotsIn a scatterplot, one axis is used to represent each of the variables,
and the data are plotted as points on the graph.
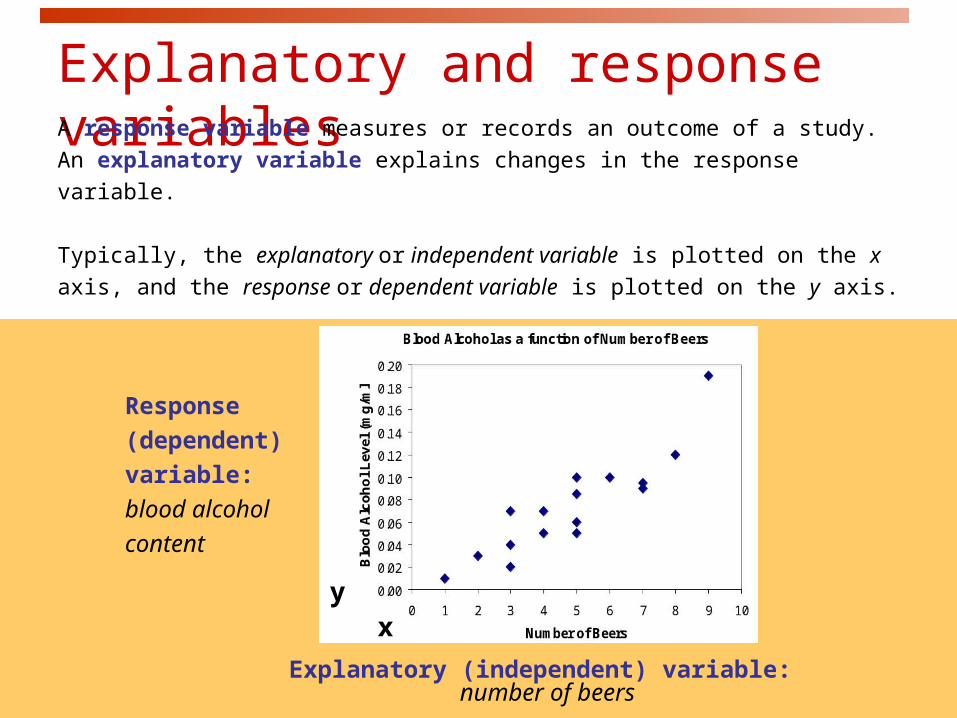
Explanatory (independent) variable: number of beers
Response
(dependent)
variable:
blood alcohol
content
xy
Explanatory and response variablesA response variable measures or records an outcome of a study. An
explanatory variable explains changes in the response variable.
Typically, the explanatory or independent variable is plotted on the x
axis, and the response or dependent variable is plotted on the y axis.

Some plots don’t have clear explanatory and response variables.
Do calories explain
sodium amounts?
Does percent return on Treasury
bills explain percent return
on common stocks?

Interpreting scatterplots
After plotting two variables on a scatterplot, we describe the
relationship by examining the form, direction, and strength of the
association. We look for an overall pattern …
Form: linear, curved, clusters, no pattern
Direction: positive, negative, no direction
Strength: how closely the points fit the “form”
… and deviations from that pattern.
Outliers

Form and direction of an association
Linear
Nonlinear
No relationship

Positive association: High values of one variable tend to occur together
with high values of the other variable.
Negative association: High values of one variable tend to occur together
with low values of the other variable.
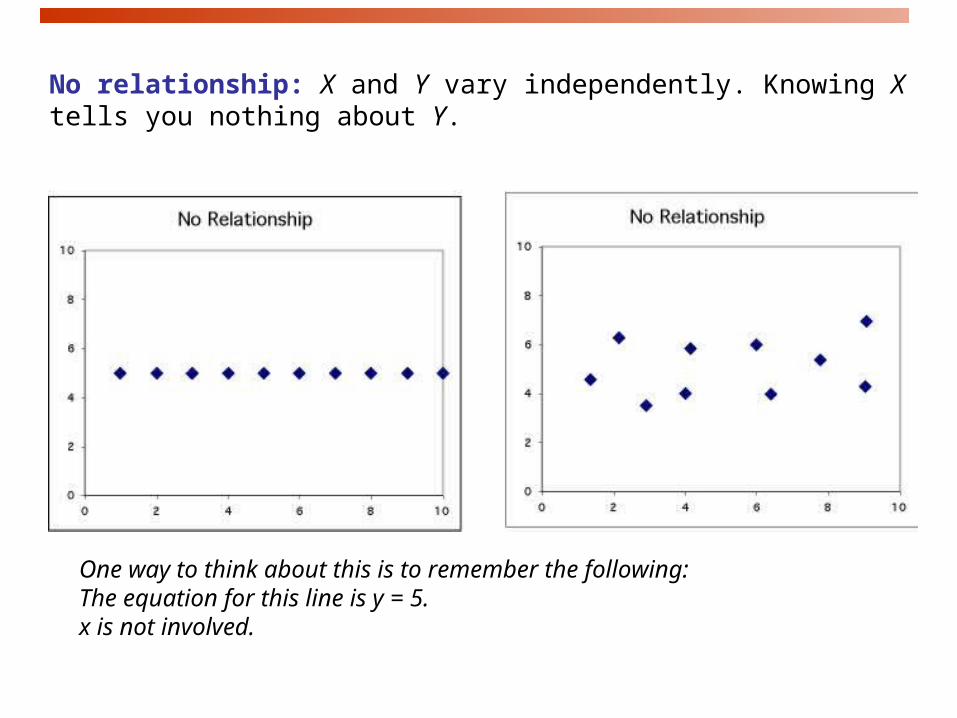
One way to think about this is to remember the following: The equation for this line is y = 5.x is not involved.
No relationship: X and Y vary independently. Knowing X tells you nothing about Y.

Strength of the association
The strength of the relationship between the two variables can be
seen by how much variation, or scatter, there is around the main form.
With a strong relationship, you can get a pretty good estimate
of y if you know x.
With a weak relationship, for any x you might get a wide range of
y values.

This is a very strong relationship.
The daily amount of gas consumed
can be predicted quite accurately for
a given temperature value.
This is a weak relationship. For a
particular state median household
income, you can’t predict the state
per capita income very well.

How to scale a scatterplot
Using an inappropriate scale for a scatterplot can give an incorrect impression.
Both variables should be given a similar amount of space:• Plot roughly square• Points should occupy all the plot space (no blank space)
Same data in all four plots
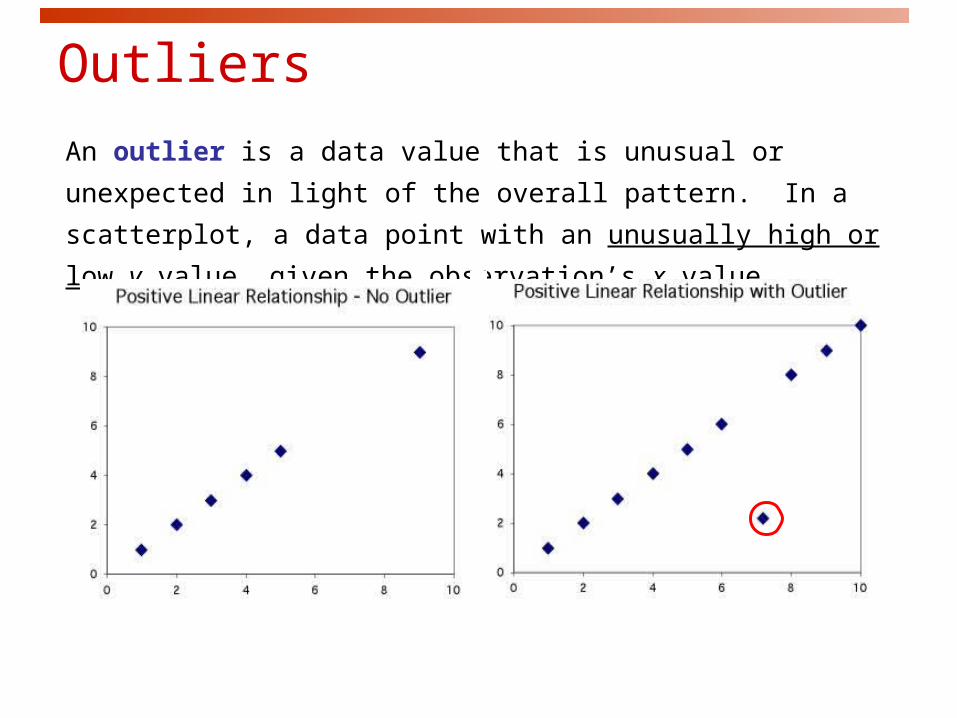
Outliers
An outlier is a data value that is unusual or unexpected in light of the
overall pattern. In a scatterplot, a data point with an unusually high or
low y value, given the observation’s x value.

Not an outlier:
The upper right-hand point here is
not an outlier of the relationship—It
is what you would expect for this
many beers given the linear
relationship between beers/weight
and blood alcohol.
This point is not in line with the
others, so it is an outlier of the
relationship.
Outliers
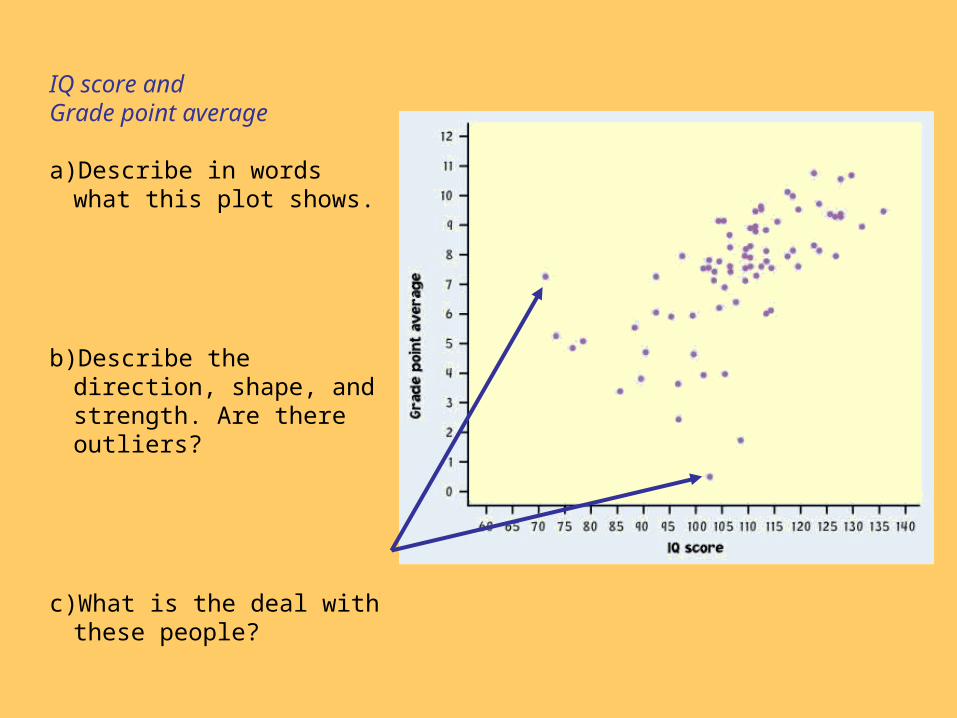
IQ score and Grade point average
a)Describe in words what this plot shows.
b)Describe the direction, shape, and strength. Are there outliers?
c) What is the deal with these people?

Categorical variables in scatterplotsOften, things are not simple and one-dimensional. We need to group
the data into categories to reveal trends.
What may look like a positive linear
relationship is in fact a series of
negative linear associations.
Plotting different habitats in different
colors allows us to make that
important distinction.
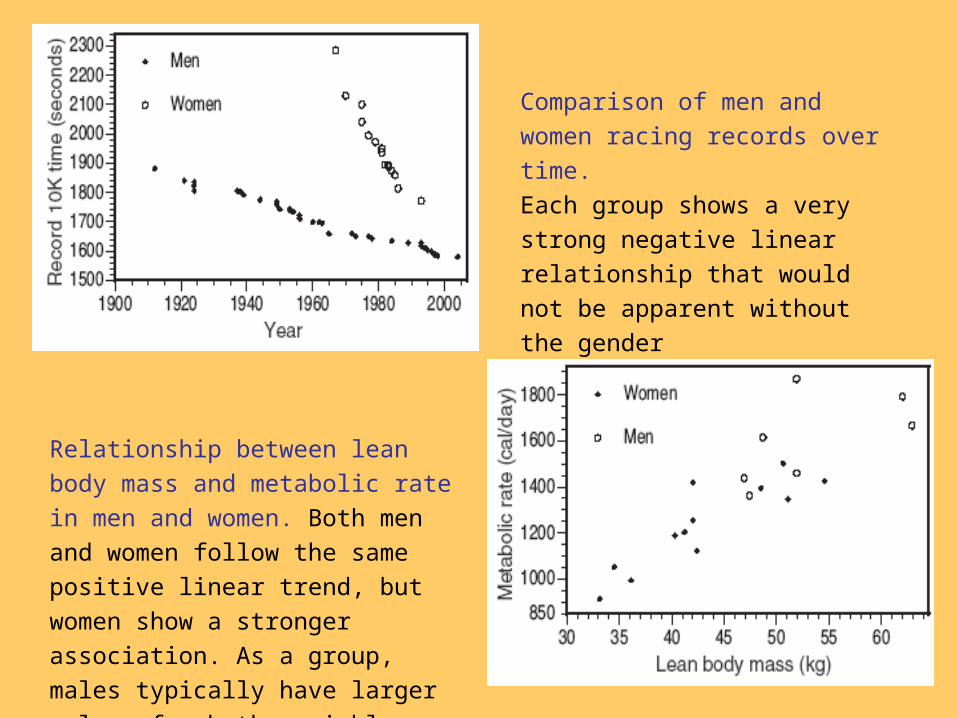
Comparison of men and women
racing records over time.
Each group shows a very strong
negative linear relationship that
would not be apparent without the
gender categorization.
Relationship between lean body mass
and metabolic rate in men and women.
Both men and women follow the same
positive linear trend, but women show a
stronger association. As a group, males
typically have larger values for both
variables.
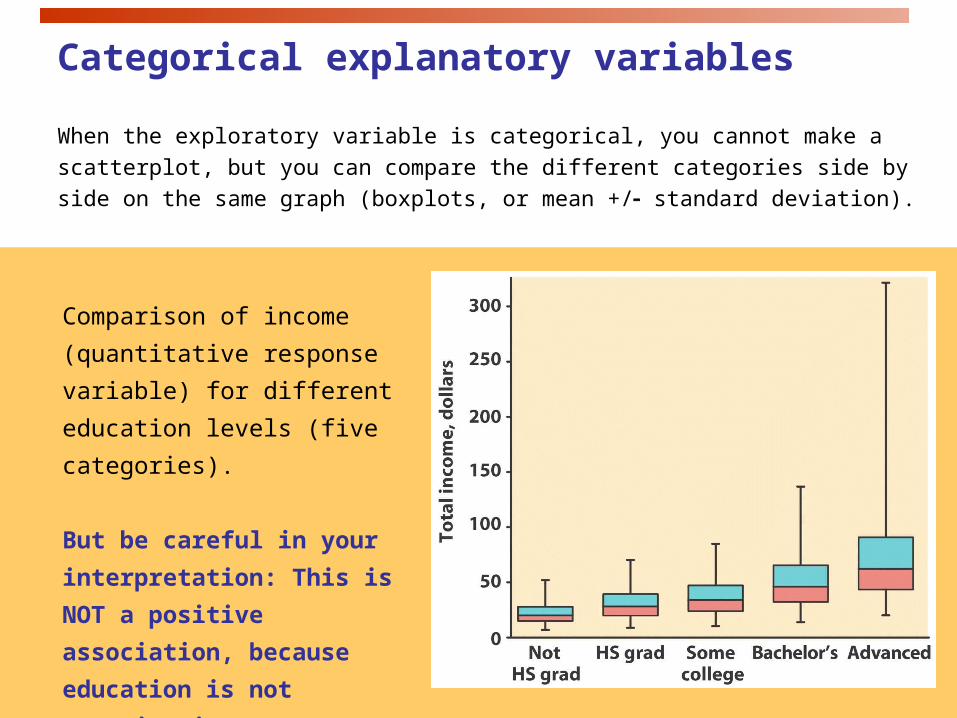
Categorical explanatory variables
When the exploratory variable is categorical, you cannot make a
scatterplot, but you can compare the different categories side by side on
the same graph (boxplots, or mean +/ standard deviation).
Comparison of income
(quantitative response variable)
for different education levels (five
categories).
But be careful in your
interpretation: This is NOT a
positive association, because
education is not quantitative.

Example: Beetles trapped on boards of different colorsBeetles were trapped on sticky boards scattered throughout a field. The sticky boards were of four different colors (categorical explanatory variable). The number of beetles trapped (response variable) is shown on the graph below.
Blue White Green Yellow Board color
Blue Green White Yellow Board color
Describe one category at a time.
?
When both variables are quantitative, the order of the data points is defined
entirely by their value. This is not true for categorical data.
What association? What relationship?