looking at data: relationships - correlation ips chapter 2.2 copyright brigitte baldi 2005 ©
Post on 19-Dec-2015
215 views
TRANSCRIPT

Looking at data: relationships
- Correlation
IPS chapter 2.2
Copyright Brigitte Baldi 2005 ©

Objectives (BPS chapter 2.2)
Correlation
The correlation coefficient r
r does not distinguish x and y
r has no units
r ranges from 1 to +1
r measures strength of linear relationships
Influential points

The correlation coefficient is a measure of the direction and strength of a
relationship. It is calculated using the mean and the standard deviation
of both the x and y variables.
The correlation coefficient r
Correlation can only be used to describe quantitative variables. Categorical variables don’t have means and standard deviations.
Time to swim: x = 35, sx = 0.7
Pulse rate: y = 140 sy = 9.5

Part of the calculation involves finding z, the standardized score we used when working with the normal distribution.
You DON'T want to do this by hand. Make sure you learn how to use your calculator!

Standardization:Allows us to compare correlations between data sets where variables are measured in different units or when variables are different.
For instance, we might want to compare the correlation between [swim time and pulse], with the correlation between [swim time and breathing rate].

Correlation does not distinguish x and y
The correlation coefficient r treats x and y symmetrically.
"Time to swim" is the explanatory variable here, and belongs on the x axis. However, in either plot r is the same (r=-0.75).
r = -0.75 r = -0.75

Changing the units of variables does not change the correlation coefficient r, because we get rid of all our unitswhen we standardize (get z-scores).
Correlation has no unitsr = -0.75
r = -0.75
z-score plot is the same for both plots

Correlation ranges from −1 to +1
r quantifies the strength and direction of a linear relationship between two quantitative variables.
Strength: how closely the points follow a straight line.
Direction: is positive when individuals with higher x values tend to have higher values of y.
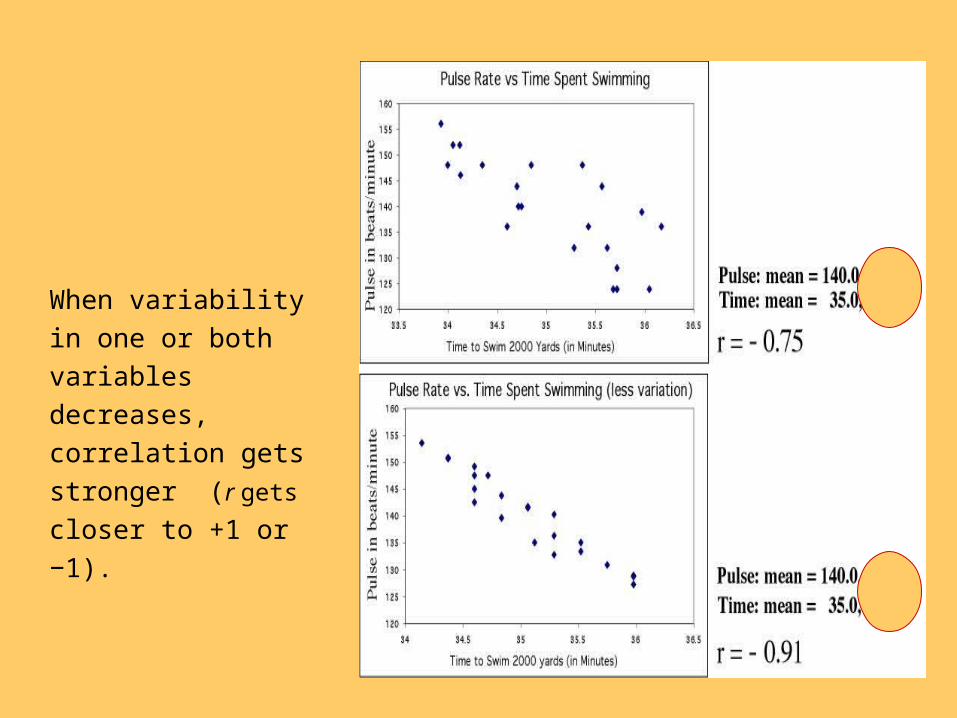
When variability in one
or both variables
decreases, correlation
gets stronger (r gets
closer to +1 or −1).

No matter how strong the association, r does not describe curved relationships.
Note: You can sometimes transform a non-linear association to a linear form, for instance by taking the logarithm. You can then calculate a correlation using the transformed data.
Correlation only describes linear relationships

Correlations are calculated using
means and standard deviations,
and thus are NOT resistant to
outliers.
Influential points
Just moving one point away from the
general trend here decreases the
correlation from −0.91 to −0.75
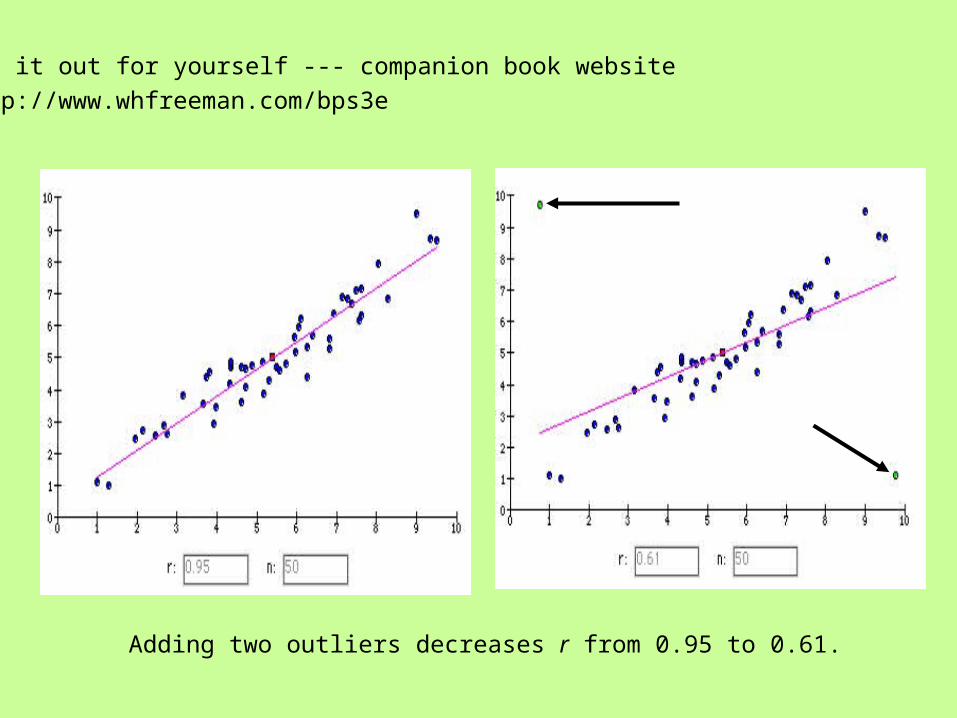
Adding two outliers decreases r from 0.95 to 0.61.
Try it out for yourself --- companion book website
http://www.whfreeman.com/bps3e

1) What is the explanatory variable?
Describe the form, direction and strength
of the relationship?
Estimate r.
(in 1000’s)
2) If women always marry men 2 years older
than themselves, what is the correlation of the
ages between husband and wife?
Review examples
ageman = agewoman + 2
equation for a straight line
r = 1
r = 0.94

Thought quiz on correlation
1. Why is there no distinction between explanatory and response
variable in correlation?
2. Why do both variables have to be quantitative?
3. How does changing the units of one variable affect a correlation?
4. What is the effect of outliers on
correlations?
5. Why doesn’t a tight fit to a horizontal line
imply a strong correlation?