lookers plc unaudited results for the six months …/media/files/l/lookers/lookers rns final...
TRANSCRIPT
17 August 2016 LOOKERS plc
Unaudited Results for the six months ended 30 June 2016
RECORD RESULTS AND WELL POSITIONED FOR FURTHER GROWTH
Lookers plc, (“Lookers”, “the company” or “the group”), one of the leading UK motor retail and aftersales service groups, announces its results for the six months ended 30 June 2016.
Financial highlights:
Revenue increased 33% to £2.34 billion (2015: £1.75 billion)
*Operating profit increased 20% to £59.1 million (2015: £49.2 million)
*Adjusted profit before tax increased 16% to £50.1 million (2015: £43.1 million)
Profit before tax increased by 17% to £46.7 million (2015: £39.9 million)
Earnings per share up 17% at 9.44p (2015: 8.08p)
*Adjusted earnings per share up 16% at 10.3p (2015: 8.89p)
Increase in interim dividend of 20% to 1.28p per share (2015: 1.07p)
Net debt significantly reduced to £74.9 million (31 December 2015: £161.7 million) (*Adjusted operating profit is operating profit before amortisation of intangible assets and share based payments. Adjusted profit is profit before amortisation, debt issue costs, pension costs and share based payments)
Operational highlights:
Continued investment in customer experience - Improved website launched last year with further upgrades and functionality
imminent - 31% increase, year-on-year, in leads to the group’s website - Greater customer loyalty and retention in Motor Division
Motor Division portfolio performance enhanced via selective disposals of low profit dealerships and targeted acquisitions
Post period end events:
Proposed disposal of parts division for £120m announced 10th August – expected to complete by the end of October 2016
Conditional agreement to acquire Drayton Group for £55.4m announced on 15th August – expected to be earnings enhancing for the year ending 31 December 2017
Healthy order book for the delivery of new cars in September 2016
Strategy focused on the highest growth division of Lookers’ business Andy Bruce, Chief Executive of Lookers, said: “I am pleased to announce an excellent set of results for the first half of the year. We have worked hard at pursuing the strategic priorities for the business which we laid out in March; having the right brands and locations alongside excellent execution. Through careful portfolio management and a focus on delivering the best service for our customers, our motor division has continued to grow strongly and has delivered record results. The parts division has also performed well.
“Since the period end, we have also announced the conditional sale of the group’s parts division, an attractive offer which we believe allows us to concentrate on what we do best; focusing on our motor division to buy and sell cars, and add value through acquisitions. The sale of the parts division is a great opportunity to shift our strategy and to focus on the higher growth division of the business. We are delighted to have already announced the acquisition of Drayton Motor Group, which we believe fits our acquisition criteria of selecting excellent businesses which will be of strong financial and cultural benefit to the group.”
If you would like to attend the analyst briefing today at 9.30am please contact: [email protected] Enquiries: Lookers Today: 020 3772 2500 Andy Bruce, Chief Executive Thereafter: 0161 291 0043 Robin Gregson, Finance Director Bell Pottinger Tel: 020 3772 2500 Victoria Geoghegan Nick Lambert Lucy Stewart
INTRODUCTION
I am delighted to report that Lookers has delivered another excellent trading performance, generating *adjusted profit before tax of £50.1 million (2015: £43.1 million) which is a record for a half year. This result has been achieved during a period in which volumes in the UK new car market have shown further increases against the background of a relatively strong UK economy in the first half of the year. Total registrations in the UK new car market increased by 3.2% during the six months to 30 June 2016, with total registrations of 1.42 million units. Once again, our motor division has delivered a record performance with growth in turnover and profit before tax. Our independent parts distribution business also made a very positive contribution in the period in what continues to be an improving, but still very competitive, market place and delivered good growth in both turnover and profits compared to the prior year. Another aspect of the group’s performance worth noting is the extremely strong cash flow in the period where net debt has reduced from £161.7 million at the start of the year to £74.9 million at the half year, a significant drop of £86.8 million. This clearly demonstrates that our continued growth is also delivering strong cash flow which has reduced financial gearing compared to the start of the year. This has contributed to an even stronger balance sheet despite further investment in new and improved facilities and operational capabilities. Our improved financial position and strong trading results have enabled the company to increase the interim dividend payment. On 10 August 2016, we announced that the company had entered into a conditional agreement to sell the parts division to Alliance Automotive Ltd UK (“Alliance Automotive”), on a debt free and cash free basis, for a consideration of £120 million payable in cash on completion (the “Transaction”). The Transaction is expected to complete before the end of October. The board believes the Transaction will enable the group to create greater value for its shareholders as the intention is for proceeds of the Transaction to also be used to pursue acquisitions in the motor division over the short and medium-term. As part of this strategy the group announced on 15 August 2016 the conditional acquisition of Warwick Holdings Limited, a Mercedes-Benz and Smart dealership business operating from seven locations in the West Midlands. The group is also in advanced stages of negotiation for the acquisition of a further premium-branded car dealership business, which we hope to announce shortly. Given the group’s successful track record of delivering successful acquisitions in recent years, the board is confident of acquiring further businesses in the motor division in the short term, which we believe will deliver an increase in shareholder value over the medium term. FINANCIAL REVIEW
Turnover increased by 34% to £2.34 billion (2015: £1.75 billion) with growth from new and used cars as well as aftersales. Gross profit increased by 22% to £257.1 million (2015: 210.5 million). *Adjusted profit from operations increased by 20% to £57.2 million (2015: £47.8 million). Interest costs increased in the period to £9.0 million (2015: £6.1 million), a large part of which was due to the £87.5m acquisition of Benfield in September 2015 as well as the increased trading activity. *Adjusted profit before tax increased by 16% to £50.1 million (2015: £43.1 million) and profit before tax improved by 17% to £46.7 million (2015: £39.9 million). Earnings per share increased by 17% to 9.44p compared to 8.08p. Profit after tax improved by 18% to £37.4
million (2015: £31.8 million) after a tax charge of £9.3 million, which is an effective tax rate of 20.0%. Cash flow for the six months was particularly strong with cash generated from operations of £107.8 million (2015: £42.0 million). During the period, we have invested £19.8 million of capital expenditure in improving dealership facilities and received £27.5 million for the sale of properties. In particular, £18.1million in cash was received for the sale of our VW premises in Battersea, where the profit had been included in the 2015 accounts but the cash was received this year. Net cash inflow for the period was a substantial improvement to £82.3 million (2015: £9.4 million) and more importantly the reduction in net debt to £74.9 million compared to £161.7 million at the start of the year. The improved cash flow in the period means that the group continues to benefit from a strong balance sheet. The ratio of net debt to EBITDA has reduced from 1.4 at the start of the year to the current level of 0.68 and gearing was therefore reduced to 24% compared to 54% at the start of the year. The value of freehold and long leasehold properties of £236 million (2015: £194 million) at the end of the period remains a key strength of the business. Our group bank facilities consist of a term loan of £90 million and a revolving credit facility of £150 million, giving total facilities of £240 million, which were renewed at the time of the Benfield acquisition. There is also the potential to increase the term loan by an additional £30 million to fund future acquisitions. As net debt at 30 June 2016 was £74.9 million, the group has a significant level of unutilised bank facilities of £165.1 million. The extent and term of the facilities, which are renewable in March 2020, provide significant financial security for the group. *Adjusted profit is profit before amortisation of intangible assets, debt issue costs, pension costs and share based payments
DIVIDEND
I am pleased to announce that, given the encouraging results and strong financial position of the group, the board is declaring an increase in the interim dividend of 20%. This follows the 73% increase in the dividend over the last five financial years. The intended interim dividend recognises that the dividend cover has risen significantly due to the continued increase in profits of recent years. The board has taken the decision that the level of cover should reduce over the medium term to a level of between 3.5 and 4.0 times. However, the board will continue to review the dividend policy in the light of the company’s trading performance whist retaining sufficient cash flow to fund future expansion in terms of both organic growth and acquisitions. The interim dividend of 1.28p per share (2015: 1.07p) will be payable to shareholders on 25 November 2016. OPERATING REVIEW
Motor Division The motor division consists of 150 franchised dealerships representing 31 marques from 98 locations. The business generates revenue from the sale of new and used cars and aftersales activities. Aftersales represents the servicing, repair and sale of franchised parts to customers’ vehicles. The new car market in the UK has varied between 2.0 million and 2.6 million new cars sold per annum during the past six years and our share of the retail sector of this market is just below 5%. The used car market in the UK has annual transactions of approximately 7 million vehicles and continues to represent a major opportunity for us to increase volumes in this part of the market.
The aftersales market applies to the overall number of cars in use on UK roads, which is referred to as the UK ‘car parc’. This consists of approximately 33 million vehicles where c. 23% are less than three years old. These newer vehicles are catered for primarily by the franchised motor dealers, including our motor division. The internet is the primary means for our customers to research and determine which new or used car they are interested in buying. Our website and associated digital marketing channels are therefore a very important part of the business. I am pleased to report that the motor division increased its operating profit by 22%, to £53.6 million, compared to £43.7 million last year. We continue to improve the balance of our portfolio of franchise representation by selective portfolio management and since the start of the year, we have sold three Honda dealerships in Derby, Nottingham and Stockton. These dealerships produced marginal profits only and so the group did not believe there was a reasonable chance they would produce a sensible return. On 15 August 2016, we announced the acquisition of Warwick Holdings Limited which trades as Drayton Group, for £55.4 million, payable in cash. This is a highly successful business which has seven Mercedes-Benz and Smart dealerships in Stoke on Trent, Stafford, Shrewsbury, Wolverhampton, Walsall, Stourbridge and Worcester. The acquisition agreement is a conditional contract, with the condition being the successful conclusion of the sale of the parts division, which is expected to complete by the end of October. New Cars
The UK new car market increased by 4% to 1.42 million cars in the period, with the retail new car market and the fleet market increasing by 2% and 4% respectively. Our total new car turnover increased by 38% or 12% on a like for like basis. We have continued to put more focus and investment into the fleet sector and our fleet turnover, including commercial vehicles, increased by 46%, or 15% on a like for like basis, compared to the market growth of 4%. The fleet sector is a significant part of the market which represents a major profit opportunity providing scope for organic growth given our lower than average market share. Despite this increase in volumes, we have continued to target quality fleet sales and avoid very low margin business. Gross profit from new cars increased by 22% and 4% on a like-for-like basis, compared to the prior year. New car market conditions have been favourable during the first six months of the year and the new car market continues to be relatively healthy with our order take for the important month of September continuing to build in line with our expectations. Industry forecasts suggest that the new car market will stabilise in the second half of the year with growth of 1.5% and an anticipated outturn for the year of 2.7 million units compared to 2.63 million in 2015.
Used Cars
Group turnover of used cars increased by 38%, compared to 2015 and 7% on a like-for-like basis. Gross profit increased by 25% and 12% on a like-for-like basis. This is a positive performance given that our used car volumes have increased significantly in each of the last four years. We continue to focus on stock management and sourcing good quality used cars, both of which help to improve profitability. The used car market still represents a significant opportunity for the group and this will benefit from the increasing number of leads generated by the group’s website, which have increased by 31% compared to last year. A new much improved and fully responsive website was launched last year which resulted in significant increases in our visitor and enquiry levels.
However, to continue with this momentum we will be making further major developments to our website during this year which will result in exciting improvements in functionality and interaction with our customers. Our aim is to produce an industry leading website to improve customer experience which should ultimately increase sales and enhance our customers’ experience.
Aftersales
As well as improving the margin, our higher margin aftersales business increased turnover by 24% compared to 2015 and 7% on a like for like basis. The increased turnover and profitability has benefitted from the growth in the vehicle parc of cars under three years old. This trend will continue due to the increase in the new car market in the last three years. Further progress has been made with the increase in gross profit from aftersales which increased by 27%, or 8% on a like-for-like basis. Good progress was also made in terms of the gross margin which increased by 1.3% and was slightly higher on a like-for-like basis. The increase in volumes and margins is also due to the initiatives we have made in recent years to develop the aftersales business, with an increased emphasis on performance and specific targets being introduced to improve profitability. We continue to have great success in improving penetration of an increasing proportion of customers who choose to enter into service contracts, which improves customer loyalty and retention. We have also developed further initiatives to improve the aftersales business, particularly in relation to technology and systems, where we are focussed on improving customer experience with the objective of improving retention to strengthen the business to provide further increases in profitability.
Parts Division
Our parts division operates in the independent aftermarket sector of the UK motor retail market, where we operate through three distinct operating companies:
FPS is a national warehouse distributor of quality branded automotive parts and is the largest company in the parts division, representing 75% of divisional turnover
Apec Braking is the aftermarket leader in the UK for ‘dry’ braking products (pads and discs)
BTN Turbo is the UK’s leading distributor of turbochargers and supplier of related value added services
These businesses supply automotive parts to the independent automotive aftermarket, where we operate from 22 locations serving the whole of the UK. Our customers are predominantly motor factors who are the final part of the distribution chain and who distribute parts to the independent non-franchised repairers. During the six months, our parts division continued to make good progress with increases in both turnover and profit compared to the prior year, against a background of what continues to be an improving but very competitive market. Turnover for the division increased by £2.4m, up 2% on the prior year, as we continue to expand the business by investing in existing and new product lines. Demand for core products at Apec braking improved and our second tier braking product has successfully established itself in the market. BTN Turbo experienced steady demand in core aftermarket turbo sales whilst having some encouraging wins in developing its higher value added specialist segment.
Operating margins improved slightly compared to the prior year and careful control of overheads resulted in a satisfactory increase in profit before tax which increased by 3% to £7.5 million compared to £7.3 million last year and this was a good result for the period. OUTLOOK Our strategy of having the right brands in the right locations with excellent execution leaves us ideally placed to continue our growth of the last seven years. This proven strategy should also correct any lingering misperceptions that our sub-sector and Lookers’ business model specifically, leaves us overly exposed to the economic cycle any more than general retailers. The group has produced excellent results for the first six months of the year. Growth in our new car volumes has resulted in a further increase in gross profits, we have a healthy order book for the delivery of new cars in the important month of September and the UK new car market is expected to show modest growth during the rest of this year. We have also benefited from further increases in used car volumes, increasing our share of this market and our aftersales business continues to perform well. The company has achieved outstanding growth in recent years and we believe the significant investment we are making in upgrading our facilities to reflect the latest manufacturer retail standards and multi-channel customer experience will give us a competitive advantage and further improve our position of leadership in the motor retail sector. These factors, together with the broad base of our franchise representation leave us very well positioned for future growth. The group balance sheet has been further strengthened with exceptionally strong cash flow in the period and we have substantial headroom in our bank facilities with both net debt and net debt to EBITDA being at relatively low levels. This provides secure funding capacity and financial security to grow the business through further strategic acquisitions at a time when there are significant consolidation opportunities within the sector. The excellent performance of the group in the first half of the year builds on what was already a strong comparative in the previous year. However, the result of the referendum has created a degree of uncertainty in the UK economy, although it is fair to say that we have not noticed any significant difference in terms of customer behaviour so far, particularly in respect of orders for new and used cars. Notwithstanding the uncertainties over consumer confidence and the Pound : Euro exchange rate, the board is confident that the group will make further progress during the rest of this year with revenue and profits ahead of last year’s performance. I would like to conclude by thanking all our people at Lookers for their hard work and dedication and without whom we would not have been able to yet again deliver another excellent result for the period. Phil White
Chairman
17 August 2016

Condensed Consolidated Statement of Financial Performance Six months ended 30 June 2016
Note
Unaudited Six months
ended 30 June
2016 £m
Unaudited
Six months ended 30 June
2015 £m
Audited Year ended
31 Dec 2015
£m
Continuing operations
Revenue 3 2,340.5 1,746.8 3,649.1
Cost of sales (2,083.4) (1,536.3) (3,196.9)
Gross profit 257.1 210.5 452.2
Distribution costs (146.5) (110.8) (250.6)
Administration expenses (53.6) (52.0) (121.0)
Other operating income 0.2 0.1 0.3
Profit from operations 57.2 47.8 80.9
Profit from operations before amortisation and share based payments
59.1 49.2 85.9
Amortisation of intangible assets (1.0) (0.8) (1.6)
Impairment of goodwill - - (3.6)
Exceptional items - - 1.7
Share based payments (0.9) (0.6) (1.5)
Profit from operations 57.2 47.8 80.9
Interest payable 5 (9.1) (6.2) (14.1)
Interest receivable 5 0.1 0.1 0.3
Net interest (9.0) (6.1) (13.8)
Net interest and costs on pension scheme obligation (1.3) (1.6) (3.9)
Debt issue costs (0.2) (0.2) (0.4)
Profit on ordinary activities before taxation 46.7 39.9 62.8
Profit before tax, amortisation, debt issue costs,
pension costs and share based payments 50.1 43.1 72.1
Amortisation of intangible assets (1.0) (0.8) (1.6)
Share based payments (0.9) (0.6) (1.5)
Impairment of goodwill - - (3.6)
Exceptional items - - 1.7
Net interest on pension scheme obligation (1.3) (1.6) (3.9)
Debt issue costs (0.2) (0.2) (0.4)
Profit on ordinary activities before taxation 46.7 39.9 62.8
Tax charge 7 (9.3) (8.1) (12.0)
Profit for the period / year 37.4 31.8 50.8
Attributable to:
Shareholders of the company 37.4 31.8 50.8
Continuing operations
Earnings per share
Basic earnings per share 6 9.44p 8.08p 12.88p
Diluted earnings per share 6 9.24p 7.91p 12.58p
Condensed Consolidated Statement of Comprehensive Income Six months ended 30 June 2016
Unaudited
Six months ended
30 June 2016
£m
Unaudited
Six months ended 30 June
2015 £m
Audited
Year ended 31 Dec
2015 £m
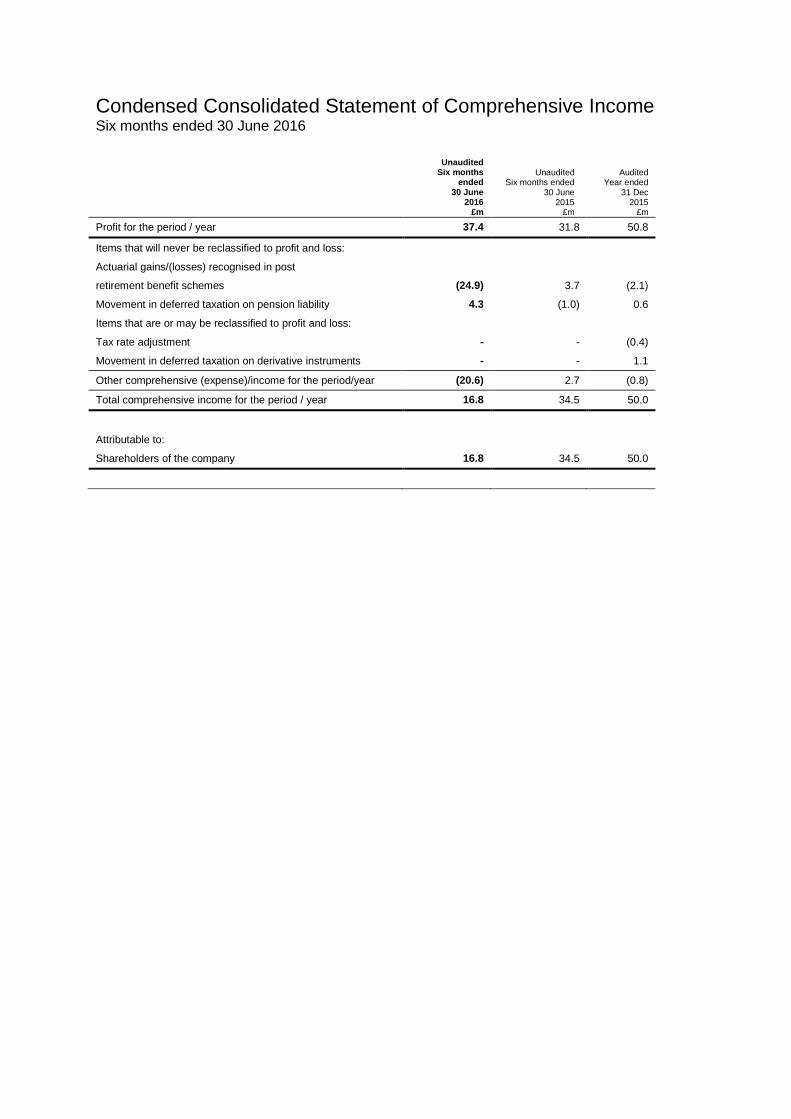
Profit for the period / year 37.4 31.8 50.8
Items that will never be reclassified to profit and loss:
Actuarial gains/(losses) recognised in post
retirement benefit schemes (24.9) 3.7 (2.1)
Movement in deferred taxation on pension liability 4.3 (1.0) 0.6
Items that are or may be reclassified to profit and loss:
Tax rate adjustment - - (0.4)
Movement in deferred taxation on derivative instruments - - 1.1
Other comprehensive (expense)/income for the period/year (20.6) 2.7 (0.8)
Total comprehensive income for the period / year 16.8 34.5 50.0
Attributable to:
Shareholders of the company 16.8 34.5 50.0
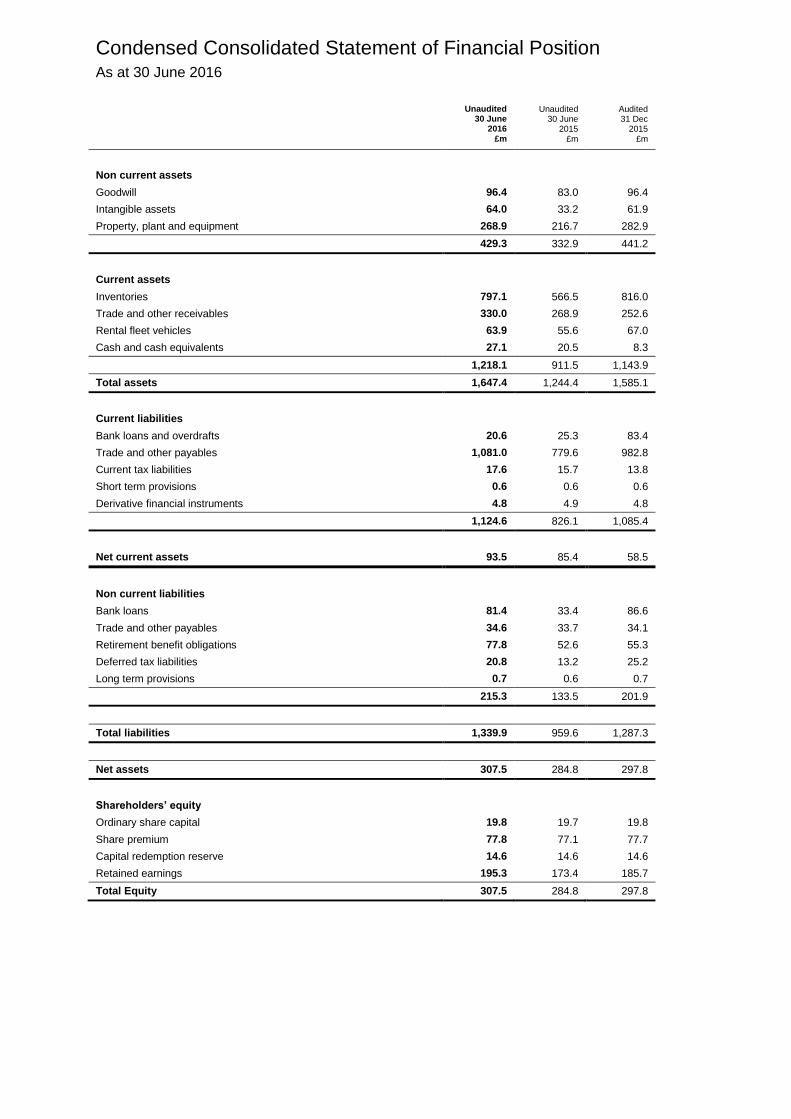
Condensed Consolidated Statement of Financial Position As at 30 June 2016
Unaudited
30 June 2016
£m
Unaudited 30 June
2015 £m
Audited 31 Dec
2015 £m
Non current assets
Goodwill 96.4 83.0 96.4
Intangible assets 64.0 33.2 61.9
Property, plant and equipment 268.9 216.7 282.9
429.3 332.9 441.2
Current assets
Inventories 797.1 566.5 816.0
Trade and other receivables 330.0 268.9 252.6
Rental fleet vehicles 63.9 55.6 67.0
Cash and cash equivalents 27.1 20.5 8.3
1,218.1 911.5 1,143.9
Total assets 1,647.4 1,244.4 1,585.1
Current liabilities
Bank loans and overdrafts 20.6 25.3 83.4
Trade and other payables 1,081.0 779.6 982.8
Current tax liabilities 17.6 15.7 13.8
Short term provisions 0.6 0.6 0.6
Derivative financial instruments 4.8 4.9 4.8
1,124.6 826.1 1,085.4
Net current assets 93.5 85.4 58.5
Non current liabilities
Bank loans 81.4 33.4 86.6
Trade and other payables 34.6 33.7 34.1
Retirement benefit obligations 77.8 52.6 55.3
Deferred tax liabilities 20.8 13.2 25.2
Long term provisions 0.7 0.6 0.7
215.3 133.5 201.9
Total liabilities 1,339.9 959.6 1,287.3
Net assets 307.5 284.8 297.8
Shareholders’ equity
Ordinary share capital 19.8 19.7 19.8
Share premium 77.8 77.1 77.7
Capital redemption reserve 14.6 14.6 14.6
Retained earnings 195.3 173.4 185.7
Total Equity 307.5 284.8 297.8

Condensed Consolidated Statement of Changes in Equity Six months ended 30 June 2016
Share capital
£m
Share premium
£m
Capital redemption
reserve £m
Retained earnings
£m
Total equity
£m
As at 1 January 2016 19.8 77.7 14.6 185.7 297.8
Profit for the period - - - 37.4 37.4
Actuarial losses recognised on defined
benefit pension schemes - - - (24.9) (24.9)
Deferred taxation on pension liability - - - 4.3 4.3
Share based payments - - - 0.9 0.9
New shares issued - 0.1 - - 0.1
Dividend to shareholders - - - (8.1) (8.1)
As at 30 June 2016 (unaudited) 19.8 77.8 14.6 195.3 307.5
Six months ended 30 June 2015
Share capital
£m
Share premium
£m
Capital redemption
reserve £m
Retained earnings
£m
Total Equity
£m
As at 1 January 2015 19.7 76.9 14.6 145.7 256.9
Profit for the period - - - 31.8 31.8
Actuarial losses recognised on defined
benefit pension schemes - - - 3.7 3.7
Share based payments - - - 0.6 0.6
New shares issued - 0.2 - - 0.2
Deferred taxation on pension liability - - - (1.0) (1.0)
Dividend to shareholders - - - (7.4) (7.4)
As at 30 June 2015 (unaudited) 19.7 77.1 14.6 173.4 284.8
Year ended 31 December 2015
Share capital
£m
Share premium
£m
Capital redemption
reserve £m
Retained earnings
£m
Total Equity
£m
As at 1 January 2015 19.7 76.9 14.6 145.7 256.9
New shares issued 0.1 0.8 - - 0.9
Profit for the year - - - 50.8 50.8
Actuarial losses recognised on defined pension schemes - - - (2.1) (2.1)
Deferred taxation on pension liability - - - 0.6 0.6
Rate adjustment - - - (0.4) (0.4)
Foreign exchange gain - - - 0.1 0.1
Share based payments - - - 1.5 1.5
Deferred taxation on share based payments - - - 1.1 1.1
Dividend to shareholders - - - (11.6) (11.6)
As at 31 December 2015 19.8 77.7 14.6 185.7 297.8
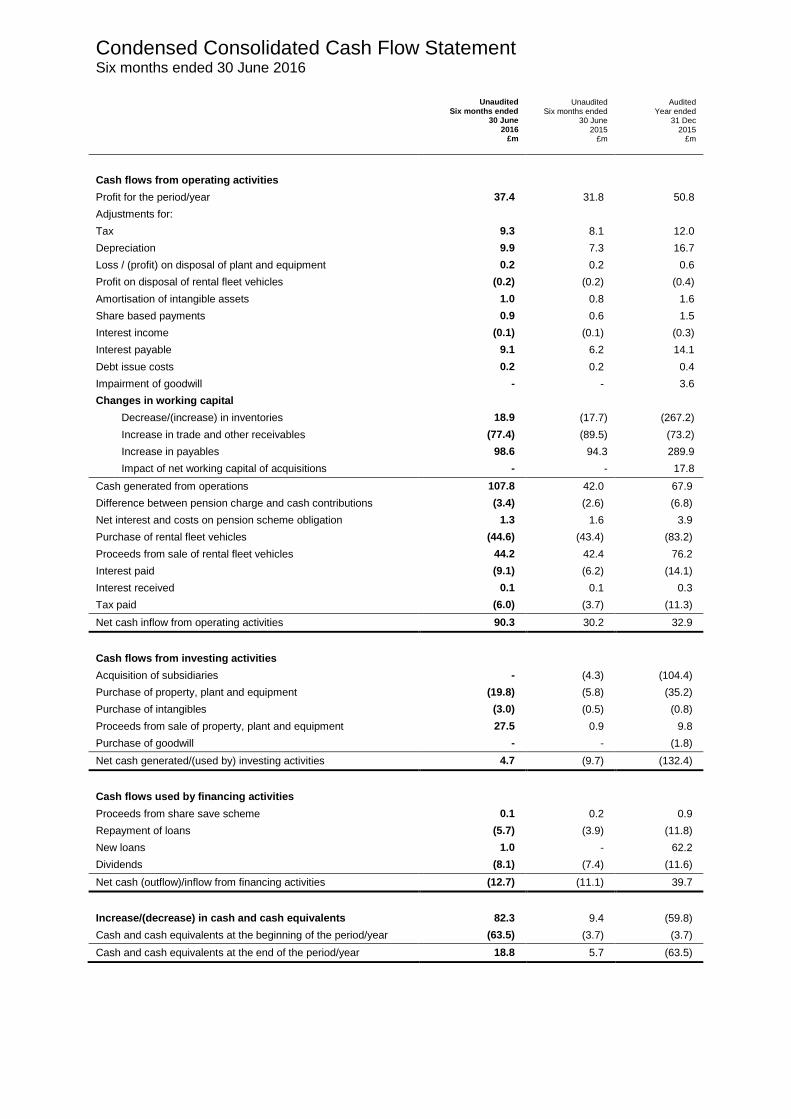
Condensed Consolidated Cash Flow Statement Six months ended 30 June 2016
Unaudited
Six months ended 30 June
2016 £m
Unaudited Six months ended
30 June 2015
£m
Audited Year ended
31 Dec 2015
£m
Cash flows from operating activities
Profit for the period/year 37.4 31.8 50.8
Adjustments for:
Tax 9.3 8.1 12.0
Depreciation 9.9 7.3 16.7
Loss / (profit) on disposal of plant and equipment 0.2 0.2 0.6
Profit on disposal of rental fleet vehicles (0.2) (0.2) (0.4)
Amortisation of intangible assets 1.0 0.8 1.6
Share based payments 0.9 0.6 1.5
Interest income (0.1) (0.1) (0.3)
Interest payable 9.1 6.2 14.1
Debt issue costs 0.2 0.2 0.4
Impairment of goodwill - - 3.6
Changes in working capital
Decrease/(increase) in inventories 18.9 (17.7) (267.2)
Increase in trade and other receivables (77.4) (89.5) (73.2)
Increase in payables 98.6 94.3 289.9
Impact of net working capital of acquisitions - - 17.8
Cash generated from operations 107.8 42.0 67.9
Difference between pension charge and cash contributions (3.4) (2.6) (6.8)
Net interest and costs on pension scheme obligation 1.3 1.6 3.9
Purchase of rental fleet vehicles (44.6) (43.4) (83.2)
Proceeds from sale of rental fleet vehicles 44.2 42.4 76.2
Interest paid (9.1) (6.2) (14.1)
Interest received 0.1 0.1 0.3
Tax paid (6.0) (3.7) (11.3)
Net cash inflow from operating activities 90.3 30.2 32.9
Cash flows from investing activities
Acquisition of subsidiaries - (4.3) (104.4)
Purchase of property, plant and equipment (19.8) (5.8) (35.2)
Purchase of intangibles (3.0) (0.5) (0.8)
Proceeds from sale of property, plant and equipment 27.5 0.9 9.8
Purchase of goodwill - - (1.8)
Net cash generated/(used by) investing activities 4.7 (9.7) (132.4)
Cash flows used by financing activities
Proceeds from share save scheme 0.1 0.2 0.9
Repayment of loans (5.7) (3.9) (11.8)
New loans 1.0 - 62.2
Dividends (8.1) (7.4) (11.6)
Net cash (outflow)/inflow from financing activities (12.7) (11.1) 39.7
Increase/(decrease) in cash and cash equivalents 82.3 9.4 (59.8)
Cash and cash equivalents at the beginning of the period/year (63.5) (3.7) (3.7)
Cash and cash equivalents at the end of the period/year 18.8 5.7 (63.5)
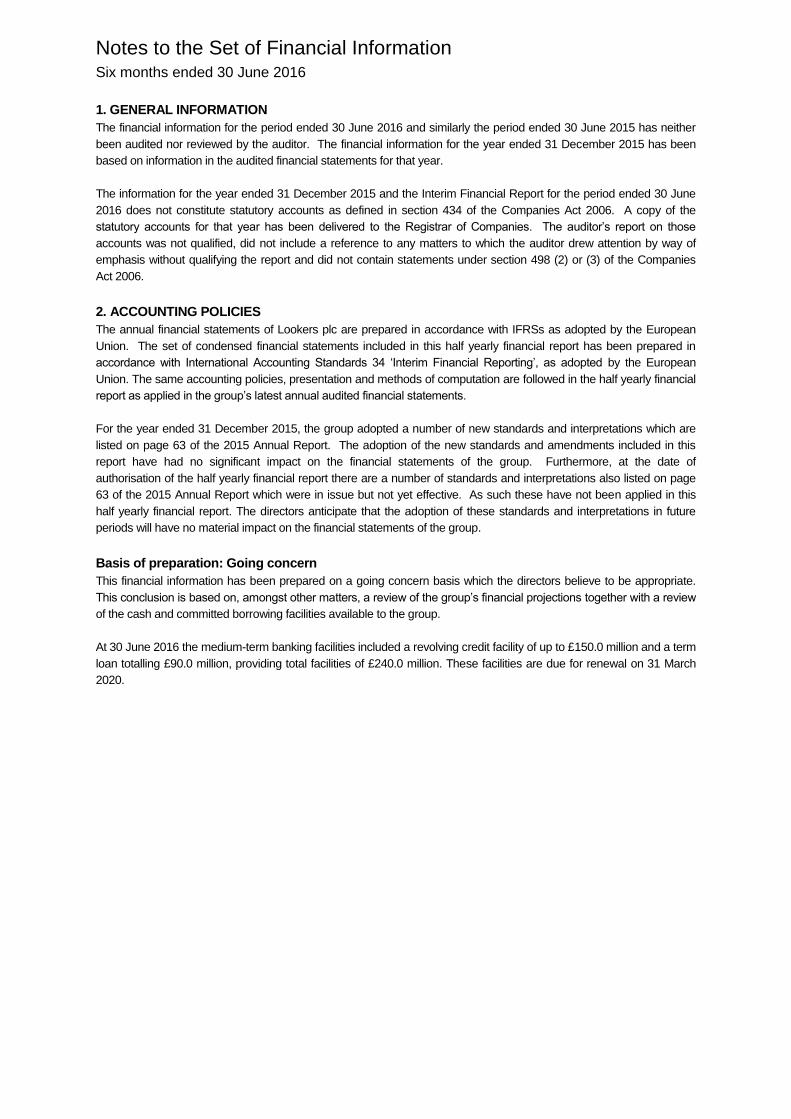
Notes to the Set of Financial Information Six months ended 30 June 2016
1. GENERAL INFORMATION
The financial information for the period ended 30 June 2016 and similarly the period ended 30 June 2015 has neither
been audited nor reviewed by the auditor. The financial information for the year ended 31 December 2015 has been
based on information in the audited financial statements for that year.
The information for the year ended 31 December 2015 and the Interim Financial Report for the period ended 30 June
2016 does not constitute statutory accounts as defined in section 434 of the Companies Act 2006. A copy of the
statutory accounts for that year has been delivered to the Registrar of Companies. The auditor’s report on those
accounts was not qualified, did not include a reference to any matters to which the auditor drew attention by way of
emphasis without qualifying the report and did not contain statements under section 498 (2) or (3) of the Companies
Act 2006.
2. ACCOUNTING POLICIES
The annual financial statements of Lookers plc are prepared in accordance with IFRSs as adopted by the European
Union. The set of condensed financial statements included in this half yearly financial report has been prepared in
accordance with International Accounting Standards 34 ‘Interim Financial Reporting’, as adopted by the European
Union. The same accounting policies, presentation and methods of computation are followed in the half yearly financial
report as applied in the group’s latest annual audited financial statements.
For the year ended 31 December 2015, the group adopted a number of new standards and interpretations which are
listed on page 63 of the 2015 Annual Report. The adoption of the new standards and amendments included in this
report have had no significant impact on the financial statements of the group. Furthermore, at the date of
authorisation of the half yearly financial report there are a number of standards and interpretations also listed on page
63 of the 2015 Annual Report which were in issue but not yet effective. As such these have not been applied in this
half yearly financial report. The directors anticipate that the adoption of these standards and interpretations in future
periods will have no material impact on the financial statements of the group.
Basis of preparation: Going concern
This financial information has been prepared on a going concern basis which the directors believe to be appropriate.
This conclusion is based on, amongst other matters, a review of the group’s financial projections together with a review
of the cash and committed borrowing facilities available to the group.
At 30 June 2016 the medium-term banking facilities included a revolving credit facility of up to £150.0 million and a term
loan totalling £90.0 million, providing total facilities of £240.0 million. These facilities are due for renewal on 31 March
2020.
Notes to the Set of Financial Information Six months ended 30 June 2016 (Continued)
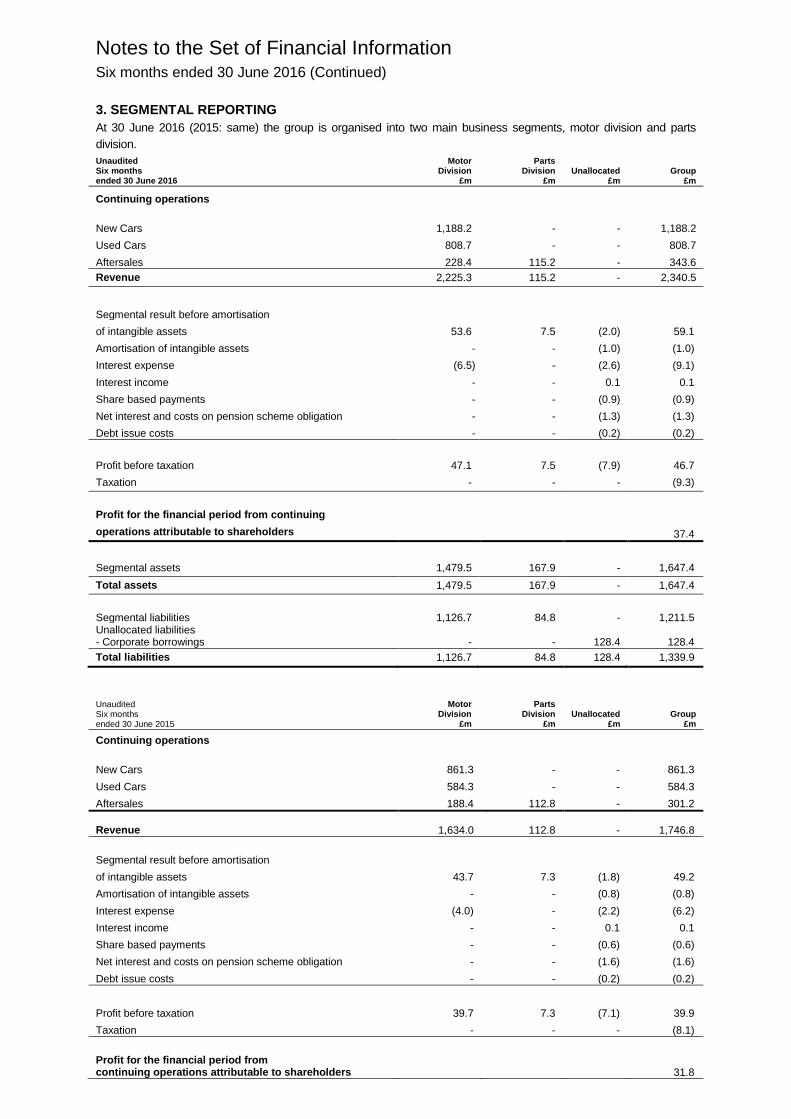
3. SEGMENTAL REPORTING
At 30 June 2016 (2015: same) the group is organised into two main business segments, motor division and parts
division.
Unaudited Six months ended 30 June 2016
Motor Division
£m
Parts Division
£m Unallocated
£m Group
£m
Continuing operations
New Cars 1,188.2 - - 1,188.2
Used Cars 808.7 - - 808.7
Aftersales 228.4 115.2 - 343.6
Revenue 2,225.3 115.2 - 2,340.5
Segmental result before amortisation
of intangible assets 53.6 7.5 (2.0) 59.1
Amortisation of intangible assets - - (1.0) (1.0)
Interest expense (6.5) - (2.6) (9.1)
Interest income - - 0.1 0.1
Share based payments - - (0.9) (0.9)
Net interest and costs on pension scheme obligation - - (1.3) (1.3)
Debt issue costs - - (0.2) (0.2)
Profit before taxation 47.1 7.5 (7.9) 46.7
Taxation - - - (9.3)
Profit for the financial period from continuing
operations attributable to shareholders 37.4
Segmental assets 1,479.5 167.9 - 1,647.4
Total assets 1,479.5 167.9 - 1,647.4
Segmental liabilities 1,126.7 84.8 - 1,211.5 Unallocated liabilities - Corporate borrowings - - 128.4 128.4
Total liabilities 1,126.7 84.8 128.4 1,339.9
Unaudited Six months ended 30 June 2015
Motor Division
£m
Parts Division
£m Unallocated
£m Group
£m
Continuing operations
New Cars 861.3 - - 861.3
Used Cars 584.3 - - 584.3
Aftersales 188.4 112.8 - 301.2
Revenue 1,634.0 112.8 -
1,746.8
Segmental result before amortisation
of intangible assets 43.7 7.3 (1.8) 49.2
Amortisation of intangible assets - - (0.8) (0.8)
Interest expense (4.0) - (2.2) (6.2)
Interest income - - 0.1 0.1
Share based payments - - (0.6) (0.6)
Net interest and costs on pension scheme obligation - - (1.6) (1.6)
Debt issue costs - - (0.2) (0.2)
Profit before taxation 39.7 7.3 (7.1) 39.9
Taxation - - - (8.1)
Profit for the financial period from continuing operations attributable to shareholders 31.8
Notes to the Set of Financial Information Six months ended 30 June 2016 (Continued)
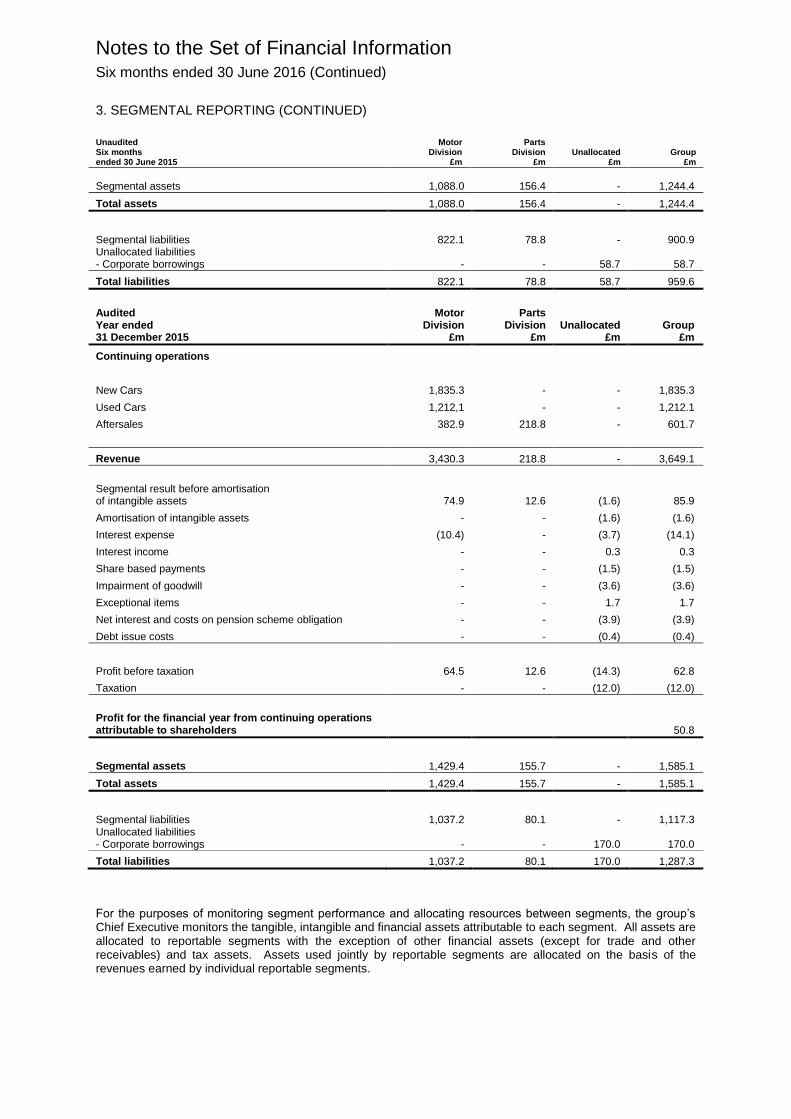
3. SEGMENTAL REPORTING (CONTINUED)
Unaudited Six months ended 30 June 2015
Motor Division
£m
Parts Division
£m Unallocated
£m Group
£m
Segmental assets 1,088.0 156.4 - 1,244.4
Total assets 1,088.0 156.4 - 1,244.4
Segmental liabilities 822.1 78.8 - 900.9 Unallocated liabilities - Corporate borrowings - - 58.7 58.7
Total liabilities 822.1 78.8 58.7 959.6
Audited Year ended 31 December 2015
Motor Division
£m
Parts Division
£m Unallocated
£m Group
£m
Continuing operations
New Cars 1,835.3 - - 1,835.3
Used Cars 1,212,1 - - 1,212.1
Aftersales 382.9 218.8 - 601.7
Revenue 3,430.3 218.8 - 3,649.1
Segmental result before amortisation of intangible assets 74.9 12.6 (1.6) 85.9
Amortisation of intangible assets - - (1.6) (1.6)
Interest expense (10.4) - (3.7) (14.1)
Interest income - - 0.3 0.3
Share based payments - - (1.5) (1.5)
Impairment of goodwill - - (3.6) (3.6)
Exceptional items - - 1.7 1.7
Net interest and costs on pension scheme obligation - - (3.9) (3.9)
Debt issue costs - - (0.4) (0.4)
Profit before taxation 64.5 12.6 (14.3) 62.8
Taxation - - (12.0) (12.0)
Profit for the financial year from continuing operations attributable to shareholders 50.8
Segmental assets 1,429.4 155.7 - 1,585.1
Total assets 1,429.4 155.7 - 1,585.1
Segmental liabilities 1,037.2 80.1 - 1,117.3 Unallocated liabilities - Corporate borrowings - - 170.0 170.0
Total liabilities 1,037.2 80.1 170.0 1,287.3
For the purposes of monitoring segment performance and allocating resources between segments, the group’s Chief Executive monitors the tangible, intangible and financial assets attributable to each segment. All assets are allocated to reportable segments with the exception of other financial assets (except for trade and other receivables) and tax assets. Assets used jointly by reportable segments are allocated on the basis of the revenues earned by individual reportable segments.
Notes to the Set of Financial Information Six months ended 30 June 2016 (Continued)
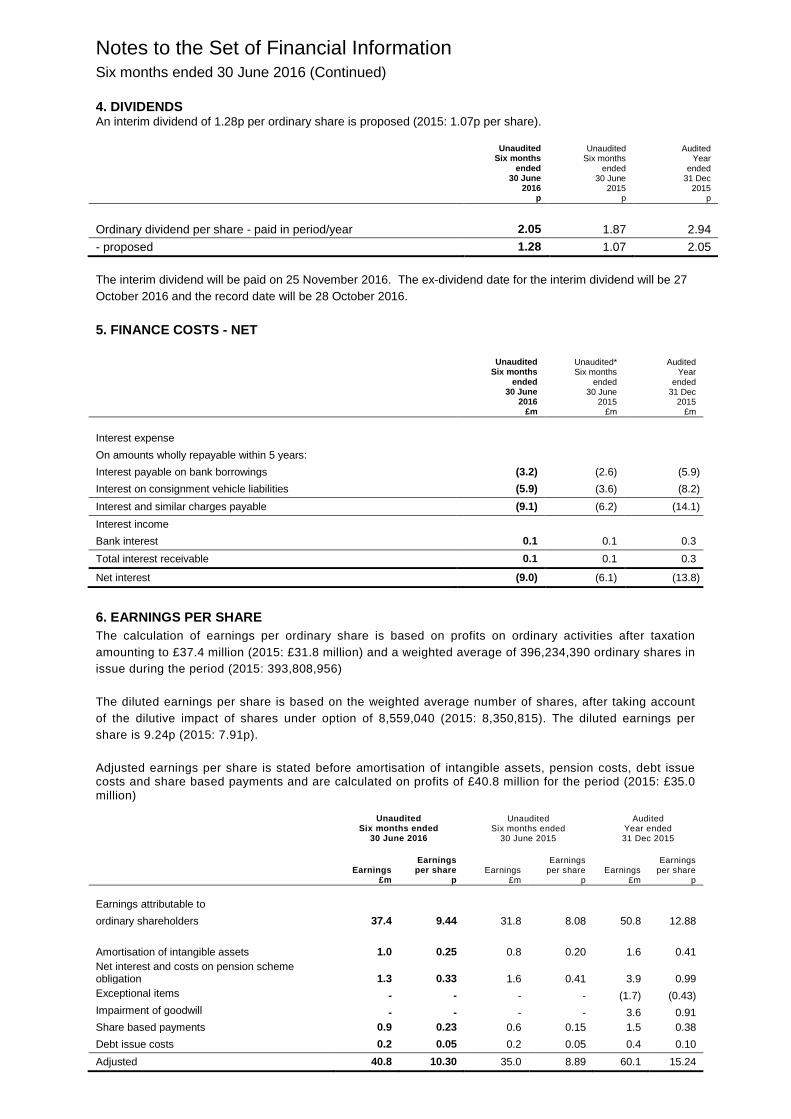
4. DIVIDENDS An interim dividend of 1.28p per ordinary share is proposed (2015: 1.07p per share).
Unaudited
Six months ended
30 June 2016
p
Unaudited Six months
ended 30 June
2015 p
Audited Year
ended 31 Dec
2015 p
Ordinary dividend per share - paid in period/year 2.05 1.87 2.94
- proposed 1.28 1.07 2.05
The interim dividend will be paid on 25 November 2016. The ex-dividend date for the interim dividend will be 27
October 2016 and the record date will be 28 October 2016.
5. FINANCE COSTS - NET
Unaudited
Six months ended
30 June 2016
£m
Unaudited* Six months
ended 30 June
2015 £m
Audited Year
ended 31 Dec
2015 £m
Interest expense
On amounts wholly repayable within 5 years:
Interest payable on bank borrowings (3.2) (2.6) (5.9)
Interest on consignment vehicle liabilities (5.9) (3.6) (8.2)
Interest and similar charges payable (9.1) (6.2) (14.1)
Interest income
Bank interest 0.1 0.1 0.3
Total interest receivable 0.1 0.1 0.3
Net interest (9.0) (6.1) (13.8)
6. EARNINGS PER SHARE
The calculation of earnings per ordinary share is based on profits on ordinary activities after taxation
amounting to £37.4 million (2015: £31.8 million) and a weighted average of 396,234,390 ordinary shares in
issue during the period (2015: 393,808,956)
The diluted earnings per share is based on the weighted average number of shares, after taking account
of the dilutive impact of shares under option of 8,559,040 (2015: 8,350,815). The diluted earnings per
share is 9.24p (2015: 7.91p).
Adjusted earnings per share is stated before amortisation of intangible assets, pension costs, debt issue costs and share based payments and are calculated on profits of £40.8 million for the period (2015: £35.0 million)
Unaudited Six months ended
30 June 2016
Unaudited Six months ended
30 June 2015
Audited Year ended 31 Dec 2015
Earnings £m
Earnings per share
p Earnings
£m
Earnings per share
p Earnings
£m
Earnings per share
p
Earnings attributable to
ordinary shareholders 37.4 9.44 31.8 8.08 50.8 12.88
Amortisation of intangible assets 1.0 0.25 0.8 0.20 1.6 0.41
Net interest and costs on pension scheme obligation 1.3 0.33 1.6 0.41 3.9 0.99
Exceptional items - - - - (1.7) (0.43)
Impairment of goodwill - - - - 3.6 0.91
Share based payments 0.9 0.23 0.6 0.15 1.5 0.38
Debt issue costs 0.2 0.05 0.2 0.05 0.4 0.10
Adjusted 40.8 10.30 35.0 8.89 60.1 15.24

Notes to the Set of Financial Information Six months ended 30 June 2016 (Continued)
7. TAXATION
The tax charge for the period has been provided at the effective rate of 19.9% (2015: 20.5%) representing the
best estimate of the average annual effective tax rate expected for the full year applied to the pre-tax income for
the six month period.
8. PENSIONS
The defined benefit obligation as at 30 June 2016 has been calculated in a manner consistent with that used in
the group’s latest annual audited financial statements. This is calculated as a valuation update as at 30 June
2016 by a qualified independent actuary to take account of the requirements of IAS19 (Revised). Scheme
liabilities have been calculated using a consistent projected unit valuation method and compared to the schemes’
assets at their market value at 30 June 2016.
9. RISKS AND UNCERTAINTIES
There are a number of potential risks and uncertainties which could have a material impact on the group’s
performance over the remaining six months of the financial year and could cause actual results to differ materially
from expected and historical results. The Board believes these risks and uncertainties to be consistent with those
disclosed in pages 27 and 28 of our latest annual report, including general economic factors such as oil prices,
interest rates, manufacturers’ influence and stability.
10. INTERIM STATEMENT
The interim announcement was approved by the Board and will be posted to shareholders in September 2016.
Copies are also available to the public at the registered office of the company at 776 Chester Road, Stretford,
Manchester M32 0QH.
Responsibility Statement
WE CONFIRM THAT TO THE BEST OF OUR KNOWLEDGE
(a) The interim financial statements have been prepared in accordance with IAS 34 ‘Interim Financial Reporting’.
(b) The interim financial statements include a fair review of the information required by DTR 4.2.7R
(identification of important events during the first six months and their impact on the condensed set of financial
statements and description of principal risks and uncertainties for the remaining six months of the year); and
(c) The interim financial statements include a fair review of the information required by DTR 4.2.8R
(disclosure of related parties’ transactions and charges therein).
By order of the Board
Andy Bruce Robin Gregson
Chief Executive Finance Director
17 August 2016 17 August 2016