longterm decreasing trend in forest fires in northwestern canada
TRANSCRIPT

Long-term decreasing trend in forest firesin northwestern Canada
TUOMO H. WALLENIUS,1,� JUHO PENNANEN,2 AND PHILIP J. BURTON3,4
1Finnish Forest Research Institute, Vantaa Research Unit, P.O. Box 18, FI-01301 Vantaa, Finland2Department of Biosciences, University of Helsinki, P.O. Box 65, FI-00014 Helsinki, Finland
3Canadian Forest Service, Prince George, British Columbia V2N4Z9 Canada4Ecosystem Science and Management, University of Northern British Columbia, Prince George, British Columbia V2N4Z9 Canada
Abstract. The annual area of forest burned has decreased in recent centuries over large areas of
Fennoscandia, Siberia and temperate North America. To determine if this same trend extends to a sparsely
populated region of northern Canada, fire scars on living and dead trees, forest stand ages and charred
wood were systematically sampled in 85 study plots in an area of 564 000 km2 in northwestern Canada. A
significant negative trend in the occurrence of forest fires was observed: average area burned per year
decreased from 2.0% in the first half of the 19th century to 0.33% in the later half of the 20th century.
Annually burned areas correlated significantly with a local tree ring based index, July monthly drought
code and the Pacific decadal oscillation but not with June-August mean temperature, distance to the
nearest road, or the year of road building. None of the climatic indicators or access history (indicative of the
start of local fire suppression) could explain the long-term negative trend in fires. Earlier interpretations
that humans dominated the causes of forest fires in the past, even in sparsely populated regions, deserve
further attention as a possible explanation for the decreasing trend in fires.
Key words: annually burned area; boreal forest; Canada, climate; fire cycle; fire suppression; forest fire, human
influence.
Received 1 March 2011; accepted 4 March 2011; final version received 18 April 2011; published 4 May 2011.
Corresponding Editor: D. P. C. Peters.
Citation: Wallenius, T. H., J. Pennanen, and P. J. Burton. 2011. Long-term decreasing trend in forest fires in northwestern
Canada. Ecosphere 2(5):art53. doi:10.1890/ES11-00055.1
Copyright: � 2011 Wallenius et al. This is an open-access article distributed under the terms of the Creative Commons
Attribution License, which permits restricted use, distribution, and reproduction in any medium, provided the original
author and sources are credited.
� E-mail: [email protected]
INTRODUCTION
The ecological literature typically describes the
North American boreal forest as a biome that
frequently burns in natural lightning ignited
forest fires (Rowe and Scotter 1973, Johnson
1992, Payette 1992). Prior to the mid-19th century
fire cycles have varied from 30 to 130 years in
Canada’s boreal forests (Zhang and Chen 2007).
However, the majority of fire history studies in
North America have been conducted either in the
southern part of boreal zone (Weir et al. 2000,
Bergeron et al. 2001) or in more temperate
coniferous forests (Heinselman 1973, Heyerdahl
et al. 2001). Except for the research based on fire
statistics and satellite images spanning the last
few decades (Stocks et al. 2002, Kasischke and
Turetsky 2006), relatively few large-scale fire
history studies (Yarie 1981, Larsen 1997) have
been conducted in northern boreal North Amer-
ica or in ‘‘the true boreal’’ as defined by Brandt
(2009).
The general view is that climate dictates the
area annually burned, at least in remote areas
such as the boreal forests of North America. It
has been suggested that as a consequence of
climatic warming, fires have (and will continue
to) become more frequent (Gillett et al. 2004,
v www.esajournals.org 1 May 2011 v Volume 2(5) v Article 53

Flannigan et al. 2005, Soja et al. 2007), whichcould be the reason for the increase in the areaannually burned seen in the fire statistics.However, the effect of climate on fire frequenciesis apparently complex and spatially and tempo-rally variable. Climate change in the 20th centuryhas not led to more high-risk fire weathereverywhere in the boreal forests. During the20th century in southwestern and southeasternCanada, the climate has shifted to conditions lessconducive to forest fires, but over the sameperiod, for example, the Eurasian taiga hasbecome drier (Girardin et al. 2009).
Several weather factors, including tempera-ture, precipitation and wind, affect daily fire risk.For example, summer temperature and precipi-tation together with other climatic variablesexplained 79% of the annual variation in burnedarea during the later half of the 20th century inAlaska (Duffy et al. 2005). It has been demon-strated that oscillation of the sea surface temper-atures could explain the long-term trends in fireregimes (Kitzberger et al. 2001). In boreal NorthAmerica, the Pacific Decadal Oscillation (PDO)correlates with forest fires (Duffy et al. 2005,Fauria and Johnson 2008). Another climatic indexthat has been shown to correlate well withannually burned area is the monthly droughtcode (MDC) of July in Canada (Girardin et al.2009).
In addition to climate there are also humanfactors that have been thought to affect fireregimes. Notably, fire suppression is associatedwith a decrease in fires in Fennoscandia (Zack-risson 1977) and in North America (Heinselman1973). However, in northern Canada, forest fireshave not been suppressed as effectively or for aslong a period of time as in southern Canada or inFennoscandia. Fires in Canada’s remote northernregions were not well documented before the1950s or 1960s (Stocks et al. 2002) and forest fireswhich occurred outside of protection zonesbefore about 1980 were neither reported norsuppressed (Simard 1997). Large areas of Cana-da’s boreal forest remain zoned for ‘‘modifiedsuppression’’ by provincial, territorial, and na-tional park agencies, meaning that the forest isallowed to burn unless communities or otherinfrastructure is at risk (Stocks et al. 2002).
In contrast to recent fire suppression efforts,presumably resulting in a reduction in the areas
burned, other human actions may have aug-mented the occurrence of fires. In the 19thcentury a common notion was that humans werethe predominant cause of forest fires (Blomqvist1888, Bell 1889). Currently, this is not consideredtrue for most of the boreal North America, as80% of the burnt area and more than 70% of thenumber of fires (those .200 ha) in compiledstatistics for northern ecozones are caused bylightning-ignited fires (Stocks et al. 2002, Ka-sischke and Turetsky 2006). Nevertheless, it hasbeen proposed that development activities andindustrial forestry have inadvertently promotedlightning fires by increasing the availability offlammable fuels (Arienti et al. 2009, Lindenmayeret al. 2009).
During the last 150 years, forest fires andbiomass burning have declined globally (Marlonet al. 2008). This can be clearly seen from firehistory field studies in Fennoscandia, southernCanada and the western United States, whereannually burned areas have steeply decreasedover the last century or longer (Zackrisson 1977,Flannigan et al. 1998, Niklasson and Granstrom2000, Zhang and Chen 2007). However, innorthern North America the fire history is notclear. While some field studies show lengtheningof the fire cycles (Larsen 1997), others point to aconsiderable temporal variability (Cyr et al.2009). Indirect reconstructions suggest that therehas been no trend over the last three centuries(Girardin and Sauchyn 2008), and compiled firestatistics attest to considerable shortening in firecycles (Stocks et al. 2002, Kasischke and Turetsky2006). These ostensible conflicts between studiesundoubtedly reflect regional differences, differ-ent time horizons over which trends are assessed,and probably some methodological differences.Further field studies are clearly needed to clarifythe complex temporal and spatial patterns in theoccurrence of forest fires in the northern NorthAmerica.
The aim of this study is to clarify the firehistory of the past two centuries over a largeregion of northwestern Canada. Specific researchquestions are: (1) How often have forests burnedin the past? (2) Have there been any significanttrends in the fire cycle during the last twocenturies? (3) What are the causes of anyobserved temporal patterns in fire cycles?
v www.esajournals.org 2 May 2011 v Volume 2(5) v Article 53
WALLENIUS ET AL.

METHODS
Study areaThe study area is located in northeast British
Columbia, northwest Alberta, southeast YukonTerritory and southwest Northwest Territories inthe Canadian Northwest (Fig. 1). The approxi-mately rectangular study area stretches about 730km from north to south between latitudes 578Nand 63.58N, and between 1258W and 1118Wlongitude. The area encompasses about 564 000km2 of which Great Slave Lake and smaller waterbodies cover 10%. Topography is mostly flat orgently contoured except for the western marginof the study area. Elevation ranges from 120 m atthe Mackenzie River to 2942 m on Mount Sylvia,but mostly varies between 150 and 500 m.
Climate of the region is continental. Averagetemperature in July is between 158C and 178Cand in January is between �198C and �278C(Environment Canada, National Climate Dataand Information Archive 2010). Average annualprecipitation is between 280 and 450 mm. Themajority of the area belongs to the Taiga Plainsecozone but segments of the Taiga Shield andBoreal Plains ecozones are included in the easternpart of the study area.
Picea mariana (Mill.) Britton, Sterns & Poggen-burg, Picea glauca (Moench) Voss, Pinus contortaDouglas, Pinus banksiana Lamb., Larix laricina (DuRoi) K. Koch, Populus tremuloides Michx. andPopulus balsamifera L. are the most common treespecies. The field layer is typically dominated bydwarf shrubs belonging to genus Ledum, Vacci-nium, and Empetrum. The pan-boreal mossesPleurozium schreberi (Brid.) Mitt. and Hylocomiumsplendens (Hedw.) B.S.G. and different species ofSphagnum typically cover the forest floor. Basedon digital topographic maps from NaturalResources Canada, muskeg and other types ofwetlands cover approximately 20% of the studyarea.
Humans have inhabited northern Canada forthousands of years (Francis et al. 2002). The firsthumans in the Americas were hunter-gathererswho influenced their environment by huntinglarge herbivores and by initiating at least somelandscape fires. The effect of these early peopleon forest fire regimes is uncertain but potentiallyvery significant: even a small population ofhumans, if it wishes to do so, is capable of
burning forests more frequently than the forestswould naturally burn (Granstrom and Niklasson2008). The human population density in thestudy area is today probably at record highlevels, but is still less than 0.1 inhabitants perkm2. There were practically no roads before the1940s. In the Northwest Territories, the first roadswere built in the 1960s. A large portion of theroad network was constructed to support the oil,gas and mineral exploration that started in the1950s and has expanded and continued to thepresent day. In the southern part of the studyarea, a modest level of commercial forestry hasbeen practiced in the later half of the 20th century(Schneider 2002). Most of the study area remainsunroaded wilderness, dominated by primevalforest and little human use. Fire suppressionactions in the area have varied through time andspace but the longest policy has been to protectproperty and lives in proximity to cities, high-ways and major rivers. Considering our sam-pling strategy (see Methods: Fire historyreconstruction), the road building dates consti-tute the likely start of fire suppression, althoughit may have become effective only much later.
Fire history reconstructionFire history was reconstructed using (1) fire
scars on trees, (2) forest stand ages and (3) firekilled and charred snags in 85 study plots withina buffer zone of 0.2–1.0 km from the existing roadnetwork in the area. The first plot was randomlylocated with ArcGIS software. Additional plotswere located with a procedure whereby the nextplot was placed on the opposite side of the road40 km away as the aerial point-to-point distance(Fig. 2). The orthogonal distance of each plotcenter from the road was randomized using 0.1km steps to be 0.2–1.0 km. After the first 30 plotsthe distance from the road was limited to 0.5 kmat maximum because of time limitations. Theplots were located with the help of a GPS device.If a plot center fell in a water body, it was rejectedand a new plot was randomized to be 2–9 kmforward along the road on the opposite side of it.The radius of sampling for each circular plot was100 m, encompassing an area of 3.1 ha. This plotsize was considered to be small enough to serveas a point-wise measure of the occurrence offires, either burnt or not burnt in any fire, whilebeing large enough to have a good chance to
v www.esajournals.org 3 May 2011 v Volume 2(5) v Article 53
WALLENIUS ET AL.

include fire scarred trees. Altogether 453 samplesfrom living trees and 45 samples from dead treeswere collected, polished with extra fine sandpa-per and brought to the laboratory for analysis bymicroscope.
Fire scars were used as a primary sourcebecause they yield relatively accurate dates forfires. Disks or wedges including fire scars weresawn from up to five living and dead trees perplot. Fire scars are typically located at the base of
Fig. 1. Locations of the study area and study plots in Northwest Canada.
Fig. 2. Schematic diagram portraying the locating of study plots.
v www.esajournals.org 4 May 2011 v Volume 2(5) v Article 53
WALLENIUS ET AL.
the trunk and have a sharply formed injuryshowing no lesion that grows year after year. Thelater is typical of scars made by falling trees andfungi. In two plots fire scars were collected morethan 100 m from the plot center. However, inboth cases fire scars were still considered to haveoriginated from the same fire that had burned theplot center as the forest age and structure weresimilar in the plot center and at the additionallysampled location further away.
Fire scars from living trees were dated bycounting the annual rings backwards from thelast year of growth. Possible missing rings can,however, cause an error of a couple of years indating. This error was minimized by selecting theradius having the broadest annual rings in eachsample, and by crosschecking fire scar dates fromthe same plot. Fire scars from 9 dead trees weredendrochronologically cross-dated (see the laterpart of this section).
Living trees were sampled for their age inevery plot. First, three dominant trees (notgrowing under the canopy of other trees) nearestto the plot center were sampled. Secondly, one tothree trees that subjectively seemed to be theoldest within 20 m from the plot center weresampled. Samples were extracted from as close tothe base of the tree as possible, on average lessthan 0.3 m above the ground level. Ages of thesampled trees were estimated by counting theannual rings to the pith and by adding a fixednumber of years to accommodate the time that isneeded for open-grown trees to reach thesampled height. Based on our sampling, oneyear was added to all broadleaved trees, twoyears to Pinus and 5 years to Picea, Larix andAbies. In a few cases where pith was not present,the missing annual rings were estimated basedon curvature of the rings near the pith (Arno andSneck 1977).
The tree ages were used for inferring fire datesif no fire scars corresponding to the tree agescould be found. Fire was determined to haveoccurred one year before an estimated year ofgermination of the oldest sample tree in the plot.To avoid assigning false fires, there had to be atleast one other sample tree born within 30 yearsto indicate a regeneration cohort following a fire.Trees killed and charred by fire were used asadditional evidence to ensure that the studiedforests were actually burned.
The samples from dead trees were dendro-chronologically cross-dated, if possible. Samplesfrom living trees with the longest sequences ofundisturbed growth were used to build masterchronologies for Picea glauca and Pinus banksiana.In addition, data provided by H. Fritts, M.Hutton, T. Knowles, C. Larsen, D. Meko, K.Moser, F.H. Schweingruber, C. Stockton and J.Szeicz (World Data Center for Paleoclimatology,International Tree Ring Data Bank 2010) wereused for building the master chronologies. Datesfor the samples were determined based on adistinctly high correlation with the master seriesusing COFECHA software (Grissino-Mayer 2001)and verified agreement with the known fire yearsand tree age structure in the plot in question. Inall cases, the visual appearance of the sample wasalso considered to exclude erroneous dates.
Cross-dating proved to be challenging becausewe were dealing with multiple tree species in avery large area where one master chronology perspecies is not enough. Of the 45 samples fromdead trees only 15 could be dendrochronologi-cally cross-dated. The samples that remainedundated were mostly charred snags. Charcoalwas found especially on branch tips but not onthe trunk, indicating that the tree had probablybeen killed by the previous fire. Snags that hadbeen dead for a long period before the fire wouldhave very likely been without bark and dry, andtherefore would have burned more thoroughly.Hence, the death of trees with charred branchtips was dated to a period immediately (oneyear) before the last fire in the plot in question.
Very low severity fires that do not kill trees, oreven cause scars on them, may not be detectedwith the methods described above. However,such low-severity fires tend to spread slowly andremain small. The great majority of the areaburned in this region is from large powerful fires.The reconstructed fire history was comparedwith fire statistics, including all documentedforest fires, provided by Natural ResourcesCanada and the fire management agencies ofBritish Columbia, Alberta and Northwest Terri-tories.
Statistical analysisThe average annually burned proportion for a
period from year t0 to year t1 (including t1) wasestimated as
v www.esajournals.org 5 May 2011 v Volume 2(5) v Article 53
WALLENIUS ET AL.

at0;t1 ¼1
t1 � t0 þ 1
Xt1
t¼t0
bðtÞcðtÞ ð1Þ
where b(t) is the number of burnt plots and c(t)the number of active plots in year t. A plot wasdetermined to be active (i.e., recording fires)since the first determined fire year or since thefirst year in the annual ring chronology of theplot in question, whichever came first.
The fire cycle for the same period from year t0to year t1 (including t1) is
ft0;t1 ¼ 1=at0;t1 ð2Þ
The fire cycle equals to the time needed to burna cumulative area equivalent to that of a largereference landscape (on average once by sepa-rate, small fires) and it is the inverse of theaverage of the annually burned proportions(Johnson and Gutsell 1994). The fire cycle alsoequals the expected point-wise average fireinterval.
We assume that in a given year, the study plotsbehave independently. Then, the number ofobserved fires for year t follows a binomialdistribution, bt ; B(c(t), p(t)), where p(t) is theprobability that a plot burns, given the condi-tions during the year. When b(t) and c(t) areknown, the posterior probability for pt is the betadistribution Beta(b(t)þ1, c(t)� b(t)þ1). Thereforethe 0.025 and 0.975 quantiles of the betadistribution give the 95% confidence interval forp(t).
We used logistic regression to evaluate theeffect of several factors on fire occurrence, andthe magnitude of a possible residual trend. Thedependent variable is the observed yearly num-ber of fires and the covariates are the year, roadbuilding date and a set of climatic indicators. Theaverage temperature over June–July–August(JJA), July monthly drought code (MDC), andthe annual average Pacific decadal oscillation(PDO) index were evaluated to best explainforest fires in our study area based on earlierresearch in northern North America (Duffy et al.2005, Fauria and Johnson 2008, Girardin et al.2009). We used the annual average PDO value,which is very strongly positively correlated withthe January–February (r ¼ 0.79), and spring-summer (r ¼ 0.96) PDO values used by Duffy et
al. (2005) and Fauria and Johnson (2008),respectively. In addition, an index derived froma three-century long reconstruction of treegrowth in the Taiga Plains ecoregion by Girardinand Sauchyn (2008) was used as a proxy forclimatic forcing on fire regimes in the region.Their reconstruction (hereafter referred to as GiR)is based on the climatically regulated componentof variation in tree-ring widths in the region andnot directly to burned areas. The GiR indexrepresents an undefined set of weather variablesthat correlate both with the tree growth and theoccurrence of fires.
Historical instrumentally measured PDO indi-ces were acquired from the Royal NetherlandsMeteorological Institute Climate Explorer (2010).PDO index values are sea surface temperature(8C) anomalies oscillating around zero; thevalues used in our analysis ranged from aminimum of �2.3 to a maximum of 3.08C. Julydrought codes (MDC; Girardin et al. 2009) for thestudy area were computed using climate datafrom the Climate Research Unit of the Universityof East Anglia and software SimMDC providedby Martin Girardin (Canadian Forest Service,Sault Ste. Marie, Ontario). The historical June-August mean temperatures in Fort Simpson andHay River during 1895–2008 were acquired fromthe Royal Netherlands Meteorological InstituteClimate Explorer (2010) and the EnvironmentCanada, National Climate Data and InformationArchive (2010b). A few missing data entries wereassigned an average for the month and station inquestion.
Road building dates were determined frommaps of various dates, other publications (Green-wood 1992), different internet sources, andpersonal communication with local authorities.Despite these efforts, exact dates could not befound for every road. For these roads thebuilding dates were assigned a midpoint datebetween a known point of time when the roadwas not built (for example, from an old mapwithout the road) and when it apparently waspresent (for example, a more recent map, or theyear of field sampling).
We model the hazard of burning h(t) in a year tfor plot v by
logitðhðtÞÞ ¼ aþ b � t þ q � rv;t þX
i
ci � xiðtÞ ð3Þ
v www.esajournals.org 6 May 2011 v Volume 2(5) v Article 53
WALLENIUS ET AL.

where xi(t) are the climatic covariates question,rvt 2 f0,1gindicates if the road nearest to plot vwas built before t, and a, b, q, and ci areparameters. For clarity, we index the ci corre-sponding to each climatic indicator as cJJA, cMDC,cPDO and cGiR. The climatic indicators werenormalized so that the mean value was 0 andstandard deviation 1. Year t was scaled to takevalues between 0, for the first, and 1, for the lastanalysed year.
Since we assume that both plots and years areindependent of each other, the above model is astraightforward generalized linear model. How-ever, the uncertainty in the dating of the fires issignificant, probably varies in time, and differsbetween the fires dated from stand age (age-dated) and fires dendrochronologically cross-dated from fire scars (scar-dated). We thereforeused a Bayesian framework for the regressionmodeling, which allows incorporating the datingerror, which is not exactly known, directly in theanalysis. We assume the actual date of a firerecorded for year t is distributed according to anormal distribution N(t þ dj, rj(t)
2), where j ¼ aand j ¼ s, for age-dated and scar-dated fires,respectively. We model ra by
raðtÞ ¼ ðk1ðt � t0Þ þ k0ðt1 � tÞÞ=ðt1 � t0Þ ð4Þ
where t0 and t1 are the first and the last years inthe data, respectively, and k0 and k1 are param-eters. The systematic error dj, as well as rs, ¼ k2are assumed to be independent of t and weassume that ra ¼ 0.
To calculate the likelihood of the observednumbers of each type of fire observation, we alsoneed to know the probability s(t) of the fire beingobserved only as an age-dated fire. We assumethat this nuisance parameter is a function of timesince the fire in question, and estimate it by
sðtÞ ¼ ~maðtÞ=ð~maðtÞ þ ~msðtÞÞ ð5Þ
where s(t) is the probability that a fire at year t isobserved only as age-dated, and ma(t) and ms(t)are kernel-smoothed yearly numbers of observedage-dated and scar-dated fires, respectively.
Now the complete model for the probability ofrecording a fire on a plot v at year t is
ha;vðtÞ ¼ sðtÞXt1
t 0¼t0
Nðt þ da;raðtÞ2Þðt 0Þ logit�1
ðaþ b � t 0 þ q � rv;t þX
i
ci � xiðt 0ÞÞ ð6Þ
for the age-dated fires, and
hs;vðtÞ ¼ ð1� sðtÞÞXt1
t 0¼t0
Nðt þ ds;rsðtÞ2Þðt 0Þ logit�1
ðaþ b � t 0 þ q � rv;t þX
i
ci � xiðt 0ÞÞ ð7Þ
for the scar-dated fires.Finally, the likelihood function is given by
L ¼Y
t;v
qvðtÞðga;vðtÞ � ha;vðtÞ þ ð1� ga;vðtÞÞ � ð1� ha;vðtÞÞÞ
�Y
t;v
qvðtÞðgs;vðtÞ � hs;vðtÞ þ ð1� gs;vðtÞÞ � ð1� hs;vðtÞÞÞ
ð8Þ
where qv(t) is an indicator function of whetherplot v is active in year t, and ga,v(t) and gs,v(t)indicate if an age-dated (scar-dated) fire wasrecorded on plot v in year t.
For the actual parameters of interest, a, b, q,and ci, we used non-informative priors. Informa-tive priors were used for the parameters of thedating uncertainty kernel for the age-dated fires.We used log-normal priors for k0, k1, and k2, withmeans of 7.4, 2.7, and 0.6 years, and 95%confidence limits of 2.7–20.1, 1.0–7.4, and 0.37–1.0 years, respectively. A normal prior was usedfor ds, with mean ¼ 0 and standard deviation ¼0.5. The posterior distributions for the regressionparameters were calculated with an iterativemethod using an adaptive Markov chain MonteCarlo algorithm (Haario et al. 2005) implementedin Cþþ.
RESULTS
Signs of fires were omnipresent in the studiedlandscape; all the 85 study plots had been burnedat least once during the previous 220 years (Fig.3). Scattered fire scars could be found inapproximately half of the study plots, whilepost-fire regeneration cohorts and charred woodprovided evidence for stand-replacing fires in therest of the plots. None of the sample plotshappened to fall in recently burned areas (thoughsome were observed between plots), with themost recent fire sampled occurring in 1981. Theaverage annually burned area over the whole
v www.esajournals.org 7 May 2011 v Volume 2(5) v Article 53
WALLENIUS ET AL.
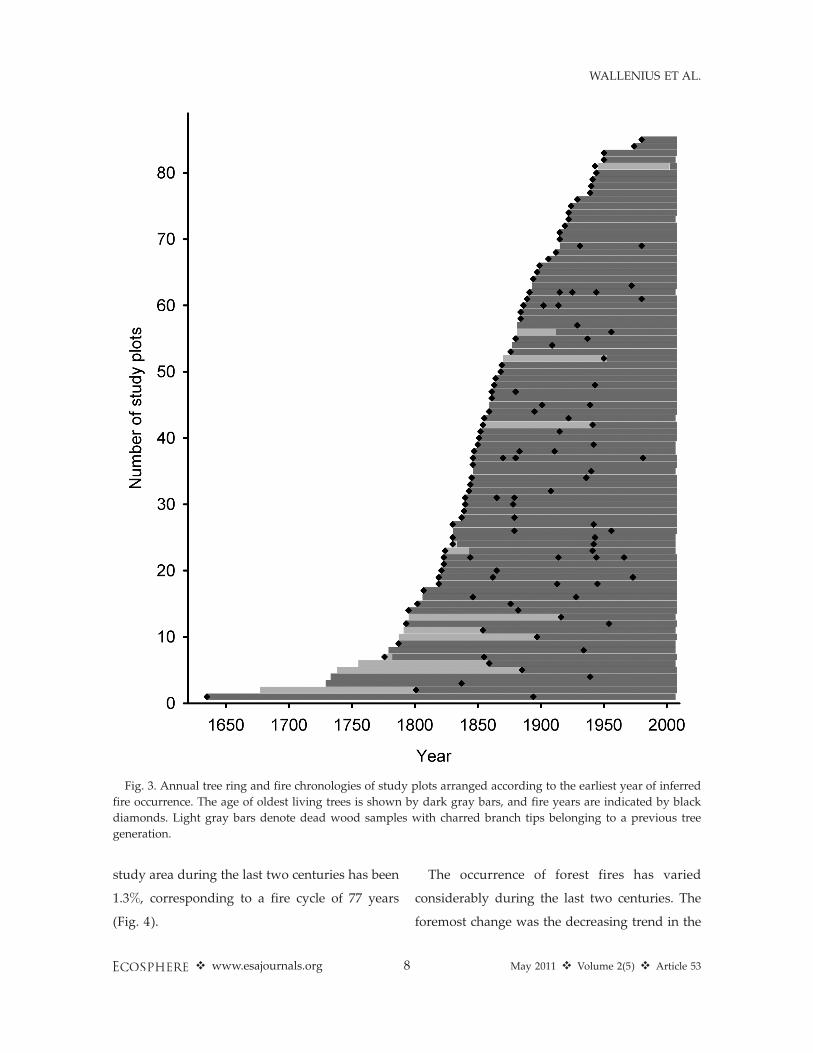
study area during the last two centuries has been
1.3%, corresponding to a fire cycle of 77 years
(Fig. 4).
The occurrence of forest fires has varied
considerably during the last two centuries. The
foremost change was the decreasing trend in the
Fig. 3. Annual tree ring and fire chronologies of study plots arranged according to the earliest year of inferred
fire occurrence. The age of oldest living trees is shown by dark gray bars, and fire years are indicated by black
diamonds. Light gray bars denote dead wood samples with charred branch tips belonging to a previous tree
generation.
v www.esajournals.org 8 May 2011 v Volume 2(5) v Article 53
WALLENIUS ET AL.

annually burned area over the whole period.Average annually burned area decreased from2.0% in the first half of the 19th century to 0.33%in the later half of the 20th century, correspond-ing to fire cycles of 50 and 300 years, respectively.Fires decreased especially after the mid-19thcentury. In the 1940s there was an intermediatepeak in fires after which a rapid further decline inannually burned areas followed (Fig. 4).
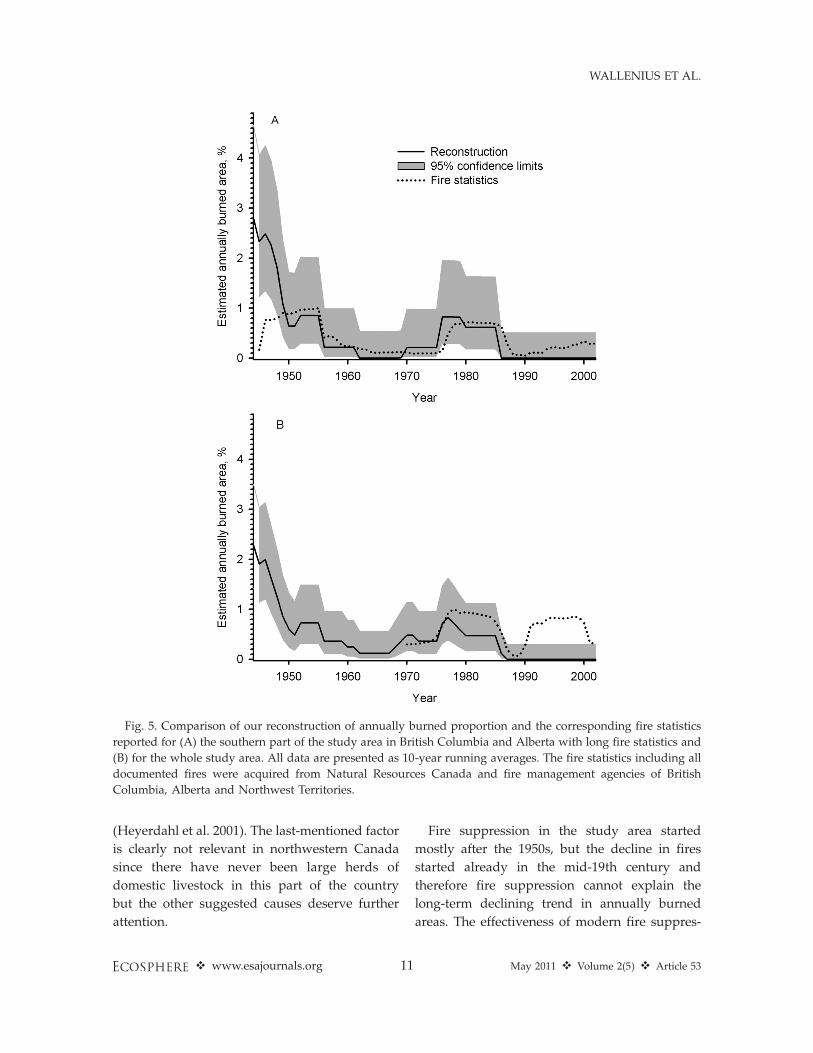
In the southern part of the study area (inBritish Columbia and Alberta) our reconstructionis in good agreement with fire statistics of thearea except for the 1940s where our reconstruc-tion shows considerably higher burned areas(Fig. 5A). In the whole study area the 1960s and1970s statistics and reconstructions show similarvalues but in the 1990s statistics report averageannually burned areas that are higher than ourupper confidence limit (Fig. 5B).
The full regression model was first fitted forthe period 1900–2000, for which all the climaticfactors were available. Of the climatic factors,GiR and MDC were positively, and the PDOindex negatively, correlated with the burnedarea, indicated by corresponding regressionparameters that were positive (or negative,respectively) with at least 95% posterior proba-bility (Fig. 6). Since all climatic predictors werenormalized to have a variance of 1, the magni-tudes of the corresponding regression parame-ters show the relative importance of thepredictors. The GiR index appears to be thesingle best climatic predictor of burned area.According to the posterior distributions, theregression parameters for JJA (cJJA) and roadbuilding date (q) were equally likely to bepositive or negative, and hence did not show aneffect on the burned area (Fig. 6A). Also, sampleplot distance from roads (0.2–1.0 km) did notcorrelate with the burned proportions of the area(p ¼ 0.7, Spearman’s rank test).
Despite the correlation between the climaticfactors and burned area, the climatic factors didnot explain the decreasing trend in fires. Theresidual trend represented by b was clearlynegative both for the period 1900–2000 and1800–2000 (with posterior probability . 0.9999,Fig. 6A and 6B, respectively). Indeed, none ofGiR, MDC, and PDO correlate significantly withyear (p . 0.25 for each, Spearman’s rank test). Itis noteworthy that the summer temperature
index JJA does have a significant positive trend(p , 10�6), but it does not have explanatoryvalue in the regression model. This indicates thaton a yearly level, JJA is not negatively correlatedwith fires, which would be necessary for it toexplain the trend in fires.
Fig. 4 shows the average yearly burnedproportion for the period 1800–2000, as predictedby the regression model. The prediction uses themaximum posterior density values for theparameters, estimated for the period 1800–2000(Fig. 6B). Road building date and JJA were leftout of the predictive model, based on the analysisfor the period 1900–2000, and PDO and MDCwere not used for the 19th century for which theywere not available. The prediction falls wellinside the 95% confidence envelope for theempirical reconstruction.
Regarding the dating error, represented by k0,k1, k2, and ds the analysis gave clear additionalinformation only about the systematic scardating error, ds, that had its highest posteriordensity at�0.5 (Figs. 6A and 6B). This means thatthe fires dated based on fire scars are equallylikely to have occurred during the previous asthe currently given year.
DISCUSSION
Signs of past fires were ubiquitous in the largetract studied in northwest Canada despite thelarge proportion of wetlands (20%). In the 19thcentury average annually burned proportion ofthe landscape varied between 3% and 1% indifferent decades, corresponding to fire cycles of30 to 100 years (Fig. 3); over the entire 19thcentury, the average fire cycle was approximately60 years. These values fall well within the rangeof historical fire cycles reported in boreal NorthAmerica, despite the mostly more southerlylocation of such studies (Zhang and Chen2007). Most studies from boreal Fennoscandiato Central Siberia have also suggested past firecycles of between 30 and 100 years, or somewhatlonger (Niklasson and Granstrom 2000, Droby-shev et al. 2004, Wallenius et al. 2011). It seemsthat despite differences in dominant tree species,historical fire return intervals across large partsof the circumboreal forests have been less than100 years, with the long-term and large-scaleaverages being around 50–80 years. However, it
v www.esajournals.org 9 May 2011 v Volume 2(5) v Article 53
WALLENIUS ET AL.

has to be noted that infrequently burned regionsand forest types with fire cycles of hundreds ofyears are probably understudied (Wallenius2002, Wallenius et al. 2010).
The decreasing trend in the annually burnedareas detected from the 19th century to themodern day is similar to the general trendreported for more southerly regions of Canada,the western U.S.A. and Fennoscandia (Zackris-son 1977, Flannigan et al. 1998, Niklasson andGranstrom 2000, Heyerdahl et al. 2001, Zhangand Chen 2007). Two other field studies innorthwestern Canada have also suggested alengthening of fire cycles: fires started to decreaseabout 1860 in Wood Buffalo National Park(Larsen 1997) and in the late 20th century inWood Bison Sanctuary and in Nahanni National
Park (Bothwell et al. 2004). The recent increase inannually burned areas seen in the fire statistics(Stocks et al. 2002, Kasischke and Turetsky 2006)appears to be relatively small in comparison withthe previous decrease, i.e., the annually burnedareas today are still at considerably lower levelsthan in the 19th century (Fig. 4).
The recent increase in fires has attracted publicattention probably because it has been attributedto climate warming. The greater and widespreadlong-term decreasing trend is less well knownand there is no consensus about the cause.Suggested causes for it have ranged, dependingon the study and region, from fire suppression(Heinselman 1973) to climate change (Flanniganet al. 1998) and from more careful fire use bypeople (Kohh 1975) to excessive grazing by cattle
Fig. 4. Reconstructed and modeled burned proportions of the study area computed as a 20-year running
average, with the 95% confidence envelope (gray) for the reconstruction. The model is the best 4-factor model
including a trend, PDO, MDC of July and GiR as explanatory factors for the 1901–2000 period, but (due to lack of
data) only the trend and GiR in the 19th century.
v www.esajournals.org 10 May 2011 v Volume 2(5) v Article 53
WALLENIUS ET AL.
(Heyerdahl et al. 2001). The last-mentioned factor
is clearly not relevant in northwestern Canada
since there have never been large herds of
domestic livestock in this part of the country
but the other suggested causes deserve further
attention.
Fire suppression in the study area started
mostly after the 1950s, but the decline in fires
started already in the mid-19th century and
therefore fire suppression cannot explain the
long-term declining trend in annually burned
areas. The effectiveness of modern fire suppres-
Fig. 5. Comparison of our reconstruction of annually burned proportion and the corresponding fire statistics
reported for (A) the southern part of the study area in British Columbia and Alberta with long fire statistics and
(B) for the whole study area. All data are presented as 10-year running averages. The fire statistics including all
documented fires were acquired from Natural Resources Canada and fire management agencies of British
Columbia, Alberta and Northwest Territories.
v www.esajournals.org 11 May 2011 v Volume 2(5) v Article 53
WALLENIUS ET AL.

sion has been questioned in North America(Bridge et al. 2005) but it probably has reducedthe area burned during the latest few decades,especially in focused areas close to roads andhuman settlements (DeWilde and Chapin 2006).Indeed, more effective fire suppression close toroads could explain why our study plots (tied tothe road network) did not burn in the 1990s asmuch as across the landscape as a whole (Fig. 4).Elevated oil, gas, and mineral exploration anddevelopment activity over the last two decades(Schneider 2002) has meant that these roads arewell travelled by industry workers trained andequipped to put out fires. The lack of fires in
statistics from the 1940s is obviously due to poordetection and the under-reporting of fires (Stockset al. 2002). The distance of study plots fromroads (0.2–1.0 km) did not significantly correlatewith the burned proportions of the landscape.This suggests that tying the study plot locationsto a road network did not cause a marked bias insampling the fire regime, at least within therange of distances tested. The same is suggestedby the result that our estimates of averageannually burned proportions were similar toaerially mapped fire statistics from the 1950s tothe 1980s (Fig. 5).
We did not find evidence that road building
Fig. 6. Prior (red) and posterior (black) probability density functions for the regression parameters, vertically
scaled to have the same maximum value, for visibility. (A) Estimates for the full model for the period 1900–2000.
MDC, PDO and GiR each have predictive value for the burned area, as the posterior probability mass for each of
those parameters is mostly on one side of the origin. In contrast, JJA and road building date (q) do not have a
clear predictive value. (B) Estimates for the model that includes PDO, GiR, and fitted parameters only, estimated
for the period 1800–2000.
v www.esajournals.org 12 May 2011 v Volume 2(5) v Article 53
WALLENIUS ET AL.

has affected annually burned proportions. Thiscontrasts with the results by Arienti et al. (2009)from Alberta. They found that the density offorest fires is greater close to roads than deep inthe forest. They suggested that this is becausegrassy roadside verges provide more flammablefuels for lightning-ignited fires than undisturbedforest vegetation. In the Russian boreal zone theforest fire density is also higher close to roadsthan further away (Kovacs et al. 2004). There thephenomenon is attributed to presence of humansas a source of ignitions. In our study area themissing evidence for the effect of roads mightreflect a scarcity of data (there actually was apeak in the fire occurrence around the date ofroad building but it was not statistically signif-icant) or because many roads were built on olderpaths and ancient trails and therefore the roadbuilding did not make a big difference withrespect to human access.
Our results confirm that the reconstruction byGirardin and Sauchyn (2008), that MDC for July(Girardin et al. 2009) and PDO index (Duffy et al.2005, Fauria and Johnson 2008) correlate withannually burned proportions in the northwesternCanada (Fig. 6). However, the effect of PDOvaries in different studies. We found a negativecorrelation between the annual average PDOindex and burned areas, similar to that reportedby Duffy et al. (2005) from Alaska. In contrast,Fauria and Johnson (2008) suggest a positivecorrelation in Alaska and in the eastern side ofRocky Mountains (including our study area). Aspotential explanations for the discrepancy wesuggest a possible lack of geographic detail, orthe low-pass and high-pass filtering of the PDOindex, in the study by Fauria and Johnson (2008).
Despite the observed correlations betweenGiR, MDC for July and PDO index and theannually burned proportion of the landscape,there was a clear residual decreasing trend infires which was not explained by the climaticindicators. The climatic indices did not them-selves show any trend. The summer (June–August) temperature was the only climatic indexwith a trend, but did not have predictive value inthe regression model. In conclusion, the decreas-ing trend in fires has to be explained by someother factors, which were not included in ouranalysis. If the unknown explanatory factor isclimatic, it has to be some signal, which has a
strong temporal trend, and which is sufficientlyindependent of the factors included in ouranalysis.
As an alternative to climatic explanation tochanges in fire regimes, Larsen (1997) hypothe-sized that the fur trade period could havebrought a reduction in human caused fires inthe region. Samuel Hearne, an officer of theHudson Bay Company, visited the study area in1772, and during the following decades furtrading posts were established here and therethroughout the area. By the mid-19th century furtrapping had become an important part of the lifeand economy of the native people. This changefrom moose hunting to fur trapping may haveresulted in a decrease in human-caused forestfires because moose prefer young forests whereasthe most lucrative fur-bearing animals do not,and hunter-trappers probably try to promotehabitat for their most valuable prey. We do nothave data about the fur trade and its effect on theforest fires. However, there are several studiesdemonstrating that fire was a versatile tool forthe native Americans (Lutz 1959, Lewis 1977,Barret and Arno 1982, Russell 1983). AlsoEuropean settlers caused forest fires in NorthAmerica, land clearing being the most importantdocumented cause of forest fires in the late 19thcentury (Sargent 1884).
According to the unanimous view of 19thcentury foresters (Sargent 1884, Blomqvist 1888,Bell 1889), fires were mostly human caused in thepast, whereas at present, fires in the northernCanada are mostly lightning ignited (Stocks et al.2002). The earliest fire statistics from Canadareport that people were responsible of more than95% of the forest fires during the 1914–1917period (Lewis 1920). According to the NationalForestry Database (2010) the percentage ofhuman caused fires during 1990–2008 is about54% for the same provinces. The possibility that adecrease in human caused ignitions significantlycontributed to the decrease in fires in our studyarea, and perhaps in other parts of NorthAmerica, at least merits serious considerationand additional research.
ACKNOWLEDGMENTS
Al Benson, Peter Engfield, Mike Flannigan, MartinGirardin, Honey-Marie de la Giroday, Kathleen Groe-newegen, Cordy Tymstra and Mike Vassal are thanked
v www.esajournals.org 13 May 2011 v Volume 2(5) v Article 53
WALLENIUS ET AL.
for the local forest fire statistics, pieces of equipmentand much helpful advice which aided in the successfulaccomplishment of this study. Sean Haughian, Ullas-tiina Mahlamaki and Pirita Oksanen provided invalu-able assistance during the field work. The BritishColumbia Ministry of Forests and Range, AlbertaDepartment of Sustainable Resource Development,Parks Canada, Aurora Research Institute and severalnorthern communities kindly permitted the extensivesampling. This study was financed by the Academy ofFinland (project 121919). Juho Pennanen was support-ed by the European Research Council (Starting Grantno. 205905, Principal Investigator Otso Ovaskainen).
LITERATURE CITED
Arienti, M. C., S. G. Cumming, M. A. Krawchuk, andS. Boutin. 2009. Road network density correlatedwith increased lightning fire incidence in theCanadian western boreal forest. InternationalJournal of Wildland Fire 18:970–982.
Arno, S. F., and K. M. Sneck. 1977. A method fordetermining fire history in coniferous forests of theMountain West. USDA Forest Service GeneralTechnical Report INT-42:1–28.
Barrett, S. W., and S. F. Arno. 1982. Indian fires as anecological influence in the northern Rockies.Journal of Forestry 80:647–651.
Bell, R. 1889. Forest Fires in Northern Canada. Reprintfrom the Report of the Forestry Congress, AtlantaMeeting. Gibson Bros., Printers and Bookbinders,Washington, USA.
Bergeron, Y., S. Gauthier, V. Kafka, P. Lefort, and D.Lesieur. 2001. Natural fire frequency for the easternCanadian boreal forest: consequences for sustain-able forestry. Canadian Journal of Forest Research31:384–391.
Blomqvist, A. G. 1888. Kulowalkeasta. Suomen met-sayhdistyksen kirjasia IV. Simeliuksen perillistenosakeyhtion kirjapaino, Helsinki, Finland.
Bothwell, P. M., W. J. de Groot, D. E. Dube, T. Chowns,D. H. Carlsson, and C. N. Stefner. 2004. Fireregimes in Nahanni National Park and the Mack-enzie Bison Sanctuary, Northwest Territories, Can-ada. Pages 43–54 in R. T. Engstrom, K. E. M. Galley,and W. J. de Groot, editors. Proceedings of the 22ndTall Timbers Fire Ecology Conference: Fire inTemperate, Boreal, and Montane Ecosystems. TallTimbers Research Station, Tallahassee, Florida,USA.
Brandt, J. P. 2009. The extent of the North Americanboreal zone. Environmental Reviews 17:101–161.
Bridge, S. R. J., K. Miyanishi, and E. A. Johnson. 2005.A critical evaluation of fire suppression effects inthe boreal forest of Ontario. Forest Science 51:41–50.
Cyr, D., S. Gauthier, Y. Bergeron, and C. Carcaillet.
2009. Forest management is driving the easternNorth American boreal forest outside its naturalrange of variability. Frontiers in Ecology and theEnvironment 7:519–524.
DeWilde, L., and F. S. Chapin. 2006. Human impactson the fire regime of interior Alaska: Interactionsamong fuels, ignition sources, and fire suppression.Ecosystems 9:1342–1353.
Drobyshev, I., M. Niklasson, P. Angelstam, and P.Majewski. 2004. Testing for anthropogenic influ-ence on fire regime for a 600-year period in theJaksha area, Komi Republic, East European Russia.Canadian Journal of Forest Research 34:2027–2036.
Duffy, P. A., J. E. Walsh, J. M. Graham, D. H. Mann,and T. S. Rupp. 2005. Impacts of large-scaleatmospheric-ocean variability on Alaskan fireseason severity. Ecological Applications 15:1317–1330.
Environment Canada, National Climate Data andInformation Archive. 2010a. Canadian ClimateNormals or Averages 1971-2000. hhttp://www.climate.weatheroffice.gc.ca/climate_normals/index_e.htmli
Environment Canada, National Climate Data andInformation Archive. 2010b. Climate data online.hhttp://climate.weatheroffice.gc.ca/climateData/canada_e.htmli
Fauria, M. M., and E. A. Johnson. 2008. Climate andwildfires in the North American boreal forest.Philosophical Transactions of the Royal Society B363:2317–2329.
Flannigan, M. D., Y. Bergeron, O. Engelmark, andB. M. Wotton. 1998. Future wildfire in circumborealforests in relation to global warming. Journal ofVegetation Science 9:469–476.
Flannigan, M. D., K. A. Logan, B. D. Amiro, W. R.Skinner, and B. J. Stocks. 2005. Future area burnedin Canada. Climatic Change 72:1–16.
Francis, R. D., R. Jones, and D. B. Smith. 2002. Origins:Canadian history to confederation. Nelson Thom-son Learning, Scarborough, Ontario, Canada.
Gillett, N. P., A. J. Weaver, F. W. Zwiers, and M. D.Flannigan.2004.Detectingtheeffectofclimatechangeon Canadian forest fires. Geophysical ResearchLetters 31:L18211:[doi: 10.1029/2004GL020876]
Girardin, M. P., A. A. Ali, C. Carcaillet, M. Mudelsee, I.Drobyshev, C. Hely, and Y. Bergeron. 2009. Hetero-geneous response of circumboreal wildfire risk toclimate change since the early 1900s. Global ChangeBiology 15:2751–2769.
Girardin, M. P., and D. Sauchyn. 2008. Three centuriesof annual area burned variability in northwesternNorth America inferred from tree rings. Holocene18:205–214.
Granstrom, A., and M. Niklasson. 2008. Potentials andlimitations for human control over historic fireregimes in the boreal forest. Philosophical Trans-
v www.esajournals.org 14 May 2011 v Volume 2(5) v Article 53
WALLENIUS ET AL.

actions of the Royal Society B 363:2353–2358.Greenwood, J. 1992. Building the road to Alaska. Pages
117–135 in B. W. Fowle, editor. Builders and fighter,U.S. Army engineers in World War II. Office ofHistory, U.S. Army Corps of Engineers, FortBelvoir, Virginia, USA.
Grissino-Mayer, H. D. 2001. FHX2—Software foranalyzing temporal and spatial patterns in fireregimes from tree rings. Tree-Ring Research57:115–124.
Haario, H., E. Saksman, and J. Tamminen. 2005.Componentwise adaptation for high dimensionalMCMC. Computational Statistics 20:265–274.
Heinselman, M. L. 1973. Fire in the virgin forests of theBoundary Waters Canoe Area, Minnesota. Quater-nary Research 3:329–382.
Heyerdahl, E. K., L. B. Brubaker, and J. K. Agee. 2001.Spatial controls of historical fire regimes: a multi-scale example from the interior west, USA. Ecology82:660–678.
Johnson, E. A. 1992. Fire and vegetation dynamics:studies from the North American boreal forest.Cambridge University Press, Cambridge, UK.
Johnson, E. A., and S. Gutsell. 1994. Fire frequencymodels, methods and interpretations. Advances inEcological Research 25:239–287.
Kasischke, E. S., and M. R. Turetsky. 2006. Recentchanges in the fire regime across the NorthAmerican boreal region-Spatial and temporalpatterns of burning across Canada and Alaska.Geophysical Research Letters 33:L09703:[doi: 10.1029/2006GL025677]
Kitzberger, T., T. W. Swetnam, and T. T. Veblen. 2001.Inter-hemispheric synchrony of forest fires and theEl Nino-Southern Oscillation. Global Ecology andBiogeography 10:315–326.
Kohh, E. 1975. Studier over skogsbrander och sken-halla i alvdalsskogarna. Sveriges skogsvardsfor-bunds tidskrift 73:299–336.
Kovacs, K., K. J. Ranson, G. Q. Sun, and V. I. Kharuk.2004. The Relationship of the Terra MODIS FireProduct and Anthropogenic Features in the CentralSiberian Landscape. Earth Interactions 8(18):1–25.
Larsen, C. P. S. 1997. Spatial and temporal variations inboreal forest fire frequency in northern Alberta.Journal of Biogeography 24:663–673.
Lewis, R. G. 1920. Forest fires in Canada 1918. ForestryBranch Bulletin. No. 70. Department of the Interior,Government of Canada, Ottawa.
Lewis, H. T. 1977. Maskuta: the ecology of indian firesin northern Alberta. Western Canadian Journal ofAnthropology 7:15–52.
Lutz, H. J. 1959. Aboriginal Man and White Men asHistorical Causes of Fires in the Boreal Forest, withParticular Reference to Alaska. Yale School ofForestry. Bulletin No. 65. Yale University, NewHaven, Connecticut, USA.
Lindenmayer, D. B., M. L. Hunter, P. J. Burton, and P.Gibbons. 2009. Effects of logging on fire regimes inmoist forests. Conservation Letters 2:271–277.
Marlon, J. R., P. J. Bartlein, C. Carcaillet, D. G. Gavin,S. P. Harrison, P. E. Higuera, F. Joos, M. J. Power,and I. C. Prentice. 2008. Climate and humaninfluences on global biomass burning over the pasttwo millennia. Nature Geoscience 1:697–702.
National Forestry Database. 2010. Number of ForestFires in the Intensive and Limited ProtectionZones by Response Category, Cause Class, andProvince/Territory/Agency. hhttp://nfdp.ccfm.org/data/compendium/html/comp_32e.htmli
Niklasson, M., and A. Granstrom. 2000. Numbers andsizes of fires: Long-term spatially explicit firehistory in a Swedish boreal landscape. Ecology81:1484–1499.
Payette, S. 1992. Fire as a controlling process in theNorth American boreal forest. Pages 144–169 inH. H. Shugart, R. Leemans, and G. B. Bonan,editors. A systems analysis of the global borealforest. Cambridge University Press, Cambridge,UK.
Rowe, S. J., and G. W. Scotter. 1973. Fire in the borealforest. Quaternary Research 3:444–464.
Royal Netherlands Meteorological Institute ClimateExplorer. 2010. hhttp://climexp.knmi.nl/start.cgi?someone@somewherei
Russell, E. W. B. 1983. Indian-set fires in the forests ofnortheastern United States. Ecology 64:78–88.
Sargent, C. 1884. Report on the Forests of NorthAmerica (Exclusive of Mexico). Government Print-ing Office, Washington, D.C., USA.
Schneider, R. R. 2002. Alternative Futures: Alberta’sBoreal Forest at the Crossroads. The Federation ofAlberta Naturalists and The Alberta Centre forBoreal Research, Edmonton, Alberta, Canada.
Simard, A. J. 1997. Wildland fire in Canada—a nationaloverview. Initial Attack spring:2–5.
Soja, A. J., N. M. Tchebakova, N. H. F. French, M. D.Flannigan, H. H. Shugart, B. J. Stocks, A. I.Sukhinin, E. I. Parfenova, F. S. Chapin III, andP. W. J. Stackhouse. 2007. Climate-induced borealforest change: Predictions versus current observa-tions. Global and Planetary Change 56:274–296.
Stocks, B. J., J. A. Mason, J. B. Todd, E. M. Bosch, B. M.Wotton, B. D. Amiro, M. D. Flannigan, K. G.Hirsch, K. A. Logan, D. L. Martell, and W. R.Skinner. 2002. Large forest fires in Canada, 1959–1997. Journal of Geophysical Research 108:8149.[doi: 10.1029/2001JD000484]
Wallenius, T. 2002. Forest age distribution and traces ofpast fires in a natural boreal landscape dominatedby Picea abies. Silva Fennica 36:201–211.
Wallenius, T., H. Kauhanen, H. Herva, and J. Penna-nen. 2010. Long fire cycle in northern boreal Pinusforests in Finnish Lapland. Canadian Journal of
v www.esajournals.org 15 May 2011 v Volume 2(5) v Article 53
WALLENIUS ET AL.
Forest Research 40:2027–2035.Wallenius, T., M. Larjavaara, J. Heikkinen, and O.
Shibistova. 2011. Declining fires in Larix dominatedforests in northern Irkutsk District. InternationalJournal of Wildland Fire in press.
Weir, J. M. H., E. A. Johnson, and K. Miyanishi. 2000.Fire frequency and the spatial age mosaic of themixed-wood boreal forest in western Canada.Ecological Applications 10:1162–1177.
World Data Center for Paleoclimatology, InternationalTree Ring Data Bank. 2010. hhttp://www.ncdc.noaa.
gov/paleo/treering.htmliYarie, J. 1981. Forest fire cycles and life tables: a case
study from interior Alaska. Canadian Journal of
Forest Research 11:554–562.
Zackrisson, O. 1977. The influence of forest fires in the
North Swedish boreal forest. Oikos 29:22–32.
Zhang, G. F., and W. J. Chen. 2007. Fire cycle of the
Canada’s boreal region and its potential response to
global change. Journal of Forestry Research 18:55–
61.
v www.esajournals.org 16 May 2011 v Volume 2(5) v Article 53
WALLENIUS ET AL.