longing for leverage? - babson...
TRANSCRIPT

BABSON COLLEGE
Longing for Leverage? Examination of leveraged loan volume and the
underlying drivers impacting the market
12/4/2013
I pledge my honor that I have neither received nor provided unauthorized assistance during the
completion of this work. “The authors of this paper hereby give permission to Professor Michael
Goldstein to distribute this paper by hard copy, to put it on reserve at Horn Library at Babson College, or
to post a PDF version of this paper on the internet.”
Joshua Blond (FIN3560 – Section 1)
Laura Haime (FIN3560 – Section 1)
Daniel Shaffer (FIN3560 – Section 1)
Robert Stockbridge (FIN3560 – Section 1)

1
Table of Contents
Executive Summary ......................................................................................................................2
Introduction ....................................................................................................................................3
Leveraged Loans Vs. High Yield Bonds ............................................................................4
Historic Performance ...........................................................................................................5
European Leveraged Loan Market ......................................................................................6
US Leveraged Loan Volume ........................................................................................................7
Influencing Factors for Leveraged Loan Volume ......................................................................8
Secondary Pricing ...............................................................................................................9
LIBOR Rate ......................................................................................................................10
Investor Confidence ..........................................................................................................11
Unemployment Rate .........................................................................................................12
30 Year Fixed Mortgage Rate ...........................................................................................13
Final Regression Relationship ..........................................................................................14
Observations Applied to Current Conditions ..........................................................................17
An Inherent Problem in the Market ..................................................................................17
Weakness of European Market Explained ........................................................................18
Conclusion ...................................................................................................................................19
References ....................................................................................................................................20
Appendices ....................................................................................................................................22
Glossary ........................................................................................................................................31

2
Executive Summary This report explores the factors that affect leveraged loan monthly volume. The leveraged loan
market, currently valued at $55.74 billion dollars, has attracted significant attention in the last few years.
The name of this debt-instrument is attributed to the below investment-grade companies who use these
loans, and are already laden with debt. Since these senior loans are paid with a floating rate, many
investors are looking to leveraged loans as a protection mechanism in a rising interest rate environment.
Given the current Quantitative Easing policies of the Federal Reserve, interest rates are at historic lows.
Furthermore, investors are lulled by the below-average default risks in the current market, and seek to
boost returns while the Fed keeps interest rates at about zero1.
The leveraged loan market has experienced various peaks and troughs over different time periods,
and these trends have been attributed to various factors. In attempts to distinguish the variables with the
strongest influence over the market, we compared five variables to leveraged loan volume: secondary
pricing, Libor rate, investor confidence, unemployment rate, and 30 year mortgage rate. After further
analysis, we discovered that the optimal regression model did not include the Libor rate, so that our final
regression was as follows:
US Volume (in US$B) = - 20.9 - 0.441 North American Investor Confide
- 13.0 US Unemployment Rate (Seasonal)
+ 11.3 30 Year Fixed Mortgage Rate
+ 1.72 US Secondary Pricing
While the variables only explain 59.5% of change in leveraged loan volume, this model sheds
insight into possible causes for the status of today’s markets. It helps in understanding inherent problems
and weaknesses of the American and European leveraged loan market structure. As the United States
faces issues within the market, our model can help predict how changes in regulations may impact
leveraged loan volume.
1 "High Yield Bonds vs Leveraged Loans." The T Report. TF Market Advisors, 28 June 2013. Web. 5
Nov. 2013.

3
Introduction
Although people define leveraged loans differently, the general definition describes them as debt
instruments issued by financial institutions, and syndicated through a group of banks and institutional
investors2. The loan is extended to companies with below investment grade credit ratings (Below BBB-
/Baa3), and it is often secured by physical collateral. Leveraged loans typically constitute a large piece of
these below investment grade companies’ capital structure,3 and the term itself reflects “the highly
leveraged nature of the issuing companies’ balance sheets”4.
Leveraged loans can either take the form of a revolving credit facility (RCF), or that of a term
loan. While both of these follow a floating rate with fixed rate spreads above The London Interbank
Offered Rate (Libor), they differ in their terms of use and general composition. RCFs work similarly to
credit cards; they are unfunded instruments that can be drawn upon at the issuer’s discretion and repaid at
any point. An RCF’s balance must be paid in full at its maturity, but is often renewed into a new facility.
Conversely, term loans resemble the structure of a car loan; a term loan is fully funded and immediately
drawn upon being issued. These loans are amortized throughout their term, with a balloon-payment at
maturity. Financial institutions grant leveraged loans either on a “best-efforts” basis, in which there is no
guarantee that the full amount of financing will be raised, or on an “underwritten” basis, where the
arranger (the investment bank) provides the entire financing upfront and syndicates its exposure to other
firms. The average syndicated loan issuance process takes between 8 to 12 weeks, from pitch to close5.
Collateralized loan obligations (CLOs) compose the majority of the leveraged loan secondary
market. CLOs are a type of collateralized debt obligation that pool leveraged-loans and slice them into
securities of varying risk and return6. A successful leveraged loan investor focuses on a credit-intensive
2 Johnson, Michael. "PowerShares Debuts Senior Loan ETF (BKLN)." ETF Database. N.p., 3 Mar. 2011.
Web. 4 Nov. 2013. 3 Nordenfelt, Niklas, and Paolo Villasenor. "Understanding Bank Loans: Opportunities for Diversification
and Risk Reduction." Analyst Report. Wells Capital Management, Dec. 2008. Web. 1 Nov. 2013. 4 Anziovar, Craig, and Lisa Kasparian. "Leveraged Loans: A Q&A with Lisa Kasparian." Analyst Report.
Pyramis Global Advisors, Aug. 2011. Web. Nov. 3. 5 Jarvis, William. Vault Career Guide to Leveraged Finance. New York: Vault, 2007. Print.
6 Giovacco, Krista, and Sridhar Natarajan. "Junk Loans Approach $1 Trillion as Standards Dip: Credit

4
process that requires a solid understanding of the company’s business fundamentals, corporate
management, stability of financing, covenants, etc7. With the global rise of leverage loan volume,
individual investors have also entered this secondary market, despite the necessary credit-intensive
process. Previously, investors faced challenges in their attempts to participate in this market. However,
several brokerage houses have created their own Exchange Traded Funds (ETFs) that expose individual
investors to the leveraged loan market. In particular, Powershares recently unveiled their leveraged loan
ETF, which tracks the market-weighted performance of the largest institutional leveraged loans based on
market weightings, spreads and interest payments8. Mutual funds have also increased investments in
CLOs, providing individual investors with access to these instruments9.
Leveraged Loan vs. High Yield Bond
Leveraged finance groups at investment banks also issue high-yield bonds, which are different
from leveraged loans. High-yield bonds are public securities registered with the Securities and
Exchange Commission (SEC) and sold directly to investors. Loans, on the other hand, are made directly
from the investment bank to the corporation, and can then be sold to investors through CLOs. This major
difference gives way to other distinct characteristics. In the event of a default, holders of leveraged loans
get paid first because of the asset’s seniority. Furthermore, unlike bonds, leveraged loans have “covenant
protection,” which restricts borrowers from actions that could impact the loan’s creditworthiness10
. The
two debt instruments also differ in their interest rates; while leveraged loans pay a floating rate, high yield
bonds are fixed rate debt instruments.
Markets." Weblog post. Bloomberg Inc., 4 Nov. 2013. Web. 5 Nov. 2013.
7 Nordenfelt, Niklas, and Paolo Villasenor. "Understanding Bank Loans: Opportunities for Diversification
and Risk Reduction." 8 Johnson, Michael. "PowerShares Debuts Senior Loan ETF (BKLN
9 Wirz, Matt, and Patrick McGee. “Leveraged-Loan Market Heats Up.” Wall Street Journal (Online) 1 Mar. 2013 :
n/a. Print. 10
Phlegar, Jeffrey. "Bank Loans vs. High Yield Bonds And The Hunt For Safety." Intelligent Investing.
Forbes Magazine, 07 Mar. 2013. Web. 5 Nov. 2013.

5
Ultimately, spread duration serves as the most important factor in assessing the relative value
between leveraged loans and high yield bonds11
. Due to the fact that loans are callable, the spread
duration of a loan trading at or above par depends on the direction of the spread move. While loans don’t
experience further upside appreciation as spreads tighten, they absorb depreciation in its entirety as
spreads widen12
. Since loans generally trade above par, the lack of call protection limits upside or capital
appreciation, which renders the loan market a carry market. In a carry market, limited trading is limited,
and investors hold onto their investment until maturity. Due to their seniority in the capital structure and
floating rate coupons, loans generally outperform bonds in periods of significant spread widening or
rapidly rising interest rates13
.
Historic Performance Overview
Before the onset of the 2008-2009 credit crisis, leveraged loans put up consistent mid-single-digit
returns, and delivered strong risk-adjusted performance as measured by the Sharpe ratio14
. However, the
liquidity crunch caused by the economic crisis left many companies unable to fulfill their loan
obligations. Financial institutions and investors were forced to sell their leveraged loans to pay off other
margin calls, which lead to a significant decline in price as the face value fell by 38%. Default rates for
leveraged loans peaked at a record 11% in November 200915
.
The collateral protection that backed the majority of these loans saved the leverage loan market.
Once the dust settled, so to speak, leverage loans rebounded sharply with the S&P LSTA Loan Index
returning 52% in 200916
. Nonetheless, the market has been more volatile in the last three years than it had
been during prior economic expansions. Since September of 2009 the leveraged loan market has observed
11
Salstrom, Jon. "High Yield versus Leveraged Loan: Bond Math Relativity." JP Morgan GFICC Blog.
J.P. Morgan Asset Management, 30 May 2013. Web. 5 Nov. 2013. 12
Ibid. 13
Ibid. 14
Anziovar, Craig, and Lisa Kasparian. "Leveraged Loans: A Q&A with Lisa Kasparian." 15
Ibid. 16
Ibid.

6
four cycles of tightening/widening, where yields have increased by at least 50 basis points and then
retraced the entire move17
.
European Leveraged Loan Market
The institutional involvement in the loan market became substantial between 2003 and 2007,
when the European acceptance and appetite for CLOs grew. Similar to the American market, as more
investor funds flowed into CLOs and credit hedge funds, the demand for loans increased, and deal
structures weakened between 2006 and 200718
.
Europe suffered comparatively greater losses from the collapse of the leveraged loan market.
Icelandic banks played a significant role in this outcome, as they expanded their balance sheets by gaining
exposure to the loan market. The downfall of the Icelandic banks released more loans into the market, and
the sudden increase in supply set off an unprecedented fall in loan prices19
.
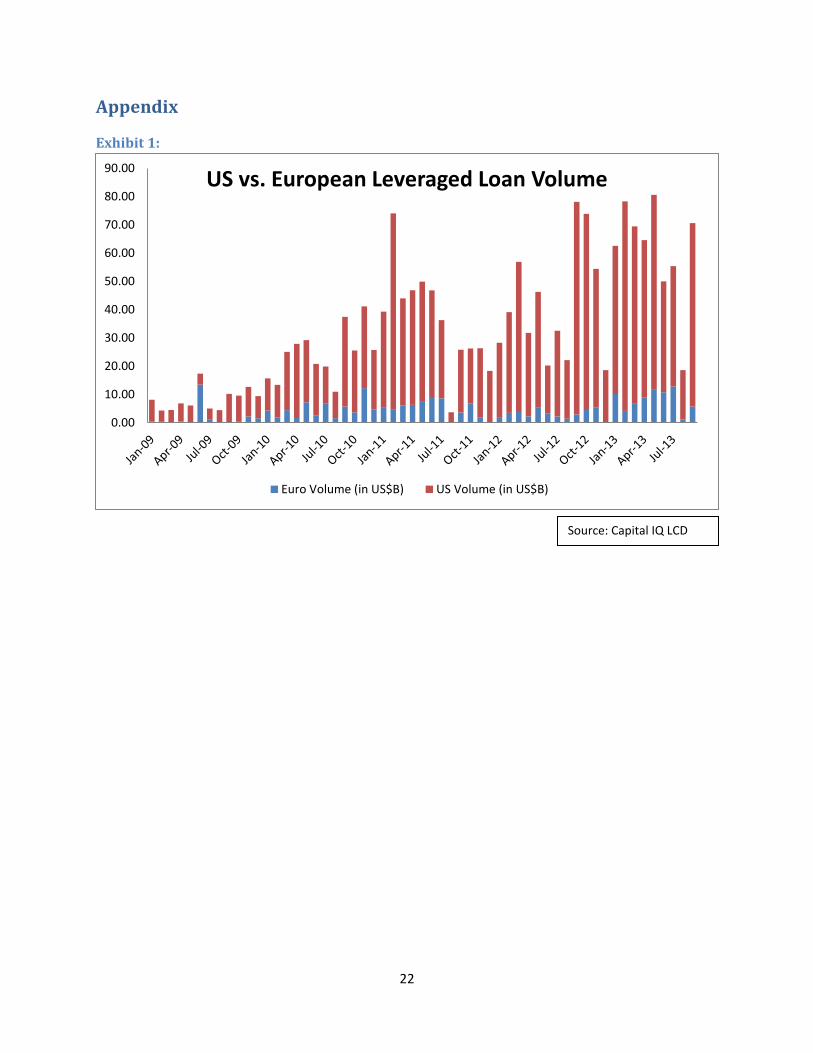
Since the crisis, the United States’ leveraged loan volume has been higher than European volume
every month except for June of 2009 (Exhibit 1). Even though Europe had only reached a high of $530
million in the months of 2009 preceding this outburst, they experienced an abnormally high volume over
$13 billion20
. Though the leveraged loan markets in both Europe and the United States have been highly
volatile since 2009, (standard deviations of $3.628 billion in Europe and $20.607 billion for the United
States), the United States’ leveraged loan volume has been consistently and significantly higher than that
of Europe, establishing a median volume of $22.16 billion over the four year time frame compared to
Europe’s median volume of only $3.65 billion21
.
17
Blau, Jonathan, Daniel Sweeney, and Karen Friedlander. "Leveraged Finance Outlook." Fixed Income
Research. Credit Suisse, 3 Dec. 2012. Web. 5 Nov. 2013. 18
Hatfield, Paul, and Simon Perry. "Investing in Debt: Opportunities in Leveraged Loans." Asset
Management. BNY Mellon, June 2010. Web. 4 Nov. 2013. 19
Ibid. 20
Capital IQ LCD. S&P Capital IQ, 2013. 21
Ibid.

7
The European loan market’s slower recovery can be partially attributed to concerns over Greece
and other European sovereigns, which have introduced more volatility to the high yield market’s, and
slowed the pipeline of new issuance22
.
United States’ Leveraged Loan Volume 2009-2013
Though highly volatile, trends in the US’ recent history of leveraged loan volumes appear to fit
into four distinct time periods: January 2009- February 2010, March 2010- July 2011, August 2011-
August 2012, and September 2012- September 2013.
In the first period, between January 2009 and February 2010, leveraged loan volumes in the
United States were particularly low. This time period embodies the pinnacle of post great recession
recovery efforts, when congress passed acts like the American Recovery and Reinvestment Act
(February 13, 2009), the Job Creation Through Entrepreneurship Act (May 2009), and the Cash for
Clunkers Program (June 2009)23
. Congress passed these acts- which provided funds for banks,
companies, and individuals- to stimulate the weakened economy. The leveraged loan volume for the
United States during this time period reflected the economy’s poor state, and the need for these reforms
and far-reaching fiscal actions. Though the recession forced several companies to fall below investment
grade, since banks themselves were also suffering, they were either unwilling or unable to provide loans
to troubled companies. The decreased supply for this market generated a median leveraged loan volume
of only $6.97 billion.
However, the drastic actions taken in 2009 made banks more willing and able to grant leveraged
loans in the second period from March 2010 to July 2011. The American Recovery and Reinvestment
Act, for example, provided banks a desperately needed sum of capital and enabled them to distribute more
resources, such as leveraged loans, to besieged companies across the country24
. Armed with these new
funds, banks increased the leveraged loan volume, and the median monthly volume resulted in $27.64
22
Ibid. 23
Saunders, Anthony, and Marcia Millon. Cornett. Financial Markets and Institutions: A Modern Perspective. 5th
ed. N.p.: McGraw-Hill/Irwin, 2012. Print. 24
Ibid.

8
billion. Furthermore, the Federal Reserve carried out the second round of quantitative easing from
November of 2010 to June of 2011, which also stimulated growth in the leveraged loan market.25
United States’ leveraged loan volume fell in the period that followed, however, and from August
2011 to August 2012 the median monthly volume was $24.66 billion. This stage occurred between the
second and third rounds of quantitative easing from the Federal Reserve, which likely influenced the
slight regression from the prior period as banks and corporations were discouraged by the federal
intervention’s temporary slowdown.
Between September 2012 and September 2013, the United States enjoyed its highest monthly
volume of leveraged loans since the great recession, establishing a median monthly volume of $55.74
billion. While more than double that of the previous year, this period’s median monthly leveraged loan
volume exemplifies the latter stages of the long recovery process. In November 2012, the Federal Reserve
announced the third round of their quantitative easing program aimed at keeping interest rates between
0% and 0.25%; a program that is still being employed as of November 201326
. The high leveraged loan
volume reflects both the increased demand that remains since the last recession, and the banks’ ability to
provide these risky loans to below investment grade companies.
Influencing Factors for Leveraged Loan Volume
While many factors have been used to explain changes in leveraged loan volumes within the last
five years, there are specific variables that show strong correlations with leveraged loan volume. One
must understand which factors hold the greatest influence over loan volume in order to create fiscal and
monetary policy that encourage this form of lending. Our research distinguished a multitude of factors
that have been linked to leveraged loan volume in the past. To identify the validity of these relationships,
we retrieved data from five factors to create a regression model. The five factors we chose were
secondary pricing, 3 month libor rate, investor confidence, unemployment rate, and 30 year fixed
25
Persaud, Chris. "Great Recession Timeline." Bankrate. Bankrate, Inc., 16 Sept. 2013. Web. 03 Nov. 2013.
26 Persaud, Chris. "Great Recession Timeline."

9
mortgage rates. This regression determines the strength of each factor in relation to leveraged loan
volume, as we attempt to detect the variables that hold the greatest influence over this market.
Secondary Pricing (Exhibits 2 and 3)
On 01 March 2013, the Wall Street Journal reported the return of large leveraged buyouts; “Wall
Street appears willing once again to bankroll some buyouts on short notice because bankers are confident
they can parcel out to investors chunks of the loans backing the deal”27
. The article attributes HJ Heinz’s
recent acquisition to the growth in the leveraged loans’ secondary market. In so doing, the article suggests
that banks are more willing to make loans to non-investment grade companies when they can syndicate
the loan out to other investors rather than having it on their books. The journalists go on to say, “The
rising appetite for loans is a boon for companies and private-equity firms because it drives down
borrowing costs to finance takeovers”28
. Thus, not only are banks more willing to make loans when there
is a secondary market to sell it to, but, as with all markets, rates are inversely correlated with price and
demand. Consequently, high demand in the secondary market cause low expected rates of return for
investors. As a result, banks can lend out at lower rates as well, which increases the demand for loans.
In order to analyze the validity of this relationship, we ran a regression between the price of the
S&P LSTA U.S. Leveraged Loan 100 Index and leveraged loan volume on a monthly basis. As we can
observe from the table below, for every $1 increase in the secondary market price of a leveraged loan, the
US leveraged loan volume increases by $1.647 billion.
Model Summary
Model R R Square Adjusted R Square Std. Error of the Estimate
1 .661(a) .437 .426 15.607864
a. Predictors: (Constant), US Secondary Pricing
Coefficients(a)
Model
Unstandardized Coefficients Standardized Coefficients t Sig.
B Std. Error Beta
1 (Constant) -120.592 22.958 -5.253 .000
US Secondary Pricing 1.647 .252 .661 6.528 .000
a. Dependent Variable: US Volume (in US$B)
27
Wirz, Matt, and Patrick McGee. “Leveraged-Loan Market Heats Up.” 28
Ibid.

10
As mentioned before, prices should move inversely with interest rate. Based on the article, we
expect a higher volume of leveraged loans when interest rates are low, and a positive correlation between
price and volume. The results of the regression support our hypothesis. Our regression had a correlation
of r = 0.661, which is a relatively strong positive correlation. The regression also shows an extremely low
p-value, emphasizing the relationship’s statistical significance.
Libor Rate (Exhibits 4 and 5)
Libor rate has a dual effect on leveraged loan volume. First, since most leveraged loans are
pegged to Libor, the rate affects the amount paid by the loan recipient. In this regard, companies and
financial sponsors prefer low Libor rates as they entail lower interest payments on loans. Secondly, lower
Libor rates may result in lower yields for investors in the secondary market, which could negatively affect
leveraged loan volume.
On 26 January 2008, a Wall Street Journal article explained, “With three-month Libor in the
3.3% area, underwriters are faced with the task of making leveraged loans attractive to investors who’ve
grown accustomed to healthier yields as a result of much higher underlying Libor”29
. Thus, the article
suggests that investors are attracted to the market either by a decrease in secondary market prices, or an
increase in the spreads paid on Libor. The journalist continues, “Libor’s low levels have the potential to
keep the loan market in the doldrums,”30
describing a positive correlation between Libor and loan volume
as low rates make underwriters will be unwilling to issue leveraged loans.
Our regression comparing the three-month Libor to leveraged loan volume shows a weak
negative correlation of -0.399, with a statistically significant p-value of 0.002. In addition, for every 1%
increase in the Libor rate, the US leveraged loan volume decreases by $35.077 billion.
29
Koons, Cynthia. “Libor Sinks Leveraged Loans.” Wall Street Journal, Eastern edition 26 Jan. 2008 : B.5. Print. 30
Ibid.

11
Model Summary
Model R R Square Adjusted R Square Std. Error of the Estimate
1 .399(a) .159 .144 19.065960
a. Predictors: (Constant), Three Month LIBOR Rate
Coefficients(a)
Model
Unstandardized Coefficients Standardized Coefficients t Sig.
B Std. Error Beta
1 (Constant) 43.214 5.165 8.366 .000
Three Month LIBOR Rate -35.077 10.868 -.399 -3.227 .002
a. Dependent Variable: US Volume (in US$B)
These results reject the article’s hypothesis. This could be because, although low Libor rates may
hurt the secondary market in the short-term, the lower financing costs attract companies and increase
demand in the market.
Investor Confidence (Exhibits 6 and 7)
Since leveraged loans are made to below- investment grade companies, these assets carry a
greater risk than loans made to investment grade companies. The Wall Street Journal published an article
on October 12, 2012 linking high investor confidence to an increase in leveraged loan volume. The article
explains, “leveraged loans are typically made to below-investment-grade companies, the same ones that
earned high-yield bonds the sobriquet ‘junk bonds.’ And when investors get fearful, loans can get
pounded: In 2008, they lost 30%.”31
This journalist assumed a positive correlation between investor
confidence and leveraged loan volume as a result of the asset’s inherent risk. Our findings, however, do
not support this theory.
Model Summary
Model R R Square Adjusted R Square Std. Error of the Estimate
1 .265(a) .070 .053 20.050372
a. Predictors: (Constant), North American Investor Confidence
Coefficients(a)
Model
Unstandardized
Coefficients
Standardized
Coefficients t Sig.
B Std. Error Beta
1 (Constant) 76.189 23.474 3.246 .002
31
Levisohn, Ben. “‘Leveraged Loans’ Look Good.” Wall Street Journal (Online) 12 Oct. 2012 : n/a. Print.
12
Coefficients(a)
Model
Unstandardized
Coefficients
Standardized
Coefficients t Sig.
B Std. Error Beta
North American Investor
Confidence -.492 .241 -.265
-
2.037 .046
a. Dependent Variable: US Volume (in US$B)
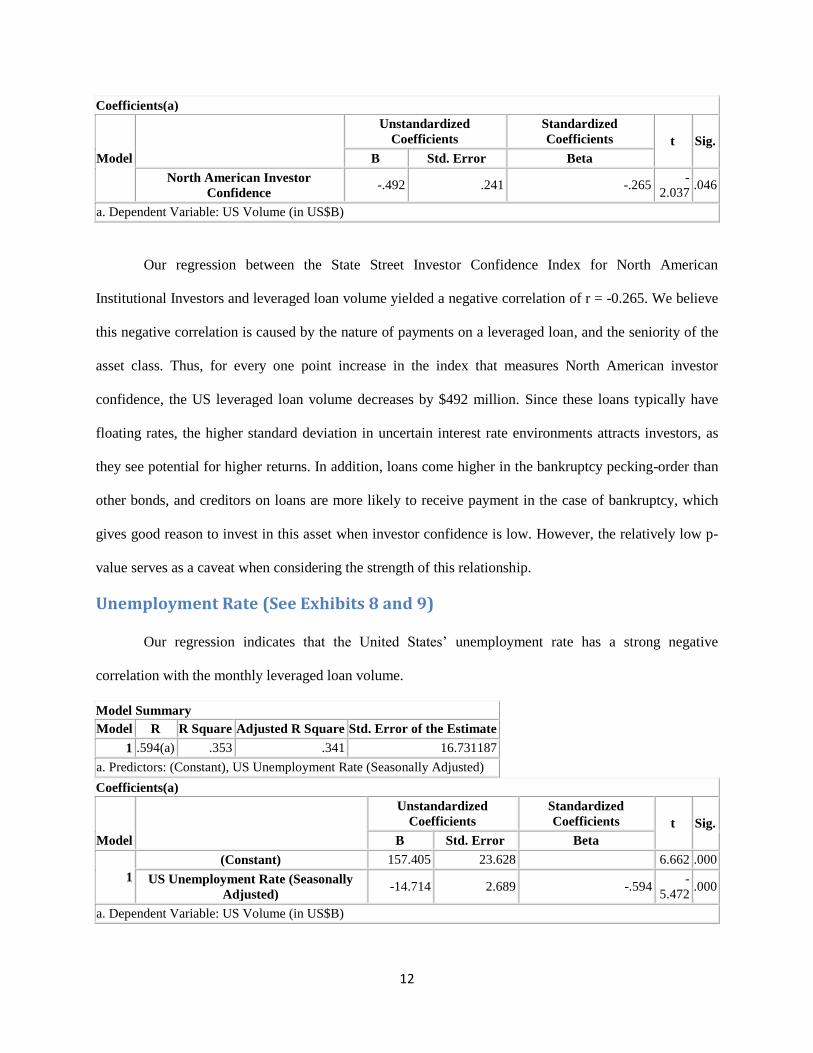
Our regression between the State Street Investor Confidence Index for North American
Institutional Investors and leveraged loan volume yielded a negative correlation of r = -0.265. We believe
this negative correlation is caused by the nature of payments on a leveraged loan, and the seniority of the
asset class. Thus, for every one point increase in the index that measures North American investor
confidence, the US leveraged loan volume decreases by $492 million. Since these loans typically have
floating rates, the higher standard deviation in uncertain interest rate environments attracts investors, as
they see potential for higher returns. In addition, loans come higher in the bankruptcy pecking-order than
other bonds, and creditors on loans are more likely to receive payment in the case of bankruptcy, which
gives good reason to invest in this asset when investor confidence is low. However, the relatively low p-
value serves as a caveat when considering the strength of this relationship.
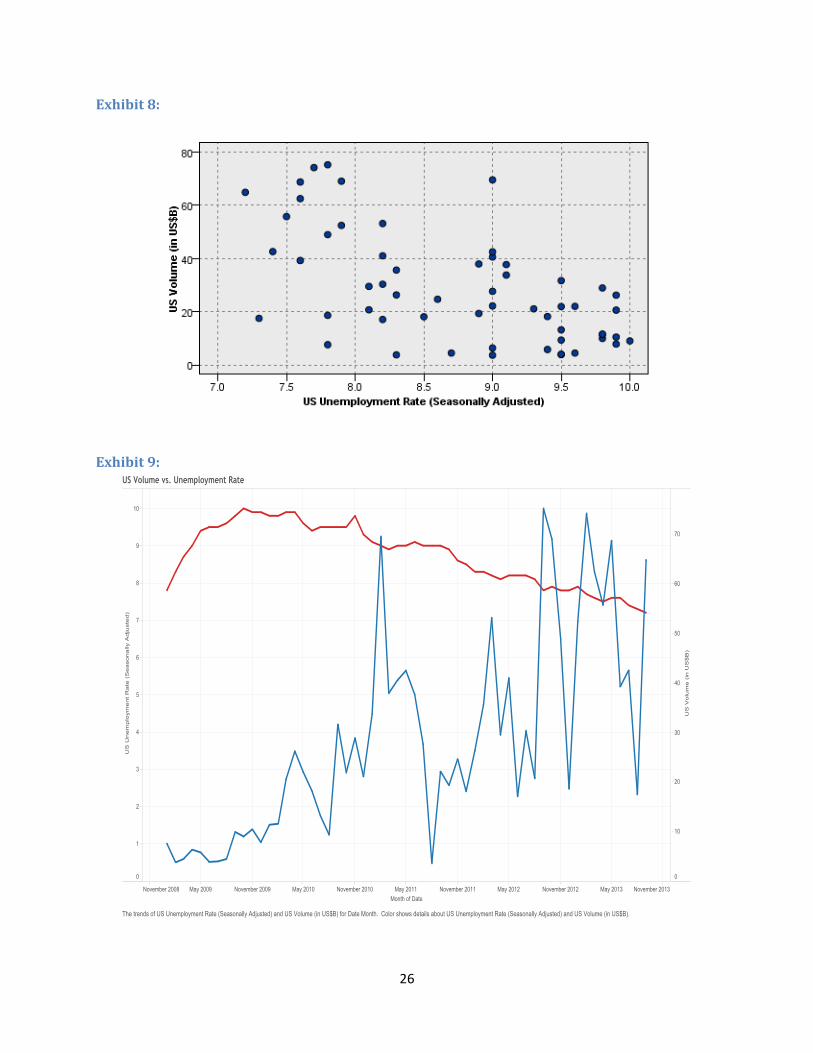
Unemployment Rate (See Exhibits 8 and 9)
Our regression indicates that the United States’ unemployment rate has a strong negative
correlation with the monthly leveraged loan volume.
Model Summary
Model R R Square Adjusted R Square Std. Error of the Estimate
1 .594(a) .353 .341 16.731187
a. Predictors: (Constant), US Unemployment Rate (Seasonally Adjusted)
Coefficients(a)
Model
Unstandardized
Coefficients
Standardized
Coefficients t Sig.
B Std. Error Beta
1
(Constant) 157.405 23.628 6.662 .000
US Unemployment Rate (Seasonally
Adjusted) -14.714 2.689 -.594
-
5.472 .000
a. Dependent Variable: US Volume (in US$B)

13
Unemployment rates hold a relatively strong correlation to leveraged loan volume, at 0.594. As
the model shows, for every percentage increase in the United States’ unemployment rate, the monthly
leveraged loan volume decreases by $14.714 billion. This reflects the unemployment rate’s role as a
general indicator for the US’ economy’s state; in a stable or thriving economy, the unemployment rate is
low. A strong economy allows banks to increase the supply of leveraged loans to struggling companies,
which increases monthly volume. The importance of this relationship is seen in the p-value, which is
0.000. Thus, as supported by our regression, a drop in the unemployment would increase the monthly US
leveraged loan volume.
30 Year Fixed Mortgage Rates (See Exhibits 10 and 11)
The mortgage market, another type of loan market, is also often linked with leveraged
loan volumes. Kent Greenfield, a law professor at Boston College, wrote, “In an LBO, the
acquiring firm typically borrows a large percentage of the purchase price by pledging the assets of the
acquired firm as collateral for the loan. Because the assets of the target company are used as collateral,
LBOs have been most successfully used to acquire companies with stable cash flows and hard assets such
as real estate”32
. The idea that LBOs (leveraged buyouts) are more successful when companies have more
real estate suggests a positive relationship between property values and LBOs. When mortgage rates rise,
demand for real estate tends to decrease due to the higher cost associated with buying real estate. A
declining demand for property decreases the value of real estate, leaving leveraged loans with weaker
collateral. In our attempts to examine the possible relationship between mortgage rates and leveraged loan
volume, we were unable to retrieve mortgage rates for corporate properties. Nonetheless, we ran a
regression between the Bankrate.com US Home Mortgage 30 Year Fixed National Average and leveraged
loan volume.
Model Summary
Model R R Square Adjusted R Square Std. Error of the Estimate
1 .599(a) .359 .347 16.653337
32
Greenfield, Kent. "Leveraged Buyouts." Dictionary of American History. Ed. Stanley I. Kutler. 3rd ed. Vol. 5.
New York: Charles Scribner's Sons, 2003. 84-85. Gale Virtual Reference Library. Web. 1 Dec. 2013.

14
Model Summary
Model R R Square Adjusted R Square Std. Error of the Estimate
a. Predictors: (Constant), Thirty Year Fixed Mortgage Rate
Coefficients(a)
Model
Unstandardized Coefficients Standardized Coefficients t Sig.
B Std. Error Beta
1 (Constant) 116.294 15.956 7.288 .000
Thirty Year Fixed Mortgage Rate -19.794 3.570 -.599 -5.545 .000
a. Dependent Variable: US Volume (in US$B)
Ultimately, our regression shows that for every 1% increase in the US thirty year fixed mortgage
rate, the US leveraged loan volume decreases by $19.794 billion. This regression validates our
hypothesis, yielding a correlation of r = -0.599 at a statistically-significant p-value of 0.000.
Full Regression Equation (See Exhibit 13)
Our full regression includes the five variables previously described. The model shows that
58.8% of the change in leveraged loan volumes can be explained by these variables. Some of the
coefficients may have changed from what was described in detail above due to possible correlation
between the input variables. For example, both the thirty year fixed mortgage rate and the 3-month Libor
rate are measures of interest rates and, as a result, likely move together. However, the resulting US
monthly leveraged loan volume based on this equation would be a fairly accurate prediction in a “normal”
month without any extreme, interfering factors as can be observed in exhibit 12.
US Volume (in US$B) = 6.5 - 0.468 North American Investor Confide
- 13.6 US Unemployment Rate (Seasonal)
+ 11.3 30 Year Fixed Mortgage Rate
+ 1.53 US Secondary Pricing - 6.7 3 Month LIBOR Rate
Predictor Coef SE Coef T P
Constant 6.55 91.54 0.07 0.943
North American Investor Confide -0.4682 0.2560 -1.83 0.073
US Unemployment Rate (Seasonal) -13.557 3.591 -3.77 0.000
30 Year Fixed Mortgage Rate 11.263 6.947 1.62 0.111
US Secondary Pricing 1.5327 0.6496 2.36 0.022
3 Month LIBOR Rate -6.75 20.45 -0.33 0.743
S = 13.2318 R-Sq = 62.5% R-Sq(adj) = 58.8%

15
Analysis of Variance
Source DF SS MS F P
Regression 5 14850.6 2970.1 16.96 0.000
Residual Error 51 8929.1 175.1
Total 56 23779.
Nonetheless, we continued our analysis and experimented with other regression models
to improve the adjusted R-sq value.
Final Regression Equation (See Exhibit 14 and 15) To determine the optimal equation for leveraged loan volume, we ran best subsets and stepwise
regressions. These regressions compare the characteristics of multiple regressions with variations in the
variables used. According to the results, the optimal equation would not include the 3-Month Libor rate.
This new equation yielded the highest adjusted R2 and the Mallows Cp closest to the number of
repressors. These measures demonstrate that although adding more variables may decrease the error, the
added variables are actually over fitting the data and have a degree of colinearity. In this case, although
the Libor rate is statistically significant on its own, it does not add value to the model. This result is most
likely due to the fact that the Libor rate affects volume indirectly through the secondary market. Thus, the
secondary market pricing variable explains the same variation. The final regression model is as follows:
US Volume (in US$B) = - 20.9 - 0.441 North American Investor Confide
- 13.0 US Unemployment Rate (Seasonal)
+ 11.3 30 Year Fixed Mortgage Rate
+ 1.72 US Secondary Pricing
Predictor Coef SE Coef T P
Constant -20.85 38.18 -0.55 0.587
North American Investor Confide -0.4414 0.2406 -1.83 0.072
US Unemployment Rate (Seasonal) -12.982 3.113 -4.17 0.000
30 Year Fixed Mortgage Rate 11.334 6.884 1.65 0.106
US Secondary Pricing 1.7165 0.3310 5.19 0.000
S = 13.1179 R-Sq = 62.4% R-Sq(adj) = 59.5%
Analysis of Variance
Source DF SS MS F P
Regression 4 14831.5 3707.9 21.55 0.000
Residual Error 52 8948.1 172.1
Total 56 23779.6
16
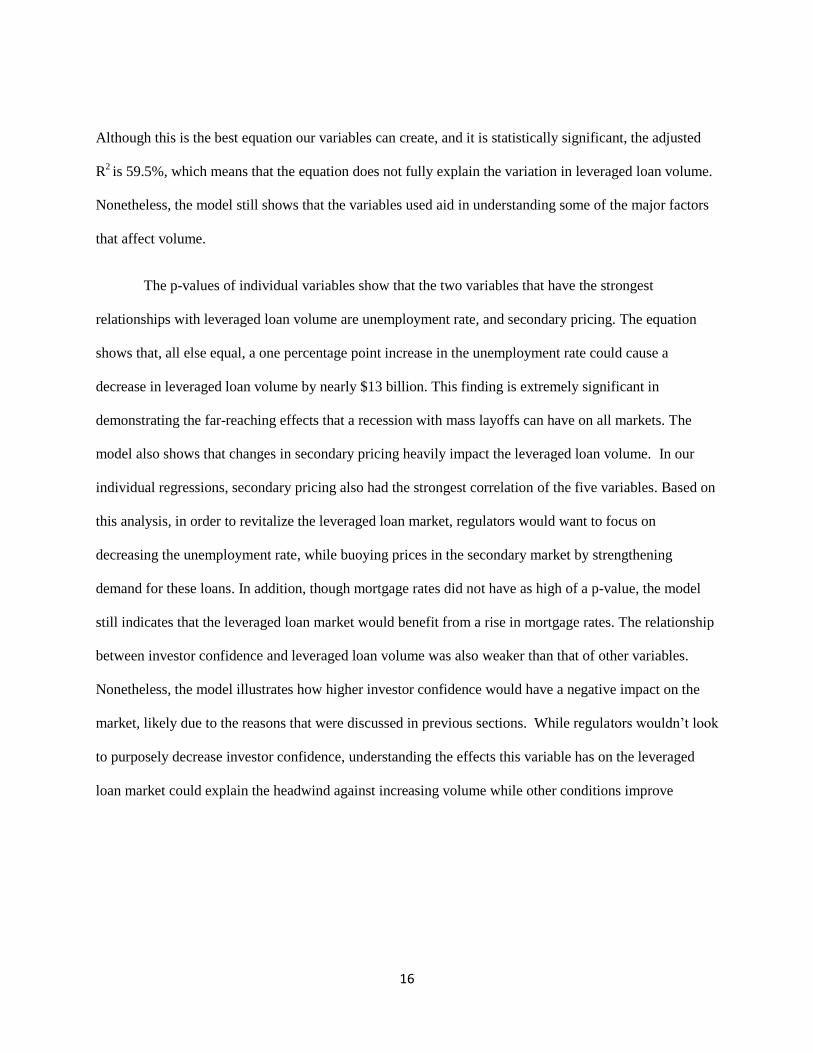
Although this is the best equation our variables can create, and it is statistically significant, the adjusted
R2 is 59.5%, which means that the equation does not fully explain the variation in leveraged loan volume.
Nonetheless, the model still shows that the variables used aid in understanding some of the major factors
that affect volume.
The p-values of individual variables show that the two variables that have the strongest
relationships with leveraged loan volume are unemployment rate, and secondary pricing. The equation
shows that, all else equal, a one percentage point increase in the unemployment rate could cause a
decrease in leveraged loan volume by nearly $13 billion. This finding is extremely significant in
demonstrating the far-reaching effects that a recession with mass layoffs can have on all markets. The
model also shows that changes in secondary pricing heavily impact the leveraged loan volume. In our
individual regressions, secondary pricing also had the strongest correlation of the five variables. Based on
this analysis, in order to revitalize the leveraged loan market, regulators would want to focus on
decreasing the unemployment rate, while buoying prices in the secondary market by strengthening
demand for these loans. In addition, though mortgage rates did not have as high of a p-value, the model
still indicates that the leveraged loan market would benefit from a rise in mortgage rates. The relationship
between investor confidence and leveraged loan volume was also weaker than that of other variables.
Nonetheless, the model illustrates how higher investor confidence would have a negative impact on the
market, likely due to the reasons that were discussed in previous sections. While regulators wouldn’t look
to purposely decrease investor confidence, understanding the effects this variable has on the leveraged
loan market could explain the headwind against increasing volume while other conditions improve
17
Observations Applied to Current Conditions
An Inherent Problem in the Market
Based on our findings, secondary market pricing holds the strongest correlation with leveraged
loan volume. However, multiple sources fear that, if banks can sell off their exposure to these loans,
underwriting standards will decrease. The Wall Street Journal reported earlier this year:
The return of big deals has some analysts worried that, in their search for yield, loan investors will
back risky buyouts and forgo certain safeguards. Debt loads being piled onto new buyout targets
remain low compared with those done in the middle of the last decade, but newer loans offer far
fewer protections for investors. Half of the leveraged loans sold in January lacked standard
protections, or covenants, compared with one-quarter in 2001, according to S&P.33
Another recent article stated, “Regulators are seeking to cut down on excessive risk taking as typical
lender protections have been stripped from credit agreements at a record pace. Speculative-grade
borrowers have raised $239.6 billion of covenant-light loans this year, more than double the amount in
2012”34
. In addition, the journal also cited a New York Federal Reserve report that read, “The
deterioration in loan underwriting has come hand-in-hand with an increased presence of retail investors in
in the leveraged loan market”35
. All these articles share the concern that, while the leveraged loan market
may show signs of recovery, the market lacks appropriate measures of protection for investors. The
investment banks’ ability to exclude the loans from their own books increases the investors’ risk.
One of the proposed regulations to address the issue of declining underwriting standards in the
market are risk-retention rules. These rules would require CLO managers to hold a portion of the debt
they package and sell.36
Advocates for this regulation argue that the collateral obligation would increase
the accountability of CLO managers, and reduce moral hazard. As reported by Bloomberg, however,
“Issuance of collateralized-loan obligations, the biggest buyers of leveraged loans, may decrease after the
33
Dugan, Ianthe Jeanne. (2013, October 7). New Alarm on Shadow Loans. Wall Street Journal, p. C3. 34
Haunss, Kristen. “Fed Loan Warning May Hurt Riskiest Borrowers, Trade Group Says.” Bloomberg. N. p., n.d.
Web. 2 Dec. 2013. 35
Dugan, Ianthe Jeanne. (2013, October 7). New Alarm on Shadow Loans. Wall Street Journal, p. C3. 36
Natarajan, Sridhar. “New CLO Regulations May Lead to Issuance Slump, Wells Fargo Says.”
Bloomberg, N. p., n.d. Web. 2 Dec. 2013.

18
implementation of new regulations, according to Wells Fargo & Co”37
. Our model agrees that a disruption
in the secondary market would negatively impact leveraged loan volume. This situation leaves regulators
in a perilous situation; on one hand, they are responsible for protecting investors. On the other hand, they
also receive pressure to structure the market in ways that would stimulate the economy. Economic
stimulus requires investment by firms, which in turn relies on funding, oftentimes from leveraged loans.
Thus, to encourage high levels of supply and demand in the leveraged loan market, financial regulators
must protect investors in ways that would not threaten the strength and growth of the secondary market.
Weakness of European Market Explained
On October 22, 2013, the Wall Street Journal reported on the slow recovery in the European
credit market. The article reads, “The supply for credit in Europe is cause for concern…[W]ithout free-
flowing lending, growth looks doomed to be anemic…[E]ven established markets, such as the loan
market for non-investment grade companies, face hurdles”38
. The article goes on to cite that, while the
U.S. market has rebounded back to 2007 levels, Europe remains at the lows it saw in 2004.
The article also attempts to distinguish possible causes that left European market in a weaker state
than that of the United States. The journalist regards the “lack of securitization” as a factor of this
weakness, and cites the small CLO market in Europe as evidence. Our findings support this assumption.
As we have demonstrated, restrictions in a secondary market would highly impact the volume of
leveraged loans outstanding. Furthermore, the article mentions that the regulator’s desire to protect
investors has; in fact, made it more difficult for investors (particularly in the retail market) to invest in
leveraged loans. While regulators seek to protect investors, their attempts may be hurting the leveraged
loan market. These regulations could be the cause for the European leveraged loan market’s anemic
growth. Our analysis, therefore, shows that if the United States chooses to implement similar regulations,
the government would put the leveraged loan market at risk.
37 Ibid. 38
Barley, Richard. (2013, October 22). Europe Should Lend Itself a Hand. Wall Street Journal, p. C10.

19
However, according to a client note by Morgan Stanley obtained by Bloomberg, although the
secondary market in Europe is weaker, the market follows safer underwriting standards. According to the
note, banks only represent 13% of the U.S. investor base in leveraged loans. In Europe, banks compose
50% of the investor base. Furthermore, 51% of loans are considered “covenant-light” loans in the U.S.,
whereas, in Europe, less than 5% of loans are considered “covenant-light”39
.
European regulations that protect investors may pose as a benefit for the leveraged loan market,
but it has also deterred companies from taking on loans. Data retrieved from Bloomberg shows that the
“bulk of the European leveraged loans signed in 2013 have been used to refinance debt, rather than to
fund buyouts or acquisitions”40
. According to their data, 71.8% of new loans in 2013 have been used as
refinancing’s compared to only 23.2% of loans in 2007. The fact that volume has decreased and is limited
to refinancing projects suggests that the European loan market’s structure is hindering mergers and
acquisitions. According to our analysis, it is very possible that a stifled, regulated secondary market could
be the cause of this problem.
Conclusion
Leveraged loans make up an important form of financing for companies whose credit rating
makes their securities lower than investment grade. Based on our analysis, strength in this market relies
on many factors, most influential of which is the pricing of leveraged loans in the secondary market.
However, introducing regulations to protect investors in the United States could hurt the leveraged loan
market. The regulations that were recently applied to the European leveraged loan market have negatively
impacted loan volume, and the United States should consider these results when changing the standards of
their own market.
39 Amodeo, Jeannine. (2013). U.S. Loans More ‘Issuer-Friendly’ Than Europe, MS Says. Bloomberg. 40
Anonymous. “ING Promotes Leveraged Loans.” Global Investor 136 (2000): 12. Print.

20
References
Anonymous. “Cash for Clunkers.” The Salt Lake Tribune 11 June 2009. ProQuest. Web. 2 Dec. 2013.
Anonymous. “ING Promotes Leveraged Loans.” Global Investor 136 (2000): 12. Print.
Amodeo, Jeannine. (2013). U.S. Loans More ‘Issuer-Friendly’ Than Europe, MS Says. Bloomberg.
Anziovar, Craig, and Lisa Kasparian. "Leveraged Loans: A Q&A with Lisa Kasparian." Analyst Report.
Pyramis Global Advisors, Aug. 2011. Web. Nov. 3.
Barley, Richard. (2013, October 22). Europe Should Lend Itself a Hand. Wall Street Journal, p. C10.
Blau, Jonathan, Daniel Sweeney, and Karen Friedlander. "Leveraged Finance Outlook." Fixed Income
Research. Credit Suisse, 3 Dec. 2012. Web. 5 Nov. 2013. <http://www.credit
suisse.com/researchandanalytics>.
Bowman, Louise. “Leveraged Loans: Desperate Times.” Euromoney (2008): 28. Print.
Cross, Tim. "With Credit Cheap, Leveraged Loan Repricing Skyrockets." Forbes. Forbes Magazine, 10
Apr. 2013. Web. 5 Nov. 2013. <http://www.forbes.com/sites/spleverage/2013/04/10/with-credit
cheap-leveraged-loan-repricing-volume-skyrockets/>.
“Dingell Hails Job Creation Through Entrepreneurship Act.” Targeted News Service 20 May 2009.
ProQuest. Web. 2 Dec. 2013.
Dugan, Ianthe Jeanne. (2013, October 7). New Alarm on Shadow Loans. Wall Street Journal, p. C3
Giovacco, Krista, and Sridhar Natarajan. "Junk Loans Approach $1 Trillion as Standards Dip: Credit
Markets." Weblog post. Bloomberg Inc., 4 Nov. 2013. Web. 5 Nov. 2013.
Greenfield, Kent. "Leveraged Buyouts." Dictionary of American History. Ed. Stanley I. Kutler. 3rd ed.
Vol. 5. New York: Charles Scribner's Sons, 2003. 84-85. Gale Virtual Reference Library. Web. 1
Dec. 2013.
Haunss, Kristen. “Fed Loan Warning May Hurt Riskiest Borrowers, Trade Group Says.” Bloomberg. N.
p., n.d. Web. 2 Dec. 2013.
Hatfield, Paul, and Simon Perry. "Investing in Debt: Opportunities in Leveraged Loans." Asset
Management. BNY Mellon, June 2010. Web. 4 Nov. 2013.
<http://us.bnymellonam.com/core/library/documents/knowledge/AlphaTrends/s_alcentra_levgdl
ans.pdf>.
"High Yield Bonds vs Leveraged Loans." The T Report. TF Market Advisors, 28 June 2013. Web. 5 Nov.
2013. <http://www.tfmkts.com/the-t-report-high-yield-bonds-vs-leveraged-loans/>.
Jarvis, William. Vault Career Guide to Leveraged Finance. New York: Vault, 2007. Print.
Johnson, Michael. "PowerShares Debuts Senior Loan ETF (BKLN)." ETF Database. N.p., 3 Mar. 2011.
Web. 4 Nov. 2013. <http://etfdb.com/2011/powershares-debuts-senior-loan-etf-bkln/>.

21
Koons, Cynthia. “Libor Sinks Leveraged Loans.” Wall Street Journal, Eastern edition 26 Jan. 2008 : B.5.
Print.
Levisohn, Ben. “‘Leveraged Loans’ Look Good.” Wall Street Journal (Online) 12 Oct. 2012 : n/a. Print.
“Leveraged Loans.” FT.com (2008): n. pag. ProQuest. Web. 2 Dec. 2013.
Natarajan, Sridhar. “New CLO Regulations May Lead to Issuance Slump, Wells Fargo Says.”
Bloomberg, N. p., n.d. Web. 2 Dec. 2013.
Nordenfelt, Niklas, and Paolo Villasenor. "Understanding Bank Loans: Opportunities for Diversification
and Risk Reduction." Analyst Report. Wells Capital Management, Dec. 2008. Web. 1 Nov. 2013.
Norton, Dale. "Why Leveraged Loans Have Followed High Yield Bonds." Market Realist, 24 Oct. 2013.
Web. 5 Nov. 2013. <marketrealist.com/2013/07/why-leveraged-loans-have-followed-high-yield
bonds-part-1/>.
Persaud, Chris. "Great Recession Timeline." Bankrate. Bankrate, Inc., 16 Sept. 2013. Web. 03 Nov. 2013.
Phlegar, Jeffrey. "Bank Loans vs. High Yield Bonds And The Hunt For Safety." Intelligent Investing.
Forbes Magazine, 07 Mar. 2013. Web. 5 Nov. 2013.
<http://www.forbes.com/sites/investor/2013/03/07/bank-loans-vs-high-yield-bonds-and-the-hunt
for-safety/>.
Salstrom, Jon. "High Yield versus Leveraged Loan: Bond Math Relativity." JP Morgan GFICC Blog.
J.P. Morgan Asset Management, 30 May 2013. Web. 5 Nov. 2013.
<http://blog.jpmorganinstitutional.com/2013/05/high-yield-versus-leveraged-loan-bond-math
relativity/>.
Saunders, Anthony, and Marcia Millon. Cornett. Financial Markets and Institutions: A Modern
Perspective. 5th ed. N.p.: McGraw-Hill/Irwin, 2012. Print.
Schwarzberg, Jonathan. "Leveraged Loans Are Being Issued Like It's 2007." The Deal. The Street, 4 Oct.
2013. Web. 6 Nov. 2013. <http://www.thestreet.com/print/story/12059560.html>.
“US Bankruptcy Reform May Hit Leveraged Loans.” Euroweek (2013): n. pag. ProQuest. Web. 2 Dec.
2013.
Wirz, Matt, and Patrick McGee. “Leveraged-Loan Market Heats Up.” Wall Street Journal (Online) 1
Mar. 2013 : n/a. Print.
22
Appendix
Exhibit 1:
0.00
10.00
20.00
30.00
40.00
50.00
60.00
70.00
80.00
90.00US vs. European Leveraged Loan Volume
Euro Volume (in US$B) US Volume (in US$B)
Source: Capital IQ LCD

23
Exhibit 2:
Exhibit 3:

24
Exhibit 4:
Exhibit 5:

25
Exhibit 6:
Exhibit 7:
0.00
20.00
40.00
60.00
80.00
100.00
120.00
140.00
Jan
-09
Ap
r-0
9
Jul-
09
Oct
-09
Jan
-10
Ap
r-1
0
Jul-
10
Oct
-10
Jan
-11
Ap
r-1
1
Jul-
11
Oct
-11
Jan
-12
Ap
r-1
2
Jul-
12
Oct
-12
Jan
-13
Ap
r-1
3
Jul-
13
US Volume vs. North American Investor Confidence
US Volume (in US$B) North American Investor Confidence
26
Exhibit 8:
Exhibit 9:

27
Exhibit 10:
Exhibit 11:

28
Exhibit 12:
Exhibit 13:
Final Regression Relationship:
Monthly US Leveraged Loan Volume = 1.533(US Secondary Pricing) – 0.468(Investor
Confidence) – 13.557(Unemployment Rate) + 11.263(Thirty Year Fixed Mortgage Rate) –
6.746(Three-Month LIBOR Rate) + 6.546
Correlation: r2 = 0.625, r = 0.790
Exhibit 14:
Variable Correlation P-Value
Secondary Pricing 0.661 0.000
3-Month Libor -0.399 0.002
Investor Confidence -0.265 0.046
Unemployment Rate -0.594 0.000
30-Year Fixed Mortgage Rate -0.599 0.000
0
10
20
30
40
50
60
70
80Ja
n-0
9
Ap
r-0
9
Jul-
09
Oct
-09
Jan
-10
Ap
r-1
0
Jul-
10
Oct
-10
Jan
-11
Ap
r-1
1
Jul-
11
Oct
-11
Jan
-12
Ap
r-1
2
Jul-
12
Oct
-12
Jan
-13
Ap
r-1
3
Jul-
13
Bill
ion
s o
f U
SD
Predicted vs. Actual Volumes
Adjusted Predicted Volumes (in US$B) US Volume (in US$B)

29
Exhibit 15:
Stepwise Regression: US Volume (i versus North Americ, US Unemploym, ... Alpha-to-Enter: 0.15 Alpha-to-Remove: 0.15
Response is US Volume (in US$B) on 4 predictors, with N = 57
Step 1 2 3 4 5
Constant 116.3 116.5 179.0 181.5 201.9
30 Year Fixed Mortage Rate -19.8 -17.6 -3.9
T-Value -5.54 -5.01 -0.83
P-Value 0.000 0.000 0.409
3 Month LIBOR Rate -23.6 -36.3 -39.5 -43.0
T-Value -2.53 -4.10 -4.92 -5.32
P-Value 0.015 0.000 0.000 0.000
US Unemployment Rate (Seasonall -13.5 -15.6 -14.0
T-Value -3.98 -6.89 -5.93
P-Value 0.000 0.000 0.000
North American Investor Confide -0.34
T-Value -1.84
P-Value 0.071
S 16.7 15.9 14.1 14.0 13.7
R-Sq 35.86 42.63 55.85 55.27 57.96
R-Sq(adj) 34.69 40.51 53.35 53.62 55.58
Mallows Cp 27.1 20.6 6.1 4.8 3.5
Exhibit 16:
30
Glossary American Recovery and Reinvestment Act (2009): provides banks a desperately needed sum
of capital that granted banks the ability to distribute more resources as leveraged loans to
besieged corporations across the country
Cash for Clunkers Program (2009): A bill that provides vouchers of up to $4,500 for buyers
who trade in their cars for more fuel-efficient vehicles41
.
CLO: A type of collateralized debt obligation that pool leveraged-loans and slice them into
securities of varying risk and return
Covenant Lite: Covenant lite refers to the reduction in restrictions needed to prove a company’s
credit worthiness when applying for a loan.
Cram-Down: A “cram-down” occurs when a loan re-pricing is completed via amendment, as
opposed to syndication.
Job Creation Through Entrepreneurship Act (2009): Grants resources for small businesses
and entrepreneurial start-ups to create jobs and drive economic growth.42
LIBOR: the rate at which banks borrow unsecured funds from other banks in the London’s
wholesale money market
S&P LSTA U.S. Leveraged Loan 100 Index: is a market value-weighted index designed to
mirror the U.S. syndicated leveraged loan secondary market (methodology).
Securities and Exchange Commission: Oversees various markets to promote fair dealing,
disclosure of important information, and to prevent fraud.43
The Sharpe Ratio: Provides a comparable measure for risk-adjusted performance by subtracting
the risk-free rate (often the 10-year U.S. Treasury bond) from the rate of the return of a portfolio,
and dividing the resulting figure by the standard deviation of the portfolio.
41 Anonymous. “Cash for Clunkers.” The Salt Lake Tribune 11 June 2009. ProQuest. Web. 2 Dec. 2013. 42
“Dingell Hails Job Creation Through Entrepreneurship Act.” Targeted News Service 20 May 2009. ProQuest.
Web. 2 Dec. 2013. 43
"Securities and Exchange Commission (SEC)." USA.gov: The U.S. Government's Official Web Portal. N.p., n.d.
Web. 02 Dec. 2013.