longevityhedgesforlonglongevity hedges for long term …iltciconf.org/2017/index_htm_files/17 -...
TRANSCRIPT

Actuarial & Finance
Longevity Hedges for LongLongevity Hedges for Long Term Care: Why and How?
Larry RubinPwC
March 26th, 2017

Agenda
• Executive Summary
• Long Term Care Businesses’ Exposure to LongevityLong Term Care Businesses Exposure to Longevity
• Cost/Benefit Analysis of Longevity Swaps
LTC Liability Hedging 2

Executive SummaryExecutive Summary
LTC Liability Hedging 3

Executive Summary
• Long term care businesses have a substantial exposure to longevity experience (e.g., a duration of 15 with respect to longevity), which overwhelms other significant risks (e.g. investment risk, incidence risk).
• A longevity swap can help hedge the earnings of the business to longevity experience• A longevity swap can help hedge the earnings of the business to longevity experience over time, and can help reduce the amount of economic capital required (at a low cost of capital).
• Both the hedge structure and the syndication process could be customized relative your prioritized strategic objectivesyour prioritized strategic objectives.
• There will be competing strategic objectives whose prioritization would lead to different optimal structures.o For example, if inexpensive capital relief is the primary objective, out-of-the-money
stop loss reinsurance (with an asymmetric payout) is likely appropriate.o Alternatively, if the primary objective is hedging longevity across the complete
distribution of earnings outcomes over time, then a swap structure (with a symmetric payout) is likely more appropriatey p y ) y pp p
LTC Liability Hedging 4

Long Term Care Businesses’ ExposureLong Term Care Businesses Exposure to Longevity
LTC Liability Hedging 5

The Challenges of Long Term Care
• Compared to most other insurance products, long term care has more moving parts• Each moving part is an opportunity for adverse experience
• InflationMarket
riskMarket
risk• Interest rates
BehaviorBehavior
• Lapses• Benefit Utilization Mortality and
MorbidityMortality and
Morbidity• Mortality
Underwriting• Improvement
• Benefit Utilization
LTC Liability Hedging 6
Improvement• Disability/Recovery

Product Assumptions Heat Map
•The sample heat map illustrates the number of critical assumptions for Long Term Care as compared to typical insurance products
Whole Life Term ULSG VUL IUL LTC
Actuarial AssumptionsMortality – Standard M H H H H H
Mortality - Substandard M H H M M M
Lapse/Surrender M H H M M Hp
Partial Withdrawals L L LDynamic Lapse L L L L MPremium Persistency H M M
Benefit Utilization HBenefit Utilization HClaim Termination L HPremium Rate Increase Approval L HMorbidity Improvement L HMorbidity (including LTC Riders) L L L L L HMorbidity (including LTC Riders) L L L L L H
High Sensitivity
Moderate Sensitivity
Low Sensitivity
No Sensitivity
LTC Liability Hedging 7

Long Term Care Exposure to Longevity
• Longevity impacts long term care business in two ways:o If healthy lives experience longevity that is greater than expected, the company
needs to establish additional reserves for the greater number of lives in force.If disabled lives experience longevity that is greater than expected the companyo If disabled lives experience longevity that is greater than expected, the company will pay claims for a longer period of time than expected.
LTC Liability Hedging 8

LTC Earnings: Unhedged Sensitivities
Assumptions:
1) Initial active life reserve is $5 6bn for the sample book of business used above1) Initial active life reserve is $5.6bn for the sample book of business used above.
2) PVOE represents present value of operating earnings (product cash flows and changes in reserves)
3) 80 year projections of operating income
4) Operating earnings are discounted at Treasury forwards
LTC Liability Hedging 9
4) Operating earnings are discounted at Treasury forwards
5) Sensitivities do not impact reserve valuation assumptions

LTC Durations: Interest Rates, Incidence and Longevity
Assumptions:
1) Sensitivities based on 80 year cash flow projections for both active and disabled lives
2) Projected cash flow are discounted at Treasury forwards and include benefits, expenses and premiums
3) Longevity/incidence durations represent percentage changes in present value of cash fl f b i i t ll l hift i l it /i id
LTC Liability Hedging 10
flows for a 1 basis point parallel shift in longevity/incidence

Longevity Swap: Hedged Sensitivities($m)
Assumptions:
1) PVOE represents present value of operating earnings (product cash flows and changes in reserves)1) PVOE represents present value of operating earnings (product cash flows and changes in reserves)
2) Initial active life reserve is $5.6bn for the sample block of business above
3) 80 year projections of operating income and swap
4) Annual reinsurer risk margin on PV of expected payments is 4%
LTC Liability Hedging 11
4) Annual reinsurer risk margin on PV of expected payments is 4%

Cost/Benefit Analysis of Longevity SwapCost/Benefit Analysis of Longevity Swap
LTC Liability Hedging 12

Cost/Benefit Analysis of Longevity Swap
• Currently RBC does not have a capital charge for longevity. To estimate the economic capital for longevity on long term care, we applied the Solvency II standard formula to a mature book of LTC liabilities. This resulted in a capital requirement of approximately p q pp y27% of the book reserve.
• Assuming a 10% cost of capital on this required capital, produces a cost of 2.7% of reserves per year (which amortizes over time).
• If the bid/offer for the longevity swap is 4% on the expected benefit payments per year, this produces a one time upfront PV cost of 4% 0f reserves. If your book is in loss recognition, this would be an addition to the loss recognition reserve. If not, then the cost would be amortized over the life of the book.
LTC Liability Hedging 1313

Cost/Benefit Analysis of Longevity Swap (cont’d)
Depending upon the preferred metric, one could view this as:
• The economic cost of capital of the transaction will be 2% to 6% depending upon the p p g pspecifics and whether done in option (lower cost of capital) or swap (higher) form.
• Under the Solvency II framework scenario where a company is in loss recognition, the net benefit of the transaction is an annual annuity of 2.7% of reserves (amortizing
ti ) i th 4% f f t if t d i f Thi i thover time) minus the 4% of reserves upfront, if executed in swap form. This is the equivalent to a 70% return on capital.
• The equivalent rate increase request under the stress scenario would be over 400%.
LTC Liability Hedging 1414

Mortality Sensitivity Comparison
0.35
The dashed line shows the 1994 GAM Table with a 20% i i l i ( h d d f l hif d
0.25
0.3increase in longevity (the standard formula shift under
Solvency II).
As can be seen, the 20% sensitivity is a smaller change to the 1994 tables than the
longevity represented by the 2012 IAM table
0.15
0.2longevity represented by the 2012 IAM table.
0.05
0.1
065 66 67 68 69 70 71 72 73 74 75 76 77 78 79 80 81 82 83 84 85 86 87 88 89 90 91 92 93 94 95 96 97 98 99 100
1994 GAM 1994 GAM with 20% shock 2012 IAM
• The above chart shows the 1994 Uninsured Pensioner (UP-94) Mortality Table (formerly
LTC Liability Hedging 1515
called the 1994 GAM Basic Table) compared with the 2012 Individual Annuity Mortality (IAM) Basic Table using a mix of 65% females and 35% males.

Closing Remarks
• Impact of longevity risk overwhelms other significant risks
• Even though RBC does not have a charge for longevity, a properly structured ORSA report should include aa properly structured ORSA report should include a significant capital requirement for longevity, which could be addressed with this structure.
LTC Liability Hedging 16

Actuarial & Finance
Investing and Hedging forInvesting and Hedging for Long Duration Liabilities
Mike Huff, TIAAMarch 27th, 2017
Statements and opinions are those of the presenter and do not reflect the views of his employer. Any reference to investment/hedging results or accounting treatment reflects the presenter’s general observations of and should not be relied upon as investment or accounting advice.

Agenda
• Challenges of Managing Investments and Hedging for Long
Duration LiabilitiesDuration Liabilities
• Alternative Hedging Strategies & Considerations
• Conclusions
LTC Liability Hedging 18

Challenges of Managing Investments and Hedging for Long Duration Liabilities
Key Problem: Reinvestment Risk– Can’t Invest in Appropriate Assets to Match Liabilitiespp p
Similar ALM Challenges Across ProductsLong Term Care Annuity Products with GuaranteesLong Term Care Annuity Products with GuaranteesUniversal Life Pensions
Reasons that Reinvestment Problem Exists:Reasons that Reinvestment Problem Exists:1) Supply of Long Duration Assets
- Very few 30+ Year AssetsNot Enough Market Supply of “Attractive” 20 30 Year Assets- Not Enough Market Supply of Attractive 20-30 Year Assets
2) Company will Receive Cash in the Future (Premiums/Contributions)- Can’t Invest Right Now. Need to Wait Until Cash is Received to Invest.
LTC Liability Hedging 19
Can t Invest Right Now. Need to Wait Until Cash is Received to Invest.

Reinvestment Risk
Measures of Reinvestment RiskCash Flow Mismatches Duration MismatchesKey Rate Duration DV01/KRDV01 MismatchesKey Rate Duration DV01/KRDV01 Mismatches
Scenario Analysis & Stress Testing of Balance Sheet and Income
How Does Reinvestment Risk Emerge?Volatility in Future Earningsy gVolatility in Future SurplusVolatility in Economic Balance Sheet
-Volatility of Economic Balance Sheet is Leading Indicator of-Volatility of Economic Balance Sheet is Leading Indicator of Volatility in Future Financial Performance
LTC Liability Hedging 20
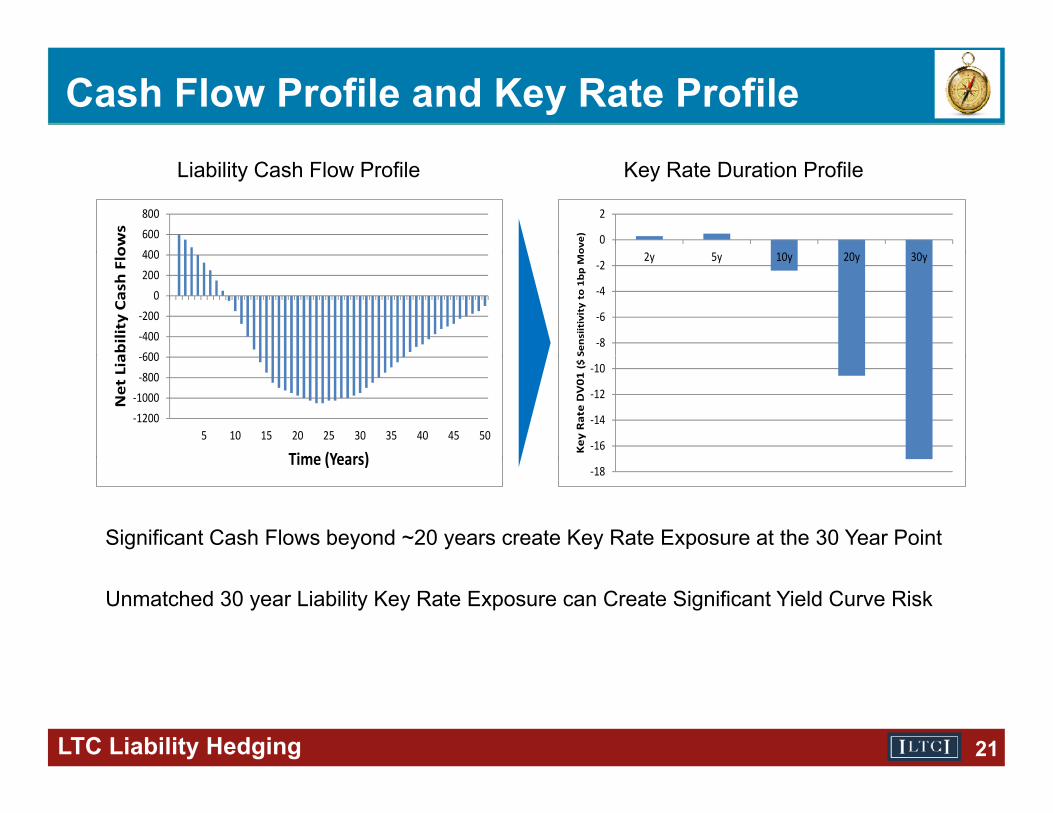
Cash Flow Profile and Key Rate ProfileLiability Cash Flow Profile Key Rate Duration Profile
400600800
ows
0
2
2 5 10 20 30ove)
600‐400‐200
0200400
ability Cash Flo
‐8
‐6
‐4
‐22y 5y 10y 20y 30y
Sensiitivity to 1bp M
o
‐1200‐1000‐800‐600
5 10 15 20 25 30 35 40 45 50
Net Lia
Time (Years)‐16
‐14
‐12
‐10
Key
Rate DV01
($ S
Significant Cash Flows beyond ~20 years create Key Rate Exposure at the 30 Year Point
Time (Years)‐18
Unmatched 30 year Liability Key Rate Exposure can Create Significant Yield Curve Risk
LTC Liability Hedging 21

Alternative Solutions for
Hedging Reinvestment Risk
LTC Liability Hedging 22

Reinvestment Risk Hedging Solutions
Ideal Solution:Buy Assets to Cash Flow Match to Liability Cash Flows
Alternative Hedging Solutions:Hedges for Purchases of Future InvestmentsForward Starting Swaps Forward UST Bonds
Hedges for Key Rate Duration/DV01 ExposuresInterest Rate Swaps UST Total Return Swaps
Option HedgesPurchased Floor/Swaption Costless Collar (Buy Floor/Sell Cap)
On Balance Sheet Solutions
LTC Liability Hedging 23
UST Bond/Strip + CDS UST Bonds Funded on Repo + CDS

Hedges for Future Investments
Forward Starting SwapsForward UST BondsEconomically Locks-in Yield on a Bond to be Purchased in the Futurey
3 3 3 3 3? ? ? ? ?
2
3
45y5y Reinvestment Risk in Year 5
3 3 3 3 33 3 3 3 32
3
4 5y5y Reinvestment Risk Hedged
‐2 ‐2 ‐2 ‐2 ‐2 ‐2 ‐2 ‐2 ‐2 ‐2
? ? ? ? ?
‐2
‐1
0
1
Yield
Asset Yield
Liability Yield
‐2 ‐2 ‐2 ‐2 ‐2 ‐2 ‐2 ‐2 ‐2 ‐2‐2
‐1
0
1
Yield Asset Yield
FSS/FB Yield
Liability Yield
Considerations:
‐31 2 3 4 5 6 7 8 9 10
Time (years)
‐31 2 3 4 5 6 7 8 9 10
Time (years)
Cleared vs. OTC DerivativeMargin Issues & Impact on Investment StrategyHedge Tenor (Forward Bonds Only Available for Shorter Tenors)S ap Spreads (UST Rates > S ap Rates)
LTC Liability Hedging 24
Swap Spreads (UST Rates > Swap Rates)Accounting

Hedges for Key Rate Duration Exposure
Interest Rate SwapsTotal Return Swaps (TRS) on UST BondsEnter Hedges with KRD Exposures that Offset Liability KRD Exposureg p y p
5
10
15
to 1bp
Move)
Asset/Liability Key Rate Profile
5
10
15
to 1bp
Move)
Asset/Liability Key Rate Profile
‐10
‐5
02y 5y 10y 20y 30y
Rate DV0
1 ($ Sen
siitivity t
Asset DV01
Liability DV01‐10
‐5
02y 5y 10y 20y 30y
Rate DV0
1 ($ Sen
siitivity t
Hedge DV01
Asset DV01
Liability DV01
Considerations:
‐20
‐15
Key R
Mismatch
‐20
‐15
Key R Mismatch (Pre‐Hedge)
Mismatch (Post‐Hedge)
Cleared vs. OTC DerivativeMargin/Settlement Issues & Impact on Investment StrategyHedge Tenor (TRS Only Available for Shorter Tenors)S S d (UST R S R )
LTC Liability Hedging 25
Swap Spreads (UST Rates > Swap Rates)Accounting

P h R t Fl /S ti
Interest Rate Option StrategiesPurchase Rate Floor/SwaptionEnsures that Yield for Future Investment will not be below Certain Level(Strike) - Requires Premium
Costless Collar (Buy Floor/Sell Cap)( y p)Ensures that Yield for Future Investment will be with in a band of Interest Rates- No Upfront Premium- Opportunity Cost – Give up the upside if rates rise above the cap
2 00%
2.50%
3.00%
3.50%
4.00%
4.50%
5.00%
dged
Yield
Purchased Option Profile
2.50%
3.00%
3.50%
4.00%
4.50%
5.00%
dged
Yield
Costless Collar Profile
1.00%
1.50%
2.00%
1.00%
1.50%
2.00%
2.50%
3.00%
3.50%
4.00%
4.50%
5.00%
Hed
Market Yield
1.00%
1.50%
2.00%
1.00%
1.50%
2.00%
2.50%
3.00%
3.50%
4.00%
4.50%
5.00%
Hed
Market Yield
Considerations:Usually OTC DerivativeOption Premium vs. Opportunity CostHedge Tenor (Short Term/Roll Hedge vs Long Term)
LTC Liability Hedging 26
Hedge Tenor (Short Term/Roll Hedge vs. Long Term) Accounting

On Balance Sheet Strategies
Purchase Long Duration UST Bond/Strip + Credit DerivativeSynthetically Creates Long Duration Corporate Bond
Purchase UST Bond, Funded with Repo + Credit Derivative Creates Similar Profile to Interest Rate Swap (Receive Fixed, Pay Floating)CDS adds Corporate Credit Exposure & Credit Spread
Considerations:Alternative Uses of Cash to Purchase USTAlternative Uses of Cash to Purchase USTIncreases Balance Sheet SizeCounterparty RiskLeverageRepo Roll RiskCDS Roll Risk (Future spread not locked in)Accounting (Repo Accounting, CDS Accounting)CDS M i i
LTC Liability Hedging 27
CDS Margining

Conclusions
Caveat:Investing & Hedging Strategies for Managing Interest Rate Risk are based
Li bilit C h Fl P j tion Liability Cash Flow Projections.
Asset Strategy can only be as good as the Liability Cash Flow Projections.
Conclusions:1) No Simple Solutions2) Measure Your Risk (even if you don’t hedge it)3) Quantify Tradeoffs & Risks for Each Hedging Strategy4) Understand and Communicate Why You Are Selecting One Strategy ) y g gyOver Another
LTC Liability Hedging 2828

Questions?Questions?
LTC Liability Hedging 2929