longevity: the underlying driver of retirement risk 2005 risks and
TRANSCRIPT

Key Findings and IssuesLongevity: The Underlying Driver of Retirement Risk 2005 Risks and Process of Retirement Survey Report
July 2006

1
Introduction and Background
America’s Baby Boomers are at the threshold of the most widely heralded passage into retirement of any generation. Maturing into senior citizen status brings to the forefront major concerns for their financial security and wellness. In light of our aging society, changes in employee benefits, and volatility of financial markets, retirement and its risks should be understood as a critical issue for all Americans, not just retirees. Individuals must now bear ever greater responsibility for managing their own assets as more employers abandon traditional defined benefit pension plans for defined contribution plans such as 401(k)s and self-directed IRAs. Retirees and those near retirement are, at best, only vaguely aware of the implications of taking on not just investment risks but also the longevity component of their financial security. Compounding these issues are changes in how Americans choose to work, leave the labor force, or partially retire.
The very concept of retirement itself is also undergoing change, as people ‘reinvent’ their lives. Traditionally, retirement planning focused on theperiod preceding retirement. Several years ago, the Society of Actuaries, recognizing the need to address the management of risk after retirement, instituted a Retirement Needs Framework Project. As part of this project, the Society has had research on public attitudes toward retirement in 2001, 2003 and 2005 conducted on its behalf by Mathew Greenwald & Associates, Inc., and by the Employee Benefit Research Institute (EBRI).
The purpose of the latest in this series, the 2005 Risks and Process of Retirement Survey, is to evaluate Americans’ awareness of such risks, how their awareness has changed since 2003, and how it affects the way they manage their finances. This report focuses on attitudes toward longevity specifically in the context of planning for and managing the financial risk of outliving assets in retirement, and relates the public’s understanding of these issues to other studies. Three other reports cover in greater depth the process of retirement, other post-retirement risks, and retirement issues of special concern to women. The 2001, 2003 and 2005 studies separately analyzed current retirees and those not yet retired, referred to in these reports as ‘pre-retirees.’
The 2005 Survey was conducted through telephone interviews of 602 adults age 45 to 80 (302 retirees, 300 pre-retirees). A description of methodologies and some discussion about the populations studied follows.
Households were selected for the Survey from a nationwide targeted list sample. At the 95% confidence level, the margin of error for study results is ±6 percentage points. The results of the Survey apply to Americans on average, without providing specific insights into behaviors and values of high net worth individuals. Only 2% of individuals in the Survey reported $1 million or more in savings and investments. Four percent of pre-retirees and 9% of retirees report savings and investments of between $500,000 and $1,000,000. Fifteen percent of pre-retirees and 10% of retirees report household incomes of at least $100,000. At the low income end of the spectrum, however, 15% of pre-retirees and 21% of retirees report incomes less than $25,000.
This report summarizes the Survey results, giving special focus to issues surrounding life expectancy. It examines retiree expectations as to their own longevity, and the resulting implications for planning to have sufficient assets to cover living longer than expected. Simply put, in the face of increasing longevity, retirees may prematurely deplete their assets if they do not plan properly. The report explores ways to supplement gaps left by pensions and Social Security, and concludes with recommendations for this generation of retirees to enhance their financial planning and better manage the risks they will confront.

2
Understanding Life ExpectancyLongevity increased dramatically in the 20th Century, and appears to be improving further in the 21st, but by how much?
As recently as 1900, US life expectancy at birth was about 45 years for males and just below 50 for females; by 2000, it had increased to almost 75 for males and 80 for females. A wide disparity of opinion exists as to how rapidly human longevity can continue to increase. Those focusing on past trends suggest that while improvements will continue through the first several decades of the 21st century, they will be more modest, perhaps below a year each decade for males and even less for females. Other experts believe that at least an additional year of life expectancy might be gained in each decade. [1] Still other observers, noting recent breakthroughs in life-extending medical technology, predict significantly greater increases in longevity, and foresee increasing populations of seniors living well into their nineties and beyond.
In discussing longevity, it must be recognized that measures of life expectancy are based on large group averages. In the case of “personal life expectancy” for any one individual, length of life is a far more imponderable concept—its precise value will not be known until that person has died. This point is critical in that it reveals the weakness of relying on averages for planning purposes—a retiree has a 50% chance of outliving the table averages. It is also relevant to note that some mortality tables are based on segments of the population who retired with benefits from an employer-sponsored pension plan. These population segments, especially those having had the added benefit of employer-sponsored health care, come from socio-economic groups with more favorable mortality than the average for the general population. Since many values given throughout this report are based on the mortality experience of such groups, their life expectancies may exceed by a few years those of someone the same age and sex drawn from the general population. As an example, the following is a comparison of life expectancies at age 65 for pensioners in one Society of Actuaries mortality study to those for all Americans covered by Social Security.
Years of Life Expectancy at Age 65Male Female
US Social Security Population, 2005[1] 16.1 19.1SOA 1994 UP Study projected to 2005 [2] 18.2 21.2
1. US Population tables for 2003 show an increase of slightly more than one year of life expectancy for males age 65 compared to males age 65 in 1993; for females, the corresponding increase was about three-quarters of a year. Similar improvements are reflected in mortality tables widely used by actuaries. Tables prepared by the Social Security Administration based on experience in the 20th century and detailed projections of mortality through the 21st—the source of the top row of numbers in the above table—show an average increase in life expectancy at birth of about one year per decade for males and three-quarters of a year for females. At age 65 and beyond, however, the SSA’s projections are for more modest increases: about six-tenths of a year per decade for males age 65, and just under half-a-year per decade for females. Details of these statistics, historic values, projections, and probabilities of survival are shown at the end of this report.
2. Society of Actuaries 1994 Uninsured Pensioners (UP) Table, sex distinct and with projections. This table is typical of mortality for private pensions sponsored by large employers.

3
About two-thirds of respondents underestimate population longevity.
FindingAt least six in ten underestimate average life expectancy (67% retirees, 61% pre-retirees), based on the respondent’s current age. In fact, only one retiree in five (21%) and one-third of pre-retirees (35%) provide an estimate of life expectancy that is on target or higher.
4%
10% 12%
40%
20%16%
6%
42%
25%
8%5%
12%
-5+ years -1 to -4 years On target 1 to 4 years 5+ years Don't know/Refused
Retirees (n=302) Pre-retirees (n=300)
Difference between Respondent Estimate of Population Life Expectancy and Actual Population Life Expectancy[1]
Underestimate
Sources: 2005 Risks and Process of Retirement Survey1. SOA UP 1994
Overestimate

4
Many retirees and pre-retirees expect that they personally will live until at least 80 years old.
14%
6%
27%
12%16%
14%
6%
18%
11%10% 11%
19% 20%16%
Less than 75 75 to 79 80 81 to 84 85 86 or older Don't know/Refused
Retirees (n=302) Pre-retirees (n=300)
Source: 2005 Risks and Process of Retirement Survey
FindingAmong both retirees and pre-retirees, at least six in ten predict that they personally will live to be at least 80 (60% pre-retirees, 66% retirees). Just one-quarter of retirees (27%) and one in five pre-retirees (20%) believe that they will live to be 86 or older.
Until what age do you think that you, yourself, can expect to live to?
5
The two aforementioned survey findings, taken together, point to respondents’ misunderstanding of the likelihood of living to older ages and the need for planning to do so.
DiscussionOne of the survey’s surprising findings is that over 40% of pre-retirees underestimate population average life expectancy by five or more years. Even more surprising is that this finding also holds for retirees, who are, on average, closer than pre-retirees to their predicted life expectancy, and thus might it have been assumed that they could project it more accurately. Although some retirees did correctly identify average life expectancy at age 65 as around 17 years for men and 20 years for women, far too few appreciate that this means that half of them will live beyond these projections. The probability that they could live to at least 90—for the general population, this is about 20% for men and 33% for women, and is even higher for those retired with benefits from an employer-sponsored pension plan—is understood by only a small fraction of retirees.
From an actuarial perspective, individuals confront both select longevity risk—that they will be longer lived relative to their contemporaries—and aggregate longevity risk—that all of their contemporaries live longer on average than expected. Improvement in aggregate mortality increases the chance of surviving to extreme old age, which brings with it the risk of debilitating and costly illness in addition to the more general risk of outliving one’s resources. Far too many retirees grossly underappreciate the implications of longevity for their financial needs, especially if they should turn out to be among those surviving into their tenth decade.
In the US, Social Security, employer-provided defined benefit pensions, and annuities purchased from personal savings are all sources of income that can help retirees to manage their longevity risk, although aggregate longevity risk may reduce the attractiveness of the annuity market to insurance companies. Retirees who have spent a lifetime working for an employer who offered a defined benefit pension are better insured against longevity risk, especially those also eligible for Social Security benefits, which are indexed for cost of living. (Except in rare cases, private sector employer-provided pensions are not inflation indexed). By contrast, those retirees depending principally on defined contribution plans will not enjoy the same protection unless they use part or all of the proceeds to buy a life annuity. Lower income workers, provided they have a long work history, will have earned Social Security benefits that replace a substantially larger share of their income than those who had lifetime earnings closer to the upper end of the Social Security wage base. For high income earners, or low-paid workers whose labor force participation has been interrupted substantially, this degree of protection is not available.
Source: 2005 Risks and Process of Retirement Survey
6
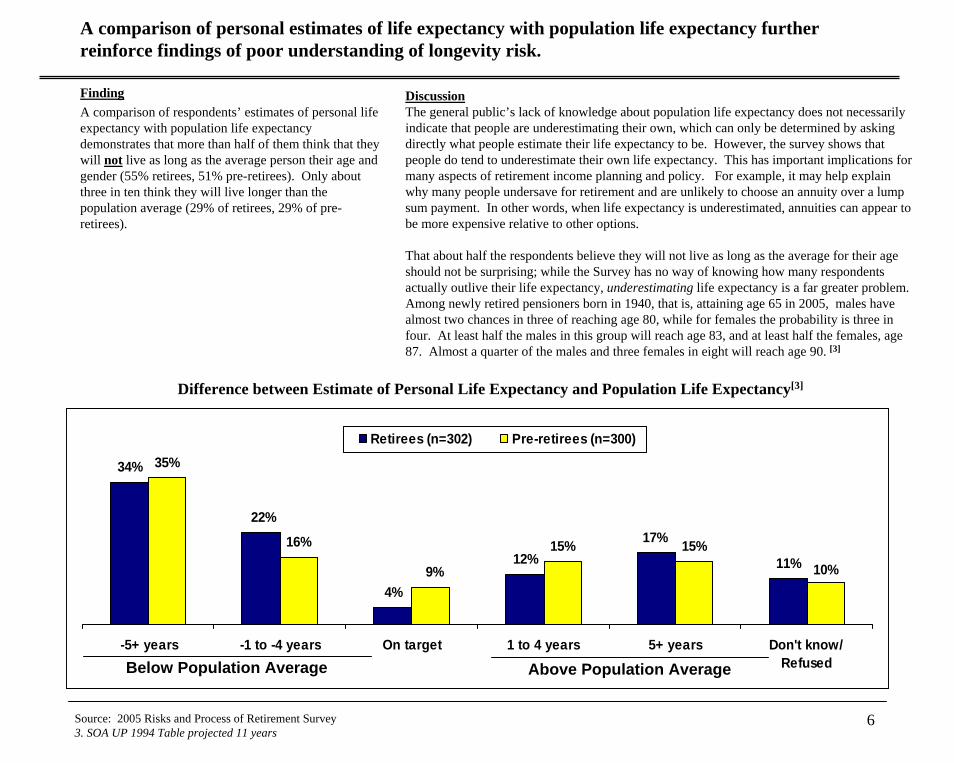
A comparison of personal estimates of life expectancy with population life expectancy further reinforce findings of poor understanding of longevity risk.
FindingA comparison of respondents’ estimates of personal life expectancy with population life expectancy demonstrates that more than half of them think that they will not live as long as the average person their age and gender (55% retirees, 51% pre-retirees). Only about three in ten think they will live longer than the population average (29% of retirees, 29% of pre-retirees).
4%
12% 11%
35%
16% 15% 15%
34%
22%17%
10%9%
-5+ years -1 to -4 years On target 1 to 4 years 5+ years Don't know/Refused
Retirees (n=302) Pre-retirees (n=300)
DiscussionThe general public’s lack of knowledge about population life expectancy does not necessarily indicate that people are underestimating their own, which can only be determined by asking directly what people estimate their life expectancy to be. However, the survey shows that people do tend to underestimate their own life expectancy. This has important implications for many aspects of retirement income planning and policy. For example, it may help explain why many people undersave for retirement and are unlikely to choose an annuity over a lump sum payment. In other words, when life expectancy is underestimated, annuities can appear to be more expensive relative to other options.
That about half the respondents believe they will not live as long as the average for their age should not be surprising; while the Survey has no way of knowing how many respondents actually outlive their life expectancy, underestimating life expectancy is a far greater problem. Among newly retired pensioners born in 1940, that is, attaining age 65 in 2005, males have almost two chances in three of reaching age 80, while for females the probability is three in four. At least half the males in this group will reach age 83, and at least half the females, age 87. Almost a quarter of the males and three females in eight will reach age 90. [3]
Difference between Estimate of Personal Life Expectancy and Population Life Expectancy[3]
Below Population Average
Source: 2005 Risks and Process of Retirement Survey3. SOA UP 1994 Table projected 11 years
Above Population Average

7
In making estimates of personal life expectancy, family history is cited most often as the rationale; personal health is the next most cited explanation.
FindingWhen asked the reason for their particular estimate of life expectancy, roughly half cite family history (45% retirees, 54% pre-retirees). Both retirees and pre-retirees reference personal health second most often. Average life expectancy is much less frequently cited as the explanation for respondents’ estimates, with just three percent of retirees and seven percent of pre-retirees mentioning it.
45%
43%
8%
3%
4%
5%
54%
30%
5%
7%
5%
4%
Retirees (n=265) Pre-retirees (n=265)
Why do you think you will live until that age?Among those providing an estimate for their life expectancy
Top Mentions
Discussion
Source: 2005 Risks and Process of Retirement Survey4. US Public Health Service, 2005
Although physicians and other students of longevity do not necessarily agree on the precise causes, most concur that in estimating “personal life expectancy,” family history and lifestyle are far more significant than are average population statistics. At age 65 and higher, the two leading causes of death in the US areheart disease and cancer, [4] both of which are widely understood to be influenced by family history and personal health habits. Next to choosing long-lived parents and grandparents, the importance of personal choices with respect to healthy lifestylehabits has, apparently, been communicated reasonably effectivelyas the factors most likely to influence length and quality of life.
Family history
Personal health
Guessing
Average life expectancy
Health habits (i.e., take care of myself, exercise, eat right)
Positive attitude (i.e., no stress, determination, enjoy myself)
8
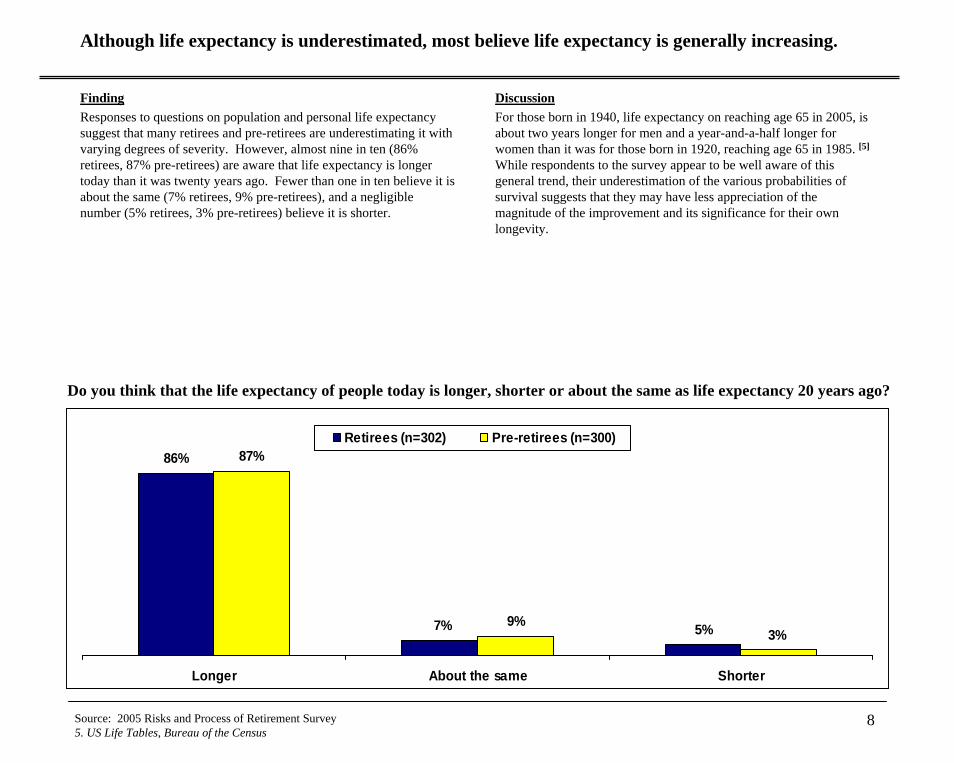
Although life expectancy is underestimated, most believe life expectancy is generally increasing.
FindingResponses to questions on population and personal life expectancy suggest that many retirees and pre-retirees are underestimating it with varying degrees of severity. However, almost nine in ten (86% retirees, 87% pre-retirees) are aware that life expectancy is longer today than it was twenty years ago. Fewer than one in ten believe it is about the same (7% retirees, 9% pre-retirees), and a negligible number (5% retirees, 3% pre-retirees) believe it is shorter.
5%
87%
9%
86%
7% 3%
Longer About the same Shorter
Retirees (n=302) Pre-retirees (n=300)
DiscussionFor those born in 1940, life expectancy on reaching age 65 in 2005, is about two years longer for men and a year-and-a-half longer for women than it was for those born in 1920, reaching age 65 in 1985. [5]
While respondents to the survey appear to be well aware of this general trend, their underestimation of the various probabilities of survival suggests that they may have less appreciation of the magnitude of the improvement and its significance for their own longevity.
Do you think that the life expectancy of people today is longer, shorter or about the same as life expectancy 20 years ago?
Source: 2005 Risks and Process of Retirement Survey5. US Life Tables, Bureau of the Census

9
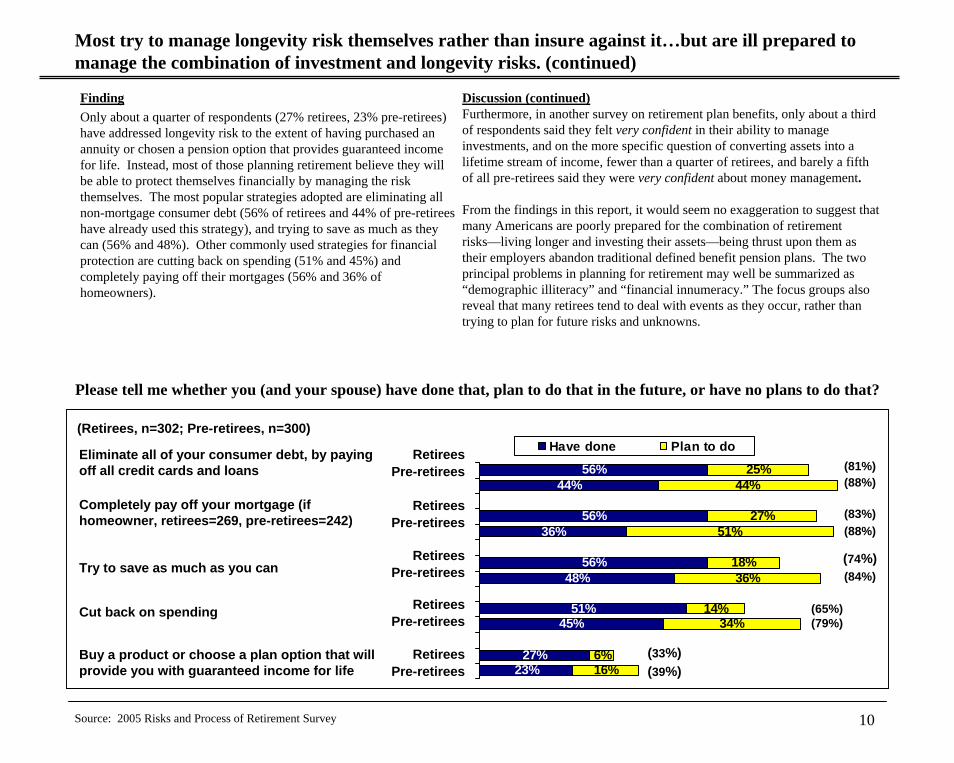
Most try to manage longevity risk themselves rather than insure against it…but are ill prepared to manage the combination of investment and longevity risks.
FindingOnly about a quarter of respondents (27% retirees, 23% pre-retirees) have addressed longevity risk to the extent of having purchased an annuity or chosen a pension option that provides guaranteed income for life. Instead, most of those planning retirement believe they will be able to protect themselves financially by managing the risk themselves. The most popular strategies adopted are eliminating all non-mortgage consumer debt (56% of retirees and 44% of pre-retirees have already used this strategy), and trying to save as much as they can (56% and 48%). Other commonly used strategies for financialprotection are cutting back on spending (51% and 45%) and completely paying off their mortgages (56% and 36% of homeowners).
56%44%
56%36%
56%48%
51%45%
27%23%
25%44%
27%51%
18%36%
14%34%
6%16%
Have done Plan to do
DiscussionUp until this point, this report has focused on the tendency of pre-retirees and retirees to underestimate longevity. From here, the report examines how longevity risk is managed, if at all.
To provide some perspective for these findings, it is instructive to review the results from a series of retiree focus groups conducted by the Society of Actuaries and LIMRA in 2005. In these focus group sessions, participants were asked to rank in order of importance six concerns expressed by retirees. These concerns included health care costs, inflation, investment returns, maintaining current lifestyle, needing long term care and outliving resources. Of the six concerns, outliving assets ranked across groups as the least important. Participants felt outliving assets was the most controllable of these risks and they could simply cut back on spending to stretch their assets, even with no other contingency plan. Clearly, this thinking impacts the priority placed on managing longevity risk and the approach for doing so.
Please tell me whether you (and your spouse) have done that, plan to do that in the future, or have no plans to do that?
(Retirees, n=302; Pre-retirees, n=300)
RetireesPre-retirees
RetireesPre-retirees
RetireesPre-retirees
RetireesPre-retirees
RetireesPre-retirees
Try to save as much as you can
Cut back on spending
Buy a product or choose a plan option that will provide you with guaranteed income for life
Eliminate all of your consumer debt, by paying off all credit cards and loans
Completely pay off your mortgage (if homeowner, retirees=269, pre-retirees=242)
(84%)(74%)
(81%)(88%)
(65%)(79%)
(83%)(88%)
(33%)(39%)
Source: 2005 Risks and Process of Retirement Survey
10
Most try to manage longevity risk themselves rather than insure against it…but are ill prepared to manage the combination of investment and longevity risks. (continued)
FindingOnly about a quarter of respondents (27% retirees, 23% pre-retirees) have addressed longevity risk to the extent of having purchased an annuity or chosen a pension option that provides guaranteed income for life. Instead, most of those planning retirement believe they will be able to protect themselves financially by managing the risk themselves. The most popular strategies adopted are eliminating all non-mortgage consumer debt (56% of retirees and 44% of pre-retirees have already used this strategy), and trying to save as much as they can (56% and 48%). Other commonly used strategies for financialprotection are cutting back on spending (51% and 45%) and completely paying off their mortgages (56% and 36% of homeowners).
56%44%
56%36%
56%48%
51%45%
27%23%
25%44%
27%51%
18%36%
14%34%
6%16%
Have done Plan to do
Discussion (continued)Furthermore, in another survey on retirement plan benefits, only about a third of respondents said they felt very confident in their ability to manage investments, and on the more specific question of converting assets into a lifetime stream of income, fewer than a quarter of retirees, and barely a fifth of all pre-retirees said they were very confident about money management.
From the findings in this report, it would seem no exaggeration to suggest that many Americans are poorly prepared for the combination of retirement risks—living longer and investing their assets—being thrust upon them as their employers abandon traditional defined benefit pension plans. The two principal problems in planning for retirement may well be summarized as “demographic illiteracy” and “financial innumeracy.” The focus groups also reveal that many retirees tend to deal with events as they occur, rather than trying to plan for future risks and unknowns.
Please tell me whether you (and your spouse) have done that, plan to do that in the future, or have no plans to do that?
(Retirees, n=302; Pre-retirees, n=300)
RetireesPre-retirees
RetireesPre-retirees
RetireesPre-retirees
RetireesPre-retirees
RetireesPre-retirees
Try to save as much as you can
Cut back on spending
Buy a product or choose a plan option that will provide you with guaranteed income for life
Eliminate all of your consumer debt, by paying off all credit cards and loans
Completely pay off your mortgage (if homeowner, retirees=269, pre-retirees=242)
(84%)(74%)
(81%)(88%)
(65%)(79%)
(83%)(88%)
(33%)(39%)
Source: 2005 Risks and Process of Retirement Survey
11
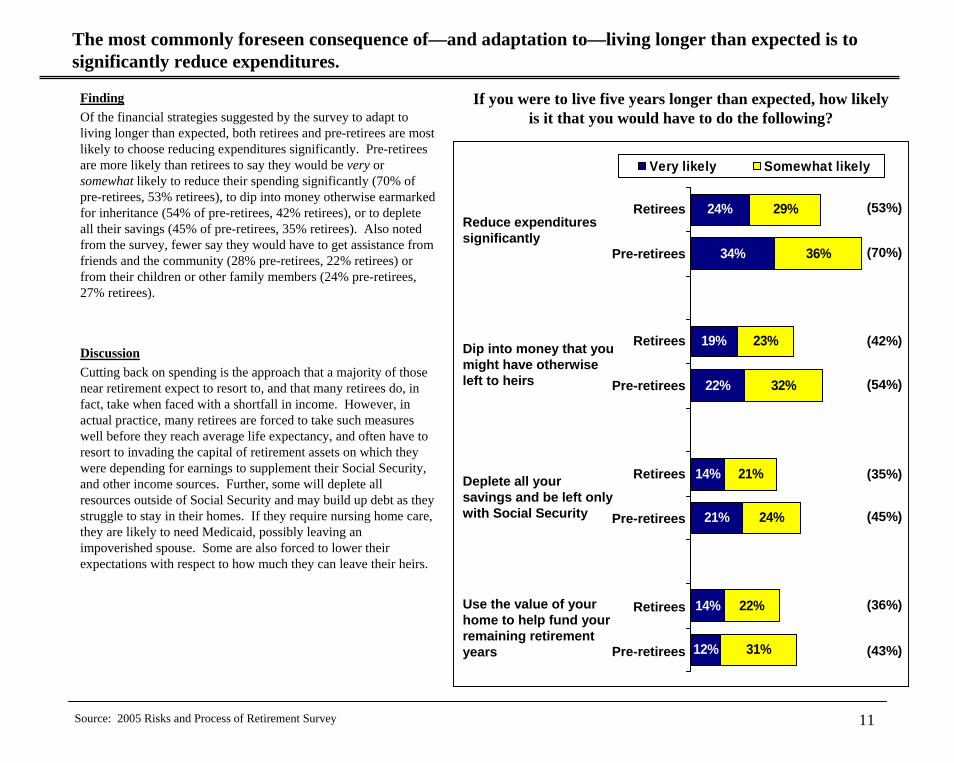
The most commonly foreseen consequence of—and adaptation to—living longer than expected is to significantly reduce expenditures.
FindingOf the financial strategies suggested by the survey to adapt to living longer than expected, both retirees and pre-retirees are most likely to choose reducing expenditures significantly. Pre-retirees are more likely than retirees to say they would be very or somewhat likely to reduce their spending significantly (70% of pre-retirees, 53% retirees), to dip into money otherwise earmarked for inheritance (54% of pre-retirees, 42% retirees), or to deplete all their savings (45% of pre-retirees, 35% retirees). Also noted from the survey, fewer say they would have to get assistance from friends and the community (28% pre-retirees, 22% retirees) or from their children or other family members (24% pre-retirees, 27% retirees).
24%
34%
19%
22%
14%
21%
14%
12%
29%
36%
23%
32%
21%
24%
22%
31%
Very likely Somewhat likely
If you were to live five years longer than expected, how likely is it that you would have to do the following?
Discussion
Source: 2005 Risks and Process of Retirement Survey
Cutting back on spending is the approach that a majority of those near retirement expect to resort to, and that many retirees do, in fact, take when faced with a shortfall in income. However, in actual practice, many retirees are forced to take such measures well before they reach average life expectancy, and often have to resort to invading the capital of retirement assets on which they were depending for earnings to supplement their Social Security,and other income sources. Further, some will deplete all resources outside of Social Security and may build up debt as they struggle to stay in their homes. If they require nursing home care, they are likely to need Medicaid, possibly leaving an impoverished spouse. Some are also forced to lower their expectations with respect to how much they can leave their heirs.
Reduce expenditures significantly
Dip into money that you might have otherwise left to heirs
Deplete all your savings and be left only with Social Security
Use the value of your home to help fund your remaining retirement years
(53%)
(70%)
(42%)
(54%)
(43%)
(36%)
(35%)
(45%)
Retirees
Pre-retirees
Retirees
Pre-retirees
Retirees
Pre-retirees
Retirees
Pre-retirees

12
Other perspectives and related information on longevity
The remainder of this report turns from the actual Survey findings and corresponding discussion to a broader perspective of issues related to longevity including products designed to protect against longevity risk.The following pages include:
•A discussion of efforts by the Society of Actuaries to explore increasing longevity and its consequences through its Living to 100 and Beyond symposia.
•A comparison of longevity issues in the United Kingdom to provide an international perspective.
•A description of products designed to insure against the risk of increasing longevity.
•A discussion for more technically oriented readers of recent studies examining future improvements in mortality.
•A primer on lessons that may be applied from behavioral economics in the context of longevity risk.

13
Living to Extreme Old Age—100 and beyond
As if the challenge of living to or beyond average life expectancy were not enough, the prospect of living to age one hundred and beyond is no longer among the remotest of possibilities. At age 65, one female in 25, and three males in 200 can be expected to become centenarians. Clearly, living to such an advanced age, coupled with generally increased longevity has direct societal, governmental, financial and product implications. The Society of Actuaries in partnership with a number of other organizations has explored the impact of this issue recently through its “Living to 100 and Beyond” symposia held every three years.
As part of these symposia, papers are presented that explore a variety of aspects related to living to older ages. The papers presented at the most recent symposium held in January 2005 have been collected in a monograph, which can be found on the Society of Actuaries website at: www.soa.org/ccm/content/research-publications/library-publications/monographs/retirement-systems-monographs/
Of particular interest at the 2005 symposium was a special discussion forum held on the implications of an aging society by a panel of distinguished experts. Key observations from that symposium include:
• Issues related to the extremely old primarily affect women. [6]
• Governments worldwide will have to reexamine their fiscal burdens because they simply will not be able to afford to provide their older citizens as much as they previously did.
• A shift in labor markets can be expected, with many older workers deferring retirement as long as possible.• There will be a much greater demand for health care services and health care workers, and issues of how care should be rationed
will need to be addressed.• Innovative private sector financial products will be needed to provide dependable resources that last potentially forty or more years
into retirement.The impact of increased longevity on social and financial systems will demand increased attention at both the public and private level.
6. In the US Census 2000, 57% of the age group 65–84 and over 70% of the age group 85 and older was female.

14
Comparisons to the United KingdomFinding
By way of comparison to one country with longevity and retirement patterns similar to those of the US, current life expectancy in the UK at age 65 is 19.4 years for men, and 22.1 years for women. This is projected to increase by 2050 to 23.6 years for men and 25.9 years for women.
These UK expectancies are about three years higher than for the US as a whole, but only a year higher than for US pensioners in the SOA 1994 study with projection to 2005. The UK projections to 2050—an average increase of almost a year per decade for men and about ten-months per decade for women—are also fractionally higher than the corresponding increase for men and about 75% higher for women than those projected through 2050 by the US Social Security Administration.
Principal life expectancy projections for Britain have been increasing rapidly. As in the US, uncertainty about the rate of increase in life expectancy presents challenges at all levels in planning for retirement. Even on the base of current data, however, individuals on average are unaware of, or do not believe the projected increases in life expectancy, or even the best estimates of life expectancy today. Other relevant observations: • Research conducted on a sample of individuals in Great Britain found that they underestimate their longevity by 4.62 years (men) and 5.95
years (women) relative to estimates from the Government Actuary’s Department data.
• Questions on the National Omnibus Survey found that nearly two-thirds (63%) of working age respondents have never tried to estimate how much they will need to save for retirement. There was great variation by age with younger respondents unsurprisingly less likely to have attempted this.
• Focus groups commissioned by the Pensions Commission presented participants with information about average life expectancy and average time spent in retirement. The life expectancy figures did not come as a surprise to most participants, who had already recognized that society is aging, but the number of years spent in retirement came as a shock to many. Indeed, the length of retirement had rarely been considered by participants or estimated. As a result, participants had not realistically estimated the funding needed for a long retirement.
Sources: UK Government Actuary’s Department 2004-based principal population projectionsUS Social Security Administration Periodic Life Tables 1900-2100The Second Report of the UK Pensions Commission; Government Actuary’s Department 2002-based principal population projectionsHow Long do People Expect to Live? Results and Implications, O’Brien, C., Fenn, P. and Diacon, S., June 2005, Centre for Risk & I Insurance
Studies, The University of Nottingham.
Discussion
The British public appear about as well—or as ill—informed of improvements in longevity and the implications for their retirement planning as their American counterparts. Americans—along with their counterparts in the Western world—need strategies to deal with these longevity risks, and with the uncertainty brought about by further increases in life expectancy.

15
Insuring against the consequences of living a long time
One strategy for participants in defined contribution plans to insure against the negative financial consequences of increasing longevity is to use a substantial share of the balance upon retirement to buy a life annuity. The greater the number of plan participants who elect this option, the better the terms their company can negotiate for them. Problems of adverse selection—those electing annuities are longer-lived than the general population—might be reduced by encouraging plan participants to commit to buying annuities at a relatively early age, provided their tenure with the company is long enough to justify it. This strategy will be more likely to succeed if participants receive adequate financial education and a clear explanation of the pros and cons of annuities.
New financial products are emerging to provide different options for insuring part of the longevity risk. Longevity insurance is a deferred annuity with payments starting at an advanced age, such as 85, and no payment on earlier death. This type of insurance allows the retiree to manage for the early years of retirement, but protect in the event of living to advanced ages. Other new products that address this situation are expected.
Governments can also assist in this regard by taking measures to offset the increase in the cost of annuities resulting from improved mortality and aggregate longevity risk, for example, by encouraging group annuitization. The recent reintroduction in the US of the 30-year Treasury bond will make funding of annuities less risky. In the UK, the government has started issuing longevity bonds, which allow insurers to absorb much of the aggregate longevity risk. The issue arises as to whether such bonds are needed in the US, and whether a private sector market for them might develop naturally.
Finally, the risk of debilitating illness in extreme old age raises the issue of the adequacy and affordability of long-term care insurance. One response is a campaign to provide comprehensive information to Americans as they near retirement. The issue also arises as to the adequacy of our knowledge about this particular market.
The percentage of the elderly population over the last century has grown dramatically, and further growth is projected for the next 50 years. Growth in the proportion of elderly results form a combination of increasing life expectancies and changing fertility patterns. The table below shows the increase in life expectancy in the US at birth and at ages 65 and 85, and these values projected to the middle of the 21st century.
US Life Expectancies at Birth, Ages 65 and 85Males 1900 1920 1940 1960 1980 2000 2050 projectionBirth 46.4 54.5 61.4 66.7 69.9 74.0 79.4Age 65 11.4 11.8 11.9 12.9 14.0 15.9 18.9Age 85 3.7 4.0 4.1 4.6 5.1 5.2 6.3FemalesBirth 49.0 56.3 65.7 73.2 77.5 79.4 83.2Age 65 12.0 12.3 13.4 15.9 18.4 19.0 21.4Age 85 4.0 4.1 4.4 5.1 6.3 6.4 7.5
Source: US Social Security Administration Periodic Life Tables 1900–2100, available at www.ssa.gov/OACT/NOTES/actstud.html
16
Probability of Survival from Age 65 to 80, 90 and 100—A Technical Perspective
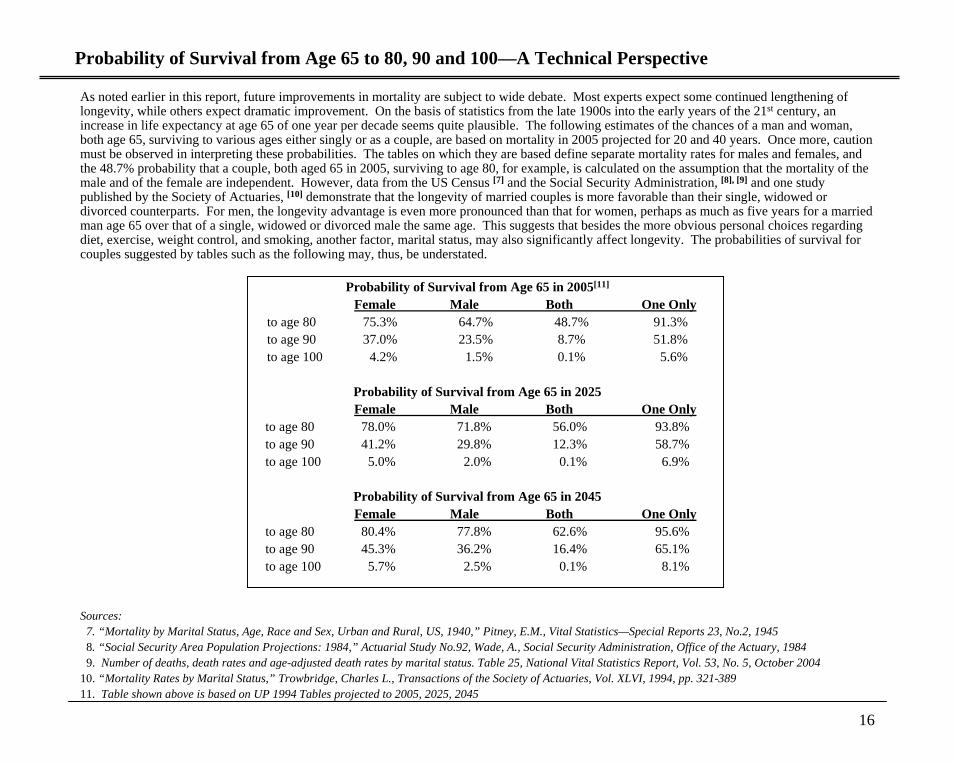
As noted earlier in this report, future improvements in mortality are subject to wide debate. Most experts expect some continued lengthening of longevity, while others expect dramatic improvement. On the basis of statistics from the late 1900s into the early years of the 21st century, an increase in life expectancy at age 65 of one year per decade seems quite plausible. The following estimates of the chances of a man and woman, both age 65, surviving to various ages either singly or as a couple, are based on mortality in 2005 projected for 20 and 40 years. Once more, caution must be observed in interpreting these probabilities. The tables on which they are based define separate mortality rates for males and females, and the 48.7% probability that a couple, both aged 65 in 2005, surviving to age 80, for example, is calculated on the assumption that the mortality of the male and of the female are independent. However, data from the US Census [7] and the Social Security Administration, [8], [9] and one study published by the Society of Actuaries, [10] demonstrate that the longevity of married couples is more favorable than their single, widowed or divorced counterparts. For men, the longevity advantage is even more pronounced than that for women, perhaps as much as five years for a married man age 65 over that of a single, widowed or divorced male the same age. This suggests that besides the more obvious personal choices regarding diet, exercise, weight control, and smoking, another factor, marital status, may also significantly affect longevity. The probabilities of survival for couples suggested by tables such as the following may, thus, be understated.
Probability of Survival from Age 65 in 2005[11]
Female Male Both One Onlyto age 80 75.3% 64.7% 48.7% 91.3%to age 90 37.0% 23.5% 8.7% 51.8%to age 100 4.2% 1.5% 0.1% 5.6%
Probability of Survival from Age 65 in 2025Female Male Both One Only
to age 80 78.0% 71.8% 56.0% 93.8%to age 90 41.2% 29.8% 12.3% 58.7%to age 100 5.0% 2.0% 0.1% 6.9%
Probability of Survival from Age 65 in 2045Female Male Both One Only
to age 80 80.4% 77.8% 62.6% 95.6%to age 90 45.3% 36.2% 16.4% 65.1%to age 100 5.7% 2.5% 0.1% 8.1%
Sources:7. “Mortality by Marital Status, Age, Race and Sex, Urban and Rural, US, 1940,” Pitney, E.M., Vital Statistics—Special Reports 23, No.2, 19458. “Social Security Area Population Projections: 1984,” Actuarial Study No.92, Wade, A., Social Security Administration, Office of the Actuary, 19849. Number of deaths, death rates and age-adjusted death rates by marital status. Table 25, National Vital Statistics Report, Vol. 53, No. 5, October 2004
10. “Mortality Rates by Marital Status,” Trowbridge, Charles L., Transactions of the Society of Actuaries, Vol. XLVI, 1994, pp. 321-38911. Table shown above is based on UP 1994 Tables projected to 2005, 2025, 2045
17
Dealing with the Longevity Risk—Lessons from Behavioral Economics
The following observations are taken from the report in this series on other retirement risks, but are equally appropriate in addressing the specific risk of longevity. These observations help explain reluctance for choosing guaranteed life income in exchange for flexibility and control in the management of their assets. In spite of the need for individuals to assume more responsibility for financing their retirement, gaps in the public’s understanding of risk are not closing. Defined contribution 401(k) plans have been in existence since 1980, and many employers have been trying to educate employees about investing and saving for retirement. While financial education helps some people, there is also evidence that many are not interested in advancing their financial awareness, and that it has little influence over their decisions.
An emerging body of knowledge from the relatively new field of behavioral finance provides new insights into how people understand and deal with risk and uncertainty. One financial planning group segments society according to interest in, knowledge of, and ability to manage retirement risk. This kind of information should be considered together with the surveys and research presented in this report. Readers interested in learning more about economic behavior as it applies to pensions may wish to consult Pension Design and Structure: New Lessons from Behavioral Finance. [12] This work contains a discussion of some of the following considerations that make voluntary retirement savings difficult:
•The payoff for behavioral change is quite uncertain;•Workers do not easily buy into the idea of payoffs in the distant future;•The promise of pleasure tomorrow is perceived as meaning pain today;•Wrong decisions may yield instantaneous gains;•There is no immediate tangible reward for saving now;•Savings decisions can be postponed without immediate penalty; and •There are no specific functional deadlines for action.
•Long-term thinking is foreign to many people;•More choices are not necessarily better than fewer; for many people, too much choice is confusing;•There is no time for trial and error in making decisions; however, since bad results are likely to emerge after a period of years rather than immediately, there is a delay before the effects of poor decision making are recognized.
•Many Americans are not skilled in the mathematics of finance and do not understand compound interest. That makes it very challenging for them to understand long term savings and the impact of inflation.
•In influencing how people act and think, personal experiences make for a much more powerful message than statistics and probabilities. [13]
12. Pension Design and Structure: New Lessons from Behavioral Finance Olivia Mitchell and Stephen Utkus, Oxford, 200413. Pension Design and Structure, Gary Selnow p.45
The following comments from Pension Design and Structure are of a study of how people make decisions
18
Conclusions
Retirees face numerous risks during the post-retirement period. Inability to pay for health care, having their income eroded by inflation, and the risks related to investing their retirement assets, are the top three in their list of concerns, and are addressed in detail in the “Risks of Retirement” Report in this series. Longevity risk is inherent in almost all their major concerns. However, in influencing how people act and think, as the aforementioned comments from Pension Design and Structure emphasize, personal experiences make for a much more powerful message than the kind of statistics and probabilities discussed in the report.
Some retirement benefits such as Social Security, Medicare, and traditional defined benefit pension plans, paid either as regular monthly income or providing ongoing benefits, offer some protection against these specific risks, including the risk of outliving one’s assets. Defined contribution plans and personal savings, on the other hand, offer no such protection, and retirees depending on them are responsible for managing many post-retirement risks on their own. The reports in this series have provided insights about what those nearing retirement and those already retired say about these risks and the various strategies used in managing them. Major gaps exist in understanding of these risks and in the techniques for dealing with them.
Examples of the challenges are:
• Longevity risk is poorly understood and not well-planned for. This is particularly serious for women since, on average, they live longer. Traditionally younger than their spouses or male partners, women’s greater longevity exposes them to the risk of lengthy widowhood.
• Premature retirement risk is greater than generally recognized. About 40% of Americans end up retiring earlier than they planned, usually as a result of job loss, family needs and health issues, or poor personal health. This further aggravates the already serious risks associated with longevity.
• Many people do not save enough, do not estimate their needs well, fail to consider the impact of inflation, and some have changed jobs so frequently that they have accrued no pension benefits if these are not vested when they change jobs.
These challenges are all the greater because many people are not focused on the long term, and significant numbers of retirees and pre-retirees are not sufficiently aware of the financial risks inherent in retirement or how to manage their impact. Even among those aware of the risks and the means to insure against them, too few are moved to take action. Often, awareness does not seem to translate into action and changed behavior.
Other risks are, for all practical purposes, beyond the retiree’s control. For these, little protection currently exists, as alluded to in the “Risks of Retirement”Report. These include corporate fraud and mismanagement leading to the impoverishment of those still holding a majority of their defined contribution plan funds in company stock, and the risk of a continuing care retirement community going bankrupt. Another business related risk is the increase in financially troubled companies. Current legislation allows these companies to declare bankruptcy and relieve themselves of major liabilities, including pension benefit obligations, with the hope of eventually emerging from bankruptcy. In other instances, they may simply completely cease operations altogether. In either instance, federal plan termination insurance may cover some or all of the pension benefits. With the growing number of financially troubled companies, changes in this insurance program are likely to occur and hopefully, the risks posed by these companies will be addressed by thoughtful and balanced legislative changes.
This report should serve as a call to action by employers and employees, and especially by individuals and groups advocating for employees and retirees, to accelerate the enormous task of preparing the Baby Boom generation for the challenges it faces as retirement looms.
19
Acknowledgements
This report was prepared with input and assistance from the Project Oversight Group:
Alex Beer
Wayne Gates
Peter Heller
Emily Kessler
Betty Meredith
Sandy Mackenzie
Peter Plumley
Anna Rappaport
Steven Siegel
John Turner
Anthony Webb
The portions of the report that extended beyond the survey were written by Mike Cowell and Anna Rappaport with input from the Oversight Group and staff.
To Obtain a Copy of the Complete Survey Report The 2005 Risks and Process of Retirement & Survey report may be obtained from the web site of the Society of Actuaries at www.soa.org.

20
Glossary
ADEA—The Age Discrimination in Employment Act, 1967 and as subsequently amended.
Baby Boomers; Baby Boom Generation—Those born in the US from 1946 through 1964.
Defined Benefit—A retirement plan in which the pension benefit is expressed as a monthly or other periodic amount based on a formula typically reflecting earnings and years of service.
Defined Contribution—A retirement plan in which contributions to each participant’s account are typically a percentage of earnings, subject to certain statutory limits in the case of qualified plans. Many of these plans allow employees to save on a pre-tax basis with their contributions matched in part, or fully matched by their employer.
Full Retirement Age—Defined by Social Security as the age at which monthly retirement benefits are available in full without reduction for early retirement. For birth cohorts through 1937, this has been established at 65. For those born in 1938, full retirement age for Social Security is currently set at 65 years and two months, increasing an additional two months for each subsequent birth year, reaching age 66 for those born from 1943 through 1954. It increases again by two months for each subsequent birth year after 1954, reaching age 67 for those born in 1960 and after.
High Income—An arbitrary amount of income or earnings which, for the purpose of these reports, is assumed to be in excess of $100,000 annually for a family of two.
High Net Worth—An arbitrary amount of retirement savings, including defined contribution pension account balances, aggregating $1million or more for a family of two.
Inflation—Annual increase in the Consumer Price Index as measured by the US Bureau of Labor Statistics; it may be for all consumer items, or for specific subsets such as medical care.
Joint and Survivor Annuity—An annuity issued on two individuals under which payments continue in whole or in part until the second of the two dies (also sometimes informally referred to as a joint life annuity).
Life Expectancy—The average future remaining lifetime for a cohort of people at a specific age. For all Americans, life expectancy at birth in 2005 was 78; for females 80, and for males, 75. At age 65, life expectancy for males is 17 years, and for females, 20 years. Source: US Bureau of Census Tables.
Longevity Bonds—Bonds that are designed to hedge exposure to mortality risk and where the payment of principal is linked to a mortality index.
Maximum Life Span—The maximum possible extent of human longevity, generally taken by gerontologists and actuaries as 120 years. Two thoroughly documented cases are of, Shigechiyo Izumi, a Japanese man who died in 1986 at the age of 120, and of Jeanne Calment, who was born in Arles, France in February, 1875, and died there also in August, 1997 eight days short of 122½ .

21
Glossary
Normal Retirement Age—For most traditional defined-benefit pension plans, this has been established as 65, the same age at which full Social Security benefits were available for birth cohorts through 1937. See also, ‘Full Retirement Age’
Phased Retirement—There is no standard agreed upon definition of phased retirement. It is used to describe such arrangements as working part-time before retirement or retiring and then taking a new job, becoming self-employed, or working on a limited basis for a former employer. Viewed broadly, it may include reducing one’s work schedule before retirement, changing duties at normal retirement age, working part-time in retirement or some combination of approaches to gradually phase out of the labor force. The definition of phased retirement is typically limited to situations where a partial pension payment is available or to a situation where the individual is working for the same employer as before.
Pre-retiree—Anyone still in the work force who has reached an arbitrary age—typically set around 50—at which planning for retirement begins to become a serious prospect. For the purposes of the 2005 Risk and Process of Retirement Survey, pre-retirees are at least age 45.
Qualified Plan—A pension plan under which contributions meet certain standards set by the IRS to be tax deductible for the plan sponsor and are tax-deferred to the participant. These plans are subject to numerous rules in order to maintain the favorable tax status.
Retiree—Traditionally, a person who, having attained a certain age—often, but not necessarily normal retirement age—has left the labor force, with no expectation of returning. Today, many retirees leave full-time work, but continue with some work. As retirement is changing, there is no clear definition of retirement, and self-declaration of status produces varying definitions when based on labor force participation criteria. Others tend to consider themselves retired if they are collecting retirement benefits. For the purposes of the 2005 Risk and Process of Retirement Survey, respondents have been classified as retired either through self-definition or if they have retired from their primary occupation.
Retirement—Exit from one’s job or occupation, typically at an age at which the individual has no expectation of returning full-time to the labor force.
Risk—Exposure to the probability of an event that will occur with certainty, but with unknown timing—death—or that may or may not occur, such as accident, sickness, becoming disabled, or outliving one’s assets.
SIPP—The Census Bureau’s Survey of Income and Program Participation.