long-term vegetation monitoring, an update
DESCRIPTION
Long-term vegetation monitoring, an update. Pierre Hiernaux, Eric Mougin, Josiane Seghieri, François Lavenu, Nogmana Soumaguel, Lassine Diarra. Post-drought dynamics on sandy and clayed soils. An asset to study long term vegetation dynamics in the sahel. - PowerPoint PPT PresentationTRANSCRIPT

Long-term vegetation monitoring, an update.
Pierre Hiernaux, Eric Mougin, Josiane Seghieri, François Lavenu, Nogmana Soumaguel, Lassine Diarra
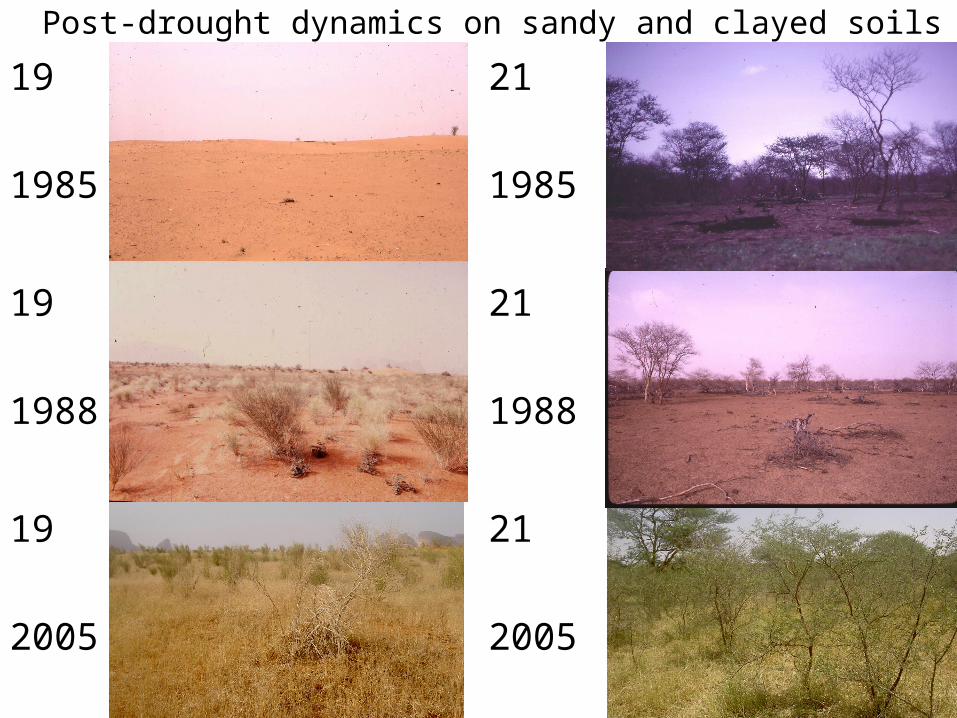
Post-drought dynamics on sandy and clayed soils
19
1985
21
1985
19
1988
21
1988
19
2005
21
2005

An asset to study long term vegetation dynamics in the sahel
• Asset:12 years of vegetation monitoring over 24 rangeland sites sampled in a South_North transect across the Gourma from 1984 to 1995.
• The monitoring developed to assess the seasonal and interannual changes in rangeland ressource, on sites sampled to be representative of the range climates, soils and intensity of grazing pressure in the Gourma.
• Measured initiated in 1984, matching with the peak of the worse drought that stroke the Sahel, and kept active till 1993 with a few measures in 1994 and 1995. Then, observations resumed by AMMA in 1998 and sites are monitored till now.
• From the onset, the sampling methods on the field were designed to match with a remote sensing approach (NOAA-AVHRR in collaboration with NASA, Agrhymet, Institut de Geographie, CESBIO…). The minimum size of the field sites are 1x1km, when possible located within a larger area with similar ecology. Landscape pattern and vegetation heterogeneity considered through enbedded stratified sampling, and distinct methods for the annual herbaceous community, and woody plants and in a few cases perennial herbaceous.

Vegetation monitoring in 2005
Data set organisation: data entry, checking, standardisation, systematic statistical analysis
2006 plans
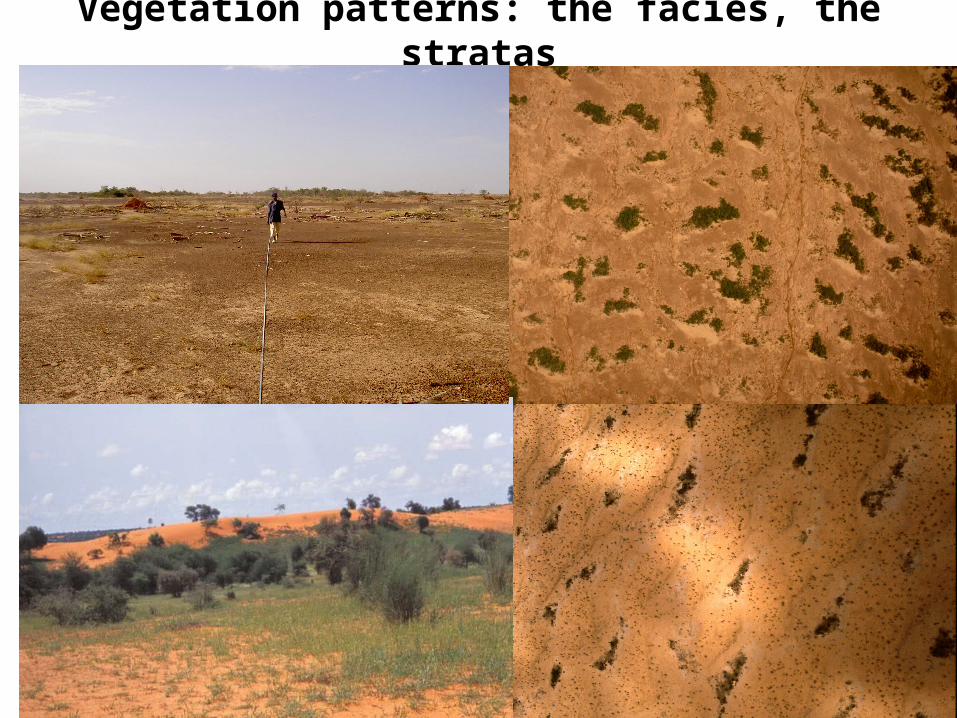
Vegetation patterns: the facies, the stratas

Vegetation sampling design
Fixed central axis of 1000 x 1 m for herb layer non-destructive stratification
12 1x1 m plots (per facies) for destructive mass sampling location at random a few meters off the axis
Measures every 15 d during the wet seasonMeasures every 60 d during the dry season
facies 2
facies 1 facies 1 facies 1
facies 2
facies 2

Observations, measures and indicators on annual herbaceous
Visual estimate of herb cover (%) (green/dead, standing/litter, grass/dicots)
Desctuctive measure of herb mass (g/m²) (green/dead, standing/litter, grass/dicots)
List of species with visual estimate of cover (%)
Observed/measured on 1x1 m plots
Observed/measured on 0.2x0.2 m sub-plots
Direct measure of leaf area (cm²) Indirect with hemispherical photo
Root masses by layers of 10 cm (g/m²)
Soil seed stock by 2cm layers extracted and counted, in and ex-situ germination
mean, varianceby strata
weighted mean,random resampled mean
by facies, site
Field data
cover, mass means and variances
LAI, root mass weighted means
and variances
cover, mass weighted means
and variances
Leaf area, root mass means
and variances
Species weighted contribution
to cover
Species weighted contribution to seed stock
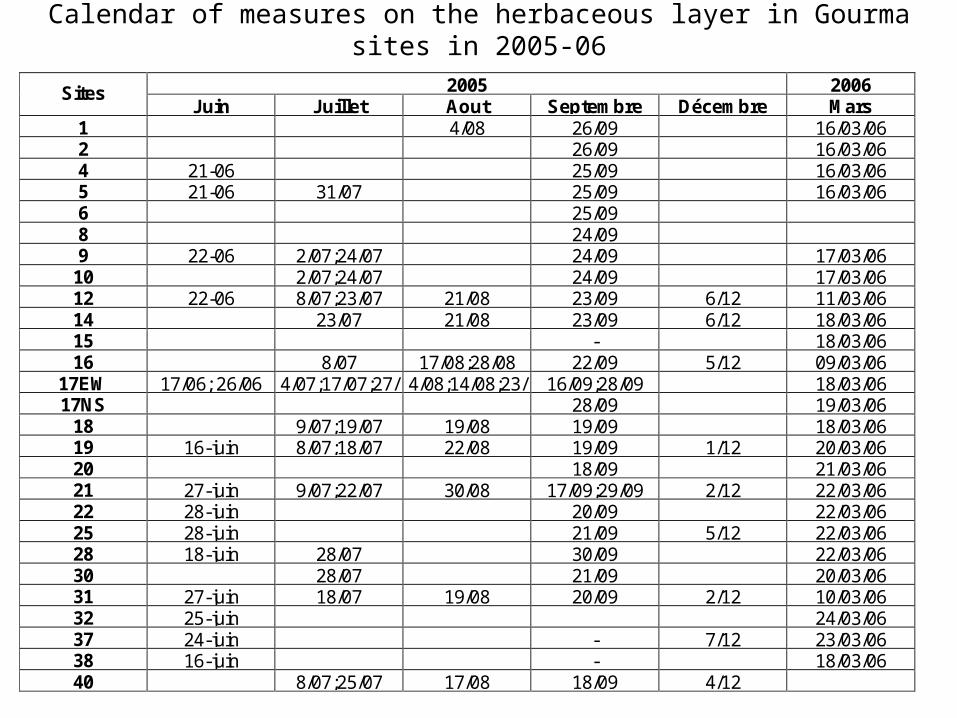
Calendar of measures on the herbaceous layer in Gourma sites in 2005-06
2005 2006 Sites Juin Juillet Aout Septembre Décembre Mars
1 4/08 26/09 16/03/06 2 26/09 16/03/06 4 21-06 25/09 16/03/06 5 21-06 31/07 25/09 16/03/06 6 25/09 8 24/09 9 22-06 2/07;24/07 24/09 17/03/06
10 2/07;24/07 24/09 17/03/06 12 22-06 8/07;23/07 21/08 23/09 6/12 11/03/06 14 23/07 21/08 23/09 6/12 18/03/06 15 - 18/03/06 16 8/07 17/08;28/08 22/09 5/12 09/03/06
17EW 17/06; 26/06 4/07;17/07;27/07
4/08;14/08;23/08
16/09;28/09 18/03/06 17NS 28/09 19/03/06
18 9/07;19/07 19/08 19/09 18/03/06 19 16-juin 8/07;18/07 22/08 19/09 1/12 20/03/06 20 18/09 21/03/06 21 27-juin 9/07;22/07 30/08 17/09;29/09 2/12 22/03/06 22 28-juin 20/09 22/03/06 25 28-juin 21/09 5/12 22/03/06 28 18-juin 28/07 30/09 22/03/06 30 28/07 21/09 20/03/06 31 27-juin 18/07 19/08 20/09 2/12 10/03/06 32 25-juin 24/03/06 37 24-juin - 7/12 23/03/06 38 16-juin - 18/03/06 40 8/07;25/07 17/08 18/09 4/12
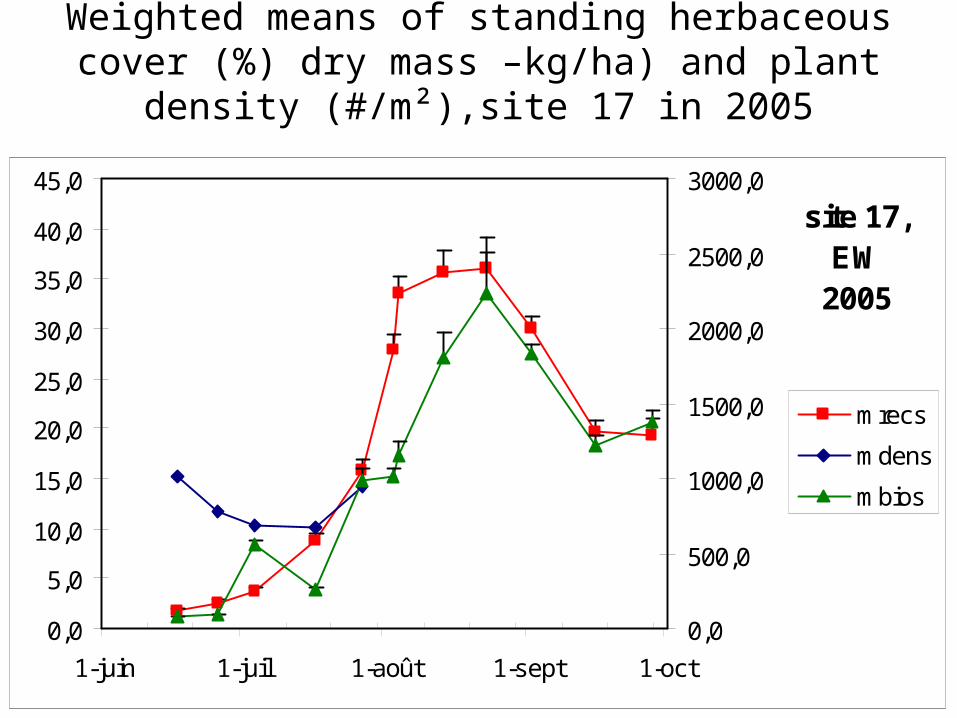
Weighted means of standing herbaceous cover (%) dry mass –kg/ha) and plant density (#/m²),site 17 in 2005
site 17, EW
2005
0,0
5,0
10,0
15,0
20,0
25,0
30,0
35,0
40,0
45,0
1-juin 1-juil 1-août 1-sept 1-oct
0,0
500,0
1000,0
1500,0
2000,0
2500,0
3000,0
mrecs
mdens
mbios

Species contribution to cover at site 17 the 26/06/05 and during the 2005 rainy season
0,00
2,00
4,00
6,00
8,00
10,00
12,00
14,00
16,00
18,00
17/06/2005 26/06/2005 04/07/2005 17/07/2005 27/07/2005 14/08/2005 23/08/2005 02/09/2005 16/09/2005 28/09/2005
ALYSOVAL
ARISMUTA
BORRRADI
BRACXANT
CENCBIFL
CHLOPRIE
DACTAEGY
DIGICILI
ERAGTREM
FIMBHISP
GISEPHAR
INDIASPE
SCHOGRAC
STRIHERM
TRAGBERT
TRIAPILO
TRIBTERR
ZORNGLOC
Déposer champs de page Ici
Max of mrspsit
DATE
ESP
couvert site 17 26/06/05 CENCBIFL
ZORNGLOC
TRAGBERT
BRACXANT
TRIBTERR
ALYSOVAL
FIMBHISP
GISEPHAR
ARISMUTA
HELISTRI
DACTAEGY
DIPCTACC
CHLOPILO

Contribution of taxonomic or functionnal species groups to herbaceous vegetation cover in the Gourma sites in 2005
0,00
20,00
40,00
60,00
80,00
100,00
1 5 9 10 12 16 17 17 18 19 21 21 28 31 38 40
sites
gra
sses
an
d l
egu
mes
%
ctgr ctlg


Calendar of vegetation and soil observations in the IER sites in Bamba district.
Herbacées annuelles Herbacées pérennes Peuplements
ligneux
Site N°
Nom du site Dates de
mesure Stratification,
(1000 m2)
Couvert, composition floristique et
masse (8 x 1m²)
Densité (PCQ)
Echantillons (mensurations
et masse)
Densité et couvert (PCQ)
Topographie et états de surface des
sols
B8 Bamba 03.10/05 - - - - - 13/03.06 X X
A3 Adjarara 03.10/05 X X X X X A2 In Amankor 03.10/05 X X X X B6 In Amankor 03.10/05 X X X X X R9 Tamayort 03.10/05 X X X X R8 Tamayort 03.10/05 - - - - B5 Tamayort 03.10/05 - - - - R7 Tin Tates 03.10/05 - - - - R6 Tin Tates 03.10/05 X X X X R5 Tin Tates 03.10/05 X X X X R8 Tamayort 13/03.06 X X X
R3 In Adeskane 13/03.06 X X X
R7 Tamayort 13/03.06 X X X
B5 Tamayort 13/03.06 X X X
A1 In Adeskane 13/03.06 - - X
B11 In Adeskane 13/03.06 - - X
B13 In Adeskane 13/03.06 - - X
R11 Sobori 13/03.06 X X X
R2 Sobori 13/03.06 X X R10 Maha 13/03.06 - -

Comparing cover and masses of annuals, perennial
grasses and woody plants
foliage in the Haoussa
sites
Masse des pérennes et annelles kg/ha
0,0
1000,0
2000,0
3000,0
4000,0
R5 A2 R6 B6 A3 R9
her
bac
ées
(A e
t P
0,0
200,0
400,0
600,0
800,0
1000,0
lig
neu
ses
(feu
ille
s)
bioper mbios biotl
Masse des pérennes et annelles kg/ha
0,0
1000,0
2000,0
3000,0
4000,0
R5 A2 R6 B6 A3 R9
her
bac
ées
(A e
t P
0,0
200,0
400,0
600,0
800,0
1000,0
lig
neu
ses
(feu
ille
s)
bioper mbios biotl

Observations, measures and indicators on perennial and woody plants
Record of individuals in circular plots (per category or per species)
Record the four closest individuals and measure distance from random points
Record individuals which crown interceptthe 1000m site axis, measure interception
Observed/measured populations
Observed/measured on individuals
Measure crown heighth, length and width (m)
Measure basal circonference of stems or basal crown (cm)
Record species name of all individuals
density and Crown coverassessment weighted mean,
of foliage and wood masses using
allometry relationspre-established for
each species
Field data
density mean and variance by category
Foliage, wood, masses
weighted means and variances
crown cover mean and
variance by category
Species weighted contribution
to cover, masses..
crown cover estimate

Sampling woody plant populations (trees and shrubs) in circular plots, which area is fitted to the population density
Lineartransect
A B
LargeCircularPlot used torecord low density Tree: ~ 10/ha
Small circularPlot used to record Densely populated shrubs: ~100/ha

Assessing plant population densities and structure by measuring the distance of closest plant to random points
Perpendicular to the transect line
d1, d2, d3 and d4 the distances from A to
four closest millets hills
d1
Transect d4 A (200m)
d3 d2
density D = 10000/ d2 ;
with d2 = [( d1+d2+d3+d4)/4]2
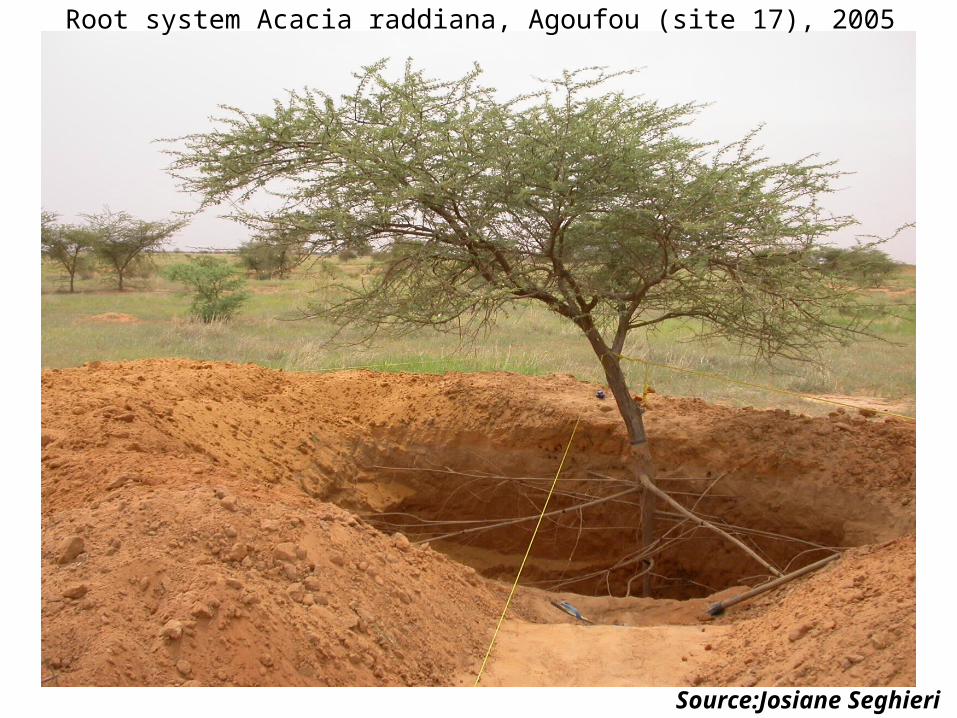
Source:Josiane Seghieri
Root system Acacia raddiana, Agoufou (site 17), 2005

Vegetation monitoring in 2005
Data set organisation: data entry, checking, standardisation, systematic statistical analysis
Upscaling: mapping vegetation, soil, water balance and landuse
2006 plans

Flow chart of the data files and program codes for the statistical analysis of the data on herbaceous layers
stratosXX mesvegXX compflorXXRow fieldData files
Stratification Mass, cover… Species composition
stratosXX
SAS code files
Standardized data files
msvegXX ctspXX
herb_str_XX herb_fac_XXHerb_sit_XX
alpltXX alfacXXalsitXX
resucla_XX
Interannual data base
Herbfac Herbsit Ctsp Resucla
biomassXX
spcompXX
Standardized statistics and indicator files

Weighted means of standing herbaceous at Agoufou (site 17) from 1990 to 2005
Site 17 - 1990-2005
0,0
500,0
1000,0
1500,0
2000,0
2500,0
3000,0
juil-
90
jan
v-9
1
juil-
91
jan
v-9
2
juil-
92
jan
v-9
3
juil-
93
jan
v-9
4
juil-
94
jan
v-9
5
juil-
95
jan
v-9
6
juil-
96
jan
v-9
7
juil-
97
jan
v-9
8
juil-
98
jan
v-9
9
juil-
99
jan
v-0
0
juil-
00
jan
v-0
1
juil-
01
jan
v-0
2
juil-
02
jan
v-0
3
juil-
03
jan
v-0
4
juil-
04
jan
v-0
5
juil-
05
sta
nd
ing
ma
ss
(k
g/h
a)
No observations
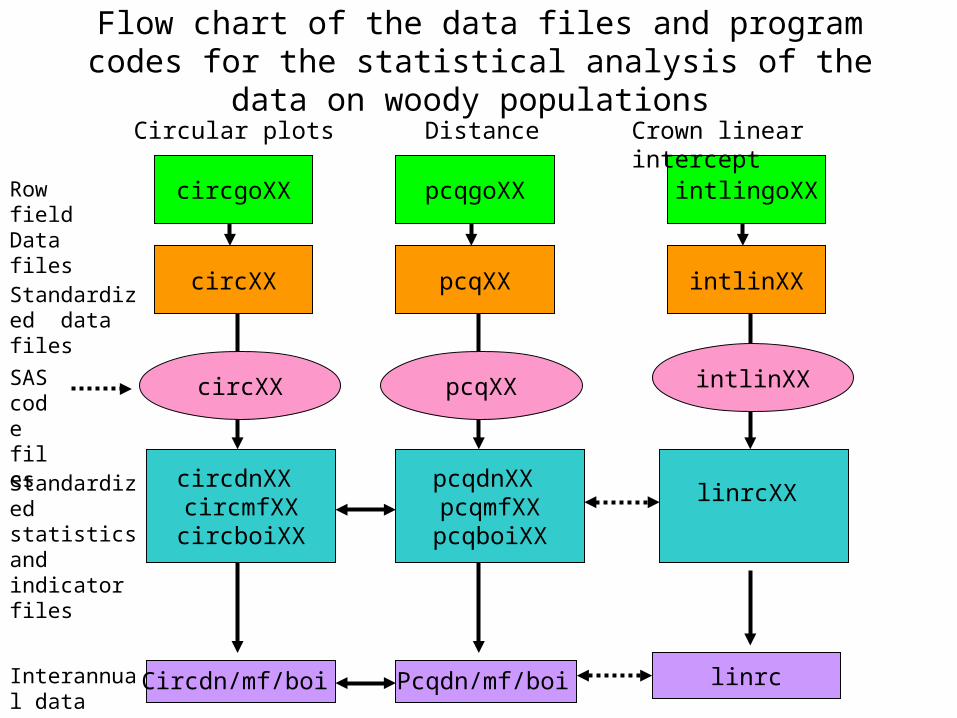
Flow chart of the data files and program codes for the statistical analysis of the data on woody populations
circgoXX pcqgoXX intlingoXXRow fieldData files
Circular plots Distance Crown linear intercept
circXX
SAS code files
Standardized data files
pcqXX intlinXX
circdnXX circmfXXcircboiXX
pcqdnXX pcqmfXXpcqboiXX
Interannual data base
linrc
circXX intlinXX
Standardized statistics and indicator files
linrcXX
pcqXX
Circdn/mf/boi Pcqdn/mf/boi
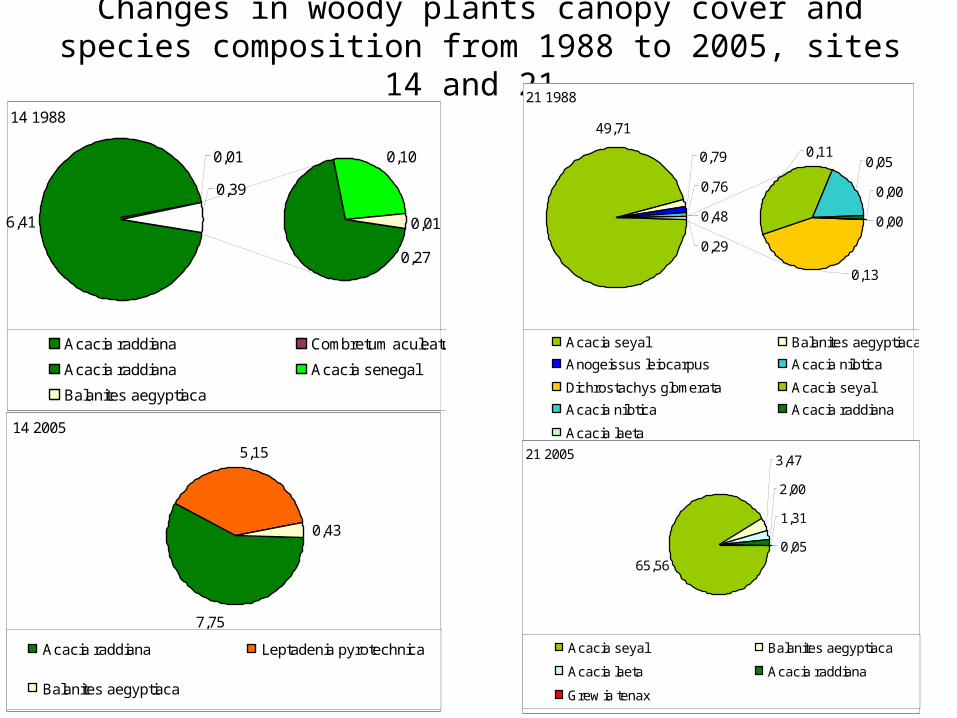
Changes in woody plants canopy cover and species composition from 1988 to 2005, sites 14 and 21
21 1988
0,79
0,76
0,48
0,05
0,00
0,00
0,29
0,11
0,13
49,71
Acacia seyal Balanites aegyptiaca
Anogeissus leiocarpus Acacia nilotica
Dichrostachys glomerata Acacia seyal
Acacia nilotica Acacia raddiana
Acacia laeta
21 2005
65,56
3,47
2,00
1,31
0,05
Acacia seyal Balanites aegyptiaca
Acacia laeta Acacia raddiana
Grew ia tenax
14 1988
6,41
0,10
0,39
0,01
0,27
0,01
Acacia raddiana Combretum aculeatum
Acacia raddiana Acacia senegal
Balanites aegyptiaca
ligneux morts
14 2005
7,75
5,15
0,43
Acacia raddiana Leptadenia pyrotechnica
Balanites aegyptiaca
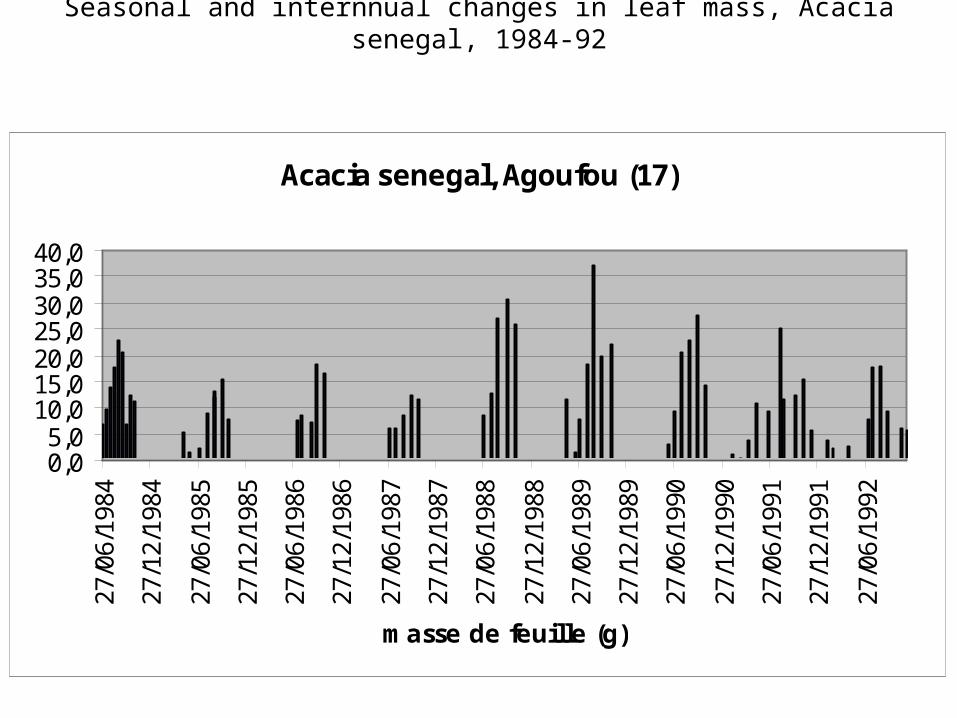
Seasonal and internnual changes in leaf mass, Acacia senegal, 1984-92
Acacia senegal, Agoufou (17)
0,05,0
10,015,020,025,030,035,040,0
27/0
6/19
84
27/1
2/19
84
27/0
6/19
85
27/1
2/19
85
27/0
6/19
86
27/1
2/19
86
27/0
6/19
87
27/1
2/19
87
27/0
6/19
88
27/1
2/19
88
27/0
6/19
89
27/1
2/19
89
27/0
6/19
90
27/1
2/19
90
27/0
6/19
91
27/1
2/19
91
27/0
6/19
92
masse de feuille (g)

Vegetation monitoring in 2005
Data set organisation: data entry, checking, standardisation, systematic statistical analysis
Upscaling: mapping vegetation, soil, water balance and landuse
2006 plans

Monitoring of herbaceous annuals
Frequency and type of measures will be adapted to season and site priority:• Five ranks in priority:
– Agoufou (17) – Other flux station sites (21, 40, A3)– Other super-site sites (18, 19, 20, 22, 31)– Other Gourma sites (1,2,4,5,6,8,9,10,12,14,16,25,28,30,32,37,38)– Other Bamba sites (A1, A2, B5, B6, B8, B13, R3, R5, R6, R7, R8, R9, R10, R11)
• Two seasons:– Wet season (from June to October): every 10d, 15d, month– Dry season (from November to May): every 2 months (11, 01, 03, 05)
• Nature of observation or measure: – Stratification, cover and mass– species composition (once at the end of the wet season except in 17 ?– Leaf area ?– Root mass ?– Germination-soil seed stock ?

Monitoring perennial grasses and woody plants
Frequency of observations and measures depends on the type of observation and the component:
• Population studies (CIRC or PCQ): – Woody plants: every 5 years thus next in 2010 – Perennial plants (sites 32 and twelve of the Bamba sites): every year ?
• Quantitative phenololy (standard branchlets; sampled tussocks):– Wet season (from June to October): every month– Dry season (from November to May): every two months (11/01/03/05)– List of species populations and sites to monitor for leaf/flower/frut pheno– List of species populations and sites to monitor LAI– List of species populations and sites to monitor root masses