long term pavement performance (ltpp)
TRANSCRIPT


Long Term Pavement
Performance (LTPP)
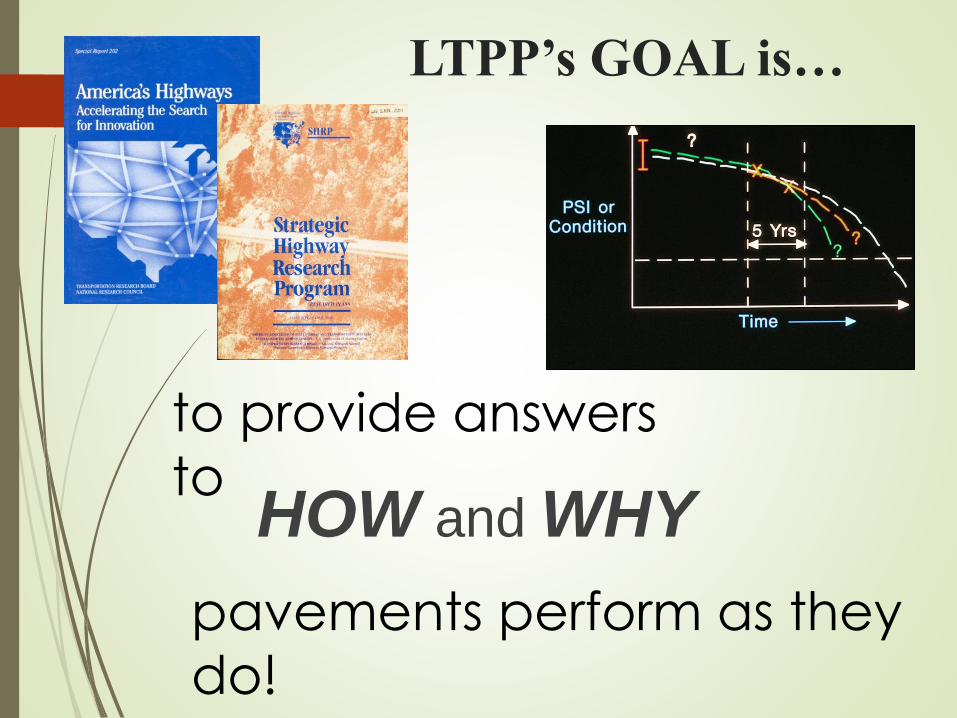
LTPP’s GOAL is…
HOW and WHY
to provide answers
to
pavements perform as they
do!
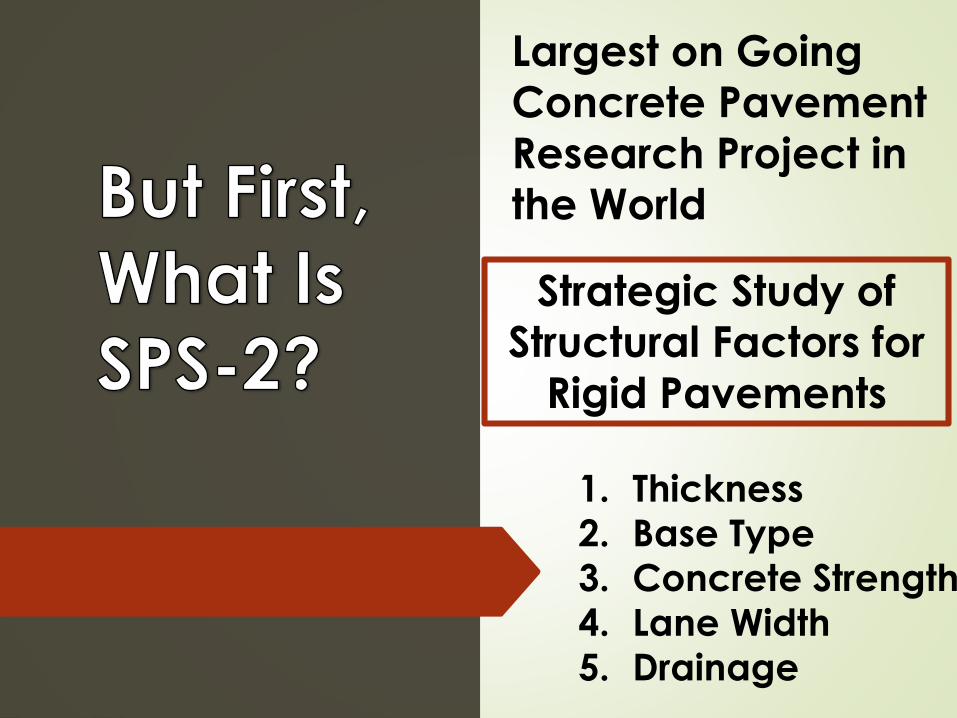
Strategic Study of
Structural Factors for
Rigid Pavements
Largest on Going
Concrete Pavement
Research Project in
the World
1. Thickness
2. Base Type
3. Concrete Strength
4. Lane Width
5. Drainage
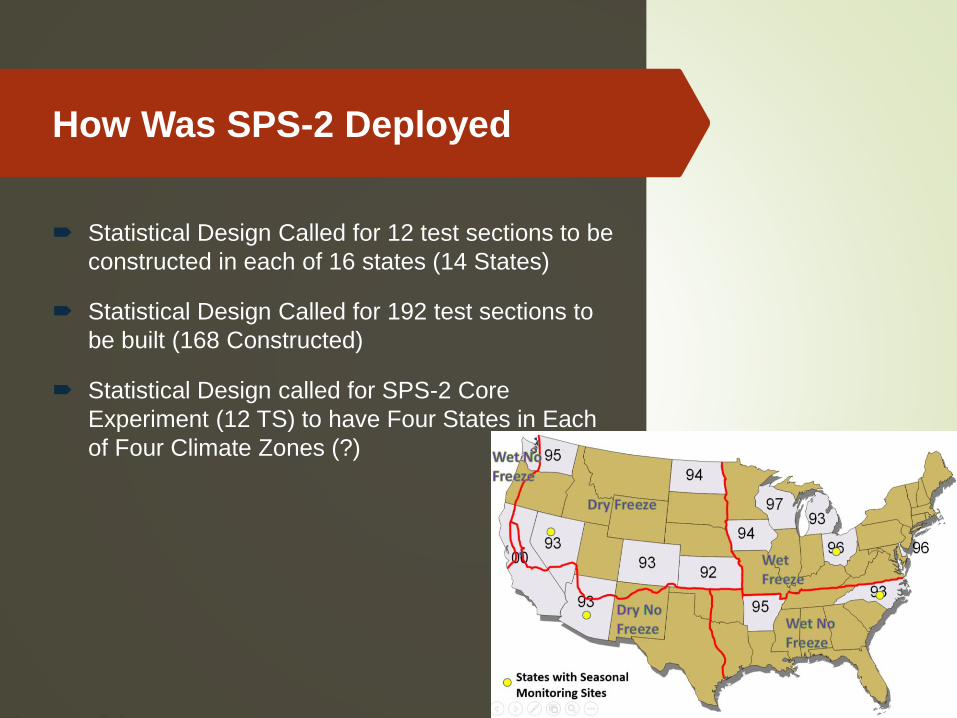
How Was SPS-2 Deployed
Statistical Design Called for 12 test sections to be
constructed in each of 16 states (14 States)
Statistical Design Called for 192 test sections to
be built (168 Constructed)
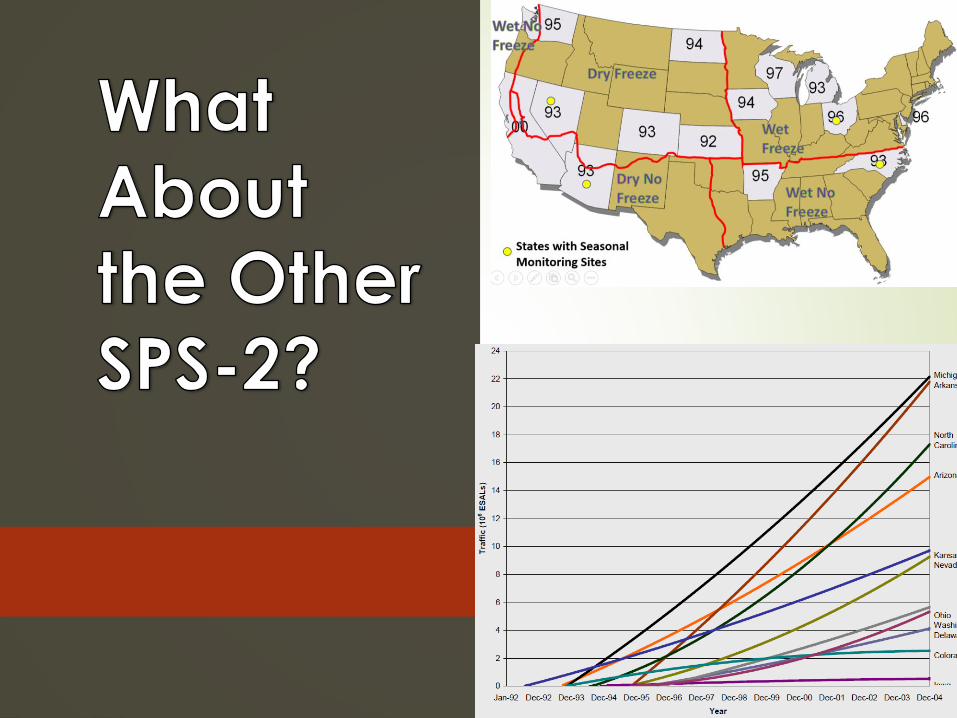
Statistical Design called for SPS-2 Core
Experiment (12 TS) to have Four States in Each
of Four Climate Zones (?)

PCCP Design Elements
1. Thickness
2. Base Type
3. Concrete Strength
4. Lane Width
5. Drainage
Shoulder Type

Time Line of SPS-2 Experiment
0
1
2
3
4
5
6
7
1989 1990 1991 1992 1993 1994 1995 1996 1997 1998 1999 2000
Meetings Construction Guidelines
It is anticipated that only a few SPS-2 projects will be built during the 1990 construction season. The remaining test sites will be selected from the
identified candidates scheduled for construction in 1991, or even 1992 if necessary
KS CA5 2 2 2 1
AZ

Time Line of SPS-2
Experiment
0
1
2
3
4
5
6
7
92 93 94 95 96 97 98 99 0 1 2 3 4 5 6 7 8 9 10 11 12 13 14 15 16 17
Reports Construction Guidelines
26 Years
Analysis
of Fault
Data
Effects of
Subsurface
Drainage
Initial
Evaluation &
Analysis
Influence of
Design
Features
Curl & Warp
Analysis
SPS-2 Construction Outlet Inspection

Traffic Levels on SPS-2 Experiments
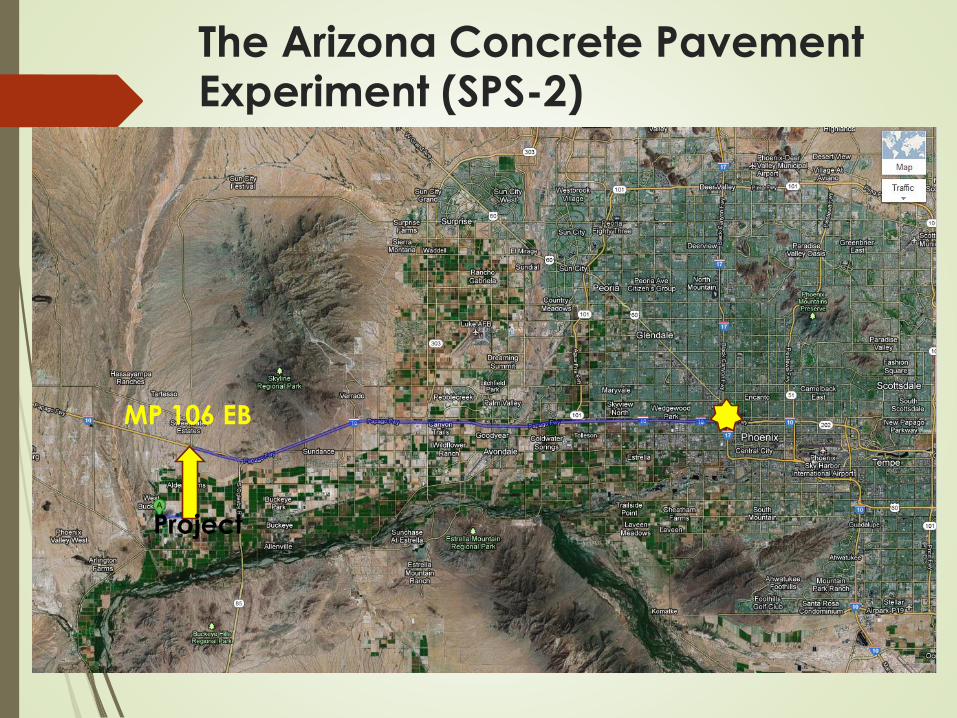
The Arizona Concrete Pavement Experiment (SPS-2)
Project
MP 106 EB

Google Earth Image of Test Sections
Hassyampa
River Palo
Verde
Rd
Johnson
Rd

Approaching from the West End
MP 106 EB 611 ft

Test Section
Layout
205 205 250 550 220 220 475 205 265 295 250 235 205 500 249 151 200 200 200 236
Base TypesDense Graded Aggregate Base (4" & 6")
Permeable Bituminous Treated Base (4") Note: These are the only Sections with Edge Drains
Lean Concrete Base (6")
Bituminous Treated Base (4")
Shoulder Types12 ft Shoulder Width
14 ft Shoulder Width
Un Dowelled Sections
267 268
State Supplemental @550 psi Flexural Strength550 psi Flexural Strength
216 215 223 219 217 221 213
900 psi Flexural Stength
214 218222 220 224 262 263 264 265 266
Design Features:
• PCCP Thickness- (2)
• Base Type- (3)
• Concrete Strength- (2)
• Lane Width- (2)
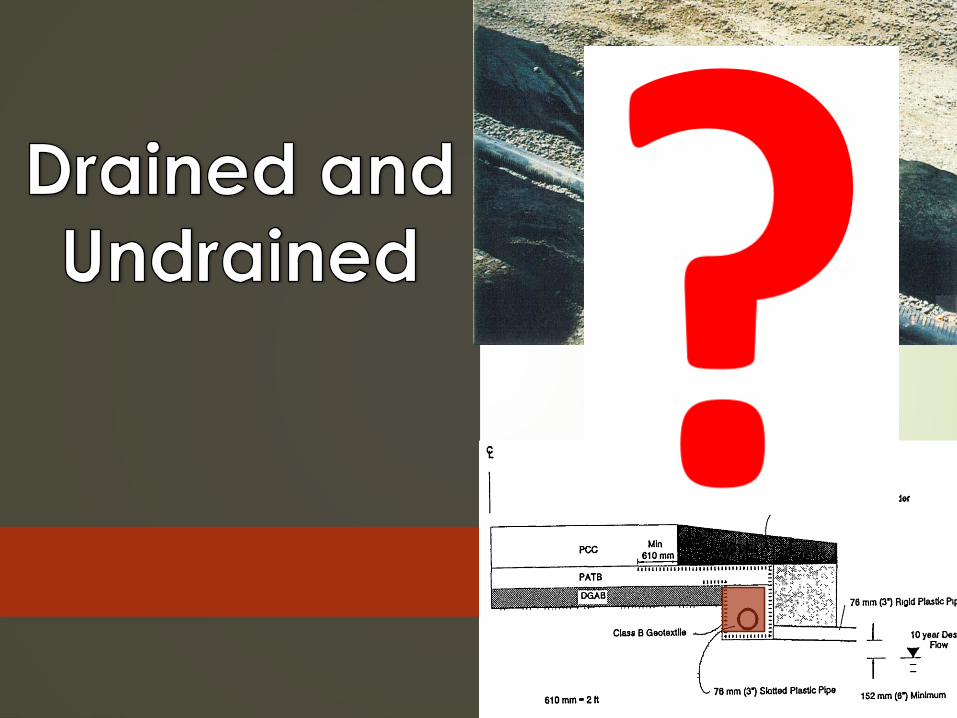
• Drained or Undrained
19 PCCP Test Sections

Arizona Project Construction Timeline(6 - 9 months)
•Removing Existing EB AC and Constructing Detour onto WB
•Over Excavating Existing Subgrade 1 ft and Recompacting
•Constructing Edge Drains
•Constructing Aggregate Base, Lean Concrete Base, and
Permeable Base
•Constructing 8”, 11” and 12.5” Thick PCCP
•Constructing 550 and 900 psi Flexural Strength PCCP
•Constructed Doweled and Undoweled PCCP
Construction
28
Open to Traffic
WimCalibration
Edge Drain
PATB
BTB
LCB
PCCP
Acceptance
27
1994
PCCPMix Design
PCCPMix Design
ACMill Remove
ABC
Over ExSubgrade Prep
January
Project
November December
22
Lab
Clearing &GrubDetour Const
June July August September October
Project Begins
Feb 16, 1993
March April May

Subgrade Preparation

Slots

PATB
DGAB
LCB


•Night Paving September 1993
• Three Mixes Used (1” & 1.5”)
• All LTPP Sections Doweled
16 ft22 ft
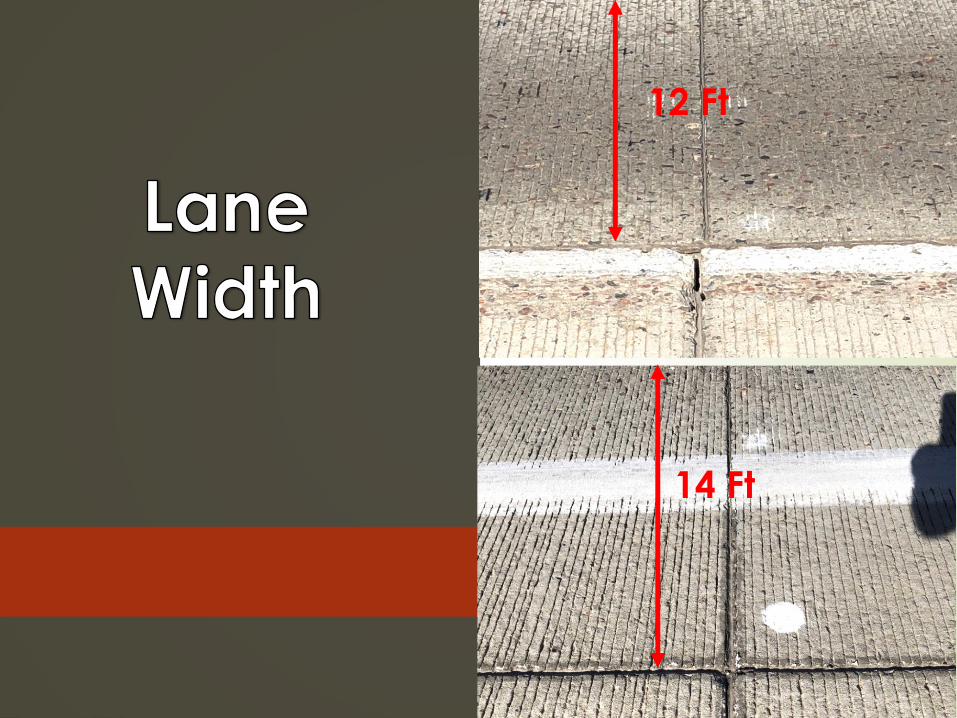
12 Ft
14 Ft

So What Have We
Learned After 25
Years
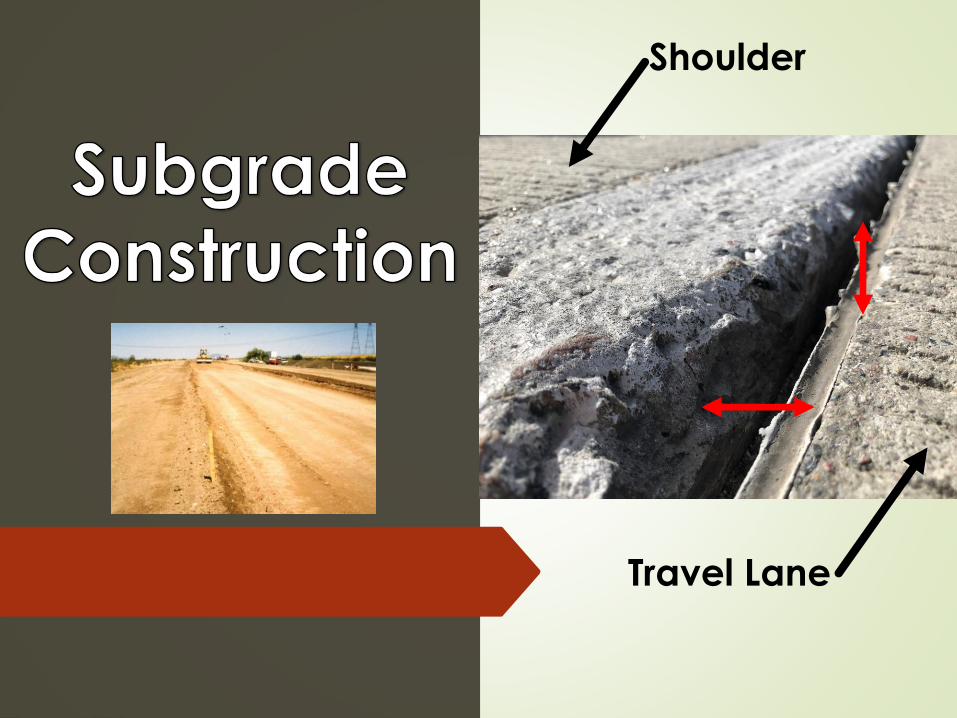
Shoulder
Travel Lane

LCB
PATB
DGAB
BEST
GOOD
WORST

900 PSI
550 PSI
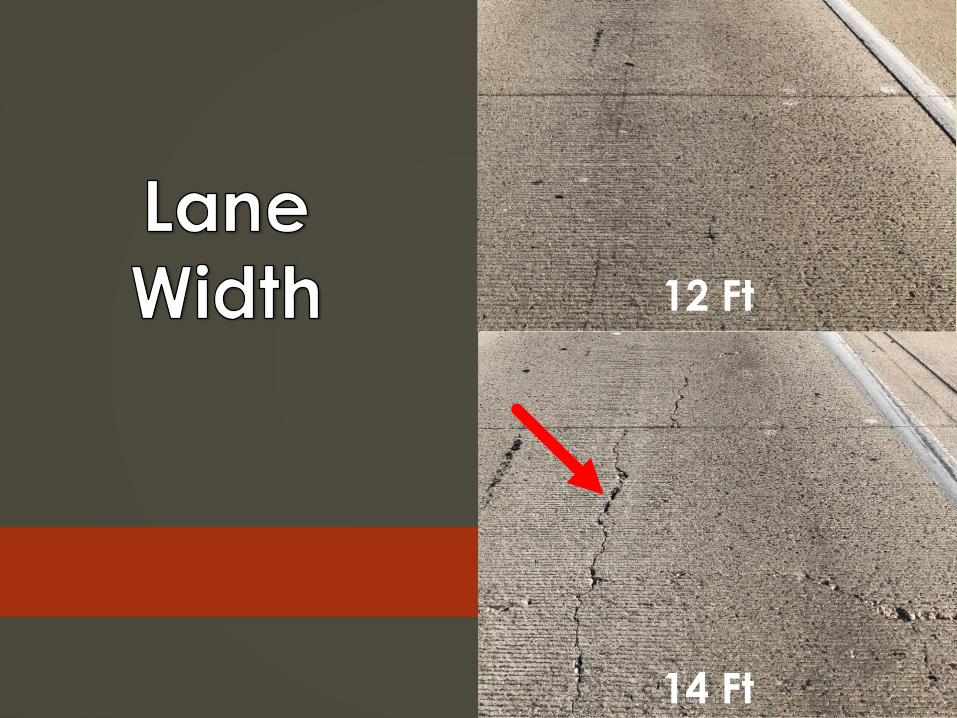
14 Ft
12 Ft

Thicker is
Better

Comparison of Doweled to
Undoweled
205 205 250 550 220 220 475 205 265 295 250 235 205 500 249 151 200 200 200 236
Base TypesDense Graded Aggregate Base (4" & 6")
Permeable Bituminous Treated Base (4") Note: These are the only Sections with Edge Drains
Lean Concrete Base (6")
Bituminous Treated Base (4")
Shoulder Types12 ft Shoulder Width
14 ft Shoulder Width
262 263 264 265 266
900 psi Flexural Stength
214 218222 220 224 216 215 223 219 217
Un Dowelled Sections
267 268
State Supplemental @550 psi Flexural Strength550 psi Flexural Strength
221 213
SPS-2 Core Experiment 12 TS
SPS-2A JPCP 6 TS
SPS-2B JRCP 12 TS
State Supplemental Sections

North Dakota
8” PCCP
Kansas

North Dakota
Wisconsin
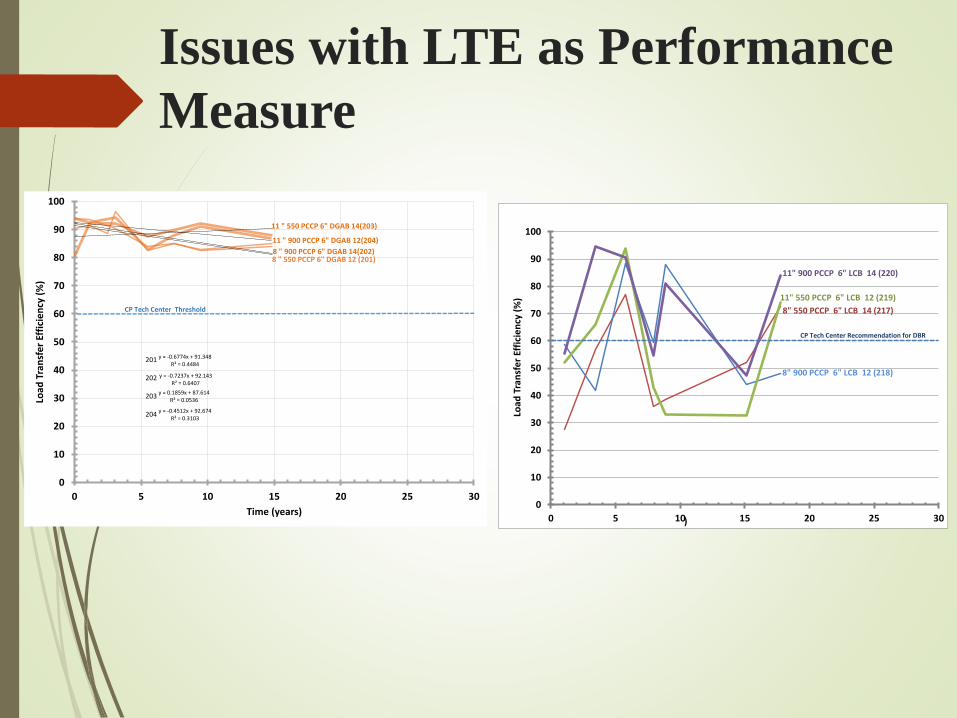
Issues with LTE as Performance
Measure
y = -0.6774x + 91.348R² = 0.4484
y = -0.7237x + 92.143R² = 0.6407
y = 0.1859x + 87.614R² = 0.0536
y = -0.4512x + 92.674R² = 0.3103
0
10
20
30
40
50
60
70
80
90
100
0 5 10 15 20 25 30
Load
Tra
nsf
er
Effi
cie
ncy
(%
)
Time (years)
8 " 550 PCCP 6" DGAB 12 (201)8 " 900 PCCP 6" DGAB 14(202)
11 " 550 PCCP 6" DGAB 14(203)
11 " 900 PCCP 6" DGAB 12(204)
CP Tech Center Threshold
201
202
203
204
0
10
20
30
40
50
60
70
80
90
100
0 5 10 15 20 25 30Lo
ad T
ran
sfe
r Ef
fici
en
cy (
%)
)
8" 550 PCCP 6" LCB 14 (217)
8" 900 PCCP 6" LCB 12 (218)
11" 550 PCCP 6" LCB 12 (219)
11" 900 PCCP 6" LCB 14 (220)
CP Tech Center Recommendation for DBR

Transverse Crack Count as
Performance Measure

Conclusions (My Opinions)
PATB Performed Best for Initial Smoothness
and Rate of Progression of Roughness
LCB performed worst with transverse
cracking and most influence of Widened
Shoulder
550 psi Mix Out Performed 900 psi
Widened Traffic Lanes Create a Higher
Potential for Longitudinal Cracking

SPS-2 Pooled Fund Reports
NCE Report:
SPS-2 PAVEMENT PRESERVATION
EXPERIMENT COMPARISON OF PAVEMENTME
AND ACTUAL PERFORMANCE
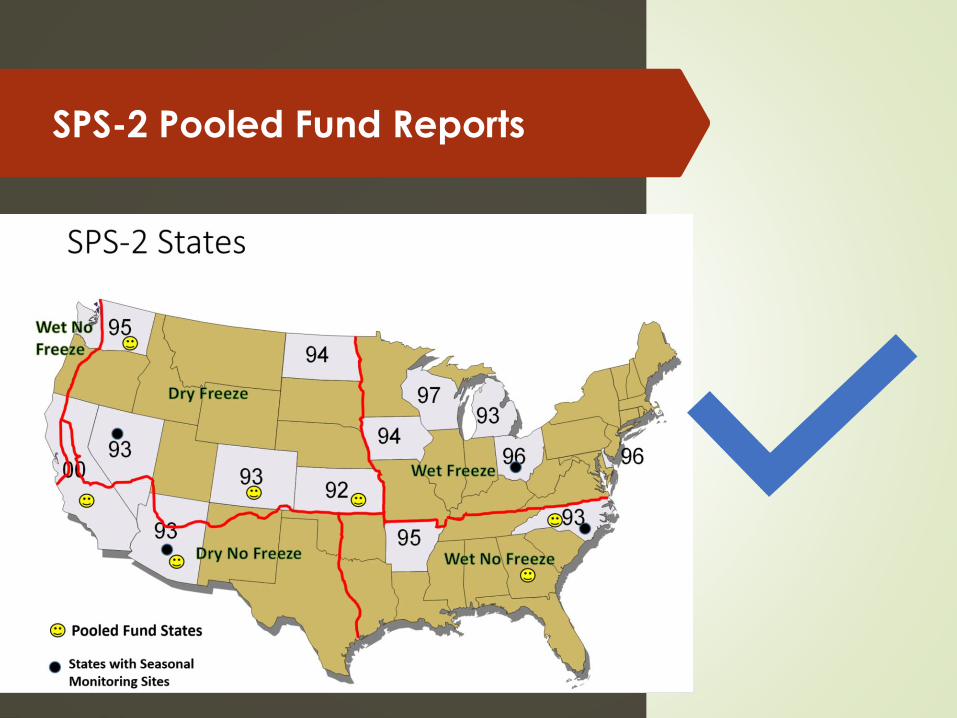
SPS-2 Pooled Fund Reports

Arizona SPS-2 Tech Day

Thank You!
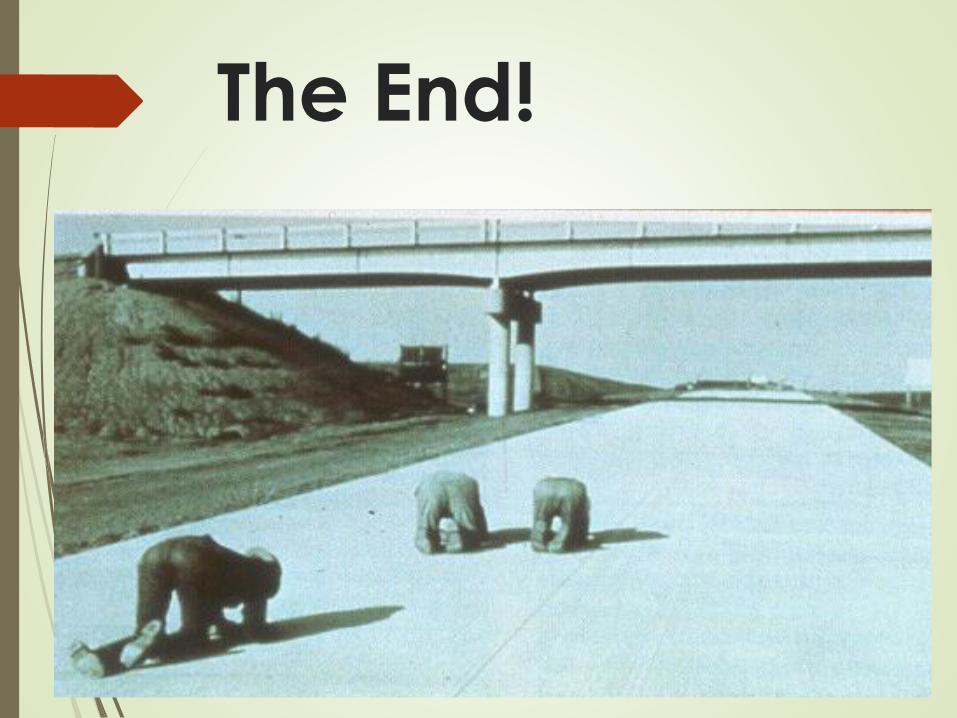
The End!