long-term observations of mean winds and tides in the upper mesosphere and lower thermosphere above...
TRANSCRIPT
ARTICLE IN PRESS
1364-6826/$ - se
doi:10.1016/j.ja
�CorrespondE-mail addr
(A.J.G. Baumg
Journal of Atmospheric and Solar-Terrestrial Physics 67 (2005) 1480–1496
www.elsevier.com/locate/jastp
Long-term observations of mean winds and tides in theupper mesosphere and lower thermosphere
above Scott Base, Antarctica
A.J.G. Baumgaertner�, A.J. McDonald, G.J. Fraser, G.E. Plank
Department of Physics and Astronomy, University of Canterbury, Christchurch 8020, New Zealand
Received 26 April 2005; received in revised form 21 July 2005; accepted 31 July 2005
Available online 6 September 2005
Abstract
Analysis of monthly mean wind velocities from a medium frequency (MF) radar at Scott Base (781S, 1671E),
Antarctica, are presented. The radar has been measuring winds in the upper mesosphere and lower thermosphere region
since December 1982. Previous work related to this instrument focused on only small portions of the larger dataset. The
present study examines changes in the full dataset with respect to phenomena associated with multi-year periods,
namely the quasi-biennial oscillation (QBO) and the solar cycle, and long-term trends. No relationship between these
phenomena and the mean winds observed are identified. A negative correlation between the amplitude of the semi-
diurnal tide and solar activity is found, similar to other mesosphere and lower thermosphere observations. This
correlation is also observed for the diurnal tide to a lesser extent. Other observations have usually indicated negative
trends in tidal amplitudes, however, a positive trend is found in tidal amplitudes at Scott Base since 1987. Processes that
could lead to explanations for the observed seasonal variations, solar cycle dependence and the amplitude trend of the
tides are discussed.
r 2005 Elsevier Ltd. All rights reserved.
Keywords: Climate change and variability; Mesosphere lower thermosphere dynamics; Solar cycle; Tides; QBO
1. Introduction
Radar wind observations of the mesosphere and lower
thermosphere (MLT) have been made since the late
1950s. Long-term studies have the aim to provide a
sound climatology and information about inter-annual
variability. Climatologies are now available from many
stations, giving a reasonably consistent picture of mean
winds and tides in the MLT region. However, reliable
data that spans at least two solar cycles and could be
e front matter r 2005 Elsevier Ltd. All rights reserve
stp.2005.07.018
ing author. Tel.: 00 64 21 2014 977.
ess: [email protected]
aertner).
used for examination of the effect of multi-year
periodicities and climate trend studies is rare. Table 1
presents an overview of MLT wind observations world-
wide. It only includes instruments which have been
operating over a period spanning at least one solar cycle.
A number of authors have analyzed MLT wind
measurements for signatures of multi-year oscillations,
the most common long-term periodicities being the
eleven year solar cycle and the quasi-biennial oscillation
(QBO). In addition it has been suggested that the
mesosphere, in particular the polar mesosphere, should
be a sensitive indicator for long-term global changes in
the atmosphere (Thomas, 1996). Thus, efforts are made
to identify trends in long-term datasets. The purpose of
d.
ARTICLE IN PRESS
Table 1
Overview of sites of long-term observations of winds in the mesosphere and lower thermosphere worldwide. Instruments: ionospheric
drift measurements (D1: total reflection, PR: partial reflection), ionised meteor trails (D2)
Station, Instrument Location Period References
Heiss Island, D2 811N, 581E 1965–1985 Portnyagin et al. (1993a, b)
Obninsk, D2 551N, 381E 1964–1995 Portnyagin and Solovjova (2000)
Kuehlungsborn, D1 541N, 121E 1964–1994 Bremer et al. (1997)
Kuehlungsborn, D2 541N, 121E 1976–1994 Bremer et al. (1997)
Saskatoon, PR 521N, 1071W 1979–1988 Namboothiri et al. (1993)
UK, D2 521N, 21W 1988–2000 Middleton et al. (2002)
Collm, D1 511N, 131E 1964–1994 Bremer et al. (1997)
Atlanta, D2 341N, 841W 1975–1986 Bremer et al. (1997)
Adelaide, PR 351S, 1381E 1984–1995 Vincent et al. (1998)
Christchurch, PR 441S, 1731E 1978–1986 Fraser (1990)
1987–2003 Unpublished
Molodezhnaya, D2 681S, 451E 1967–1986 Portnyagin et al. (1993a, b)
Scott Base, PR 781S, 1671E 1982–1984 Fraser (1989)
1985–2004 Present study
A.J.G. Baumgaertner et al. / Journal of Atmospheric and Solar-Terrestrial Physics 67 (2005) 1480–1496 1481
this paper is to first present an updated climatology of
the Scott Base MF radar mean wind and tidal amplitude
data. Variations in the tides play an important role in
the middle atmosphere because in the mesosphere and
lower thermosphere tidal amplitudes can be so large that
they dominate the wind field. In addition, like other
internal waves, they transfer momentum from their
source regions to the regions in which they are dissipated
and so affect the mean circulation and structure of the
atmosphere. The second purpose of this paper is to
examine the inter-annual variability in the dataset for
multi-year periodicities and trends.
The most common multi-year periodicity examined in
the MLT winds is the 11 year solar cycle. Most studies
focusing on the relationship between the solar cycle and
MLT winds have found a negative correlation between
solar activity and tidal amplitudes. However, the
relationship between the neutral wind and solar activity
is less clear. The earliest publication to discuss the
influence of solar activity on MLT region winds was
Sprenger and Schminder (1969) who examined LF radar
data from 1957 to 1968. They found that the mean zonal
and meridional winds in winter in Central Europe are
positively correlated with solar activity. A negative
correlation with solar activity was found for the semi-
diurnal tide. These results were confirmed by Dartt et al.
(1983) who used observations from additional sites.
Using LF and meteor radars in Kuehlungsborn and
Collm for a longer period Greisiger et al. (1987) found
positive and negative correlations between zonal winds
and solar activity depending on the period employed.
However, the semi-diurnal tide still displayed a negative
correlation with solar flux density data. Later analysis
by Jacobi et al. (1997) using the same datasets found no
dependency of mean winds or tides on the solar cycle.
Their study indicated that the correlation depended on
the period used and they proposed longer period
oscillations to explain this behaviour. Bremer et al.
(1997) found weak negative dependence of zonal wind
and semi-diurnal tidal amplitudes for several northern
hemisphere sites.
A number of other studies using shorter periods (less
than two solar cycles) have also examined the effect of
solar activity on MLT winds. With the MF radar at
Saskatoon from 1974 to 1991 Namboothiri et al. (1993,
1994) found positive correlation between the solar cycle
and zonal winds, and a negative correlation for the semi-
diurnal tidal amplitude. However, the significance levels
indicated in both studies were small. Using meteor
radar observations from 1988 to 2000 over England,
Middleton et al. (2002) could infer a correlation between
mean winds and solar activity, but it depended on the
season. Fahrutdinova et al. (1997) also reported a strong
correlation between the annual amplitude of the prevail-
ing zonal wind and solar activity for nine years worth of
mid-latitude data. Thus, a relatively large number of
studies based on the analysis of data from northern
hemisphere sites have shown a relationship between solar
activity and MLT winds or tidal amplitudes.
Southern hemisphere observations at 441S, described
by Fraser (1990), showed no solar cycle dependency of
the mean zonal wind but possibly a decreasing semi-
diurnal tidal amplitude with decreasing solar activity. The
significance of this trend was relatively low given the
limited amount of data used in the study. An earlier study
by Fraser et al. (1989) involving observations from four
radars at northern and southern mid-latitudes concluded
that a positive correlation for the semi-diurnal tidal
amplitude existed during southern hemisphere summers.
However, the observational evidence for the relationship
ARTICLE IN PRESSA.J.G. Baumgaertner et al. / Journal of Atmospheric and Solar-Terrestrial Physics 67 (2005) 1480–14961482
between the solar cycle and MLT winds is much
weaker in the southern hemisphere than the northern
hemisphere.
Evidence of the effect of other multi-year periodicities
on MLT dynamics has also been found. The quasi-
biennial oscillation (QBO) dominates the variability of
the equatorial stratosphere and is easily seen as down-
ward propagating easterly and westerly wind regimes in
the stratosphere, with a variable period of approxi-
mately 28 months. The QBO is a fascinating example of
a coherent, oscillating mean flow that is driven by
propagating waves with periods unrelated to that of the
resulting oscillation. Vincent et al. (1998) displayed
evidence of strong inter-annual variability in the diurnal
tide at three tropical stations with the effect being
strongest at Adelaide at the March equinox. Compar-
isons with the phase of the QBO show that the
amplitudes are larger (weaker) than the 12 year average
when the winds are predominantly eastward (westward).
Gurubaran and Rajaram (1999) also present results
which clearly indicate pronounced inter-annual varia-
bility in the tidal activity over Tirunelveli (91N) which
are linked to the stratospheric QBO. Their study
indicates that the principal factors in producing the
QBO modulation appear to be the variabilities asso-
ciated with tidal forcing and the interaction with the
stratospheric winds with gravity wave-tidal interactions
also being expected to contribute. It should be noted
that while these studies have indicated the impact of the
QBO on the tropical tidal amplitudes, work by Jarvis
(1996) also indicates that a similar impact can be
observed in the Antarctic lower thermosphere.
A summary of trends for mean winds and tides can be
found in Bremer et al. (1997). They conclude that zonal
mean winds experience a trend towards greater velo-
cities. Some sites also show evidence of a negative trend
in meridional mean winds. With respect to tidal
amplitudes a significant negative trend was observed
by all instruments. It should be noted that most of the
instruments did not employ height finding. Jacobi et al.
(1997) reports oscillations at very long time scales
(approximately 20 years) from LF wind measurements
in Germany, covering a time span of 25 years. These
oscillations were especially found in summer zonal
winds, but also for the amplitudes of the semi-diurnal
tide and obviously make it difficult for short datasets to
be of use in identifying trends. Similar results for the
semi-diurnal tide were obtained by D’Yachenko et al.
(1986) from meteor wind observations.
Portnyagin et al. (1993a, b) discuss trends found in the
mean wind and tides over Molodezhnaya (681S) with a
meteor radar. The results from both studies are included
in Bremer et al. (1997), but due to the fact that they
discuss the only other long dataset from Antarctica their
results are mentioned in more detail. The authors
observed a decrease in amplitude of eastward winds at
95 km altitude for the period 1968–1977. They suggested
that this trend could be due to a number of processes
including ozone forcing, a latitudinal shift of the
mesospheric jet, change in in-situ heating of solar or
geomagnetic origin. For Arctic data, no similar effect
was found. In addition, a decrease in the amplitude of
the semi-diurnal tide by 0.3–0:5m s�1 yr�1 was found,
depending on month. A decrease in ozone forcing
due to anthropogenic ozone depletion is proposed as a
possibility that might explain the amplitude decrease.
However, this result is made more difficult to interpret
by the fact that the annual mean amplitude of the semi-
diurnal tide did not show a trend.
In mean wind observations over Japan, Central
Europe and Canada, spanning about 15 years, Gavrilov
et al. (2002) found inter-annual changes, that varied
substantially between stations. Both the inter-annual
changes and the dependence on location were attributed
to variations in the strengths of internal gravity wave
sources and the propagation conditions for them. These
changes, in turn, were attributed to solar activity, the
Pinatubo eruption and El Nino events.
2. The dataset
The first MF radar system in Scott Base was installed
in December 1982. The radar is a partial reflection wind
radar and operates at 2.9MHz using a pulse width of
30ms (corresponding to a pulse length of 4.5 km in
vacuum). The transmitter has a peak output power of
60 kW and the pulse repetition frequency was 4Hz
during 1982–1986 and 8Hz since 1987. Data can be
obtained from heights between 70 and 100 km. Zonal
and meridional winds are calculated using the Full
Correlation Analysis (FCA) technique (Brown and
Chapman, 1972). Details about the system can be found
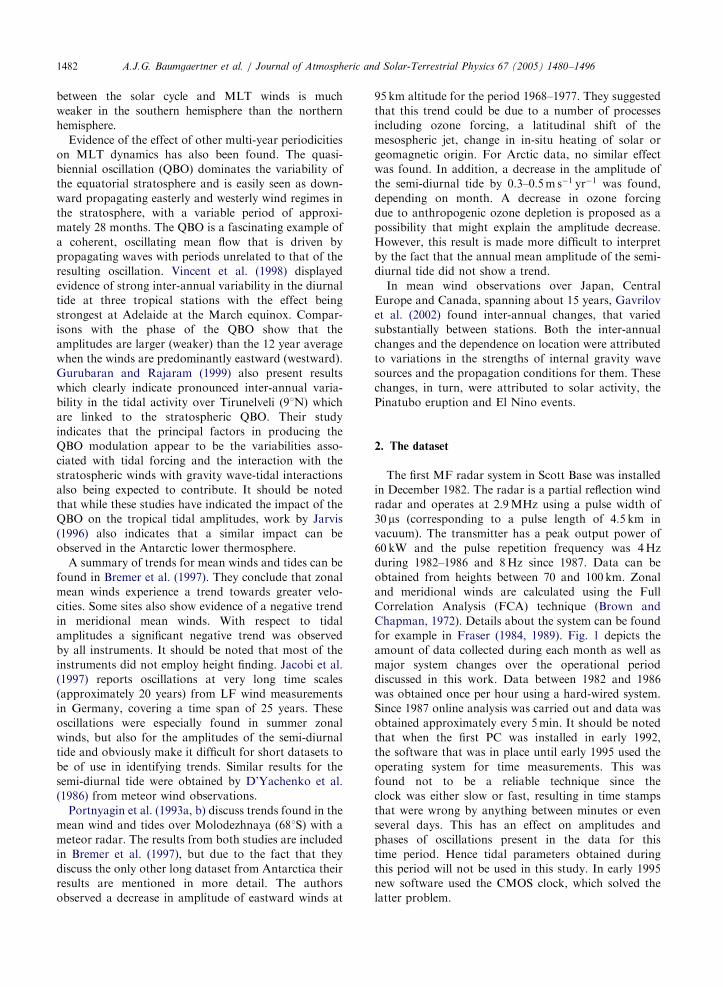
for example in Fraser (1984, 1989). Fig. 1 depicts the
amount of data collected during each month as well as
major system changes over the operational period
discussed in this work. Data between 1982 and 1986
was obtained once per hour using a hard-wired system.
Since 1987 online analysis was carried out and data was
obtained approximately every 5min. It should be noted
that when the first PC was installed in early 1992,
the software that was in place until early 1995 used the
operating system for time measurements. This was
found not to be a reliable technique since the
clock was either slow or fast, resulting in time stamps
that were wrong by anything between minutes or even
several days. This has an effect on amplitudes and
phases of oscillations present in the data for this
time period. Hence tidal parameters obtained during
this period will not be used in this study. In early 1995
new software used the CMOS clock, which solved the
latter problem.
ARTICLE IN PRESS
Hard-wireddata system
New transmitter (TX),Computer LSI-11/23
Clock synchronisationwith GPS
A/D output to incrementalmagnetic tape, hourly data
Online analysis of raw data, velocities calculated approx. every 5 minutes
PC#1
PC #3 Coherentreceivers
Clockproblems
Pre
para
tion
ofne
wha
rdw
are
Pow
ersu
pply
prob
lem
s
Per
cent
age
ofav
aila
ble
hour
lyda
taw
ithre
spec
tto
poss
ible
num
ber
ofho
urs
per
mon
th New TXPC #2
Fig. 1. Available measurements overview including major radar equipment and software changes.
20 20
30
30
30
30 30
30
40
40 40
40 40
40
40 40
40
40
50
50
50 50
50
50
50
50
50
60
Alti
tude
(km
)
Jan Feb Mar Apr May Jun Jul Aug Sep Oct Nov Dec75
80
85
90
95
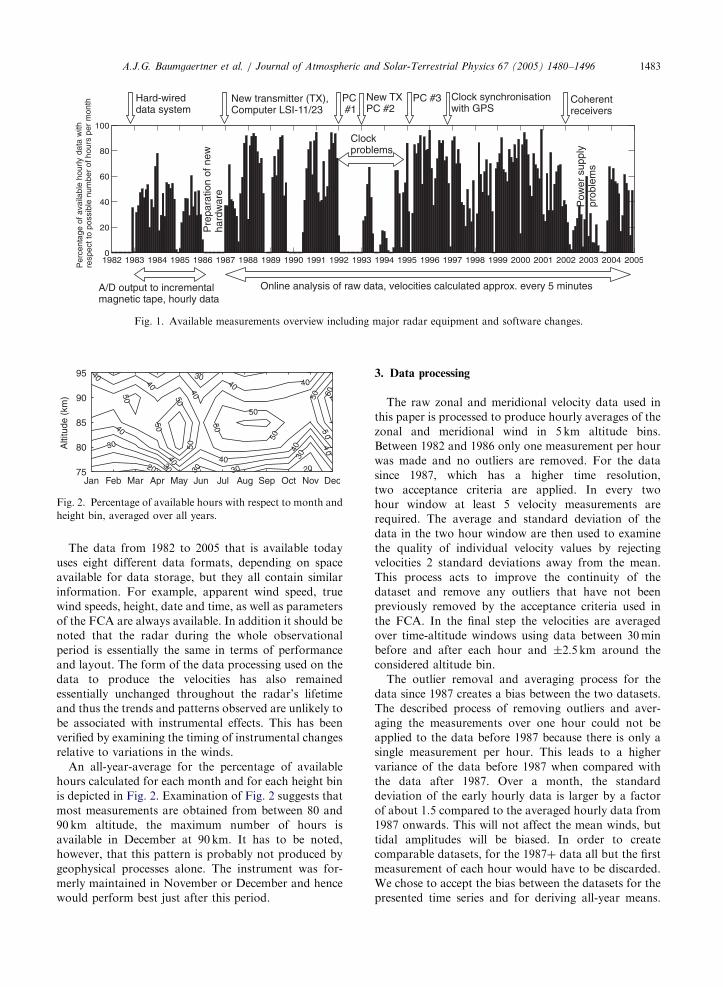
Fig. 2. Percentage of available hours with respect to month and
height bin, averaged over all years.
A.J.G. Baumgaertner et al. / Journal of Atmospheric and Solar-Terrestrial Physics 67 (2005) 1480–1496 1483
The data from 1982 to 2005 that is available today
uses eight different data formats, depending on space
available for data storage, but they all contain similar
information. For example, apparent wind speed, true
wind speeds, height, date and time, as well as parameters
of the FCA are always available. In addition it should be
noted that the radar during the whole observational
period is essentially the same in terms of performance
and layout. The form of the data processing used on the
data to produce the velocities has also remained
essentially unchanged throughout the radar’s lifetime
and thus the trends and patterns observed are unlikely to
be associated with instrumental effects. This has been
verified by examining the timing of instrumental changes
relative to variations in the winds.
An all-year-average for the percentage of available
hours calculated for each month and for each height bin
is depicted in Fig. 2. Examination of Fig. 2 suggests that
most measurements are obtained from between 80 and
90 km altitude, the maximum number of hours is
available in December at 90 km. It has to be noted,
however, that this pattern is probably not produced by
geophysical processes alone. The instrument was for-
merly maintained in November or December and hence
would perform best just after this period.
3. Data processing
The raw zonal and meridional velocity data used in
this paper is processed to produce hourly averages of the
zonal and meridional wind in 5 km altitude bins.
Between 1982 and 1986 only one measurement per hour
was made and no outliers are removed. For the data
since 1987, which has a higher time resolution,
two acceptance criteria are applied. In every two
hour window at least 5 velocity measurements are
required. The average and standard deviation of the
data in the two hour window are then used to examine
the quality of individual velocity values by rejecting
velocities 2 standard deviations away from the mean.
This process acts to improve the continuity of the
dataset and remove any outliers that have not been
previously removed by the acceptance criteria used in
the FCA. In the final step the velocities are averaged
over time-altitude windows using data between 30min
before and after each hour and �2:5km around the
considered altitude bin.
The outlier removal and averaging process for the
data since 1987 creates a bias between the two datasets.
The described process of removing outliers and aver-
aging the measurements over one hour could not be
applied to the data before 1987 because there is only a
single measurement per hour. This leads to a higher
variance of the data before 1987 when compared with
the data after 1987. Over a month, the standard
deviation of the early hourly data is larger by a factor
of about 1.5 compared to the averaged hourly data from
1987 onwards. This will not affect the mean winds, but
tidal amplitudes will be biased. In order to create
comparable datasets, for the 1987þ data all but the first
measurement of each hour would have to be discarded.
We chose to accept the bias between the datasets for the
presented time series and for deriving all-year means.
ARTICLE IN PRESS
18
18
12 12
6
6 6
6
0
0
0
0
0
6
6
6
Alti
tude
(km
)
mean zonal wind
Jan Feb Mar Apr May Jun Jul Aug Sep Oct Nov Dec75
80
85
90
95
(a)
2
2
2
2 2
0
0
0
00
2
2
2 2
2 2
2
2
2
00
0 00
0
4
4
2
2
2
2
2
2
4
Alti
tude
(km
)
mean meridional wind
Jan Feb Mar Apr May Jun Jul Aug Sep Oct Nov Dec75
80
85
90
95
(b)
4 4
4
4
4
4
8
8
8
8
8
8
8
12
12
12
1212
16
16
16
20
Alti
tude
(km
)
amplitude of the zonal semi-diurnal tide
Jan Feb Mar Apr May Jun Jul Aug Sep Oct Nov Dec75
80
85
90
95
(c)
4
4 48
8
8
8
8
8
8
12
12 12
12
1212
16 16
Alti
tude
(km
)
amplitude of the meridional semi-diurnal tide
80
85
90
95
A.J.G. Baumgaertner et al. / Journal of Atmospheric and Solar-Terrestrial Physics 67 (2005) 1480–14961484
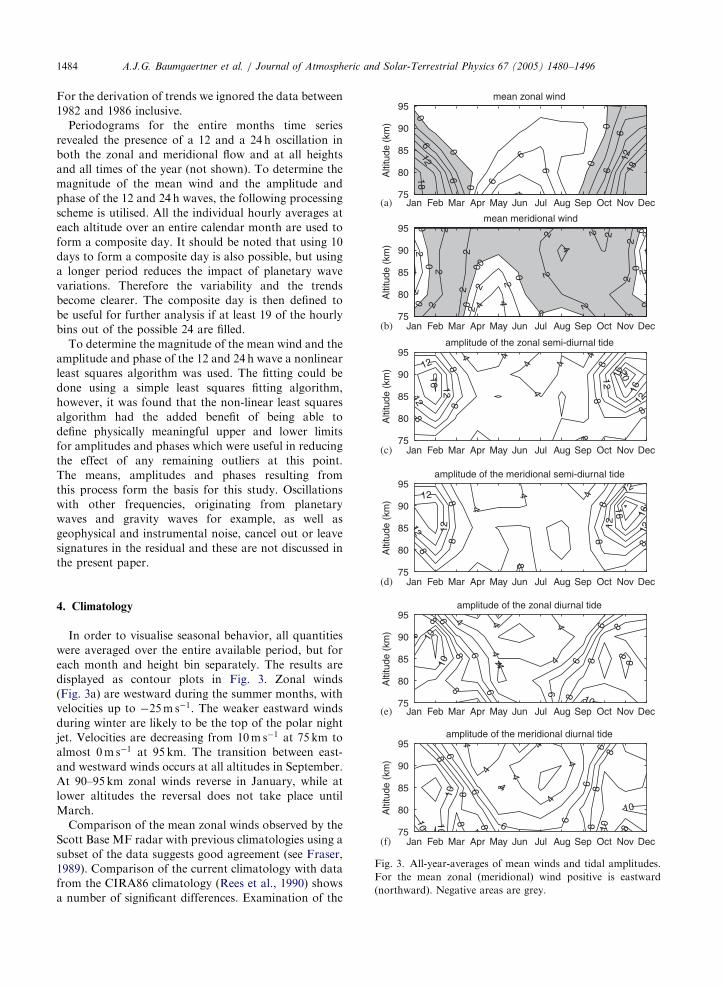
For the derivation of trends we ignored the data between
1982 and 1986 inclusive.
Periodograms for the entire months time series
revealed the presence of a 12 and a 24 h oscillation in
both the zonal and meridional flow and at all heights
and all times of the year (not shown). To determine the
magnitude of the mean wind and the amplitude and
phase of the 12 and 24 h waves, the following processing
scheme is utilised. All the individual hourly averages at
each altitude over an entire calendar month are used to
form a composite day. It should be noted that using 10
days to form a composite day is also possible, but using
a longer period reduces the impact of planetary wave
variations. Therefore the variability and the trends
become clearer. The composite day is then defined to
be useful for further analysis if at least 19 of the hourly
bins out of the possible 24 are filled.
To determine the magnitude of the mean wind and the
amplitude and phase of the 12 and 24 h wave a nonlinear
least squares algorithm was used. The fitting could be
done using a simple least squares fitting algorithm,
however, it was found that the non-linear least squares
algorithm had the added benefit of being able to
define physically meaningful upper and lower limits
for amplitudes and phases which were useful in reducing
the effect of any remaining outliers at this point.
The means, amplitudes and phases resulting from
this process form the basis for this study. Oscillations
with other frequencies, originating from planetary
waves and gravity waves for example, as well as
geophysical and instrumental noise, cancel out or leave
signatures in the residual and these are not discussed in
the present paper.
4
4
4
44
44
6
6
6 6
6
6
8
88
8
8
88
88
10
1010
Alti
tude
(km
)
amplitude of the zonal diurnal tide
Jan Feb Mar Apr May Jun Jul Aug Sep Oct Nov Dec75
80
85
90
95
(e)
4
4
4
4
4
4
4
6
6
6 6
66
8
8
88
88
8
8
10 10
10
10
10Alti
tude
(km
)
amplitude of the meridional diurnal tide
Jan Feb Mar Apr May Jun Jul Aug Sep Oct Nov Dec75
80
85
90
95
(f)
Jan Feb Mar Apr May Jun Jul Aug Sep Oct Nov Dec75
(d)
Fig. 3. All-year-averages of mean winds and tidal amplitudes.
For the mean zonal (meridional) wind positive is eastward
(northward). Negative areas are grey.
4. Climatology
In order to visualise seasonal behavior, all quantities
were averaged over the entire available period, but for
each month and height bin separately. The results are
displayed as contour plots in Fig. 3. Zonal winds
(Fig. 3a) are westward during the summer months, with
velocities up to �25m s�1. The weaker eastward winds
during winter are likely to be the top of the polar night
jet. Velocities are decreasing from 10m s�1 at 75 km to
almost 0m s�1 at 95 km. The transition between east-
and westward winds occurs at all altitudes in September.
At 90–95 km zonal winds reverse in January, while at
lower altitudes the reversal does not take place until
March.
Comparison of the mean zonal winds observed by the
Scott Base MF radar with previous climatologies using a
subset of the data suggests good agreement (see Fraser,
1989). Comparison of the current climatology with data
from the CIRA86 climatology (Rees et al., 1990) shows
a number of significant differences. Examination of the
ARTICLE IN PRESSA.J.G. Baumgaertner et al. / Journal of Atmospheric and Solar-Terrestrial Physics 67 (2005) 1480–1496 1485
zonal winds in the CIRA86 climatology in winter show
eastward winds that are much stronger than those
observed by the Scott Base MF radar. The zonal winds
in the summer are significantly weaker in the CIRA86
climatology than those in the MF radar data.
Examination of the mean meridional flow (Fig. 3b)
indicates that this is generally much weaker than the
zonal wind pattern as should be expected. Inspection
indicates that no strong seasonal pattern can be
observed in the meridional velocity in the long-term
average unlike the strong pattern observed in the zonal
velocity. The only suggestion of a seasonal pattern is the
change of wind direction which occurs at the equinoxes
with southward velocities around the equinoxes. Velo-
cities range from northward 5m s�1 in April (75 km),
May (75 km), December (85 km) and January (85 km) to
southward 5m s�1 in August (90 km).
82 83 84 85 86 87 88 89 90 91 92 93
-40
-20
0
20
40mean zonal wind
m/s
Y
-10
0
10 mean meridional wind
m/s
0
10
20amplitude of the zonal semi-diurnal tide
m/s
0
10
20amplitude of the meridional semi-diurnal tide
m/s
0
10
20amplitude of the zonal diurnal tide
m/s
82 83 84 85 86 87 88 89 90 91 92 930
10
20amplitude of the meridional diurnal tide
m/s
Y
(f)
(e)
(d)
(c)
(b)
(a)
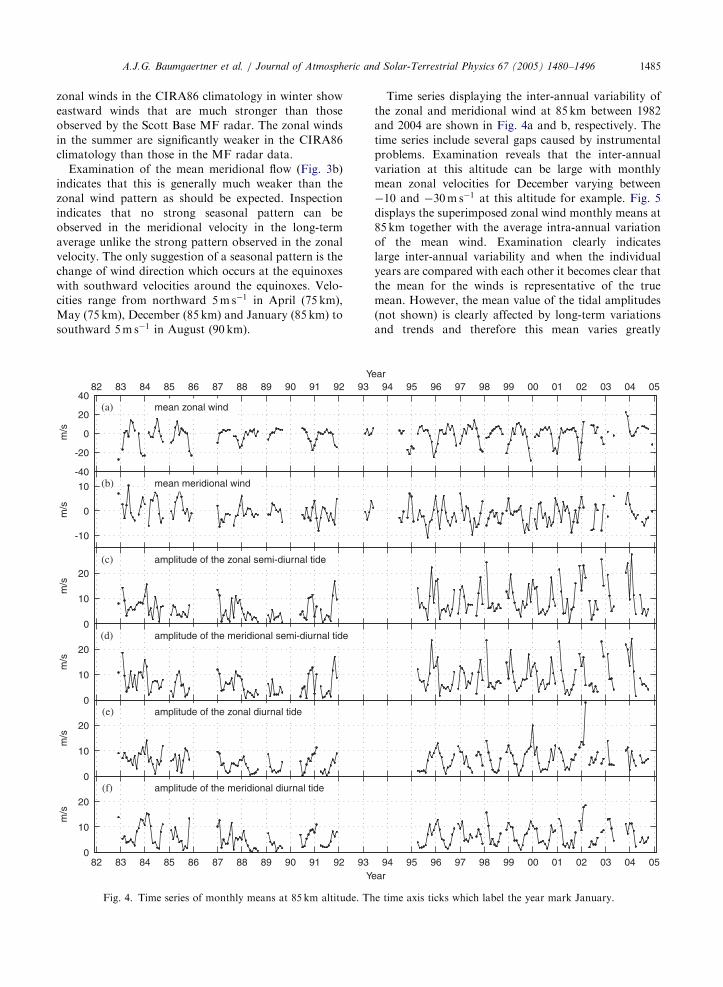
Fig. 4. Time series of monthly means at 85 km altitude. Th
Time series displaying the inter-annual variability of
the zonal and meridional wind at 85 km between 1982
and 2004 are shown in Fig. 4a and b, respectively. The
time series include several gaps caused by instrumental
problems. Examination reveals that the inter-annual
variation at this altitude can be large with monthly
mean zonal velocities for December varying between
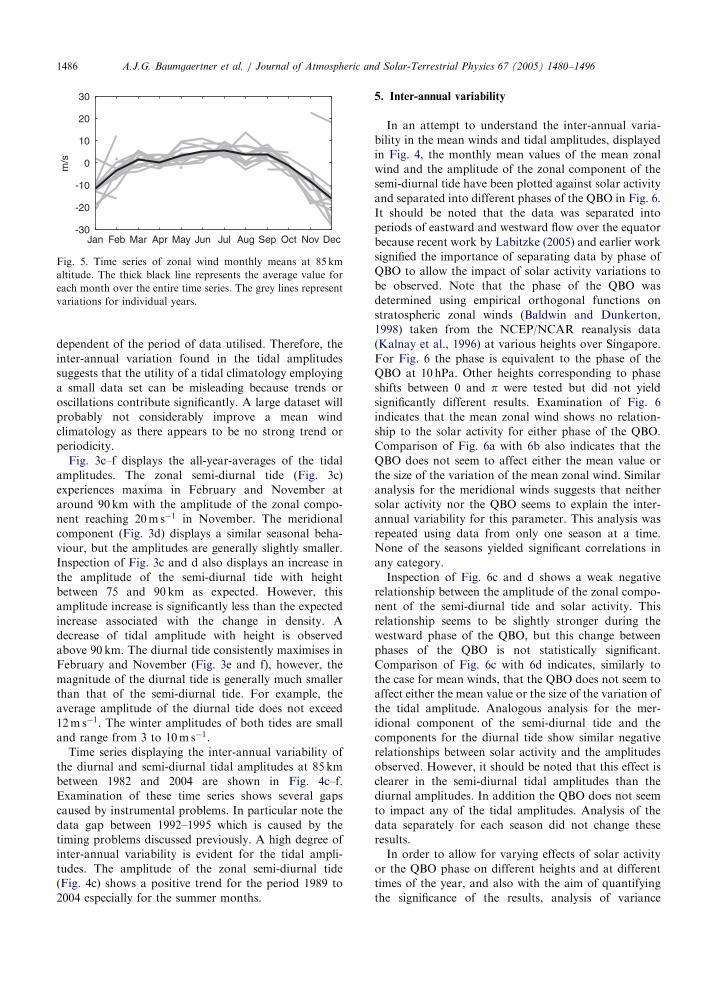
�10 and �30m s�1 at this altitude for example. Fig. 5
displays the superimposed zonal wind monthly means at
85 km together with the average intra-annual variation
of the mean wind. Examination clearly indicates
large inter-annual variability and when the individual
years are compared with each other it becomes clear that
the mean for the winds is representative of the true
mean. However, the mean value of the tidal amplitudes
(not shown) is clearly affected by long-term variations
and trends and therefore this mean varies greatly
94 95 96 97 98 99 00 01 02 03 04 05ear
94 95 96 97 98 99 00 01 02 03 04 05ear
e time axis ticks which label the year mark January.
ARTICLE IN PRESS
Jan Feb Mar Apr May Jun Jul Aug Sep Oct Nov Dec-30
-20
-10
0
10
20
30
m/s
Fig. 5. Time series of zonal wind monthly means at 85 km
altitude. The thick black line represents the average value for
each month over the entire time series. The grey lines represent
variations for individual years.
A.J.G. Baumgaertner et al. / Journal of Atmospheric and Solar-Terrestrial Physics 67 (2005) 1480–14961486
dependent of the period of data utilised. Therefore, the
inter-annual variation found in the tidal amplitudes
suggests that the utility of a tidal climatology employing
a small data set can be misleading because trends or
oscillations contribute significantly. A large dataset will
probably not considerably improve a mean wind
climatology as there appears to be no strong trend or
periodicity.
Fig. 3c–f displays the all-year-averages of the tidal
amplitudes. The zonal semi-diurnal tide (Fig. 3c)
experiences maxima in February and November at
around 90 km with the amplitude of the zonal compo-
nent reaching 20m s�1 in November. The meridional
component (Fig. 3d) displays a similar seasonal beha-
viour, but the amplitudes are generally slightly smaller.
Inspection of Fig. 3c and d also displays an increase in
the amplitude of the semi-diurnal tide with height
between 75 and 90 km as expected. However, this
amplitude increase is significantly less than the expected
increase associated with the change in density. A
decrease of tidal amplitude with height is observed
above 90 km. The diurnal tide consistently maximises in
February and November (Fig. 3e and f), however, the
magnitude of the diurnal tide is generally much smaller
than that of the semi-diurnal tide. For example, the
average amplitude of the diurnal tide does not exceed
12m s�1. The winter amplitudes of both tides are small
and range from 3 to 10m s�1.
Time series displaying the inter-annual variability of
the diurnal and semi-diurnal tidal amplitudes at 85 km
between 1982 and 2004 are shown in Fig. 4c–f.
Examination of these time series shows several gaps
caused by instrumental problems. In particular note the
data gap between 1992–1995 which is caused by the
timing problems discussed previously. A high degree of
inter-annual variability is evident for the tidal ampli-
tudes. The amplitude of the zonal semi-diurnal tide
(Fig. 4c) shows a positive trend for the period 1989 to
2004 especially for the summer months.
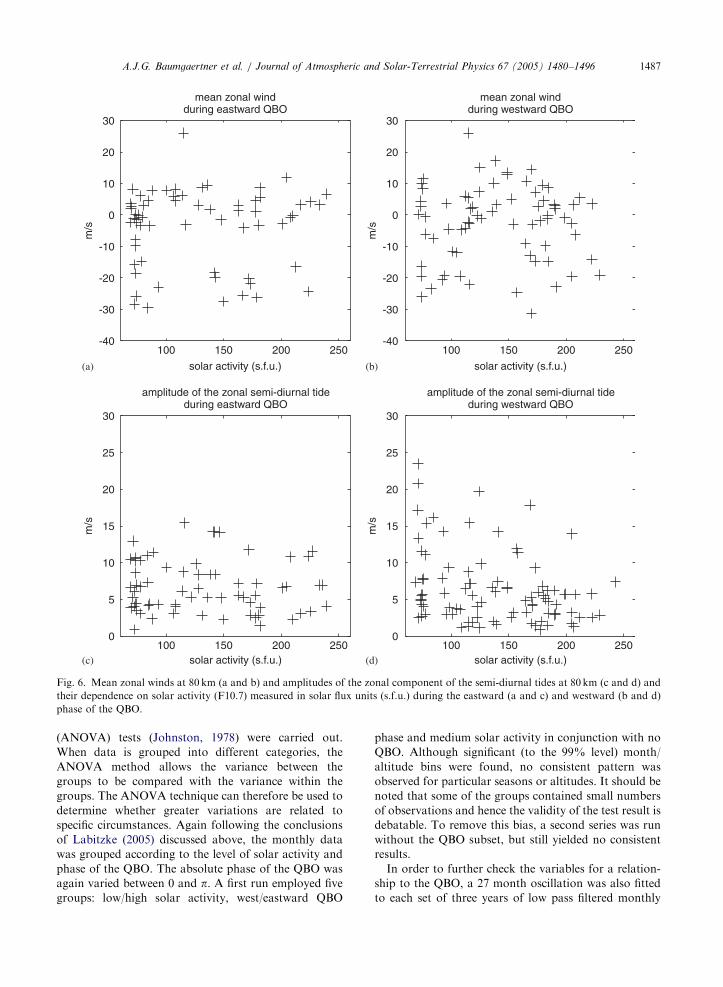
5. Inter-annual variability
In an attempt to understand the inter-annual varia-
bility in the mean winds and tidal amplitudes, displayed
in Fig. 4, the monthly mean values of the mean zonal
wind and the amplitude of the zonal component of the
semi-diurnal tide have been plotted against solar activity
and separated into different phases of the QBO in Fig. 6.
It should be noted that the data was separated into
periods of eastward and westward flow over the equator
because recent work by Labitzke (2005) and earlier work
signified the importance of separating data by phase of
QBO to allow the impact of solar activity variations to
be observed. Note that the phase of the QBO was
determined using empirical orthogonal functions on
stratospheric zonal winds (Baldwin and Dunkerton,
1998) taken from the NCEP/NCAR reanalysis data
(Kalnay et al., 1996) at various heights over Singapore.
For Fig. 6 the phase is equivalent to the phase of the
QBO at 10 hPa. Other heights corresponding to phase
shifts between 0 and p were tested but did not yield
significantly different results. Examination of Fig. 6
indicates that the mean zonal wind shows no relation-
ship to the solar activity for either phase of the QBO.
Comparison of Fig. 6a with 6b also indicates that the
QBO does not seem to affect either the mean value or
the size of the variation of the mean zonal wind. Similar
analysis for the meridional winds suggests that neither
solar activity nor the QBO seems to explain the inter-
annual variability for this parameter. This analysis was
repeated using data from only one season at a time.
None of the seasons yielded significant correlations in
any category.
Inspection of Fig. 6c and d shows a weak negative
relationship between the amplitude of the zonal compo-
nent of the semi-diurnal tide and solar activity. This
relationship seems to be slightly stronger during the
westward phase of the QBO, but this change between
phases of the QBO is not statistically significant.
Comparison of Fig. 6c with 6d indicates, similarly to
the case for mean winds, that the QBO does not seem to
affect either the mean value or the size of the variation of
the tidal amplitude. Analogous analysis for the mer-
idional component of the semi-diurnal tide and the
components for the diurnal tide show similar negative
relationships between solar activity and the amplitudes
observed. However, it should be noted that this effect is
clearer in the semi-diurnal tidal amplitudes than the
diurnal amplitudes. In addition the QBO does not seem
to impact any of the tidal amplitudes. Analysis of the
data separately for each season did not change these
results.
In order to allow for varying effects of solar activity
or the QBO phase on different heights and at different
times of the year, and also with the aim of quantifying
the significance of the results, analysis of variance
ARTICLE IN PRESS
100 150 200 250-40
-30
-20
-10
0
10
20
30
mean zonal windduring eastward QBO
solar activity (s.f.u.)
m/s
100 150 200 250-40
-30
-20
-10
0
10
20
30
mean zonal windduring westward QBO
solar activity (s.f.u.)m
/s
100 150 200 2500
5
10
15
20
25
30
amplitude of the zonal semi-diurnal tideduring eastward QBO
solar activity (s.f.u.)
m/s
100 150 200 2500
5
10
15
20
25
30
amplitude of the zonal semi-diurnal tideduring westward QBO
solar activity (s.f.u.)
m/s
(b)
(c) (d)
(a)
Fig. 6. Mean zonal winds at 80 km (a and b) and amplitudes of the zonal component of the semi-diurnal tides at 80 km (c and d) and
their dependence on solar activity (F10.7) measured in solar flux units (s.f.u.) during the eastward (a and c) and westward (b and d)
phase of the QBO.
A.J.G. Baumgaertner et al. / Journal of Atmospheric and Solar-Terrestrial Physics 67 (2005) 1480–1496 1487
(ANOVA) tests (Johnston, 1978) were carried out.
When data is grouped into different categories, the
ANOVA method allows the variance between the
groups to be compared with the variance within the
groups. The ANOVA technique can therefore be used to
determine whether greater variations are related to
specific circumstances. Again following the conclusions
of Labitzke (2005) discussed above, the monthly data
was grouped according to the level of solar activity and
phase of the QBO. The absolute phase of the QBO was
again varied between 0 and p. A first run employed five
groups: low/high solar activity, west/eastward QBO
phase and medium solar activity in conjunction with no
QBO. Although significant (to the 99% level) month/
altitude bins were found, no consistent pattern was
observed for particular seasons or altitudes. It should be
noted that some of the groups contained small numbers
of observations and hence the validity of the test result is
debatable. To remove this bias, a second series was run
without the QBO subset, but still yielded no consistent
results.
In order to further check the variables for a relation-
ship to the QBO, a 27 month oscillation was also fitted
to each set of three years of low pass filtered monthly
ARTICLE IN PRESS
22 11 8 6 4 3 20
5
10
Period (years)
Pow
er
0.990.95
0.5
0.990.95
0.5
(a)
22 11 8 6 4 3 20
5
10
Period (years)
Pow
er
0.990.95
0.5
0.990.95
0.5
(b)
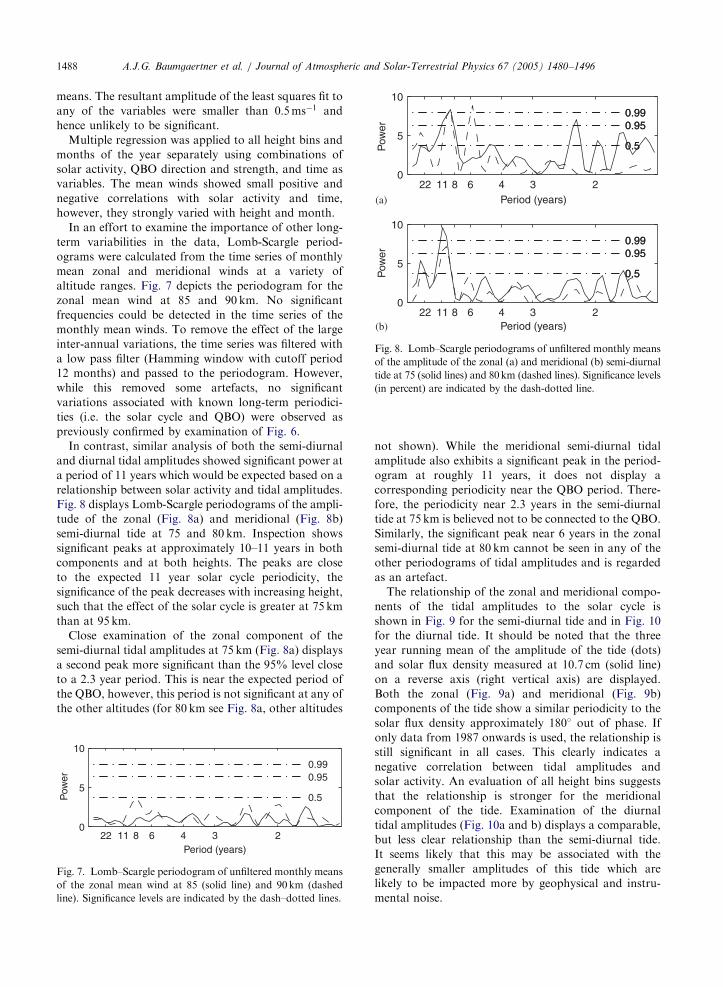
Fig. 8. Lomb–Scargle periodograms of unfiltered monthly means
of the amplitude of the zonal (a) and meridional (b) semi-diurnal
tide at 75 (solid lines) and 80km (dashed lines). Significance levels
(in percent) are indicated by the dash-dotted line.
A.J.G. Baumgaertner et al. / Journal of Atmospheric and Solar-Terrestrial Physics 67 (2005) 1480–14961488
means. The resultant amplitude of the least squares fit to
any of the variables were smaller than 0:5ms�1 and
hence unlikely to be significant.
Multiple regression was applied to all height bins and
months of the year separately using combinations of
solar activity, QBO direction and strength, and time as
variables. The mean winds showed small positive and
negative correlations with solar activity and time,
however, they strongly varied with height and month.
In an effort to examine the importance of other long-
term variabilities in the data, Lomb-Scargle period-
ograms were calculated from the time series of monthly
mean zonal and meridional winds at a variety of
altitude ranges. Fig. 7 depicts the periodogram for the
zonal mean wind at 85 and 90 km. No significant
frequencies could be detected in the time series of the
monthly mean winds. To remove the effect of the large
inter-annual variations, the time series was filtered with
a low pass filter (Hamming window with cutoff period
12 months) and passed to the periodogram. However,
while this removed some artefacts, no significant
variations associated with known long-term periodici-
ties (i.e. the solar cycle and QBO) were observed as
previously confirmed by examination of Fig. 6.
In contrast, similar analysis of both the semi-diurnal
and diurnal tidal amplitudes showed significant power at
a period of 11 years which would be expected based on a
relationship between solar activity and tidal amplitudes.
Fig. 8 displays Lomb-Scargle periodograms of the ampli-
tude of the zonal (Fig. 8a) and meridional (Fig. 8b)
semi-diurnal tide at 75 and 80 km. Inspection shows
significant peaks at approximately 10–11 years in both
components and at both heights. The peaks are close
to the expected 11 year solar cycle periodicity, the
significance of the peak decreases with increasing height,
such that the effect of the solar cycle is greater at 75 km
than at 95 km.
Close examination of the zonal component of the
semi-diurnal tidal amplitudes at 75 km (Fig. 8a) displays
a second peak more significant than the 95% level close
to a 2.3 year period. This is near the expected period of
the QBO, however, this period is not significant at any of
the other altitudes (for 80 km see Fig. 8a, other altitudes
22 11 8 6 4 3 20
5
10
Period (years)
Pow
er
0.990.95
0.5
Fig. 7. Lomb–Scargle periodogram of unfiltered monthly means
of the zonal mean wind at 85 (solid line) and 90km (dashed
line). Significance levels are indicated by the dash–dotted lines.
not shown). While the meridional semi-diurnal tidal
amplitude also exhibits a significant peak in the period-
ogram at roughly 11 years, it does not display a
corresponding periodicity near the QBO period. There-
fore, the periodicity near 2.3 years in the semi-diurnal
tide at 75 km is believed not to be connected to the QBO.
Similarly, the significant peak near 6 years in the zonal
semi-diurnal tide at 80 km cannot be seen in any of the
other periodograms of tidal amplitudes and is regarded
as an artefact.
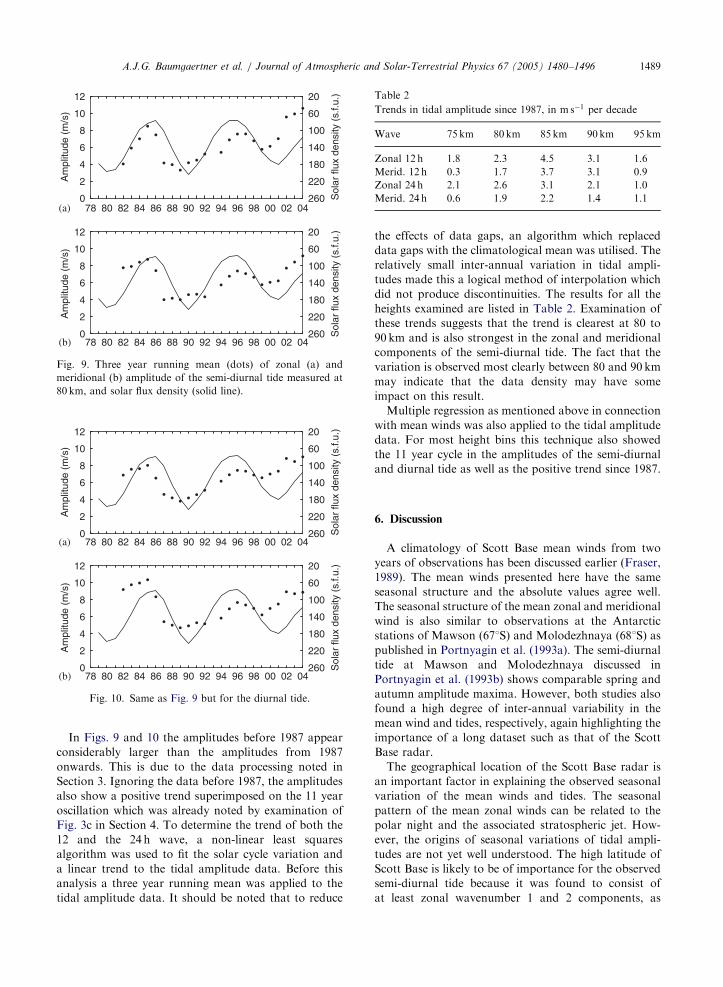
The relationship of the zonal and meridional compo-
nents of the tidal amplitudes to the solar cycle is
shown in Fig. 9 for the semi-diurnal tide and in Fig. 10
for the diurnal tide. It should be noted that the three
year running mean of the amplitude of the tide (dots)
and solar flux density measured at 10.7 cm (solid line)
on a reverse axis (right vertical axis) are displayed.
Both the zonal (Fig. 9a) and meridional (Fig. 9b)
components of the tide show a similar periodicity to the
solar flux density approximately 180� out of phase. If
only data from 1987 onwards is used, the relationship is
still significant in all cases. This clearly indicates a
negative correlation between tidal amplitudes and
solar activity. An evaluation of all height bins suggests
that the relationship is stronger for the meridional
component of the tide. Examination of the diurnal
tidal amplitudes (Fig. 10a and b) displays a comparable,
but less clear relationship than the semi-diurnal tide.
It seems likely that this may be associated with the
generally smaller amplitudes of this tide which are
likely to be impacted more by geophysical and instru-
mental noise.
ARTICLE IN PRESS
78 80 82 84 86 88 90 92 94 96 98 00 02 040
2
4
6
8
10
12
Am
plitu
de (
m/s
)
20
60
100
140
180
220
260 Sol
ar fl
ux d
ensi
ty (
s.f.u
.)
(a)
78 80 82 84 86 88 90 92 94 96 98 00 02 040
2
4
6
8
10
12
Am
plitu
de (
m/s
)
20
60
100
140
180
220
260 Sol
ar fl
ux d
ensi
ty (
s.f.u
.)(b)
Fig. 9. Three year running mean (dots) of zonal (a) and
meridional (b) amplitude of the semi-diurnal tide measured at
80 km, and solar flux density (solid line).
78 80 82 84 86 88 90 92 94 96 98 00 02 040
2
4
6
8
10
12
Am
plitu
de (
m/s
)
20
60
100
140
180
220
260 Sol
ar fl
ux d
ensi
ty (
s.f.u
.)
(a)
78 80 82 84 86 88 90 92 94 96 98 00 02 040
2
4
6
8
10
12
Am
plitu
de (
m/s
)
20
60
100
140
180
220
260 Sol
ar fl
ux d
ensi
ty (
s.f.u
.)
(b)
Fig. 10. Same as Fig. 9 but for the diurnal tide.
Table 2
Trends in tidal amplitude since 1987, in m s�1 per decade
Wave 75 km 80km 85km 90km 95 km
Zonal 12 h 1.8 2.3 4.5 3.1 1.6
Merid. 12 h 0.3 1.7 3.7 3.1 0.9
Zonal 24 h 2.1 2.6 3.1 2.1 1.0
Merid. 24 h 0.6 1.9 2.2 1.4 1.1
A.J.G. Baumgaertner et al. / Journal of Atmospheric and Solar-Terrestrial Physics 67 (2005) 1480–1496 1489
In Figs. 9 and 10 the amplitudes before 1987 appear
considerably larger than the amplitudes from 1987
onwards. This is due to the data processing noted in
Section 3. Ignoring the data before 1987, the amplitudes
also show a positive trend superimposed on the 11 year
oscillation which was already noted by examination of
Fig. 3c in Section 4. To determine the trend of both the
12 and the 24 h wave, a non-linear least squares
algorithm was used to fit the solar cycle variation and
a linear trend to the tidal amplitude data. Before this
analysis a three year running mean was applied to the
tidal amplitude data. It should be noted that to reduce
the effects of data gaps, an algorithm which replaced
data gaps with the climatological mean was utilised. The
relatively small inter-annual variation in tidal ampli-
tudes made this a logical method of interpolation which
did not produce discontinuities. The results for all the
heights examined are listed in Table 2. Examination of
these trends suggests that the trend is clearest at 80 to
90 km and is also strongest in the zonal and meridional
components of the semi-diurnal tide. The fact that the
variation is observed most clearly between 80 and 90 km
may indicate that the data density may have some
impact on this result.
Multiple regression as mentioned above in connection
with mean winds was also applied to the tidal amplitude
data. For most height bins this technique also showed
the 11 year cycle in the amplitudes of the semi-diurnal
and diurnal tide as well as the positive trend since 1987.
6. Discussion
A climatology of Scott Base mean winds from two
years of observations has been discussed earlier (Fraser,
1989). The mean winds presented here have the same
seasonal structure and the absolute values agree well.
The seasonal structure of the mean zonal and meridional
wind is also similar to observations at the Antarctic
stations of Mawson (671S) and Molodezhnaya (681S) as
published in Portnyagin et al. (1993a). The semi-diurnal
tide at Mawson and Molodezhnaya discussed in
Portnyagin et al. (1993b) shows comparable spring and
autumn amplitude maxima. However, both studies also
found a high degree of inter-annual variability in the
mean wind and tides, respectively, again highlighting the
importance of a long dataset such as that of the Scott
Base radar.
The geographical location of the Scott Base radar is
an important factor in explaining the observed seasonal
variation of the mean winds and tides. The seasonal
pattern of the mean zonal winds can be related to the
polar night and the associated stratospheric jet. How-
ever, the origins of seasonal variations of tidal ampli-
tudes are not yet well understood. The high latitude of
Scott Base is likely to be of importance for the observed
semi-diurnal tide because it was found to consist of
at least zonal wavenumber 1 and 2 components, as
ARTICLE IN PRESSA.J.G. Baumgaertner et al. / Journal of Atmospheric and Solar-Terrestrial Physics 67 (2005) 1480–14961490
discussed by Hernandez et al. (1993) and Riggin et al.
(1999). Unfortunately, it is impossible to distinguish
between the different components using data from only
one location, therefore we can only tentatively discuss
what implications these findings have for Scott Base
observations. Angelats i Coll and Forbes (2002) have
shown that non-linear interaction between a wavenum-
ber 1 planetary wave and a semi-diurnal tide with
wavenumber 2 can create a semi-diurnal tide with
wavenumber 1. The possibility that the tide observed
at Scott Base has a large wavenumber 1 component
generated by planetary waves was examined by compar-
ing the seasonal pattern of planetary wave amplitudes
(Fig. 11) with amplitudes of the semi-diurnal tide
(Fig. 12). It becomes evident that the amplitude maxima
of the semi-diurnal tide in spring, summer and autumn
as observed in the climatology in Section 4 result from
several relatively short peaks. Note that the tidal
amplitudes were calculated by fitting the tides and a
mean to ten days of data. This window was shifted by
one day to get values for each day of the year. The
higher resolution amplitudes do not significantly affect
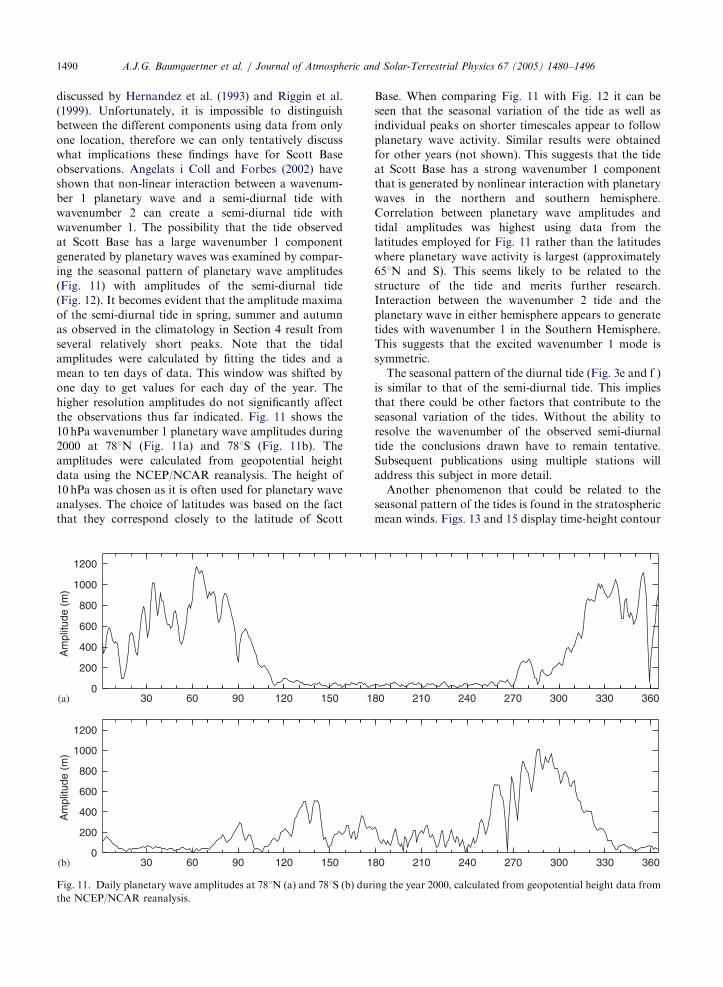
the observations thus far indicated. Fig. 11 shows the
10 hPa wavenumber 1 planetary wave amplitudes during
2000 at 781N (Fig. 11a) and 781S (Fig. 11b). The
amplitudes were calculated from geopotential height
data using the NCEP/NCAR reanalysis. The height of
10 hPa was chosen as it is often used for planetary wave
analyses. The choice of latitudes was based on the fact
that they correspond closely to the latitude of Scott
30 60 90 120 150 10
200
400
600
800
1000
1200
Am
plitu
de (
m)
30 60 90 120 150 10
200
400
600
800
1000
1200
Am
plitu
de (
m)
(a)
(b)
Fig. 11. Daily planetary wave amplitudes at 781N (a) and 781S (b) dur
the NCEP/NCAR reanalysis.
Base. When comparing Fig. 11 with Fig. 12 it can be
seen that the seasonal variation of the tide as well as
individual peaks on shorter timescales appear to follow
planetary wave activity. Similar results were obtained
for other years (not shown). This suggests that the tide
at Scott Base has a strong wavenumber 1 component
that is generated by nonlinear interaction with planetary
waves in the northern and southern hemisphere.
Correlation between planetary wave amplitudes and
tidal amplitudes was highest using data from the
latitudes employed for Fig. 11 rather than the latitudes
where planetary wave activity is largest (approximately
651N and S). This seems likely to be related to the
structure of the tide and merits further research.
Interaction between the wavenumber 2 tide and the
planetary wave in either hemisphere appears to generate
tides with wavenumber 1 in the Southern Hemisphere.
This suggests that the excited wavenumber 1 mode is
symmetric.
The seasonal pattern of the diurnal tide (Fig. 3e and f )
is similar to that of the semi-diurnal tide. This implies
that there could be other factors that contribute to the
seasonal variation of the tides. Without the ability to
resolve the wavenumber of the observed semi-diurnal
tide the conclusions drawn have to remain tentative.
Subsequent publications using multiple stations will
address this subject in more detail.
Another phenomenon that could be related to the
seasonal pattern of the tides is found in the stratospheric
mean winds. Figs. 13 and 15 display time-height contour
80 210 240 270 300 330 360
80 210 240 270 300 330 360
ing the year 2000, calculated from geopotential height data from
ARTICLE IN PRESS
0
00
0
0
0
0
0
0
00 0
0
0
0
0
0
0
0
00
00
0
0
0
0
00
0
0
Am
plitu
de (
km)
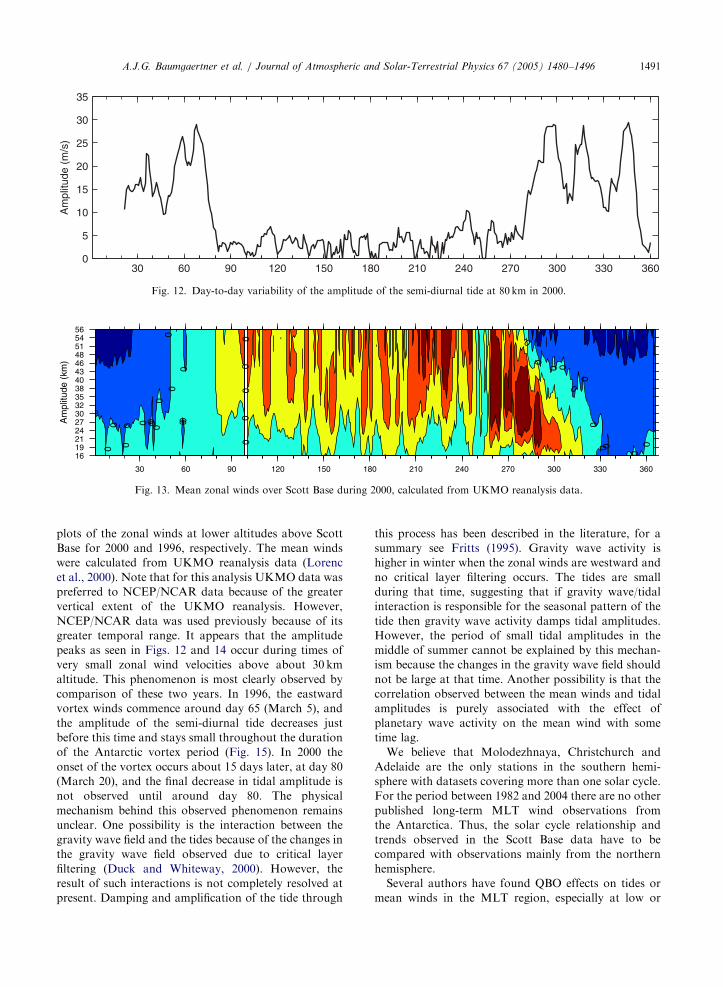
30 60 90 120 150 180 210 240 270 300 330 360
16192124273032353840434648515456
Fig. 13. Mean zonal winds over Scott Base during 2000, calculated from UKMO reanalysis data.
30 60 90 120 150 180 210 240 270 300 330 3600
5
10
15
20
25
30
35
Am
plitu
de (
m/s
)
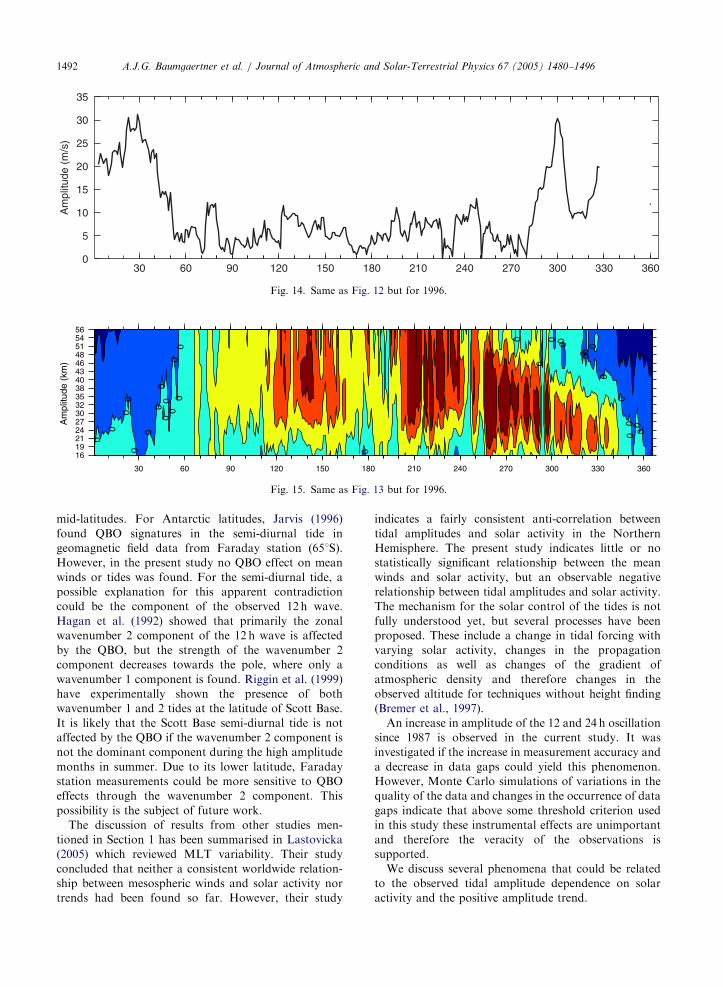
Fig. 12. Day-to-day variability of the amplitude of the semi-diurnal tide at 80 km in 2000.
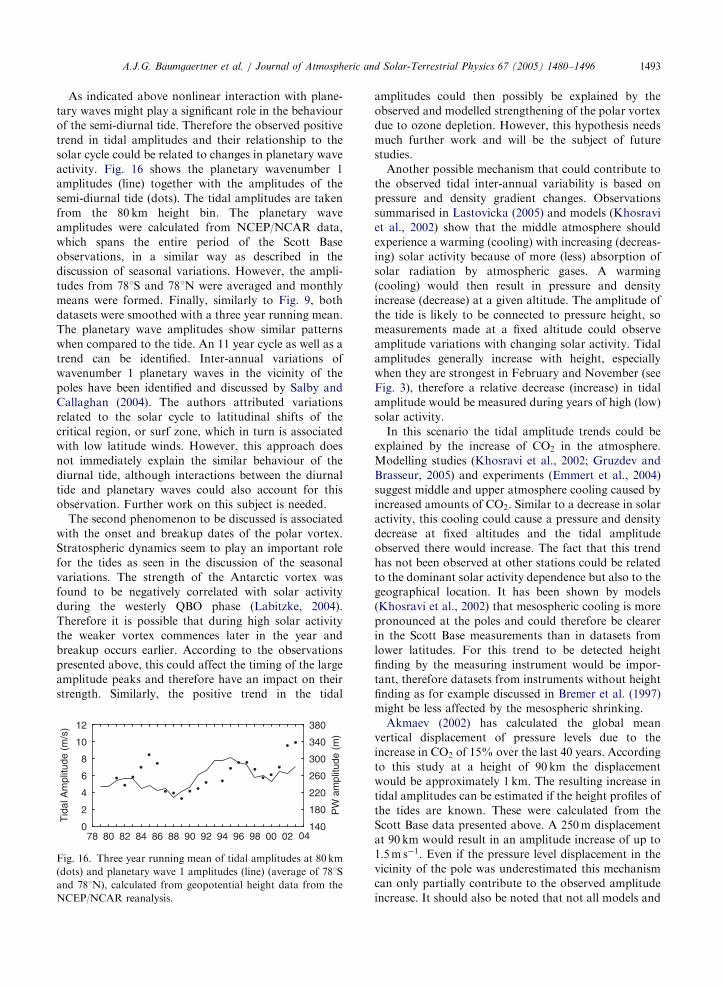
A.J.G. Baumgaertner et al. / Journal of Atmospheric and Solar-Terrestrial Physics 67 (2005) 1480–1496 1491
plots of the zonal winds at lower altitudes above Scott
Base for 2000 and 1996, respectively. The mean winds
were calculated from UKMO reanalysis data (Lorenc
et al., 2000). Note that for this analysis UKMO data was
preferred to NCEP/NCAR data because of the greater
vertical extent of the UKMO reanalysis. However,
NCEP/NCAR data was used previously because of its
greater temporal range. It appears that the amplitude
peaks as seen in Figs. 12 and 14 occur during times of
very small zonal wind velocities above about 30 km
altitude. This phenomenon is most clearly observed by
comparison of these two years. In 1996, the eastward
vortex winds commence around day 65 (March 5), and
the amplitude of the semi-diurnal tide decreases just
before this time and stays small throughout the duration
of the Antarctic vortex period (Fig. 15). In 2000 the
onset of the vortex occurs about 15 days later, at day 80
(March 20), and the final decrease in tidal amplitude is
not observed until around day 80. The physical
mechanism behind this observed phenomenon remains
unclear. One possibility is the interaction between the
gravity wave field and the tides because of the changes in
the gravity wave field observed due to critical layer
filtering (Duck and Whiteway, 2000). However, the
result of such interactions is not completely resolved at
present. Damping and amplification of the tide through
this process has been described in the literature, for a
summary see Fritts (1995). Gravity wave activity is
higher in winter when the zonal winds are westward and
no critical layer filtering occurs. The tides are small
during that time, suggesting that if gravity wave/tidal
interaction is responsible for the seasonal pattern of the
tide then gravity wave activity damps tidal amplitudes.
However, the period of small tidal amplitudes in the
middle of summer cannot be explained by this mechan-
ism because the changes in the gravity wave field should
not be large at that time. Another possibility is that the
correlation observed between the mean winds and tidal
amplitudes is purely associated with the effect of
planetary wave activity on the mean wind with some
time lag.
We believe that Molodezhnaya, Christchurch and
Adelaide are the only stations in the southern hemi-
sphere with datasets covering more than one solar cycle.
For the period between 1982 and 2004 there are no other
published long-term MLT wind observations from
the Antarctica. Thus, the solar cycle relationship and
trends observed in the Scott Base data have to be
compared with observations mainly from the northern
hemisphere.
Several authors have found QBO effects on tides or
mean winds in the MLT region, especially at low or
ARTICLE IN PRESS
0
0
0
0
00
00
00
00
0
0 0
0
0
00
0
0
00
00
0 0 0
0
0
0
Am
plitu
de (
km)
30 60 90 120 150 180 210 240 270 300 330 360
16192124273032353840434648515456
Fig. 15. Same as Fig. 13 but for 1996.
30 60 90 120 150 180 210 240 270 300 330 3600
5
10
15
20
25
30
35
Am
plitu
de (
m/s
)
Fig. 14. Same as Fig. 12 but for 1996.
A.J.G. Baumgaertner et al. / Journal of Atmospheric and Solar-Terrestrial Physics 67 (2005) 1480–14961492
mid-latitudes. For Antarctic latitudes, Jarvis (1996)
found QBO signatures in the semi-diurnal tide in
geomagnetic field data from Faraday station (651S).
However, in the present study no QBO effect on mean
winds or tides was found. For the semi-diurnal tide, a
possible explanation for this apparent contradiction
could be the component of the observed 12 h wave.
Hagan et al. (1992) showed that primarily the zonal
wavenumber 2 component of the 12 h wave is affected
by the QBO, but the strength of the wavenumber 2
component decreases towards the pole, where only a
wavenumber 1 component is found. Riggin et al. (1999)
have experimentally shown the presence of both
wavenumber 1 and 2 tides at the latitude of Scott Base.
It is likely that the Scott Base semi-diurnal tide is not
affected by the QBO if the wavenumber 2 component is
not the dominant component during the high amplitude
months in summer. Due to its lower latitude, Faraday
station measurements could be more sensitive to QBO
effects through the wavenumber 2 component. This
possibility is the subject of future work.
The discussion of results from other studies men-
tioned in Section 1 has been summarised in Lastovicka
(2005) which reviewed MLT variability. Their study
concluded that neither a consistent worldwide relation-
ship between mesospheric winds and solar activity nor
trends had been found so far. However, their study
indicates a fairly consistent anti-correlation between
tidal amplitudes and solar activity in the Northern
Hemisphere. The present study indicates little or no
statistically significant relationship between the mean
winds and solar activity, but an observable negative
relationship between tidal amplitudes and solar activity.
The mechanism for the solar control of the tides is not
fully understood yet, but several processes have been
proposed. These include a change in tidal forcing with
varying solar activity, changes in the propagation
conditions as well as changes of the gradient of
atmospheric density and therefore changes in the
observed altitude for techniques without height finding
(Bremer et al., 1997).
An increase in amplitude of the 12 and 24 h oscillation
since 1987 is observed in the current study. It was
investigated if the increase in measurement accuracy and
a decrease in data gaps could yield this phenomenon.
However, Monte Carlo simulations of variations in the
quality of the data and changes in the occurrence of data
gaps indicate that above some threshold criterion used
in this study these instrumental effects are unimportant
and therefore the veracity of the observations is
supported.
We discuss several phenomena that could be related
to the observed tidal amplitude dependence on solar
activity and the positive amplitude trend.
ARTICLE IN PRESSA.J.G. Baumgaertner et al. / Journal of Atmospheric and Solar-Terrestrial Physics 67 (2005) 1480–1496 1493
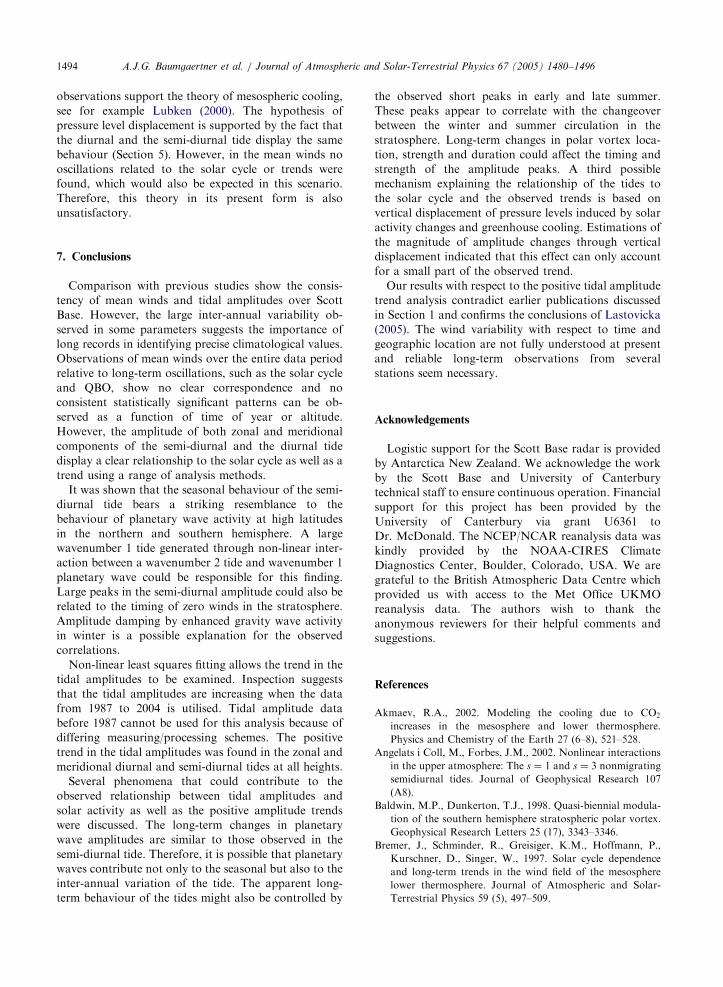
As indicated above nonlinear interaction with plane-
tary waves might play a significant role in the behaviour
of the semi-diurnal tide. Therefore the observed positive
trend in tidal amplitudes and their relationship to the
solar cycle could be related to changes in planetary wave
activity. Fig. 16 shows the planetary wavenumber 1
amplitudes (line) together with the amplitudes of the
semi-diurnal tide (dots). The tidal amplitudes are taken
from the 80 km height bin. The planetary wave
amplitudes were calculated from NCEP/NCAR data,
which spans the entire period of the Scott Base
observations, in a similar way as described in the
discussion of seasonal variations. However, the ampli-
tudes from 781S and 781N were averaged and monthly
means were formed. Finally, similarly to Fig. 9, both
datasets were smoothed with a three year running mean.
The planetary wave amplitudes show similar patterns
when compared to the tide. An 11 year cycle as well as a
trend can be identified. Inter-annual variations of
wavenumber 1 planetary waves in the vicinity of the
poles have been identified and discussed by Salby and
Callaghan (2004). The authors attributed variations
related to the solar cycle to latitudinal shifts of the
critical region, or surf zone, which in turn is associated
with low latitude winds. However, this approach does
not immediately explain the similar behaviour of the
diurnal tide, although interactions between the diurnal
tide and planetary waves could also account for this
observation. Further work on this subject is needed.
The second phenomenon to be discussed is associated
with the onset and breakup dates of the polar vortex.
Stratospheric dynamics seem to play an important role
for the tides as seen in the discussion of the seasonal
variations. The strength of the Antarctic vortex was
found to be negatively correlated with solar activity
during the westerly QBO phase (Labitzke, 2004).
Therefore it is possible that during high solar activity
the weaker vortex commences later in the year and
breakup occurs earlier. According to the observations
presented above, this could affect the timing of the large
amplitude peaks and therefore have an impact on their
strength. Similarly, the positive trend in the tidal
78 80 82 84 86 88 90 92 94 96 98 00 020
2
4
6
8
10
12
Tid
al A
mpl
itude
(m
/s)
04140
180
220
260
300
340
380
PW
am
plitu
de (
m)
Fig. 16. Three year running mean of tidal amplitudes at 80 km
(dots) and planetary wave 1 amplitudes (line) (average of 781S
and 781N), calculated from geopotential height data from the
NCEP/NCAR reanalysis.
amplitudes could then possibly be explained by the
observed and modelled strengthening of the polar vortex
due to ozone depletion. However, this hypothesis needs
much further work and will be the subject of future
studies.
Another possible mechanism that could contribute to
the observed tidal inter-annual variability is based on
pressure and density gradient changes. Observations
summarised in Lastovicka (2005) and models (Khosravi
et al., 2002) show that the middle atmosphere should
experience a warming (cooling) with increasing (decreas-
ing) solar activity because of more (less) absorption of
solar radiation by atmospheric gases. A warming
(cooling) would then result in pressure and density
increase (decrease) at a given altitude. The amplitude of
the tide is likely to be connected to pressure height, so
measurements made at a fixed altitude could observe
amplitude variations with changing solar activity. Tidal
amplitudes generally increase with height, especially
when they are strongest in February and November (see
Fig. 3), therefore a relative decrease (increase) in tidal
amplitude would be measured during years of high (low)
solar activity.
In this scenario the tidal amplitude trends could be
explained by the increase of CO2 in the atmosphere.
Modelling studies (Khosravi et al., 2002; Gruzdev and
Brasseur, 2005) and experiments (Emmert et al., 2004)
suggest middle and upper atmosphere cooling caused by
increased amounts of CO2. Similar to a decrease in solar
activity, this cooling could cause a pressure and density
decrease at fixed altitudes and the tidal amplitude
observed there would increase. The fact that this trend
has not been observed at other stations could be related
to the dominant solar activity dependence but also to the
geographical location. It has been shown by models
(Khosravi et al., 2002) that mesospheric cooling is more
pronounced at the poles and could therefore be clearer
in the Scott Base measurements than in datasets from
lower latitudes. For this trend to be detected height
finding by the measuring instrument would be impor-
tant, therefore datasets from instruments without height
finding as for example discussed in Bremer et al. (1997)
might be less affected by the mesospheric shrinking.
Akmaev (2002) has calculated the global mean
vertical displacement of pressure levels due to the
increase in CO2 of 15% over the last 40 years. According
to this study at a height of 90 km the displacement
would be approximately 1 km. The resulting increase in
tidal amplitudes can be estimated if the height profiles of
the tides are known. These were calculated from the
Scott Base data presented above. A 250m displacement
at 90 km would result in an amplitude increase of up to
1:5m s�1. Even if the pressure level displacement in the
vicinity of the pole was underestimated this mechanism
can only partially contribute to the observed amplitude
increase. It should also be noted that not all models and
ARTICLE IN PRESSA.J.G. Baumgaertner et al. / Journal of Atmospheric and Solar-Terrestrial Physics 67 (2005) 1480–14961494
observations support the theory of mesospheric cooling,
see for example Lubken (2000). The hypothesis of
pressure level displacement is supported by the fact that
the diurnal and the semi-diurnal tide display the same
behaviour (Section 5). However, in the mean winds no
oscillations related to the solar cycle or trends were
found, which would also be expected in this scenario.
Therefore, this theory in its present form is also
unsatisfactory.
7. Conclusions
Comparison with previous studies show the consis-
tency of mean winds and tidal amplitudes over Scott
Base. However, the large inter-annual variability ob-
served in some parameters suggests the importance of
long records in identifying precise climatological values.
Observations of mean winds over the entire data period
relative to long-term oscillations, such as the solar cycle
and QBO, show no clear correspondence and no
consistent statistically significant patterns can be ob-
served as a function of time of year or altitude.
However, the amplitude of both zonal and meridional
components of the semi-diurnal and the diurnal tide
display a clear relationship to the solar cycle as well as a
trend using a range of analysis methods.
It was shown that the seasonal behaviour of the semi-
diurnal tide bears a striking resemblance to the
behaviour of planetary wave activity at high latitudes
in the northern and southern hemisphere. A large
wavenumber 1 tide generated through non-linear inter-
action between a wavenumber 2 tide and wavenumber 1
planetary wave could be responsible for this finding.
Large peaks in the semi-diurnal amplitude could also be
related to the timing of zero winds in the stratosphere.
Amplitude damping by enhanced gravity wave activity
in winter is a possible explanation for the observed
correlations.
Non-linear least squares fitting allows the trend in the
tidal amplitudes to be examined. Inspection suggests
that the tidal amplitudes are increasing when the data
from 1987 to 2004 is utilised. Tidal amplitude data
before 1987 cannot be used for this analysis because of
differing measuring/processing schemes. The positive
trend in the tidal amplitudes was found in the zonal and
meridional diurnal and semi-diurnal tides at all heights.
Several phenomena that could contribute to the
observed relationship between tidal amplitudes and
solar activity as well as the positive amplitude trends
were discussed. The long-term changes in planetary
wave amplitudes are similar to those observed in the
semi-diurnal tide. Therefore, it is possible that planetary
waves contribute not only to the seasonal but also to the
inter-annual variation of the tide. The apparent long-
term behaviour of the tides might also be controlled by
the observed short peaks in early and late summer.
These peaks appear to correlate with the changeover
between the winter and summer circulation in the
stratosphere. Long-term changes in polar vortex loca-
tion, strength and duration could affect the timing and
strength of the amplitude peaks. A third possible
mechanism explaining the relationship of the tides to
the solar cycle and the observed trends is based on
vertical displacement of pressure levels induced by solar
activity changes and greenhouse cooling. Estimations of
the magnitude of amplitude changes through vertical
displacement indicated that this effect can only account
for a small part of the observed trend.
Our results with respect to the positive tidal amplitude
trend analysis contradict earlier publications discussed
in Section 1 and confirms the conclusions of Lastovicka
(2005). The wind variability with respect to time and
geographic location are not fully understood at present
and reliable long-term observations from several
stations seem necessary.
Acknowledgements
Logistic support for the Scott Base radar is provided
by Antarctica New Zealand. We acknowledge the work
by the Scott Base and University of Canterbury
technical staff to ensure continuous operation. Financial
support for this project has been provided by the
University of Canterbury via grant U6361 to
Dr. McDonald. The NCEP/NCAR reanalysis data was
kindly provided by the NOAA-CIRES Climate
Diagnostics Center, Boulder, Colorado, USA. We are
grateful to the British Atmospheric Data Centre which
provided us with access to the Met Office UKMO
reanalysis data. The authors wish to thank the
anonymous reviewers for their helpful comments and
suggestions.
References
Akmaev, R.A., 2002. Modeling the cooling due to CO2
increases in the mesosphere and lower thermosphere.
Physics and Chemistry of the Earth 27 (6–8), 521–528.
Angelats i Coll, M., Forbes, J.M., 2002. Nonlinear interactions
in the upper atmosphere: The s ¼ 1 and s ¼ 3 nonmigrating
semidiurnal tides. Journal of Geophysical Research 107
(A8).
Baldwin, M.P., Dunkerton, T.J., 1998. Quasi-biennial modula-
tion of the southern hemisphere stratospheric polar vortex.
Geophysical Research Letters 25 (17), 3343–3346.
Bremer, J., Schminder, R., Greisiger, K.M., Hoffmann, P.,
Kurschner, D., Singer, W., 1997. Solar cycle dependence
and long-term trends in the wind field of the mesosphere
lower thermosphere. Journal of Atmospheric and Solar-
Terrestrial Physics 59 (5), 497–509.
ARTICLE IN PRESSA.J.G. Baumgaertner et al. / Journal of Atmospheric and Solar-Terrestrial Physics 67 (2005) 1480–1496 1495
Brown, G.M., Chapman, J.W., 1972. Full correlation iono-
spheric drift analysis for a general observing triangle.
Annales De Geophysique 28 (2), 349–356.
Dartt, D., Nastrom, G., Belmont, A., 1983. Seasonal and solar-
cycle wind variations, 80–100 km. Journal of Atmospheric
and Terrestrial Physics 45 (10), 707–718.
Duck, T.J., Whiteway, J.A., 2000. Seasonal transition in gravity
wave activity during the springtime stratospheric vortex
breakdown. Geophysical Research Letters 27 (21), 3477–3480.
D’Yachenko, V.A., Lysenko, I.A., Portnyagin, Y.I., 1986.
Long-term periodicities in lower thermospheric wind varia-
tions. Journal of Atmospheric and Terrestrial Physics 48
(11–12), 1117–1119.
Emmert, J.T., Picone, J.M., Lean, J.L., Knowles, S.H., 2004.
Global change in the thermosphere: compelling evidence of
a secular decrease in density. Journal of Geophysical
Research 109, A02301.
Fahrutdinova, A.N., Ganin, V.A., Berdunov, N.V., Ishmur-
atov, R.A., Hutorova, O.G., 1997. Long-term variations of
circulation in the mid-latitude upper Mesosphere lower
Thermosphere. Advances in Space Research 20 (6),
1161–1164.
Fraser, G.J., 1984. Summer Circulation in the Antarctic Middle
Atmosphere. Journal of Atmospheric and Terrestrial
Physics 46 (2), 143–146.
Fraser, G.J., 1989. Monthly Mean Winds in the Mesosphere at
44S and 78S. Pure and Applied Geophysics 130 (2–3),
291–301.
Fraser, G.J., 1990. Long-term variations in mid-latitude
Southern Hemisphere mesospheric winds. Advances in
Space Research 10 (10), 247–250.
Fraser, G.J., Vincent, R.A., Manson, A.H., Meek, C.E., Clark,
R.R., 1989. Inter-annual variability of tides in the meso-
sphere and lower thermosphere. Journal of Atmospheric
and Terrestrial Physics 51 (7–8), 555–567.
Fritts, D.C., 1995. Gravity wave-tidal interactions in the
middle atmosphere: observations and theory. In: Johnson,
R.M., Killeen, T.L. (Eds.), The Upper Mesosphere and
Lower Thermosphere: A Review of Experiment and Theory.
Geophysical Monograph, vol. 87, AGU, pp. 121–131.
Gavrilov, N.M., Fukao, S., Nakamura, T., Jacobi, C.,
Kurschner, D., Manson, A.H., Meek, C.E., 2002. Com-
parative study of interannual changes of the mean winds
and gravity wave activity in the middle atmosphere over
Japan, Central Europe and Canada. Journal of Atmo-
spheric and Solar-Terrestrial Physics 64 (8–11), 1003–1010.
Greisiger, K.M., Schminder, R., Kurschner, D., 1987. Long-
period variations of wind parameters in the mesopause
region and the solar cycle dependence. Journal of Atmo-
spheric and Terrestrial Physics 49 (3), 281–285.
Gruzdev, A.N., Brasseur, G.P., 2005. Long-term changes in the
mesosphere calculated by a two-dimensional model. Journal
of Geophysical Research 110, D03304.
Gurubaran, S., Rajaram, R., 1999. Long-term variability in the
mesospheric tidal winds observed by MF radar over
Tirunelveli (8.71N, 77.81E). Geophysical Research Letters
26 (8), 1113–1116.
Hagan, M.E., Vial, F., Forbes, J.M., 1992. Variability in the
upward propagating semidiurnal tide due to effects of qbo
in the lower atmosphere. Journal of Atmospheric and
Terrestrial Physics 54 (11–12), 1465–1474.
Hernandez, G., Fraser, G.J., Smith, R.W., 1993. Mesospheric
12-h oscillation near south-pole, Antarctica. Geophysical
Research Letters 20 (17), 1787–1790.
Jacobi, C., Schminder, R., Kurschner, D., Bremer, J., Greisiger,
K.M., Hoffmann, P., Singer, W., 1997. Long-term trends in
the mesopause wind field obtained from LF D1 wind
measurements at Collm, Germany. Advances in Space
Research 20 (11), 2085–2088.
Jarvis, M.J., 1996. Quasi-biennial oscillation effects in the
semidiurnal tide of the Antarctic lower thermosphere.
Geophysical Research Letters 23 (19), 2661–2664.
Johnston, R.J., 1978. Multivariate Statistical Analysis in
Geography: a Primer on the General Linear Model.
Longman, London, New York.
Kalnay, E., Kanamitsu, M., Kistler, R., Collins, W., Deaven,
D., Gandin, L., Iredell, M., Saha, S., White, G., Woollen, J.,
Zhu, Y., Chelliah, M., Ebisuzaki, W., Higgins, W.,
Janowiak, J., Mo, K.C., Ropelewski, C., Wang, J.,
Leetmaa, A., Reynolds, R., Jenne, R., Joseph, D., 1996.
The NCEP/NCAR 40-year reanalysis project. Bulletin of
the American Meteorological Society 77 (3), 437– 471.
Khosravi, R., Brasseur, G., Smith, A., Rusch, D., Walters, S.,
Chabrillat, S., Kockarts, G., 2002. Response of the meso-
sphere to human-induced perturbations and solar variability
calculated by a 2-D model. Journal of Geophysical
Research 107 (D18), 4358.
Labitzke, K., 2004. On the signal of the 11-year sunpot cycle in
the stratosphere over the Antarctic and its modulation by
the Quasi-Biennial Oscillation (QBO). Meteorologische
Zeitschrift 13 (4), 263–270.
Labitzke, K., 2005. On the solar cycle-QBO relationship: a
summary. Journal of Atmospheric and Solar-Terrestrial
Physics 67 (1–2), 45–54.
Lastovicka, J., 2005. On the role of solar and geomagnetic
activity in long-term trends in the atmosphere–ionosphere
system. Journal of Atmospheric and Solar-Terrestrial
Physics 67 (1–2), 83–92.
Lorenc, A.C., Ballard, S.P., Bell, R.S., Ingleby, N.B., Andrews,
P.L.F., Barker, D.M., Bray, J.R., Clayton, A.M., Dalby, T.,
Li, D., Payne, T.J., Saunders, F.W., 2000. The Met. Office
global three-dimensional variational data assimilation
scheme. Quarterly Journal of the Royal Meteorological
Society 126 (570), 2991–3012.
Lubken, F.J., 2000. Nearly zero temperature trend in the polar
summer mesosphere. Geophysical Research Letters 27 (21),
3603–3606.
Middleton, H.R., Mitchell, N.J., Muller, H.G., 2002. Mean
winds of the mesosphere and lower thermosphere at 52 deg
N in the period 1988–2000. Annales Geophysicae 20 (1),
81–91.
Namboothiri, S.P., Manson, A.H., Meek, C.E., 1993. Varia-
tions of mean winds and tides in the upper middle
atmosphere over a solar cycle, Saskatoon, Canada, 52 deg
N, 107 deg W. Journal of Atmospheric and Terrestrial
Physics 55 (10), 1325 –1334.
Namboothiri, S.P., Meek, C.E., Manson, A.H., 1994. Varia-
tions of mean winds and solar tides in the mesosphere and
lower thermosphere over time scales ranging from
6 months to 11 yr: Saskatoon, 52 deg N, 107 deg W.
Journal of Atmospheric and Terrestrial Physics 56 (10),
1313–1325.
ARTICLE IN PRESSA.J.G. Baumgaertner et al. / Journal of Atmospheric and Solar-Terrestrial Physics 67 (2005) 1480–14961496
Portnyagin, Y.I., Forbes, J.M., Fraser, G.J., Vincent, R.A.,
Avery, S.K., Lysenko, I.A., Makarov, N.A., 1993a.
Dynamics of the Antarctic and Arctic Mesosphere and
Lower Thermosphere Regions.1. The Prevailing Wind.
Journal of Atmospheric and Terrestrial Physics 55 (6),
827–841.
Portnyagin, Y.I., Forbes, J.M., Fraser, G.J., Vincent, R.A.,
Avery, S.K., Lysenko, I.A., Makarov, N.A., 1993b. Dynamics
of the Antarctic and Arctic Mesosphere and Lower Thermo-
sphere Regions.2. The Semidiurnal Tide. Journal of Atmo-
spheric and Terrestrial Physics 55 (6), 843–855.
Portnyagin, Y.I., Solovjova, T.V., 2000. Global empirical wind
model for the upper mesosphere/lower thermosphere. I.
Prevailing wind. Annales Geophysicae-Atmospheres Hy-
drospheres and Space Sciences 18 (3), 300–315.
Rees, D., Barnett, J.J., Labitzke, K., 1990. CIRA 1986, Part II
Middle Atmosphere Models. Advances in Space Research
10 (2), 187–206.
Riggin, D.M., Fritts, D.C., Jarvis, M.J., Jones, G.O.L., 1999.
Spatial structure of the 12-h wave in the Antarctic as
observed by radar. Earth Planets and Space 51 (7–8),
621– 628.
Salby, M., Callaghan, P., 2004. Evidence of the solar cycle in
the general circulation of the stratosphere. Journal of
Climate 17 (1), 34– 46.
Sprenger, K., Schminder, R., 1969. Solar cycle dependence of
winds in the lower ionosphere. Journal of Atmospheric and
Solar-Terrestrial Physics 31, 217–221.
Thomas, G.E., 1996. Is the polar mesosphere the miner’s canary
of global change? Advances in Space Research 18 (3),
149–158.
Vincent, R.A., Kovalam, S., Fritts, D.C., Isler, J.R., 1998.
Long-term MF radar observations of solar tides in the low-
latitude mesosphere: Interannual variability and compar-
isons with the GSWM. Journal of Geophysical Research
103 (D8), 8667–8683.