long term intervention monitoring project - logic … 2013 mdfrc publication long term intervention...
TRANSCRIPT

May 2
013
Long Term Intervention Monitoring
Project
Logic and Rationale Document
Version 1.0
Prepared by: Ben Gawne, Shane Brooks, Rhonda Butcher, Peter
Cottingham, Penny Everingham, Jenny Hale, Daryl Nielson, Mike
Stewardson and Rick Stoffels.
MDFRC Publication 01/2013

Long Term Intervention Monitoring Logic and Rationale Document Report prepared for the Commonwealth Environmental Water Office by The Murray-Darling
Freshwater Research Centre.
Disclaimer
The views and opinions expressed in this publication are those of the authors and do not
necessarily reflect those of the Australian Government or the Minister for Sustainability,
Environment, Water, Population and Communities. While reasonable efforts have been
made to ensure that the contents of this publication are factually correct, the Commonwealth
does not accept responsibility for the accuracy or completeness of the contents, and shall
not be liable for any loss or damage that may be occasioned directly or indirectly through the
use of, or reliance on, the contents of this publication.
© Commonwealth of Australia 2011. This work is copyright. Apart from any use as permitted
under the Copyright Act 1968, no part may be reproduced by any process without prior
written permission from the Commonwealth. Requests and enquiries concerning
reproduction and rights should be addressed to Department of Sustainability, Environment,
Water, Population and Communities, Public Affairs, GPO Box 787 Canberra ACT 2601 or
email [email protected].
This report was prepared by The Murray-Darling Freshwater Research Centre (MDFRC).
The aim of the MDFRC is to provide the scientific knowledge necessary for the management
and sustained utilisation of the Murray-Darling Basin water resources. The MDFRC is a joint
venture between the Murray-Darling Basin Authority, La Trobe University and CSIRO
(through its Division of Land and Water). Additional investment is provided through the
Australian Government Department of Sustainability, Environment, Water, Population and
Communities.
For further information contact: Ben Gawne The Murray-Darling Freshwater Research Centre PO Box 991 Wodonga Vic 3689 Ph: (02) 6024 9650; Fax: (02) 6059 7531 Email: [email protected] Web: www.mdfrc.org.au Enquiries: [email protected]

Report Citation: Gawne B, Brooks S, Butcher R, Cottingham P, Everingham P, Hale J, Nielson D, Stewardson M and Stoffels R (2013) Long Term Intervention Monitoring Logic and Rationale Document Final Report prepared for the Commonwealth Environmental Water Office by The Murray-Darling Freshwater Research Centre, MDFRC Publication 01/2013, May, 109pp.
Cover Image: Junction of River Murray and Mullaroo Mouth.
Photographer: David Wood
MDFRC Disclaimer
The material contained in this publication represents the opinion of the author only. Whilst
every effort has been made to ensure that the information in this publication is accurate, the
author and MDFRC do not accept any liability for any loss or damage howsoever arising
whether in contract, tort or otherwise which may be incurred by any person as a result of any
reliance or use of any statement in this publication. The author and MDFRC do not give any
warranties in relation to the accuracy, completeness and up to date status of the information
in this publication.
Where legislation implies any condition or warranty which cannot be excluded restricted or
modified such condition or warranty shall be deemed to be included provided that the
author’s and MDFRC’s liability for a breach of such term condition or warranty is, at the
option of MDFRC, limited to the supply of the services again or the cost of supplying the
services again.
Document History and Status
Version Date Issued Reviewed by Approved by Revision
type
Draft 19 December
2012
CEWO Penny
Everingham
External
Draft 8 March 2013 CEWO Penny
Everingham
External
Draft 20 April 2013 Nina Schuuman Penny
Everingham
External
Final 3 May 2013 Penny
Everingham
Ben Gawne Internal
Distribution of Copies
Version Quantity Issued to
1.0 1x Word Doc Tim Wyndham and Leanne Wilkinson

Filename and path: projects\CEWO\CEWH Long Term Monitoring Project\Final Reports\LTIM Logic and Rationale
Author(s): Ben Gawne, Shane Brooks, Rhonda Butcher, Peter Cottingham,
Penny Everingham, Jenny Hale, Daryl Nielson, Mike Stewardson and Rick Stoffels.
Project Manager: Ben Gawne Client: Commonwealth Environmental Water Office Project Title: Long Term Intervention Monitoring Project Document Version: Final Project Number: M/BUS/435 Contract Number: SON339925
Contents
Executive summary .............................................................................................................................. 1
Scientific rationale ........................................................................................................................... 1
Long Term Intervention Monitoring ................................................................................................. 2
Identifying and prioritising monitoring indicators ............................................................................. 3
Evaluation ........................................................................................................................................ 4
Adaptive management .................................................................................................................... 5
Next steps ....................................................................................................................................... 5
Prelude ................................................................................................................................................... 6
Chapter 1. Introduction ........................................................................................................................ 8
1.1 Legislative background ........................................................................................................... 8
1.2 Basin Plan objectives for environmental water ....................................................................... 9
1.3 Commonwealth environmental water .................................................................................... 10
1.4 CEWO MERI Framework ...................................................................................................... 12
Chapter 2. Scientific rationale for environmental watering ............................................................ 14
2.1 Objectives hierarchy .............................................................................................................. 15
2.1.1 Biodiversity objectives hierarchy ....................................................................................... 19
2.1.2 Ecosystem function objectives hierarchy .......................................................................... 21
2.1.3 Resilience objectives hierarchy ......................................................................................... 22
2.1.4 Water quality objectives hierarchy .................................................................................... 24
2.1.5 Ecosystem condition hierarchy ......................................................................................... 26
2.2 Cause-effect diagrams .......................................................................................................... 28
2.3 The major flow types ............................................................................................................. 31
2.3.1 Base flow (low flows) ......................................................................................................... 32
2.3.2 Freshes ............................................................................................................................. 32
2.3.3 Bankfull .............................................................................................................................. 33
2.3.4 Overbank ........................................................................................................................... 33
2.3.5 Discrete wetland and/or floodplain inundation .................................................................. 33
2.3.6 Flows to achieve Environmental Watering Plan objectives .............................................. 33
2.4 Expected outcomes ............................................................................................................... 35
2.4.1 One-Year expected outcomes .......................................................................................... 35
2.4.2 One-to-five-year expected outcomes ................................................................................ 37
Chapter 3. Long Term intervention monitoring (LTIM) ................................................................... 39
3.1 Context .................................................................................................................................. 39
3.2 Indicator prioritisation ............................................................................................................ 42
3.2.1 Identifying environmental indicators .................................................................................. 42
3.2.2 Selecting indicators ........................................................................................................... 43
3.2.3 LTIM selected area priorities ............................................................................................. 44
3.2.4 Basin–scale priorities ........................................................................................................ 45
3.2.5 Causal factor priority indicators ......................................................................................... 53

3.2.6 Flow characteristic monitoring options – river channel ..................................................... 55
3.2.7 Flow characteristic monitoring options – floodplain .......................................................... 57
3.2.8 Water quality monitoring options ....................................................................................... 58
3.2.9 Summary of priority indicators ........................................................................................... 60
3.3 Monitoring design .................................................................................................................. 63
3.3.1 General principles of good study design ........................................................................... 63
3.3.2 Data analysis considerations for monitoring design .......................................................... 67
3.3.3 Standard methods ............................................................................................................. 68
3.3.4 Data storage and management ......................................................................................... 71
3.3.5 Risk assessment and mitigation strategies ....................................................................... 73
Chapter 4. Evaluation, reporting and adaptive management ......................................................... 75
4.1 Evaluation .............................................................................................................................. 76
4.2 Reporting ............................................................................................................................... 79
4.3 Adaptive Management .......................................................................................................... 81
4.3.1 General principles ............................................................................................................. 82
4.3.2 Models ............................................................................................................................... 83
4.3.3 Data requirements ............................................................................................................. 85
4.3.5 Effects ............................................................................................................................... 87
Chapter 5. Conclusion ........................................................................................................................ 88
References ........................................................................................................................................... 90
Appendix A: Basin Plan more specific Level 2 objectives. ............................................................ 96
Appendix B: Broad Indicators ........................................................................................................... 99

Abbreviations
ANAE Australian National Aquatic Ecosystem
BACI Before-After-Control-Impact
CED Cause-Effect Diagram
CEWH Commonwealth Environmental Water Holder
CEWO Commonwealth Environmental Water Office
DEM Digital Elevation Model
EWP Environmental watering plan
GIS Geographical Information System
LTIM Long Term Intervention Monitoring
MBACI Multiple-Before-After-Control-Impact
MDB Murray-Darling Basin
MDBA Murray-Darling Basin Authority
MDFRC Murray-Darling Freshwater Research Centre
MERI Monitoring, Evaluation, Reporting and Improvement
NDVI Normalized Difference Vegetation Index
SDL Sustainable Diversion Limit
SRA Sustainable Rivers Audit
TLM The Living Murray
VEFMAP Victorian Environmental Flow Monitoring and Assessment Program

1
Executive summary
The role of the Commonwealth Environmental Water Holder (CEWH) is to manage
Commonwealth environmental water to protect or restore the environmental assets of the
Basin, and other areas outside the Basin where the Commonwealth holds water.
The Water Act 2007 (Cth) requires the CEWH to perform its functions and exercise its
powers consistently with and in a manner that gives effect to the Water Act 2007 - Basin
Plan 2012, and specifically, that Commonwealth environmental water is managed in
accordance with the Basin Plan’s environmental watering plan. As part of this requirement,
the Basin Plan places a number of obligations on the Commonwealth Environmental Water
Holder (CEWH), including principles of monitoring and evaluation and reporting
requirements.
Long Term Intervention Monitoring (LTIM) is a key element of the Commonwealth
Environmental Water Office (CEWO) response to the requirements of the Water Act and
Basin Plan. It aims to support improved decision making through the application of the
principles of adaptive management, good governance and reporting. Monitoring and
evaluation are critical steps in the management of Commonwealth environmental water;
supporting the efficient and effective use of Commonwealth environmental water within the
planning framework and demonstrating the achievement of environmental objectives. It will
achieve this objective by measuring environmental responses to watering activities in
selected areas as part of the Monitoring, Evaluation, Reporting and Improvement Framework
(MERI Framework) for Commonwealth environmental watering in the Murray-Darling Basin
(CEWO 2012).
This document describes the scope, high level design and monitoring priorities for the LTIM
Project. The indicators and detailed monitoring design for long term intervention monitoring
won’t be finalised until the Monitoring and Evaluation Plan for each area is completed in
2013-14. At that time, the approach set out here will be subject to a range of practical and
cost considerations that may narrow or broaden the scope of monitoring that may be
undertaken under this project.
Scientific rationale
The scientific rationale is based on the integration of four major inputs to predict the likely
ecological outcomes of environmental water use:
1. an objectives hierarchy of Basin Plan Environmental Water Plan objectives (EWP
objectives). The objectives hierarchy classifies the EWP objectives in a way that is
helpful for environmental water managers, practitioners and scientists, and also sets
out the scientific basis of how delivery of environmental water will contribute to
meeting EWP objectives.
2. a suite of conceptual models (cause-effect diagrams) that use the best available
science to link EWP objectives to changes in flow. The cause-effect diagrams
(CEDs) have been developed to articulate important effects linked to EWP objectives

2
and the way that flow influences these effects through a suite of
environmental/causal factors.
3. the major flow types described in the Basin Plan and their ecological role. The Basin
Plan classifies the hydrology of the Basin in terms of five environmentally significant
flow types. The role of four of the five flow types (base flows, freshes, bank full and
overbank flows) is described in terms of their influence on biodiversity, ecosystem
function, resilience and water quality.
4. the range of possible water availability scenarios over the course of five years.
Ecological outcomes of environmental watering over the one-to-five-year timeframe
are strongly influenced by flow regimes over the period. Through reference to the
CEWO flow management strategy, a range of water availability scenarios from a
sequence of dry to very dry years through to a sequence of wet years are developed
to formulate the range of potential flow objectives over the 1 to 5 year time frame.
These inputs are used to develop a generic set of expected outcomes over both less than 1
year and one-to-five year periods at each of the seven LTIM Selected Areas where long-
term monitoring is to be established. The expected outcomes inform the selection of
indicators, use of Commonwealth environmental water and underpin subsequent evaluation.
Long Term Intervention Monitoring
Intervention monitoring is one of three types of monitoring included in the CEWO MERI
Framework with the other two being operational and program level monitoring. Intervention
monitoring is a key step in the MERI process that underpins evaluation, reporting and
improved decisions and future monitoring through the adaptive management process. The
CEWO MERI Framework includes two types of intervention monitoring, targeted monitoring
of selected actions and long term intervention monitoring of selected areas. The focus of
CEWO Long Term Intervention Monitoring (LTIM) is the ecological response to
Commonwealth environmental water. This Logic and Rationale document is a key input into
the development of long term intervention monitoring of selected areas, which aims to:
monitor the ecological response to Commonwealth environmental watering at each
Selected Area
evaluate ecological outcomes of Commonwealth environmental watering at each
Selected Area
evaluate the contribution of Commonwealth environmental watering to the objectives of
the Murray-Darling Basin Plan
infer ecological outcomes of Commonwealth environmental watering in areas of the
Murray-Darling Basin not monitored
support the adaptive management of Commonwealth environmental water.
LTIM is proposed at the following Selected Areas:
Gwydir river system (in-stream, wetlands and floodplains)
Lachlan river system (in-stream and fringing wetlands)

3
Murrumbidgee river system (in-stream, fringing wetlands and floodplains)
Edward–Wakool river system (in-stream and fringing wetlands)
Goulburn River (in-stream and fringing wetlands)
Lower Murray River (in-stream, connected wetlands, floodplain and temporary non-
connected wetlands)
Junction of the Warrego and Darling rivers.
Identifying and prioritising monitoring indicators
Prioritisation process
The Logic and Rationale provides a basis for selecting broad monitoring indicators at each of
the seven Selected Areas. The broad indicators that have been selected include both effect
indicators that provide information to support reporting against objectives and cause
indicators that, when combined with effect indicators, provide information to support adaptive
management. The list of indicators is then prioritised in order to ensure that the LTIM is
“timely, efficient, cost-effective, consistent and should supply the information needed for
evaluation” (CEWO MERI Principle 8).
The prioritisation involved a three stage process. In the first stage, stakeholders attended
workshops in each Selected Area to provide a local perspective on ecological values and
management priorities. The workshop results were used to generate a prioritised list of
objectives for environmental watering in each area as set out in the relevant requirements
documents.
In the second stage, the prioritised objectives were evaluated against three additional
considerations:
whole of Basin reporting obligations;
the potential for monitoring results to be extrapolated to demonstrate ecological
outcomes in areas not being monitored; and
the value of monitoring results for adaptive management of environmental water.
Finally, prioritisation of causal indicators was based on the importance of causal indicators to
delivery team decisions and their frequency or occurrence in CEDs.
Monitoring priorities
The process identified eighteen monitoring priorities and forty priority indicators, spread
among the seven selected areas. Ten of the indicators were identified as priorities at all
sites, including ecosystem diversity, vegetation condition and fish diversity.
Several of the prioritised indicators would rely on remote sensing, including ecosystem
diversity, vegetation condition and extent, and the floodplain component of primary
production. One benefit of remote sensing is that it can provide an estimate of the entire

4
selected area in a cost-effective way. For this reason, these four indicators can be
monitored at all areas.
Other indicators identified as priorities in all areas were chemical water quality, hydrological
connectivity, suspended sediment, river channel primary production and decomposition.
These indicators are both important to the outcome of an environmental flow and relatively
inexpensive to collect.
Identifying standard methods, sampling design and analysis
With the indicators selected, some consideration can be given to standard methods,
sampling design and analysis. In terms of standard methods, indicators fall into one of three
categories. For some indicators, there are established methods available that meet the
CEWO criteria, including tree condition, bird monitoring and river channel fish. For others,
including hydrological and water quality monitoring, there are a range of options available
that need to be developed in consultation with other government institutions. The third group
of indicators, including wetland fish, will require development of a standard method in
consultation with monitoring and evaluation service providers.
From a sampling design perspective there are a number of options available, the selection of
which will depend on the type of ecosystem, opportunities for reference sites and the
anticipated scale of response. Finalisation of the sampling design will inform the types of
analysis that may be undertaken. Two of the options that have been successfully
implemented in other environmental monitoring programs are Before After Control Impact
(BACI) design analysis and Bayesian hierarchical analysis.
Evaluation
Evaluation is essential to identifying change, supporting adaptive management in a dynamic
system and supporting learning at an individual, community and institutional level. For the
LTIM, the evaluation process will be undertaken at multiple spatial and temporal scales in
order to support different reporting requirements and both planning and operational
decisions. Effective evaluation is reliant on robust program logic, which has been described
in sections two and three. In addition, the LTIM will consider assumptions and explicitly
state hypotheses to be tested in the development of the selected area Monitoring and
Evaluation plans.
The objectives hierarchy and CEDs that underpin the development of expected outcomes
provide a foundation for the alignment of the scales over which monitoring and evaluation
are undertaken. In particular, this logic will support an evaluation of:
the outcomes Commonwealth environmental watering against the expected outcomes
relevant in each selected area
the contribution Commonwealth environmental watering to the objectives of the Basin
Plan.

5
Reporting at the Basin-scale requires interpretation of the contribution of watering-area
outcomes to achievement of Basin scale objectives. To facilitate this process, five
categories of outcome are described that guide this process;
1. Basin-scale responses e.g. waterbirds
2. Recruitment of potentially mobile species e.g. fish
3. Protecting or restoring species with restricted distributions
4. Protecting or restoring specific ecosystem types
5. Contributing to the protection or restoration of wide-spread species.
Adaptive management
Evaluation also supports adaptive management which is a way of dealing with uncertainty in
the management of complex systems and learning from experience to improve
environmental outcomes as part of an iterative process. Effective adaptive management
requires processes to generate, communicate, assimilate and apply new knowledge to
improve monitoring, evaluation, system understanding and future interventions. LTIM will
include the development of statistical models that will facilitate the generation, assimilation
and application knowledge to future management decisions. The key decisions to be
supported from the CEWO perspective are planning (one and five year time frames),
operational and monitoring. The models required to support these different decisions will
vary and so a suite of models will be identified and prioritised in the next phase of LTIM
development.
The focus on model development does, however, create requirements in the areas of data
labelling, flow descriptions and experimental design. While these can be considered in a
generic sense, their development and finalisation will occur as the detailed monitoring
requirements are developed for each of the LTIM Selected Areas.
Next steps
Overall, the Logic and Rationale document is part of the adaptive management process and
should therefore be treated as an evolving document. Over time, the institutional context
within which the CEWO operates will change and this may require changes to the logic and
rationale. This document and the related Monitoring and Evaluation Requirements
documents will in the first instance be used to guide the development of:
detailed Monitoring and Evaluation Plans for each Selected Area
Evaluation and Data Management Plans
Over the longer term, it is anticipated that the approach set out here will evolve as the LTIM
Project is implemented. Developments in our knowledge, generated by LTIM, other
monitoring programs and research, that the indicators, sampling designs, analytical
methods, CEDs and associated descriptions and objectives hierarchy may all be modified to
reflect our improved understanding.

6
Prelude
This document is the LTIM Logic and Rationale document developed to support the CEWO
Long Term Intervention Monitoring (LTIM) Project. It has been developed because it is
important that the implementation of the CEWO Monitoring, Evaluation, Reporting and
Improvement (MERI) framework is based on a program logic that is clear, transparent and
based on the best available science. This document is an important element of the
implementation process and is designed to ensure that a logical and robust framework
guides the development and implementation of the LTIM Project. It is also anticipated that
the LTIM Logic and Rationale document will be important in the ongoing adaptive
management of environmental water, providing an accessible source of information on the
response of water-dependent ecosystems to environmental flows.
In order to achieve these objectives, the document is based on the CEWO MERI program
logic, including conceptual understanding, broad scale monitoring objectives and approach,
and methods for integrating knowledge obtained at localised scales to meet Basin-wide
evaluation objectives. The CEWO MERI process is summarised in Figure 1.
Figure 1. LTIM context for environmental water delivery, monitoring, evaluation and reporting.

7
The document is organised into four chapters.
Chapter 1 provides a summary of the legislative background, EWP objectives, the CEWO
and the MERI Framework, which together provide the institutional context for the LTIM.
Chapter 2 assembles the major inputs required to develop expected outcomes for
environmental watering. The first input is the EWP objectives which are organised into an
objectives hierarchy. The second input is best available science concerning the relationship
between flow and objectives, which is summarised into cause-effect diagrams (CEDs). The
third input is the major flow-types available to the CEWO and their ecological roles, which
have been derived from the Basin Plan. The final input is water availability over the course of
five years. The chapter then describes how these inputs are used to develop the expected
outcomes over both less-than-one-year and one-to-five-year periods. The expected
outcomes inform the use of Commonwealth environmental water and underpin subsequent
evaluation.
Chapter 3 describes the LTIM at seven selected areas in the Murray-Darling Basin
(Monitoring box in Figure 1). The focus is on the identification and prioritisation of both cause
and effect indicators. The chapter then discusses options for standard methods for some of
the nominated indicators.
Chapter 4 describes the way in which LTIM information will be utilised to support evaluation,
reporting and adaptive management (Figure 1) with a heavy emphasis on the use of models
to support predictions of the expected outcomes in response to and in the absence of
environmental flows. The chapter then goes on to discuss some data requirements in order
to ensure data will support model development.
Chapter 5 summarises the key components of the Logic and Rationale.

8
Chapter 1. Introduction
The Commonwealth Environmental Water Office’s long-term intervention monitoring (LTIM)
project aims to measure environmental responses to watering activities in selected areas
where Commonwealth environmental water is delivered as part of the implementation of the
Monitoring, Evaluation, Reporting and Improvement Framework (MERI Framework) for
Commonwealth environmental watering in the Murray-Darling Basin (CEWO 2012). This
document describes the underlying logic and rationale for the LTIM Project.
The long-term intervention monitoring project aims to support improved decision making
through the application of the principles of adaptive management, good governance and
reporting. To achieve this it is important that the program is based on clear and robust
program logic that links EWP objectives to the monitoring of outcomes from flows delivered
by the CEWO. The document also provides an objectives hierarchy that includes cause-
effect diagrams (CEDs) that show generic relationships between flow and expected
ecological outcomes. This LTIM Project logic will be applied to seven selected areas that are
to be the focus of CEWO intervention monitoring. Consultation with stakeholders during the
development of Monitoring and Evaluation Plans for each of the seven selected areas is a
key step in the LTIM Project. This logic document is expected to evolve over time in line with
the principles of adaptive management.
1.1 Legislative background
The Water Act 2007 (Water Act) initiated a number of key water reforms in the Murray-
Darling Basin (the Basin). This included the establishment of the Murray-Darling Basin
Authority (MDBA) and the Commonwealth Environmental Water Holder (CEWH).
The Murray-Darling Basin Authority is vested with the functions and powers, including
enforcement powers, needed to ensure that Basin water resources are managed in an
integrated and sustainable way. The Act also required the MDBA to prepare a strategic plan
for the integrated and sustainable management of Basin water resources: the Basin Plan
(COA 2012).
Key components of the Basin Plan include:
• environmentally sustainable limits on surface water and groundwater use
• an environmental watering plan
• a water quality and salinity management plan
• water resource plan requirements
• water trading rules
• a monitoring and evaluation program.
The Commonwealth Environmental Water Holder’s role is to manage Commonwealth
environmental water ‘to protect or restore the environmental assets of the Basin, and other

9
areas outside the Basin where the Commonwealth holds water, so as to give effect to
relevant international agreements’ (Water Act 2007, s 105(3)). The CEWH must manage the
Commonwealth environmental water holdings in accordance with the environmental
watering plan, which is part of the Basin Plan. The statutory position of the CEWH is
supported in meeting statutory obligations by the Commonwealth Environmental Water
Office (CEWO), a division of the Department of Sustainability, Environment, Water,
Population and Communities (the Department). The CEWH and the CEWO are further
described in the Commonwealth Environmental Water 2012-13 Business Plan.
(www.environment.gov.au/ewater/publications/cew-business-plan-2012-13.html)
The Water Act requires an annual report on the management of Commonwealth
environmental water be provided to the Commonwealth Water Minister, to be tabled in each
House of Parliament and given to relevant State Ministers for each of the Basin states
(Section 114(1)). The report must include information on achievements against the
objectives of the Basin Plan’s environmental watering plan (Section 114(2a)).
Environmental assets are defined by the Water Act as water-dependent ecosystems,
ecosystem services and sites of ecological significance. Water-dependent ecosystems
include; wetlands, streams, floodplains, lakes and other bodies of water, salt marshes,
estuaries, karst and ground water systems.
The Water Act also requires the CEWH ‘to perform its functions and exercise its powers
consistently with and in a manner that gives effect to the Basin Plan’ (Water Act s34), and
specifically, that Commonwealth environmental water is managed in accordance with the
Basin Plan’s environmental watering plan (Water Act s105(4a)).
The Basin Plan places a number of obligations on the CEWH, including:
• matters which the use of Commonwealth environmental water must be consistent with,
or have regard to (refer Section 1.3)
• matters relating to the trading of water
• principles for monitoring and evaluation (refer Section 1.4)
• reporting requirements (refer Section 4.2).
1.2 Basin Plan objectives for environmental water
The Basin Plan identifies a number of environmental objectives for water-dependent
ecosystems in the Murray-Darling Basin. Those objectives are further described in Part 8 of
the Basin Plan (Attachment A). One of these objectives is ‘to protect and restore water-
dependent ecosystems of the Murray-Darling Basin’. For the purposes of program logic
development, this objective is interpreted within the context of the whole of Basin objective
that the Basin Plan is to ‘give effect to relevant international agreements through the
integrated management of Basin water resources’. These international agreements include
Ramsar, JAMBA, CAMBA, ROKAMBA and the Convention on Biological Diversity. The
Convention on Biological Diversity seeks the ‘conservation of biological diversity, sustainable
use of its components and equitable sharing of the benefits’. The Convention uses the term
biodiversity to mean the ‘variability among living organisms’ and this ‘includes diversity within

10
species, between species and of ecosystems’. In this context, protection of water dependent
ecosystems is a means of conserving biological diversity within species, between species
and ecosystems.
For the LTIM Project, the Basin Plan objectives have been arranged hierarchically with the
highest level objectives (Level 1) generically described as Biodiversity, Ecosystem function,
Resilience and Water quality (Table 1).
Table 1. Basin Plan environmental and water quality objectives for water-dependent
ecosystems.
Basin Plan reference
Basin Plan objective Level 1 objectives referred to throughout as
Environmental watering plan
to protect and restore water-dependent ecosystems of the Murray-Darling Basin (Basin Plan, Chapter 8, Part 2, 8.04(a))
Biodiversity
Environmental watering plan
to protect and restore the ecosystem functions of water-dependent ecosystems (Basin Plan, Chapter 8, Part 2, 8.04(b))
Ecosystem function
Environmental watering plan
to ensure that water-dependent ecosystems are resilient to climate change and other risks and threats (Basin Plan, Chapter 8, Part 2, 8.04(c))
Resilience
Water quality and salinity plan
to ensure water quality is sufficient to achieve the above objectives for water-dependent ecosystems, and for Ramsar wetlands, sufficient to maintain ecological character (Basin Plan, Chapter 9, Party 3, 9.04 (1) & (2))
Water quality
The Basin Plan provides more detail around each of the Level 1 objectives above (modified
from COA 2012, refer Appendix A for full text). The Basin Plan also includes environmental
watering plan targets to measure progress towards Basin Plan objectives in Schedule 7 and
water quality and salinity targets in Schedule 11.
Throughout this document the Level 1 objectives above are referred to as Basin Plan
Environmental Watering Plan objectives (EWP objectives). To support the management of
environmental water and development of the LTIM Project, the Level 1 objectives have been
further classified into Level 2 and Level 3 objectives. Although the matters considered within
the Level 2 and Level 3 objectives generally accord with the detailed objectives set out in
Chapter 8 of the Basin Plan (Appendix A), they have been framed to support environmental
watering, rather than reflect specific provisions.
1.3 Commonwealth environmental water
The CEWH was established in 2007, and in accordance with its Water Act obligations,
began managing its portfolio of held environmental water in order to contribute to the
achievement of the EWP objectives. To ensure best practice, considerable time and effort
11
has been expended in the development of processes to undertake water purchase,
planning, management, monitoring and evaluation. As at 31 March 2013, the
Commonwealth held 1,557,757 ML (long-term average) of water entitlements across the
Murray-Darling Basin and has been engaged in delivering environmental water to
environmental assets since March 2009.
Planning for the use of Commonwealth environmental water is developed at strategic and
operational levels and at a range of time scales, including:
annual water use plans
five-year portfolio management strategy
the Basin Plan, which requires the use of Commonwealth environmental water to be
undertaken having regard to the Basin annual environmental watering priorities.
The use of Commonwealth environmental water must also:
be consistent with the environmental watering plan’s objectives
be in accordance with the Principles to be Applied to Environmental Water (CEWO 2012)
have regard to the water quality and salinity targets for managing water flows.
Within the scope established by the Basin Plan’s environmental watering plan, the use of
Commonwealth environmental water is further guided by a planning framework for making
determinations on the available water in any given year (CEWO 2011). It outlines a process
that requires matching water availability with environmental demand based on a robust,
scientifically defensible decision framework, in accordance with multi-year ecological and
operational considerations.
The framework requires consideration of a mixture of operational factors, such as:
the volumes of CEWH and other environmental water that are available
cost effectiveness and feasibility
constraints (e.g. release capacity, channel size)
delivery partners
and ecological information such as:
timing and impact of natural events (e.g. floods, drought)
the ecological significance of the asset to be watered
the expected ecological outcomes from the proposed watering
the potential risks of the proposed watering action at the site and at connected locations
the long-term sustainability of the asset
priority species/communities.

12
Information needs are partially met by the MDBA, partner agencies, expert scientific advice
and local expert knowledge. The CEWO is however, managing environmental water within a
complex system with incomplete knowledge; and through application of the principles of
adaptive management, monitoring of watering events and resulting ecosystem responses
provides ongoing improvement of information feeding into the decision framework.
1.4 CEWO MERI Framework
Monitoring and evaluation are critical steps in the management of Commonwealth
environmental water (Figure 1), supporting the efficient and effective use of Commonwealth
environmental water within the planning framework and demonstrating the achievement of
environmental objectives. In recognition of this the CEWO has developed a monitoring,
evaluation, reporting and improvement (MERI) framework to support accountability, good
governance and adaptive management, and to generate the knowledge to support future
evidence based decisions.
The Basin Plan outlines ten principles to be applied in monitoring and evaluating the
effectiveness of the Basin Plan. Where applicable, the CEWO has adopted those principles
and has derived the following nine principles outlined in its MERI Framework:
1. The Commonwealth Environmental Water Holder will report against matters in a manner
which reflects the degree to which it is accountable.
2. Monitoring and evaluation should be undertaken within the conceptual framework of
program logic.
3. Monitoring and evaluation findings, including in respect of progress towards meeting
objectives and trends in the condition and availability of the Basin water resources,
should enable decision-makers to use adaptive management.
4. Monitoring and evaluation should harness the monitoring capabilities of existing Basin
state and Commonwealth programs (including jointly funded programs), provided that
the programs are consistent with these principles - with a view to aligning and improving
these programs over time.
5. The best available knowledge (including scientific, local and cultural knowledge),
evidence and analysis should be used where practicable to ensure credibility,
transparency and usefulness of monitoring and evaluation findings.
6. Basin states and the Commonwealth should collaborate on the technical and operational
elements of monitoring and evaluation in order to build engagement and ownership.
7. A risk-based approach should be used for investment in monitoring and evaluation.
8. Monitoring and reporting should be timely, efficient, cost-effective, consistent and should
supply the information needed for evaluation.
9. To the extent that it is possible, there will be open access to information collected or
used in, or generated by, monitoring and evaluation.

13
The MERI Framework proposes an adaptive management cycle that aligns with the three
levels of planning associated with the use of Commonwealth environmental water (Basin
Plan, long-term portfolio management and annual water use) and includes operational,
intervention and program level monitoring (Figure 2).
Monitoring and evaluation under the CEWO MERI Framework is cooperatively undertaken
by a number of environmental water partners (Figure 2) that include:
CEWH – statutory position under the Water Act responsible for managing
Commonwealth environment water holdings.
MDBA – responsibilities under the Water Act to measure, monitor and record the
condition of water-dependent ecosystems associated with the Basin water resources.
Basin states – delivery partners, management and monitoring partners.
Bureau of Meteorology – integration and dissemination of water information under the
Water Act.
State agencies and research organisations – provide complementary monitoring and
research.
Timeframe of ecological response
Operational monitoring
Less than 1 yr More than 5 yrs
Short Term Intervention monitoring: ecological monitoring of selected watering actions
Long Term Intervention monitoring (LTIM): long-term ecological monitoring of selected areas where water is delivered (including actions)
TLM monitoring: long-term ecological monitoring at Icon Sites
Program monitoring: broad scale ecological monitoring
across the Basin
Basin Plan(10 yr)
Portfolio management strategy(5 yr planning)
Annual water use, carryover and trade options(1 yr)
Figure 2. Monitoring components outlined in the CEWO MERI Framework, including proposed
lead agencies (image supplied by CEWO). Note: only The Living Murray (TLM) complementary
monitoring is shown, although other complementary monitoring will contribute to the
monitoring of Commonwealth environmental water.

14
The CEWO activities will focus on intervention monitoring that enables the CEWO to report
on the outcomes of environmental water allocations and to develop the knowledge required
to support water use in the future. Ensuring that the LTIM component of the framework
meets these objectives requires consideration of the way that information will be used in the
evaluation of both Commonwealth environmental water activities and achievement of EWP
objectives.
The MDBA will also use the information generated by intervention monitoring to report on the
contribution of environmental water to the protection or restoration of water-dependent
ecosystem conditions. In this way, intervention monitoring will contribute to an assessment
of the condition of river, wetland and floodplain ecosystems in relation to EWP objectives for
water-dependent ecosystems.
Chapter 2. Scientific rationale for environmental watering This chapter outlines the scientific basis for how Commonwealth environmental water
contributes to the objectives of the Basin Plan. The Water Act (2007) requires that
Commonwealth environmental watering be based on clear and robust science while the
Commonwealth MERI guidelines require the establishment of clear program logic.
Chapter 2 assembles the major inputs required to develop expected outcomes for
environmental watering (Figure 3). The first input is the EWP objectives which are organised
into an objectives hierarchy. The second input is best available science on the role of flow on
the objectives which is summarised into cause-effect diagrams (CEDs). The third input is the
major flow types available to the CEWO and their ecological role which have been derived
from the Basin Plan. The final input is the range of possible water availability over the course
of five years. The chapter then describes how these inputs are used to develop the expected
outcomes over both 12-month and one-to-five-year periods (Figure 3). The expected
outcomes inform the use of Commonwealth environmental water and underpin subsequent
evaluation.

15
Figure 3. Chapter 2 describes the process for developing expected outcomes. This figure is an
illustration of the relationship between sections of Chapter 2 and their contribution to
expected outcomes.
2.1 Objectives hierarchy
An objectives hierarchy recognises the nested nature of complex systems in which a large
number of detailed or small scale objectives contribute to a small number of overarching or
large scale objectives. The development of an objectives hierarchy is a way of
communicating these relationships (Kingsford et al. 2011). The relationship between the
EWP objectives has been described in Section 1.2. The objectives hierarchy developed for
this project seeks to classify the EWP objectives in a way that is helpful for environmental
water managers, practitioners and scientists, and also sets out the scientific basis of how
delivery of environmental water will contribute to meeting the EWP objectives. The
objectives hierarchy is consistent with the observed ecological hierarchy (Noss 1990; Dale
and Beyeler 2001) and recognises the complexity and nested nature of water-dependent
ecosystems.
As outlined in Section 1.2, the Basin Plan’s environmental watering plan (Chapter 8)
identifies three overall environmental objectives for water-dependent ecosystems which can
be attributed to the broad headings of; biodiversity, ecosystem function and resilience. The
Basin Plan’s water quality and salinity management plan (Chapter 9) provides a fourth
objective which accounts for water quality related to water-dependent ecosystems and
Ramsar sites.
Nested within each Level 1 objective are the water-dependent ecosystem types to which
they apply. The objectives hierarchy for the Level 1 objectives is presented in Sections 2.1.1
to 2.1.4. Figure 4 shows a generic objectives hierarchy illustrating the key terms and
components of the LTIM objectives hierarchy. Within each of the overall objectives, the
Basin Plan identifies a suite of ‘particular objectives’ (Appendix A), which are referred to for
the purposes of the LTIM Project as Level 2 objectives. Further, the Basin Plan has a suite
of intermediate and long-term targets (Schedule 7) that are to be used to measure progress

16
towards achieving the overall Level 1 objectives. These targets have been used to guide the
development of the Level 3 objectives hierarchy (Figure 4). The terms Level 1, Level 2 and
Level 3 objective are used for the LTIM Project to help arrange information hierarchically to
assist the monitoring and evaluation approach. Level 2 and 3 objectives are not Basin Plan
terminology.
For the Level 2 and 3 objectives, cause-effect diagrams (CEDs) have been developed to
explain the influence of flow on elements of the objectives hierarchy through its influence on
causal categories including habitat, connectivity, processes, disturbance and cues. A further
description of the CEDs is provided in section 2.2. Unique in this hierarchy is the reference
to population condition in relation to the biodiversity Level 1 objectives. Population condition
is an outcome of Level 3 objectives related to species diversity; however, is not a specific
CED.
Figure 4. Generic objectives hierarchy showing the relationship between the key components
of the LTIM Logic and Rationale.
Figure 5 shows the first three tiers of the objectives hierarchy as it has been applied to the
LTIM Project, including the Level 1 objectives, as outlined above and in Section 1.2, and
their related Level 2 objectives. For example, the Basin Plan, as it relates to the Level 2
biodiversity objectives, refers to both protecting and restoring a subset of all water-
dependent ecosystems (ecosystem biodiversity) and representative populations and
communities of native biota (species biodiversity). A further example is the Level 1 resilience
objective which is supported by Level 2 objectives that refer to both water-dependent
ecosystems and populations of native flora and fauna. Accordingly, the objectives hierarchy
illustrates those relationships: species biodiversity is nested within ecosystem diversity and
population resilience is nested within ecosystem resilience.

17
Figure 5. Environmental Water Plan objectives relevant to Level 1 and Level 2 of the objectives
hierarchy.
Having classified the EWP objectives for water-dependent ecosystems into the structure
presented in Figure 5, the next step is to establish the potential role of Commonwealth
environmental water in achieving those objectives. To do so, we developed a series of
cause-effect diagrams (CEDs) that show our understanding of the causal linkages between
EWP objectives and flow. A CED is a graphical representation of the relationship between
an expected outcome and potential factors that could influence the outcome.
In the case of ecosystem function and water quality, CEDs were developed on the content of
the Level 2 objectives. For biodiversity, CEDs were developed for Level 2 and 3 objectives
based on both the wording of the Basin Plan (e.g. populations of native biota) and the best
available information on the population processes and characteristics required to sustain the
Level 3 objectives. In the case of resilience, CEDs were developed to describe the major
biotic strategies that enable biota to resist, adapt or recover from disturbances. In the first
instance, the CEDs were designed to be generic to enable their modification and application
to specific biota or processes in particular regions of the Basin.
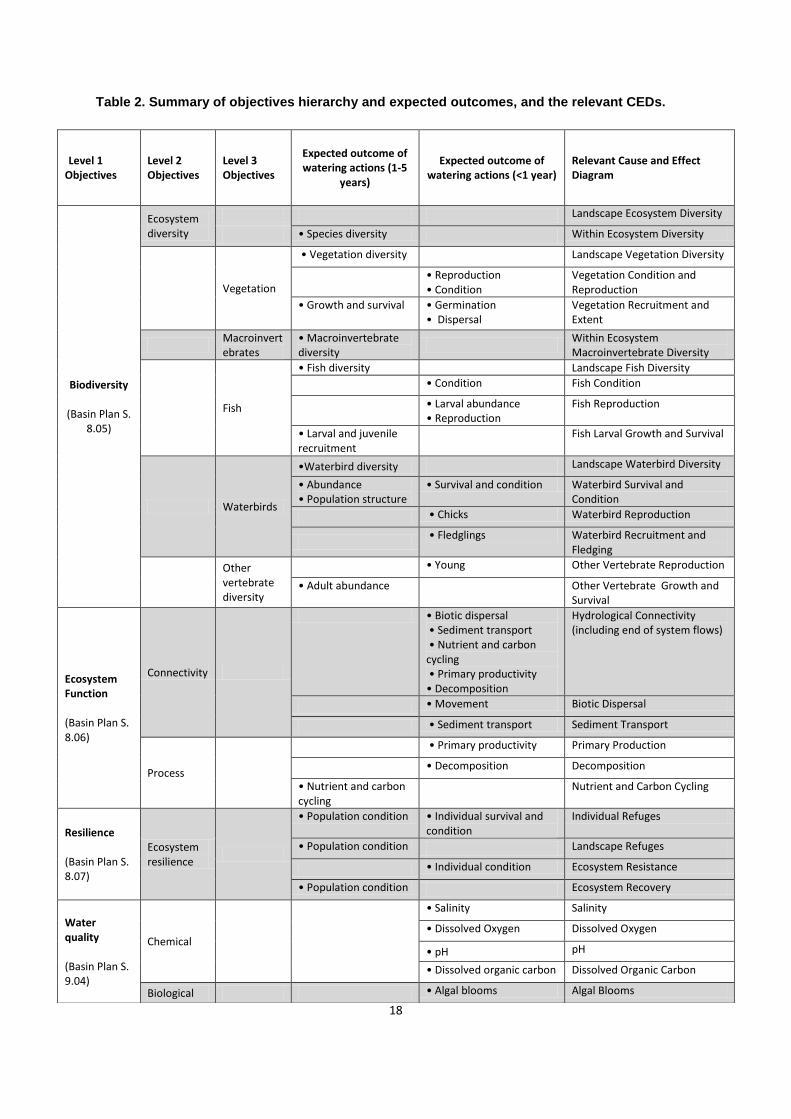
The objectives hierarchy and CEDs provide a summary of the best available science in
relation to the links between EWP objectives and flow (Table 2) and therefore provide a
resource that can be used to support environmental water management, including planning,
monitoring and evaluation. The CEDs describe the influence of flow on ecological responses
that contribute to the achievement of the higher level objectives. In order to illustrate the
contribution of each CED to achieve both higher level objectives and one-to-five-year
outcomes, a series of diagrams have been developed to illustrate the spatial and temporal
scale of the CEDs. The CEDs also directly inform the CEWO’s understanding of what can be
achieved with environmental watering actions, which are known as the expected outcomes
of environmental watering. The hierarchy shows how individual watering events, which often
occur over short timeframes in discrete locations, contribute directly to EWP objectives over
longer timeframes and at larger spatial scales. Interpreting and arranging the EWP
objectives and outcomes in this way provides guidance for the management of
environmental water, along with a structure for planning, monitoring, reporting and
evaluation.
18
Table 2. Summary of objectives hierarchy and expected outcomes, and the relevant CEDs.
Level 1 Objectives
Level 2 Objectives
Level 3 Objectives
Expected outcome of watering actions (1-5
years)
Expected outcome of watering actions (<1 year)
Relevant Cause and Effect Diagram
Biodiversity
(Basin Plan S. 8.05)
Ecosystem diversity
Landscape Ecosystem Diversity
• Species diversity Within Ecosystem Diversity
Vegetation
• Vegetation diversity Landscape Vegetation Diversity
• Reproduction • Condition
Vegetation Condition and Reproduction
• Growth and survival • Germination • Dispersal
Vegetation Recruitment and Extent
Macroinvertebrates
• Macroinvertebrate diversity
Within Ecosystem Macroinvertebrate Diversity
Fish
• Fish diversity Landscape Fish Diversity
• Condition Fish Condition
• Larval abundance • Reproduction
Fish Reproduction
• Larval and juvenile recruitment
Fish Larval Growth and Survival
Waterbirds
•Waterbird diversity Landscape Waterbird Diversity
• Abundance • Population structure
• Survival and condition Waterbird Survival and Condition
• Chicks Waterbird Reproduction
• Fledglings Waterbird Recruitment and
Fledging
Other vertebrate diversity
• Young Other Vertebrate Reproduction
• Adult abundance Other Vertebrate Growth and Survival
Ecosystem Function (Basin Plan S. 8.06)
Connectivity
• Biotic dispersal • Sediment transport • Nutrient and carbon cycling • Primary productivity • Decomposition
Hydrological Connectivity (including end of system flows)
• Movement Biotic Dispersal
• Sediment transport Sediment Transport
Process
• Primary productivity Primary Production
• Decomposition Decomposition
• Nutrient and carbon cycling
Nutrient and Carbon Cycling
Resilience (Basin Plan S. 8.07)
Ecosystem resilience
• Population condition • Individual survival and condition
Individual Refuges
• Population condition Landscape Refuges
• Individual condition Ecosystem Resistance
• Population condition Ecosystem Recovery
Water quality (Basin Plan S. 9.04)
Chemical
• Salinity Salinity
• Dissolved Oxygen Dissolved Oxygen
• pH pH
• Dissolved organic carbon Dissolved Organic Carbon
Biological • Algal blooms Algal Blooms

19
2.1.1 Biodiversity objectives hierarchy
The biodiversity objectives hierarchy applies across all ecosystem types within the Basin and
includes ecosystem diversity and species diversity as a Level 2 objective (Figure 6). For
ecosystem diversity there is an ecosystem diversity, and ecosystem scale waterbird and fish
diversity CEDs to reflect the scales at which diversity of these groups respond to
management. Species diversity is nested within ecosystem diversity because ecosystem
condition is dependent on the species diversity within each ecosystem. At the species
diversity Level 2 there is one CED, macroinvertebrate diversity, as this reflects the scale at
which macroinvertebrate diversity is likely to be managed. Nested within the species
diversity objective are the population objectives as sustaining biodiversity requires protection
and restoration of populations of individual species. The Level 3 objectives and related
CEDs associated with the Level 2 objective of species diversity include aspects of
biodiversity relating to water-dependent species and populations. For vegetation, fish,
waterbirds and other vertebrates there are CEDs to describe the relationship between flow
and key population processes such as maintenance of condition, reproduction and
recruitment. In the case of macroinvertebrates, no population CED was developed due to the
low probability that the CEWO would explicitly allocate flows to achieve macroinvertebrate
outcomes.
Figure 6. An illustration of the biodiversity objectives hierarchy. The mid shade blue boxes are Level 2 objectives, the light blue boxes are Level 3 objectives and the yellow boxes are CEDs.
The spatial and temporal relationship between the different levels of the objectives hierarchy
are illustrated in Figure 7. This style of representation of the objectives hierarchy is useful in
identifying appropriate expected outcomes over the one-year and one-to-five-year
timeframes.

20
Figure 7. An illustration of the spatial and temporal relationships between elements of the vegetation objectives hierarchy. The yellow boxes represent aspects of the Level 3 vegetation objective for which cause-effect diagrams have been developed.
The EWP objectives include reference to Ramsar wetlands. The objective of the Ramsar
convention is the ‘conservation and wise use of all wetlands’ where wise use is defined as
‘the maintenance of their ecological character, achieved through the implementation of
ecosystem approaches within the context of sustainable development’. Ecological character
is defined as ‘the combination of the ecosystem components, processes and
benefits/services that characterise the wetland at a given point in time’. From an
environmental perspective, the components of wetlands are aligned with Basin Plan
biodiversity objectives and ecosystem processes align with Basin Plan function objectives.
The LTIM Project is not however, designed to identify changes in the character of the
Basin’s Ramsar wetlands as this would fall within the scope of long-term asset condition
assessment. The LTIM Project and associated program logic would be appropriate to assess
environmental flows designed to protect or restore the character of a Ramsar wetland.
One of the Environmental watering plan objectives is protection or restoration of
representative populations and communities of native biota. The reference to populations is
explicitly represented within the proposed objectives hierarchy. There is however, no
reference to communities. In general a community is a level of organisation intermediate
between population and ecosystem and refers to populations that interact in some way,
whether these interactions are beneficial, competitive or exploitative. The wording of the
Level 3 objectives suggests that the term community was being used to refer to populations
from the same group (e.g. fish, vegetation) that occupy the same area. In this case, and for
the purposes of the LTIM Project, response of communities aligns closely with Level 3
objectives of vegetation, macroinvertebrate, fish, waterbird and other vertebrates. If an
alternate definition is developed during implementation of the Basin Plan, then the objectives
hierarchy can be modified to accommodate it as appropriate.

21
2.1.2 Ecosystem function objectives hierarchy
For ecosystem function, the Basin Plan identifies six objectives relating to connectivity;
processes that shape landforms and habitat diversity, processes that support populations
and processes that influence energy, carbon and nutrient dynamics. The six objectives have
been grouped into two Level 2 objectives (Figure 8):
1. connectivity that includes hydrological connectivity, sediment transport that is
fundamental to the maintenance of land forms and habitat diversity, and biotic dispersal
2. functional processes including primary production, decomposition, and nutrient and
carbon cycling.
The other ecosystem function objectives relating to water quality and sustaining populations
are incorporated into the water quality and biodiversity hierarchies respectively.
Figure 8. An illustration of the ecosystem function objectives hierarchy. The yellow boxes represent aspects of the Level 2 connectivity and ecosystem process objectives for which cause-effect diagrams have been developed.
Connectivity objectives are illustrated in Figure 9 which shows the relationship between the
spatial scale and timeframes for expected ecological outcomes. This also illustrates some of
the linkages between the Level 1 objectives; in this instance, hydrological connectivity and
sediment transport sustain habitats that influence populations and therefore biodiversity
while biotic dispersal influences resilience (Figure 9).

22
Figure 9. An illustration of the spatial and temporal relationships between elements of the ecosystem function objectives hierarchy. The blue boxes represent aspects of the Level 2 connectivity and ecosystem process objectives. The cause-effect diagrams that relate to these are indicated in yellow.
2.1.3 Resilience objectives hierarchy
For the purposes of the Commonwealth environmental water delivery, we define resilience
as ‘the capacity of a system to respond to disturbance (resist, recover and adapt) while
undergoing change so as to still retain essentially the same function, structure and
feedbacks and therefore identity’ (Gawne 2012). Ecosystem resilience emerges from the
characteristics of the broader landscape of which it is part and the populations of biota of
which it is comprised. At the landscape scale, resilience is influenced by aquatic ecosystem
diversity. While our understanding of ecosystem resilience is limited, the ecosystem diversity
CED provides a starting point for developing improved understanding through adaptive
management.
At the population level, species have a range of strategies to enable them to respond to
disturbance that include; avoidance, resistance, resistance through the use of refugia and
rapid recovery. The success of any of these strategies depends on the interaction between
species traits and the characteristics of the ecosystem. As water management influences
ecosystem characteristics and not species traits, resilience is comprised of two Level 2
objectives with population resilience nested within ecosystem resilience. Nested within

23
population resilience are CEDs relating to the three broad resilience strategies and a CED
describing the influence of flow on recovery which is important to all biota in disturbed
environments (Figure 10).
Figure 10. An illustration of the ecosystem function objectives hierarchy showing the relationship between the ecosystem function objectives, ecosystem types and related cause-effect diagrams. The yellow boxes represent aspects of the Level 2 ecosystem and population resilience objectives for which a cause-effect diagram has been developed.
Ecosystem resilience is believed to confer resilience on systems on the basis that
populations of different species will utilise different ecosystems as refugia from different
types of disturbances. The following provides a brief description of each CED in the
resilience hierarchy:
Resistance – the use of environmental water to enable populations to resist disturbance.
This aligns with the EWP objective to ‘provide wetting and drying cycles and inundation
intervals that do not exceed the tolerance of ecosystem resilience or the threshold of
irreversible change’.
Refugia – some species rely on refugia to resist disturbance. Water is an important
determinant of the distribution and abundance of refugia (landscape scale) and the
quality of individual refugia. The nested or hierarchical nature of water-dependent
ecosystems means that refugia need to be managed at both of these scales. Protecting

24
refugia aligns with the EWP objective of ‘protecting refugia in order to support the long-
term survival and resilience of water-dependent populations of native flora and fauna,
including during drought’.
Avoidance - some species disperse away from disturbances. This may, in some
instances, relate to the EWP objective ‘to minimise habitat fragmentation’ as
fragmentation may affect some species capacity to disperse. It may also relate to the
environmental watering plan function objective of protecting or restoring ‘ecosystem
functions of water-dependent ecosystems that maintain populations (for example
recruitment, regeneration, dispersal, immigration and emigration)’.
Recovery – after a disturbance, all species need to recover if they are to persist over the
long-term. This aligns with the function objective of protecting or restoring ‘ecosystem
functions of water-dependent ecosystems that maintain populations (for example
recruitment, regeneration, dispersal, immigration and emigration)’.
The resilience objectives hierarchy can also be illustrated showing the relationship between
the spatial scale and timeframes for expected ecological outcomes (Figure 11). This
representation of the objectives hierarchy is useful in identifying appropriate expected
outcomes over the one-year and one-to-five-year timeframes (Figure 11).
Figure 11. An illustration of the spatial and temporal relationships between elements of the resilience objectives hierarchy. The yellow boxes represent aspects of the Level 2 ecosystem and population resilience objectives for which cause-effect diagrams have been developed.
2.1.4 Water quality objectives hierarchy
The EWP objective for water quality is to ensure that water quality does not affect
environmental, social and economic activities. The underlying premise is that water quality
changes pose a threat to the achievement of EWP objectives. While there are many water
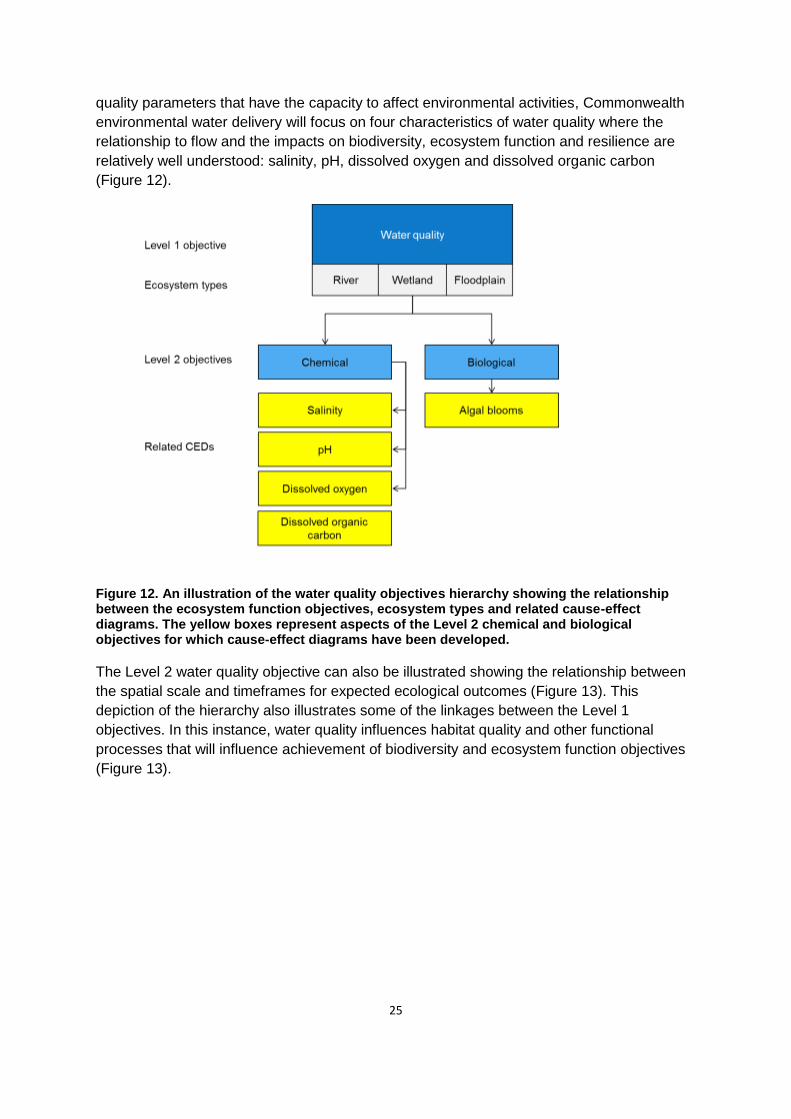
25
quality parameters that have the capacity to affect environmental activities, Commonwealth
environmental water delivery will focus on four characteristics of water quality where the
relationship to flow and the impacts on biodiversity, ecosystem function and resilience are
relatively well understood: salinity, pH, dissolved oxygen and dissolved organic carbon
(Figure 12).
Figure 12. An illustration of the water quality objectives hierarchy showing the relationship between the ecosystem function objectives, ecosystem types and related cause-effect diagrams. The yellow boxes represent aspects of the Level 2 chemical and biological objectives for which cause-effect diagrams have been developed.
The Level 2 water quality objective can also be illustrated showing the relationship between
the spatial scale and timeframes for expected ecological outcomes (Figure 13). This
depiction of the hierarchy also illustrates some of the linkages between the Level 1
objectives. In this instance, water quality influences habitat quality and other functional
processes that will influence achievement of biodiversity and ecosystem function objectives
(Figure 13).

26
Figure 13. An illustration of the spatial and temporal relationships between elements of the water quality objectives hierarchy, including links to the water quality, function and biodiversity objectives. The blue boxes represent aspects of the Level 2 biological and chemical objectives for which a cause-effect diagram has been developed.
2.1.5 Ecosystem condition hierarchy
Having developed the objectives hierarchy, it is helpful to map the various levels and
associated CEDs back to the way they may contribute to the MDBA’s assessment of the
condition of water-dependent ecosystems. At the highest level, assessment of each
ecosystem type would include biodiversity, ecosystem function, resilience and water quality.
For each of the Level 1 objectives, the Level 2 objectives are likely to vary by ecosystem
type. For example, macroinvertebrates may provide a good indicator in rivers (Figure 14) but
not in wetlands (Figure 15) or floodplains (Figure 16) due to greater variability and greater
uncertainty concerning their response to flow. Similarly, while waterbirds are a Level 3
objective, they are seldom included in assessments of river condition. The way in which
EWP objectives and CEDs could inform an assessment of river, floodplain and wetland
condition are illustrated in Figures 14 to Figure 16.

27
Figure 14. Illustration of the potential structure of an assessment of river condition in relation to the four Level 1 objectives and the nested Level 2 and 3 objectives in mid and light blue beneath. Cause-effect diagrams developed are indicated in yellow.
Figure 15. Illustration of the potential structure of an assessment of wetland condition in
relation to the four Level 1 objectives and the nested Level 2 and 3 objectives in mid and light
blue beneath. Cause-effect diagrams developed are indicated by the yellow.

28
Figure 16. Illustration of the potential structure of an assessment of floodplain condition in relation to the four Level 1 objectives and the nested Level 2 and 3 objectives in mid and light blue beneath. Cause-effect diagrams developed are indicated in yellow.
2.2 Cause-effect diagrams
Conceptual models are useful tools for exploring and understanding the relationships within
an ecosystem. In this instance, cause-effect diagrams (CEDs) have been developed to
conceptually explore the relationships between flow and ecological responses in aquatic
ecosystems. Gross (2003) provides a comprehensive guide to the development of
conceptual models, particularly for the design of environmental monitoring programs. He
states that a useful conceptual model will:
articulate important processes and variables
contribute to understanding interactions between ecosystem processes and dynamics
identify key links between drivers, stressors and system responses
facilitate selection and justification of monitoring variables
facilitate evaluation of data from the monitoring program
clearly communicate dynamic processes to technical and non-technical audiences.
CEDs, in a variety of forms, have become common conceptual models for informing
environmental monitoring in Australia and elsewhere, for example, the Integrated Monitoring
of Environmental Flows in the Murray-Darling Basin (Chessman and Jones 2001); Victorian

29
Environmental Flows Monitoring and Assessment Program (Cottingham et al. 2005a) and
CEWO Short Term Monitoring Project (MDFRC in prep). They have been advocated as an
important mechanism for identifying appropriate indicators (Niemeijer and de Groot 2008);
for exploring cause and effect relationships (e.g. driver-pressure-state-impact-response
model) and as a communication tool.
Aquatic ecosystems are complex and dynamic and when developing diagrams there is
always a trade-off between realism, generality and precision as it is impossible to maximise
all three simultaneously. As a CED is a simplified representation of a complex natural
system, a good CED does not attempt to explain all possible relationships or contain all
possible factors that influence the management objective but tries to simplify reality by
containing only the information most relevant (Gross 2003). Importantly, a good cause-effect
diagram needs to explicitly state the underlying assumptions and the level of uncertainty
associated with the links (King et al. 2003). As the CEDs are developed assumptions will be
articulated and the uncertainty expressed.
CEDs have been developed to inform Commonwealth environmental water use, including to:
describe the key relationships between flow and ecological responses to inform expected
outcomes of Commonwealth environmental watering
support planning for the use of Commonwealth environmental water
underpin MERI processes
support both reporting and adaptive management
communicate the influence of flow to external stakeholders.
In developing the CEDs and ensuring the balance between simplicity and accurately
representing ecological relationships, the following principles were followed:
The CEDs focus on the influence of flow and ignore all non-flow related influences on the
outcome. In some instances, this required a judgement about whether a minor or indirect
influence warranted inclusion in the CED.
The CEDs were developed in line with the objectives hierarchy approach outlined in
Section 2.1 above. The relationships between CEDs are illustrated in hierarchy diagrams
(Figure 4) that provide a visual representation of the underlying logic behind the selection
of expected outcomes. The contribution of one cause-effect diagram to another is
illustrated within the CED as a yellow box (Figure 17). For instance, in the recovery CED
there are links to condition, dispersal and recruitment CEDs.
The CEDs link flow through its influence on a suite of causal categories (habitat,
connectivity, processes, disturbance and cues) to the expected outcome. Within each of
these categories the relevant habitat or connectivity characteristics, cues, processes or
disturbances are listed (Figure 17).

30
The CEDs were designed to facilitate identification of the two broad types of indicators
that will be used by LTIM; effect indicators that support reporting of progress against
objectives and causal indicators that support evaluation and adaptive management
(Figure 17). To facilitate this, the objective at the base of each CED is colour coded to
align with the colour bands in the spatial and temporal hierarchy diagrams.
Figure 17. Generic structure of cause-effect diagrams, illustrating the influence of flow on an objective through the action of causal factors that are grouped within a causal factor. A related CED is identified within a yellow box. The objective is the major influence on identification of effect indicators while causal factors facilitate identification of causal indicators.
The general form of all the CEDs (except hydrological connectivity, and nutrients and carbon
cycling) is the same with flow at the top of the CED influencing one or more causal
categories (habitat, connectivity, processes, disturbance or cues) or subsidiary CEDs (Figure
18). Within each causal category is a list of causal factors. It is expected that the generic
CEDs presented here will be adapted for specific indicators for each of the seven areas.
Once particular species, processes or water quality characteristics have been identified,
specific elements of the generic CED may be either removed or, in some instances,
expanded to provide more detail relevant to the specific circumstances.
An example cause-effect diagram is provided in Figure 18. This CED illustrates the causal
relationships linking flow to within wetland macroinvertebrate diversity which is a Level 3
biodiversity objective. The CED illustrates that macroinvertebrate diversity within an
ecosystem is influenced by landscape ecosystem diversity as indicated by the yellow box.
The macroinvertebrate diversity CED indicates that flow directly influences one causal factor
(area) and two causal categories; habitat heterogeneity and connectivity, to the rest of the
system. The influence of flow on habitat is influenced by the ecosystem type. Habitat and
connectivity in turn influence a third causal category; ecosystem condition. Within each
causal category are a list of causal factors that influence within macroinvertebrate diversity;
these include soil moisture, vegetation condition, eggs and seeds, refugia and sediment
organic matter.
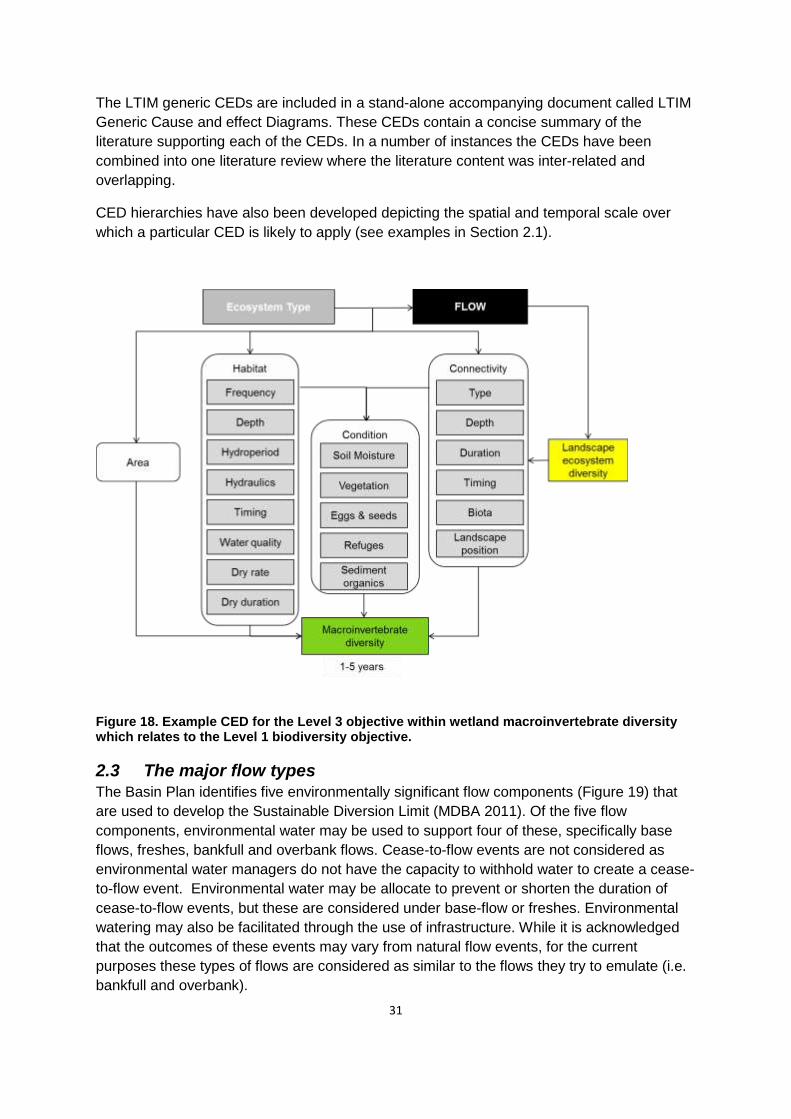
31
The LTIM generic CEDs are included in a stand-alone accompanying document called LTIM
Generic Cause and effect Diagrams. These CEDs contain a concise summary of the
literature supporting each of the CEDs. In a number of instances the CEDs have been
combined into one literature review where the literature content was inter-related and
overlapping.
CED hierarchies have also been developed depicting the spatial and temporal scale over
which a particular CED is likely to apply (see examples in Section 2.1).
Figure 18. Example CED for the Level 3 objective within wetland macroinvertebrate diversity which relates to the Level 1 biodiversity objective.
2.3 The major flow types
The Basin Plan identifies five environmentally significant flow components (Figure 19) that
are used to develop the Sustainable Diversion Limit (MDBA 2011). Of the five flow
components, environmental water may be used to support four of these, specifically base
flows, freshes, bankfull and overbank flows. Cease-to-flow events are not considered as
environmental water managers do not have the capacity to withhold water to create a cease-
to-flow event. Environmental water may be allocate to prevent or shorten the duration of
cease-to-flow events, but these are considered under base-flow or freshes. Environmental
watering may also be facilitated through the use of infrastructure. While it is acknowledged
that the outcomes of these events may vary from natural flow events, for the current
purposes these types of flows are considered as similar to the flows they try to emulate (i.e.
bankfull and overbank).

32
Figure 19. Five flow types and their influence on different parts of the river channel, wetlands and floodplains (Figure 5.1 in MDBA 2011).
2.3.1 Base flow (low flows)
Base flows are those that are confined to the low flow part of the channel. These flows would
typically inundate geomorphic units such as pools and sustain riffle or shallow run areas
between pools.
Base flows are important to obligate aquatic species and communities, including fish
communities as they:
Maintain a minimum diversity of habitats for shelter, feeding and spawning. They may
create riffle or shallow runs of flowing water habitat which do not exist when flows cease.
Establish connectivity and enable longitudinal movement of taxa between pools. Large
bodied fish may not move during base flows due to inadequate water depth within riffles
and connecting runs but small bodied fish and macroinvertebrates may move if
conditions are suitable.
Constantly dilute and refresh water in pools and thereby maintain reasonable water
quality.
2.3.2 Freshes
Freshes provide inundation of additional habitat features such as in-channel benches, woody
structural habitat and anabranches that connect at flows less than bank full but greater than
base flow. These flows provide a greater range of in-channel habitats and enhance nutrient
cycling processes, including:
longitudinal connection of habitats allowing aquatic species to move through the river
system
maintenance of drought refuges
dilution within the river channel, refreshing water in pools and thereby maintaining
reasonable water quality

33
provision of flows to support fish movement, recruitment and spawning.
2.3.3 Bankfull
While the role of bankfull flows are not explicitly described in the Basin Plan, the flows
conceptualisation (Figure 19) illustrates that bankfull flows fill the main channel and inundate
some wetlands and anabranches. The objectives emphasise riparian, wetland and floodplain
vegetation, waterbirds and other significant species including fish, reptiles, frogs and
invertebrates. Bankfull flows will be important in creating or sustaining habitat for riparian
and wetland vegetation and those species of fish and frogs reliant on connected wetlands.
For waterbirds, bankfull flows may be important in creating or sustaining foraging habitat.
2.3.4 Overbank
The role of overbank flows are not explicitly described in the Basin Plan, objectives
emphasise riparian, wetland and floodplain vegetation, waterbirds and other significant
species including fish, reptiles, frogs and invertebrates. Overbank flows are a major
influence on habitat, both creating habitat and acting as a disturbance. Overbank flows also
influence hydrological connectivity providing opportunities for the exchange of sediment,
nutrients and organic matter, and the movement of biota. Finally, overbank flows influence
major ecological processes such as primary production, decomposition and nutrient cycling.
The boom in productivity and habitat availability is associated with breeding opportunities for
waterbirds, frogs and some species of native fish.
2.3.5 Discrete wetland and/or floodplain inundation
There are a number of circumstances in which high flows are required to achieve a
connection between the source of water and the nominated environmental asset. In these
instances, infrastructure such as pumps, weirs and regulators may be used to deliver water.
In most cases, the delivery of water through the use of infrastructure seeks to mimic the role
of one of the flow types discussed above. In order to identify expected outcomes from these
events, the objective of the watering or the flow type being simulated would be used to
inform development of an appropriate outcome.
The other flow outcome that does not align with the typology is the inundation of terminal
wetlands. Terminal wetlands can be inundated through prolonged base flows, or freshes as
well as by bankfull or overbank flows.
2.3.6 Flows to achieve Environmental Watering Plan objectives
The next step in understanding the logic is to link the identified role of the major flow types
available to the Commonwealth Environmental Water Holder to EWP objectives for water-
dependent ecosystems.
The following table provides a brief summary of the role of the flow types described in the
Basin Plan in relation to the three ecosystem types (river, wetland and floodplains) and the
ways they may influence biodiversity, ecosystem function, resilience and/or water quality
(Table 3).
Table 3. General description of the role of different flows types on rivers, wetlands and
floodplains.

34
Flow
Type
Ecosystem Type
River Wetland Floodplain
No Flow Cease to flow.
Disturbance that
influences biodiversity
and function.
No surface water.
Disturbance that
influences biodiversity
and function.
No surface water.
An important
determinant of
floodplain character.
Base Flow Flow that protects
refugia, sustains water
quality, productivity
and biodiversity.
Provides limited
longitudinal
connectivity.
-
-
Fresh In-channel disturbance
maintains littoral
habitat, scours biofilm
and provides
longitudinal
connectivity.
Will affect water quality
and ecosystem
functions but the
effects vary.
-
-

35
Flow
Type
Ecosystem Type
River Wetland Floodplain
Bankfull In-channel
disturbance.
Influences in-channel
and riparian habitat,
provides longitudinal
and limited lateral
connectivity.
Sediment transport
influences long-term
channel form.
Only inundates
wetlands connected at
bank full, typically
those closely
connected to parent
river.
Influence on all water-
dependent species
habitat, provides some
lateral connectivity,
major stimulus for
primary productivity,
decomposition and
nutrient cycles.
Maintain permanent
wetlands as refugia.
-
Overbank In-channel
disturbance.
Major influence on in-
channel and riparian
habitat, provides
longitudinal and lateral
connectivity, major
stimulus for other
functions.
Sediment transport
influences long-term
channel form.
Major influence on
ecosystem diversity
and habitat, provides
connectivity, major
stimulus for primary
productivity,
decomposition and
nutrient cycles.
Maintain permanent
wetlands as refugia.
Major influence on
ecosystem diversity
and habitat, provides
connectivity, major
stimulus for primary
productivity,
decomposition and
nutrient cycles.
Maintain permanent
wetlands as refugia.
Magnitude of flows is
important for
differentially inundating
low lying and higher
areas of the floodplain.
2.4 Expected outcomes
2.4.1 One-Year expected outcomes
Our conceptual understanding of the relationships between flow and ecological responses,
as informed by the literature reviews and represented in the CEDs, has been used to

36
develop less-than-one-year expected outcomes of Commonwealth environmental watering.
Expected outcomes at the one-year scale are heavily reliant on the flow type (base, fresh,
bankfull, overbank etc.) and for this reason, outcomes have been expressed based on the
types of flow that the CEWO is likely to be able to contribute to.
Expected outcomes are also reliant on the ecology of the aquatic ecosystem that receives
environmental water. For example, a fresh delivered to a stream that has deep in-channel
waterholes may be expected to improve water quality within the in-channel pool, while a
fresh delivered to a system with significant in-channel vegetation may be expected to
improve condition of that vegetation community. Therefore, expected outcomes have been
created at the selected area level for the seven selected areas for which long-term
monitoring is to be established. These are presented for each selected area in the
corresponding specific Monitoring and Evaluation Requirements documents. An example of
the types of expected outcomes that have been developed is provided for the Lower Murray
River in Table 4.
Table 4. Some examples of expected outcomes for the Lower Murray River selected area.
Flow type
Objective
Level 1
Objective
Level 2
Objective
Level 3
Suggested one-year
expected outcome
Base flow Biodiversity Species
diversity
Fish Contribute to the protection of
native fish diversity and
abundance through maintaining
suitable habitat.
Base flow Function Process
Connectivity
Contribute to transport of
nutrients from the Murray River
to reduce primary production
(excess algal growth).
Fresh Biodiversity Species
diversity
Vegetation Contribute to riparian native
vegetation population viability,
particularly extent and
condition.
Bankfull Biodiversity Species
diversity
Waterbirds Maintaining habitat diversity
and condition to contribute to
successful breeding and
recruitment and improvement of
population condition of
waterbirds.

37
Flow type
Objective
Level 1
Objective
Level 2
Objective
Level 3
Suggested one-year
expected outcome
Overbank Function Connectivity Contribute to the increased
distribution of native fish
species.
The expected outcomes provide the basis for formulating hypotheses; i.e. the questions to
be tested by the monitoring. For example in Table 4 above, a base flow in the Lower Murray
River is expected to contribute to the protection of native fish diversity and abundance
through maintaining suitable habitat. Hypotheses to be tested by the monitoring could then
be:
Do implemented environmental base flows in the Lower Murray River:
maintain condition of native fish
maintain growth and survival of juvenile fish
maintain native fish species diversity
maintain native fish abundance?
Such hypotheses will underpin the monitoring design which is discussed in Section 3.3.
2.4.2 One-to-five-year expected outcomes
Ecological outcomes of environmental watering over the one-to-five-year timeframe are
strongly influenced by water availability and flow regimes over the period. In order to
formulate the range of expected outcomes likely from the use of Commonwealth
environmental water, it is necessary to identify the range of possible water availability and
flow regime scenarios over the five-year period. This was undertaken in a generic sense by
defining five water availability classes:
extreme dry
dry
median
wet
extreme wet.
The water availability, flow types and their roles and CEDs can all be used to identify
expected outcomes under each water availability scenario. As the likely flow types under dry
and very dry scenarios were believed to be similar, these two water availability scenarios
were merged. The approach is illustrated in Figure 20.

38
Figure 20. Level 2 and 3 objectives and associated generic cause-effect diagrams influenced
by four different annual flow conditions. Each circle represents a year in a river valley with dry
or very dry (orange circles), median (yellow), wet (light green) and very wet (green) years.
The process followed to generate one-to-five-year outcomes was the same as the process
for generating less-than-one-year outcomes, with two additional considerations. The first
was that the water availability over the five-year period was considered to identify the range
of potential outcomes. The second was that the spatial and temporal scale of response,
were considered to identify outcomes that respond over the one-to-five-year timeframe. The
one-year and one-to-five-year expected outcomes for each of the selected areas is
contained in each of the Monitoring and Evaluation Requirements documents.

39
Chapter 3. Long Term intervention monitoring (LTIM)
Chapter 3 describes the LTIM at seven selected areas in the Murray-Darling Basin
(Monitoring box in Figure 1). The focus is on the identification and prioritisation of both cause
and effect indicators through a three step process; selected area, Basin-scale and adaptive
management. The chapter then discusses options for standard methods for some of the
nominated indicators.
3.1 Context
Intervention monitoring is a key step in the MERI process that seeks to support
accountability, good governance and adaptive management, and to generate the knowledge
to support future evidence based decisions. Intervention monitoring underpins evaluation,
reporting and improved decisions and future monitoring through the adaptive management
process.
Within the broader MERI context, LTIM seeks to:
assess ecological responses over the intermediate to long-term
develop predictive models relating flow regime to ecological response
improve monitoring cost-effectiveness across the Basin through extrapolation of results
and application of the ecological response models.
Intervention monitoring is one of three types of monitoring included in the CEWO MERI
Framework (Section 1.4), with the other two being operational and program level monitoring.
Operational monitoring will assess whether water has been delivered as planned. Program
level monitoring measures ecological condition at the Basin scale and identifies trends over
the long-term. The three types of monitoring need to fit together to provide a coherent overall
picture of environmental watering outcomes and their contribution to achieving the objectives
of the Environmental watering plan (EWP).
The three different types of monitoring ask very different questions; however, there can be
overlaps in the data required to answer these different questions. For example, intervention
monitoring requires information on the delivery of water (operational monitoring) in order to
interpret the environmental outcomes. Similarly, data generated to describe the condition of
a system prior to an environmental watering can be used to inform program level monitoring,
the prioritisation of environmental flows (assessment step in adaptive management) and
provide the before data for the intervention monitoring. Program monitoring can also utilise
responses to environmental flows. This is particularly important in cases where the system’s
capacity to respond to flow is a key element of a system’s resilience. The sharing of data
among the different types of monitoring will help ensure that monitoring is cost-effective
(Principle 6 MERI Framework) and highlights the benefits of collaboration among water
management institutions (Principle 3 MERI Framework). The identification of the LTIM
information requirements should facilitate the identification of potential areas of collaboration.

40
Effective intervention monitoring relies on operational monitoring to provide information on
the characteristics of the environmental flow and to then interpret ecological outcomes.
Intervention monitoring will also inform program level monitoring. The CEWO MERI
Framework includes two types of intervention monitoring, targeted monitoring of selected
actions and long term intervention monitoring of selected areas. The focus of LTIM is the
ecological response to Commonwealth environmental water.
There are a number of challenges associated with identifying the ecological response to
environmental water. One challenge is that CEWO often collaborates with other
environmental water-holders in the delivery of environmental water or piggy-backs on natural
events and so identifying the incremental benefit of Commonwealth environmental water
may be difficult. In the short-term this challenge will be addressed by monitoring the overall
outcomes and inferring the contribution of Commonwealth environmental water through our
conceptual understanding of the system. Over time, the development of models will enable
predictions of environmental outcomes in the absence of Commonwealth participation, which
can be used to identify the role of CEWO in delivering observed outcomes.
A further significant challenge is detection of environmental outcomes in aquatic
ecosystems, which are extremely variable in space and time. This variability makes it difficult
to both identify appropriate reference sites and to detect a flow response against a
background of high natural variability. This is particularly true in the temperate rivers of the
Murray-Darling Basin, which are among the most variable in the world, and where flows vary
in response to a variety of influences of which environmental flow management is just one.
The situation is further complicated by the influence of other stressors in the system. In
general, the LTIM approach to minimising the risk of failing to detect a response includes the
use of conceptual models that will be used to generate explicit hypotheses concerning the
influence of flow on the ecosystem. In addition, by adopting a standardised approach across
the Basin, the LTIM will increase the power to detect responses and create sampling design
and analytical options that will increase the capacity to detect responses. Additional
information on dealing with this challenge is provided in Section 3.3 and 4.3.
The LTIM Project involves monitoring in selected areas which will allow the assessment of
sequences of watering events over a number of years (medium to long-term), demonstrating
progress towards the EWP objectives. It is anticipated that long term intervention monitoring
will be the key input for reporting under the Basin Plan for the use of Commonwealth
environmental water.
Where monitoring and information needs overlap with The Living Murray Icon Sites or other
sites that have adequate existing monitoring in place, the CEWO may invest to fill gaps, but
has not planned to replace programs if they cease.
LTIM Projects are currently proposed to be established at the following selected areas:
Gwydir river system
Lachlan river system
Murrumbidgee river system

41
Edward–Wakool river system
Goulburn River
Lower Murray River
Junction of the Warrego and Darling rivers.
There are two areas where the capacity to apply results to other areas may be constrained.
First, the Junction of the Warrego and Darling rivers is going to experience significant
changes in the short term through the change in management and decommissioning of
infrastructure. Second, the Lower Murray River is a highly modified system dominated by a
series of weirs and characterised by stable water levels. The capacity to apply results from
these areas to other areas will vary depending on the indicator and an evaluation
undertaken before extrapolating.
LTIM is being developed and implemented in two stages. This first stage is the scoping
stage to develop the logic and rationale consistent with the Basin Plan and CEWO MERI
Framework (Figure 21). This document is concerned with this first stage, as explained in
Chapter 1.
The second phase of the LTIM Project is the development of detailed Monitoring and
Evaluation Plans for each of the seven selected areas with the monitoring service providers.
The selection of the service providers will be conducted through a procurement process
undertaken by CEWO. The Monitoring and Evaluation Advisers will work closely with the
service providers in the development of the detailed Monitoring and Evaluation Plans to
support an integrated and rigorous approach to the monitoring, reporting and evaluation of
outcomes at the selected areas and across the Basin as directed by the Basin Plan.
Figure 21. LTIM Project key timeframes and outputs
42
The logic and rationale for the LTIM is based on the objectives hierarchy, cause-effect
diagrams and expected outcomes (Section 2). It is the key input into the design of the
Monitoring and Evaluation Plans and includes the indicators to be monitored and the way
that these indicators are sampled and analysed. The broad scope of the EWP objectives
means that the range of indicators that could be measured greatly exceeds the capacity of
the LTIM. It is therefore, necessary to undertake a prioritisation process that starts with the
development of a list of broad indicators, then refines this list based on a prioritisation of
objectives. This process is described in Section 3.2.
3.2 Indicator prioritisation
3.2.1 Identifying environmental indicators
Environmental indicators are measures that provide managerial and scientific evidence of
ecosystem condition (Donnelly et al. 2007). In some instances, they also communicate a
complex message about the ecosystem in a simplified and useful manner (Jackson et al.
2001). For the purposes of this document the term ‘indicator’ refers to measurable variable -
or some set of variables - whose values provide an indication of flow effects. The value of
variables may then by quantified using, in some cases, a number of different methods or
protocols.
The identification of indicators builds on the development of the objectives hierarchy and the
cause-effect diagrams as this ensures that there is a scientific framework and justification for
the choice of indicators. The CEDs were used to develop a list of broad indicators that
includes both ‘effect indicators’ and ‘cause indicators’ (Appendix B). Effect indicators are
those indicators that relate directly to expected outcomes and EWP objectives, while cause
indicators are those indicators which, although not targeted by the EWP objectives, provide
essential information concerning the mechanisms by which flows influence effect indicators.
Identification of such mechanisms underpin flow-response modelling and are important for
adaptive management.
The description of each level in the hierarchy refines the list of potential indicators
(Figure 22). For example, the Level 2 objective of species diversity gives rise to Level 3
objectives for vegetation, macroinvertebrates, fish, waterbirds and other vertebrates.
Bacteria, fungi and algae are not included in the objectives hierarchy as they are not
specifically mentioned in the EWP objectives, but they may be captured in the development
of CEDs as causal factors and may in turn be identified as causal indicators.
Working through the objectives hierarchy to the list of expected outcomes generates an
extensive list of indicators. However, there remains the challenge of determining ‘which of
the numerous measures of ecological systems characterise the entire system yet are simple
enough to be effectively and efficiently monitored and modelled’ (Dale and Beyeler 2001).
This is particularly important in light of the CEWO MERI principle 8 that ‘monitoring,
evaluation and reporting should be timely, efficient, cost-effective, consistent and should
supply the information needed for evaluation’. A major influence on cost-effectiveness is the
value of the information in terms of its contribution to the objectives of the program. As not all
indicators will contribute equally to achievement of LTIM objectives and resources are not
available to monitor all indicators, a prioritisation process is required to select indicators.

43
Figure 22. Diagram illustrating the indicator prioritisation process with the orange triangle on
the left indicating that finalisation of each step in the objectives hierarchy reduces the number
of potential indicators. The LTIM requirement documents include the list of area priority
indicators that will be finalised by service providers in the development of the detail area MERI
requirement documents.
3.2.2 Selecting indicators
Identification of priority indicators is based on the LTIM objectives hierarchy, the needs of
annual reporting of outcomes, five year reporting against EWP objectives and adaptive
management. In this context, the needs of adaptive management are defined as the
expected outcomes that are the subject of CEWO decisions and the causal factors that are
considered most likely to link flow to an expected outcome (see Section 3.2.5).
The selection process reflected the three objectives commencing with selected area annual
reporting priorities as reflected by area stakeholder’s area priorities. The outcomes of the
area prioritisation were used as a starting point that was compared to the Basin-wide
reporting requirements. Finally, the output of the combined selected area and Basin-wide
process was reviewed in light of the adaptive management requirements.
More detailed descriptions of these processes are provided in the following sections.
44
3.2.3 LTIM selected area priorities
A suite of expected outcomes were developed for each area based on the EWP objectives,
our understanding of the system and the anticipated watering actions. Identification of
selected area objectives and expected outcome priorities enabled identification of the priority
indicators from an area perspective.
The development of selected area priorities provided an opportunity to establish a basis for
collaboration between the Commonwealth and Basin states as outlined in the CEWO MERI
Framework. This required that a link be established between EWP objectives and the area
characteristics that stakeholders were interested in protecting or restoring (hereafter referred
to as values). Stakeholder workshops were undertaken for each selected area in which local
perspectives were captured on high priority values and associated expected outcomes.
The high priority values consisted of selected area characteristics or processes that
managers sought to protect or restore. The values were drawn from relevant management
documents and mapped against objectives and reviewed by key stakeholders. This enabled
alignment of EWP objectives and area values which would facilitate a collaborative
approach.
The values that related to the Level 2 and 3 objectives for each selected area were
prioritised from a selected area perspective using three criteria. The prioritisation was
completed at the ecosystem level. The three ecosystem types are; river, floodplain and
wetland. The three criteria were selected in order to identify the most important values to
stakeholders from a community (critical), ecological (support) and management perspective
(selected area priority):
1. Critical: Is a value critical to the character of the selected area? For example, the area is
considered significant because it is the largest or only area of a specific vegetation type.
Vegetation biodiversity would be the critical objective or value.
2. Support: Does one area value support or significantly influence other values? This may,
but not necessarily, imply a surrogate relationship for management. For example,
aquatic plants provide habitat for waterbirds, in which case vegetation biodiversity or
productivity is a high priority.
3. Selected area priority: Is the value a selected area management priority? For example, is
it included in planning frameworks, management plans etc. or is it both a regional and
Federal priority?
Distinct ecosystem zones (i.e. specific wetlands, river or creeks/streams) within each
selected area were considered separately as they supported different values. The zone
scores were then added together to provide an overall selected area priority. In some
instances, this meant that values considered a priority in one zone were of lower priority for
the entire selected area. The priority values were used to identify priority Level 2 and 3
objectives for each selected area.
The zone prioritisation process informed a subsequent prioritisation of the related expected
outcomes. The separate zone expected outcomes prioritisations were not used in the
prioritisation of indicators at the selected area but will be important in the process of

45
developing the detailed Monitoring and Evaluation Requirement documents for each
selected area.
3.2.4 Basin–scale priorities
The output of the selected area prioritisation process was reviewed in light of the five year
Basin-scale reporting requirements. The starting position was that in an ideal world, all the
selected area priorities would be included in the LTIM. We considered a series of questions,
the answers to which informed a judgement on which indicators should be monitored at each
site. In the questions that follow, ‘objectives’ refers specifically to EWP objectives which, of
course, may or may not be covered by the set of priority LTIM indicators for each area.
The questions were as follows:
If the objectives were monitored at all areas where identified as a selected area priority,
would the spatial extent of that monitoring be sufficient to meet Basin scale reporting
requirements? At this stage the minimum spatial extent to meet Basin scale
requirements will be arbitrary; it was decided that monitoring of an objective would have
to take place at a minimum of three areas to meet Basin scale reporting requirements.
Specifically:
o If the objectives were monitored at all areas where it is identified as a selected area
priority, would the objective be monitored at a minimum of three areas?
If the objectives were monitored at all areas where they were identified as a selected
area priority, would that enable prediction of outcomes at other sites in the Basin? In
general, it was considered that there needed to be one selected area in the northern
Basin and one in the southern Basin. The question was:
o If the objectives were monitored at all areas where they were identified as a priority,
would the number of areas exceed three (as specified in (1)) and would the subset of
areas include at least one northern and one southern Basin area?
Is the objective an important consideration from an adaptive management perspective?
If the answer was yes, then additional areas would usually be included in the
recommendation.
If the objective is not identified as a priority, is it required to meet Basin scale reporting
requirements?
o If it is required, how many and which areas should indicators of the objective be
monitored?
How cost-effective is monitoring the objective? The question considered three elements.
First, the strength of association with flow. Second, the cost of monitoring the objective.
Finally, opportunities for collaboration and cost sharing. In several instances, the main
cost associated with monitoring is having staff in the field and so can be integrated into
sampling other outcomes for little additional cost.

46
Addressing these questions enabled identification of relevant CEDs and indicators, and
recommendations concerning the selected areas where the indicators could be monitored.
We now discuss the prioritisation of the specific EWP objectives.
Ecosystem diversity emerged as a priority at all seven areas and a high priority at the
Junction of Warrego and Darling rivers, Edward-Wakool river system and Lower Murray
River. The relevant CED is ‘Landscape ecosystem diversity’ and the appropriate indicator is
the ecosystem types (using Australian National Aquatic Ecosystem (ANAE) classification)
and their extent. It is recommended that this be monitored at all seven areas by building on
the ANAE classification project being undertaken by CEWO (Cottingham et al. 2012),
utilisation of digital elevation models (DEMs) developed by the MDBA, NSW Government
and CSIRO; and vegetation information layers available from the Victorian, South Australian
and NSW Governments. Interrogation of these information layers within a Geographical
Information System (GIS) framework would enable identification of the types of ecosystems
watered, the area inundated and over five years - the water received in relation to our
current understanding of the various ecosystems’ water requirements.
Vegetation was listed as a high priority at all seven selected areas. The Basin Plan seeks to
protect or restore vegetation diversity and the condition, diversity, extent and contiguousness
of native water-dependent vegetation across the Basin. Among the seven selected areas
there were three (Lower Murray River, Junction of Warrego and Darling rivers and Gwydir
river system) that included vegetation diversity as a priority expected outcome. The relevant
CED is ‘landscape vegetation diversity’ and the appropriate indicators are species number
and abundance. In terms of using the vegetation expected outcomes from some selected
areas and applying them to other sites, there are reservations about the capacity to use
information from the Junction of Warrego and Darling rivers and the Lower Murray River to
infer results at other sites. In the case of Junction of Warrego and Darling rivers the
vegetation is highly modified due to historical management practices and the
decommissioning of the associated infrastructure means the system is likely to be in
transition. In the Lower Murray River the system is so highly modified by weir operations,
that similar conditions are unlikely at other sites. It is suggested that vegetation diversity also
be undertaken at the Murrumbidgee river system to provide a southern connected area from
which predictions can be made to other southern sites.
For Basin scale reporting purposes, vegetation could be considered to be mobile, as plant
propagules have the capacity to disperse over large distances. However, given the variation
among species and limited knowledge of actual dispersal, it is more realistic to consider
vegetation to contribute to local area biodiversity that contributes to Basin-scale biodiversity.
Basin-scale reporting requires aggregation of the outcomes at the selected areas to provide
an overall assessment of the contribution of Commonwealth environmental water to Basin-
scale biodiversity. Therefore, it is considered that monitoring of vegetation at the four
nominated sites (Lower Murray River, Junction of Warrego and Darling rivers, Gwydir river
system and Murrumbidgee river system) is the minimum requirement to meet this need.
Vegetation condition and vegetation extent were priority expected outcomes at all seven
water areas, although there was variation in the priority ranking for the different ecosystems.
The condition of vegetation is an outcome for which a Basin-wide response would be
expected and its inclusion in all seven selected areas is appropriate. The relevant CEDs are

47
vegetation ‘condition and reproduction’ and ‘recruitment and extent’. The condition indicator
is an individual condition which we recommend being undertaken using the TLM protocol
that uses a combination of remote sensing and quantitative ground surveys. Using the TLM
method will enable integration of TLM monitoring to facilitate Basin-wide reporting. In
addition, the MDBA normalised difference vegetation index (NDVI) information may support
this analysis which would ensure cost-effectiveness.
Vegetation extent is included within the CED ‘vegetation recruitment and extent’. The
indicator for vegetation extent is the distribution and contiguousness of long-lived vegetation,
which, given the size of the selected areas, is most effectively measured remotely. It is also
a slow-response variable and would only need to be done at the beginning and end of a five
year period.
Macroinvertebrates were not considered a priority at any site except the Murrumbidgee
river system area, where they were a low priority. While food does emerge as an influence
on CEWO water use decisions for several selected areas, in general, the reference was to
larval fish food which implies microinvertebrates, not macroinvertebrates. Concerns have
also been expressed about the capacity of macroinvertebrate monitoring to detect changes
in flow (Rose et al., 2008). Despite this, there are several reasons for including
macroinvertebrate monitoring in LTIM. As a Level 3 objective, the CEWO have an obligation
to report on the influence of Commonwealth environmental water on macroinvertebrates and
they are likely to be included in Basin-scale assessment of river condition. In addition,
macroinvertebrates are a major source of food for many native fish, so their response to flow
may influence fish condition which makes them of interest from an adaptive management
perspective.
It is suggested that macroinvertebrate diversity be monitored in river channels in the
Goulburn River, Edward-Wakool river system and Junction of Warrego and Darling river
system. The Goulburn River and Edward-Wakool river system are included because
environmental flows are restricted to in-channel flows and the monitoring of
macroinvertebrates may provide valuable insight into the role of base flows and in-channel
pulses to their condition. Junction of Warrego and Darling rivers is included as the
unregulated nature of the system makes it difficult to predict the nature of environmental
flows and the inclusion of macroinvertebrates will provide a range of options for identifying a
response.
The relevant CED and indicator would be within ecosystem macroinvertebrate diversity.
Macroinvertebrates contribute to local biodiversity and so Basin-scale outcomes would
involve a comparison of outcomes among selected areas to report on the aggregate
changes in biodiversity across the Basin. Given the uncertainty around macroinvertebrate
responses to flow change, for example recent flows in the Edward-Wakool river system area,
it is suggested that a sampling regime and indicators are developed based on our
understanding of the relationship between flow and macroinvertebrates rather than relying
on techniques developed for other purposes (e.g. rapid assessment).
Fish were listed as a high priority at all sites except the Lachlan river system where they
were a medium priority. The priority expected outcomes included fish diversity in the main
channel in all areas except the Gwydir river system. In the Lower Murray River there is no

48
expectation that environmental flows will lead to an increase in the number of native fish
species in the short-term. It appears reasonable however, to expect that environmental flows
should increase the abundance of some rare native species which is included in some
assessments of biodiversity. It is recommended that fish diversity be monitored within the
river channel at all seven areas, using the standard sustainable rivers audit (SRA) protocol.
In addition, while fish are being sampled additional information on population structure (as
an indicator of recruitment) and condition should be collected. The relevant CEDs are
‘landscape fish diversity’ and ‘Fish larval growth and survival’. The indicators of diversity are
native species richness and abundance. The minimum indicator for growth and survival is
size frequency data, but consideration should be given to otolith analysis to identify precise
spawning dates and rates, and timing of growth.
Three areas included wetland fish diversity among their priority expected outcomes (Lower
Murray River, Murrumbidgee and Lachlan river systems). Once again, there is some
uncertainty concerning the application of information from the Lower Murray River to other
areas in the Basin due to its highly modified character. Predicting outcomes at sites across
the Basin requires inclusion of a northern area. The Junction of Warrego and Darling rivers
is not considered appropriate due to connectivity issues and stakeholders had reservations
about the Gwydir wetlands because invasive species currently dominate the wetland fish
community. Despite these concerns about the Gwydir river system, inclusion of wetland fish
in the Gwydir river system would provide a northern area to both provide better
representation across the Basin for Basin-scale reporting and less uncertainty in terms of the
application of information to northern wetlands. It is also possible that environmental flows
may promote the numbers of native fish within the wetlands. It is therefore recommended
that wetland fish diversity, condition and recruitment be monitored in the Murrumbidgee river
system, Lachlan river system and Gwydir river system selected areas. This will require
development of a standard protocol, but the indicators are the same as those described for
the main channel.
Fish reproduction was a priority expected outcome at all seven areas. Some fish species are
highly mobile as adults and so fish spawned at one site have the capacity to disperse long
distances thereby providing a Basin-wide response; however, this applies to only some
species and may be better informed by monitoring of juvenile growth and survival, and fish
dispersal monitoring. As most lowland species are widespread throughout the Basin, it may
be more appropriate to regard fish reproduction as a Basin-wide response; that is fish are
widespread throughout the Basin and Basin-wide improvement in flows would be expected
to lead to widespread improvements in fish reproduction. Given the considerable effort
invested in monitoring fish reproduction over the last twenty years it should be possible to
predict fish reproduction from monitoring at three areas. It is therefore recommended that
fish reproduction be monitored in the Edward-Wakool river system, Lachlan river system and
Gwydir river system selected areas. The relevant CED is ‘fish reproduction’ and the indicator
is egg and larval abundance.
Waterbirds were a high priority in the Lachlan and Gwydir river systems and a medium
priority in the Lower Murray River, Edward-Wakool river system and Murrumbidgee river
system. Waterbird nesting and fledging is a priority expected outcome at the five areas
where waterbirds were a priority. The capacity to apply breeding and fledging information

49
generated by monitoring at the selected areas to other sites requires areas spanning the
north-south axis of the Basin. For this reason, it is recommended that waterbird nesting and
fledging be monitored at Gwydir river system, Murrumbidgee river system and Lachlan river
system. The relevant CEDs are ‘waterbird reproduction’ and ‘recruitment and fledging’ and
the associated indicators are nest and chick abundance, and fledgling abundance
respectively.
Reporting on populations of waterbirds over one-to-five-year time frames is problematic due
to the widespread dispersal of waterbirds and the fact that waterbirds reared in one area are
unlikely to remain in the area. Reid et al (2009) noted that ‘basin-wide monitoring of
waterbirds is essential to prosecute the aim of detecting and quantifying population trends,
otherwise waterbird movements will confound the analyses’. As a consequence,
consideration should be given to engaging a single service provider to monitor bird nesting
at the three nominated selected areas and that this be complemented with annual Basin-
wide monitoring of waterbird populations. This is out of scope for the LTIM Project, but may
be considered by the MDBA under its Basin Plan Monitoring and Evaluation program. The
relevant CED would be landscape waterbird diversity and associated indicators species
number and abundance.
Other vertebrates were a medium priority in the Gwydir river system, Edward-Wakool river
system and Murrumbidgee river system selected areas. In these areas the expected
outcomes relate to turtle (Edward-Wakool river system and Murrumbidgee river system) and
frog (Gwydir river system, Edward-Wakool river system and Murrumbidgee river system)
species and populations. The relevant CEDs are ‘other vertebrate growth and survival’ and
‘other vertebrate reproduction’. At the area scale, the indicators would include adult
abundance and evidence of successful recruitment. Frogs and turtle species vary in their
species range, but have limited dispersal capacity. As a consequence, frogs and turtles most
closely align with the third category of Basin-scale reporting, i.e. protecting or restoring local
populations of rare or endangered species that, if lost, would reduce Basin-scale
biodiversity. This means that the selected area and Basin-scale information requirements
are the same. The relevant indicators are frog and tadpole abundance changes over time
and for turtles, abundance and size distribution changes over time.
Connectivity Three CEDs that contribute to the connectivity objective have emerged as
priority indicators for the LTIM Project.
1. Hydrological connectivity emerged as a priority at five selected areas. Monitoring
hydrological connectivity enables the CEWO to report on ecosystem function, but is also
an important causal factor that needs to be understood if ecological outcomes are to be
modelled (see Adaptive Management Section 4.3). It is therefore recommended that
hydrological connectivity be incorporated into hydrological monitoring at all sites and that
this be the subject of a separate tender (see Adaptive Management Section 4.3). The
ongoing improvement in digital elevation models across the Basin should enable the
CEWO to report on connectivity outcomes at sites where water is allocated but there is
no on-ground monitoring. The combination of detailed on ground hydrological
connectivity from the seven selected areas and the digital elevation models will provide a
basis for reporting on CEWO contribution to the protection and restoration of connectivity

50
across the Basin. The relevant CED is ‘hydrological connectivity’ and the indicators
include the volume, duration, depth, timing and type of connection.
2. Biotic dispersal emerged as a medium priority at three selected areas. While biotic
dispersal is relevant to all biota, stakeholders were focused on fish. Flow management is
particularly important for fish as it provides both dispersal cues and influences
opportunities for dispersal. The influence of environmental flows on Basin-scale fish
outcomes is also going to be strongly mediated by fish dispersal as fish recruited to the
adult population then have the capacity to disperse throughout the Basin.
In contrast, the evidence to date suggests that the influence of environmental flows on
bird dispersal is limited and flow does not directly influence their capacity to disperse.
Our understanding of seed and propagule dispersal would make it difficult to develop
expected outcomes for vegetation dispersal and would recommend this be identified as a
research topic.
Based on this logic it is recommended that the monitoring of biotic dispersal focus on
fish. Consideration of the MERI principles suggests fish dispersal work be undertaken
where there has been a history of monitoring and where it can be achieved in a cost
effective manner.
The sites that appear to rank highest according to these criteria are:
Edward-Wakool river system where a program of tagging and tracking has been
undertaken for several years and the required infrastructure is in place
Goulburn River where a similar program of tagging and tracking has been
undertaken and the required infrastructure is in place
Lower Murray River where the fish-way monitoring program has monitored
longitudinal fish movements.
These three sites are all in the southern Murray-Darling Basin (MDB) and this may limit
capacity to apply results across the Basin. One option to resolve this would be to include
the Junction of the Warrego and Darling rivers as a site where fish dispersal is monitored
as this would have the additional benefit of reporting the influence of flows on fish to be
reported to the local community. Against this, the infrastructure in place at the Junction of
the Warrego and Darling rivers means that fish dispersal is severely constrained along
the Warrego River and associated floodplain and so fish dispersal did not emerge as a
selected area priority.
The relevant CED is ‘biotic dispersal’ and the less-than-one-year indicator would be fish
movement. As noted above, Basin-scale fish outcomes will be influenced by fish
dispersal as fish recruited to the adult population then have the capacity to disperse
throughout the Basin. The five year outcomes will vary depending on the underlying
motivation for dispersal. In some cases, dispersal may enable expansion of a species’
range. In other instances it may improve recruitment of young fish. The one-to-five-year
expected outcomes may therefore be changes in the distribution of fish or increased
51
abundance of fish. The indicators would be changes in the abundance and population
structure of fish and changes in their distribution.
3. Sediment transport was only listed as a priority at the Junction of the Warrego and
Darling rivers. It is also a difficult outcome to predict or evaluate as the influence of flow
on sediment transport is understood in general terms (e.g. high flows transport
sediment); however, predicting how much sediment should be transported and
evaluating whether the outcomes of the transport were beneficial (creating habitat) or
detrimental (smothering wetland macrophytes) is also problematic. With hydrological
connectivity and fish dispersal being monitored, the need for CEWO to report on
sediment transport may become a lower priority. It is recommended that suspended
sediment be included in the standard suite of water quality measurements undertaken as
it would represent a relatively minor additional cost.
The relevant CED is ‘sediment transport’ and the less-than-one-year indicator would be
suspended sediment. All rivers transport sediment and therefore a Basin-wide response
would be expected. Including suspended sediment in the water quality parameters
monitored at all seven sites will provide local relationships between turbidity, flow and
suspended sediment that could be used to estimate Basin-wide suspended sediment
responses. The five year expected outcome of sediment transport is geomorphological
change. The indicator is changes in channel or wetland shape and could be monitored
through the creation of a DEM at the commencement of monitoring and again after five
years. Any changes could then be interpreted in light of the suspended sediment
information collected over the first phase of the LTIM.
Ecosystem processes. While all three CEDs that contribute to the ecosystem process
objective will be included in the LTIM, the emphasis will be on primary production and
decomposition with nutrient and carbon cycling being included in standard water quality
monitoring where appropriate.
Primary production was listed as a medium priority in the Lower Murray River, low
priority in the Murrumbidgee and Lachlan river systems and did not rate at the other
sites. Despite not being a priority it is recommended that primary production be
monitored at all sites for reasons similar to the rationale for water quality (see below). In
terms of Basin-scale reporting it is a function that would be expected to respond across
the entire Basin. In terms of reporting outcomes, there is a reliable response to flow and
from an adaptive management perspective it is one of the key pathways by which flows
are believed to influence ecosystem condition. The relevant CED is ‘primary productivity’
and two methods are recommended. In river channels, open water oxygen logging
provides reliable estimates of reach metabolism, including primary production. Two of
the parameters logged (dissolved oxygen and temperature) are key water quality
parameters that we recommend logging as part of the water quality program. The third is
daylight which is cheap to monitor as well. For floodplain primary production we
recommend the use of remote sensing using Normalized Difference Vegetation Index
(NDVI) which compares the amount of photosynthetically useful light to the near-infrared
light reflected from the land to provide an indication of the levels of photosynthesis
(primary production). The MDBA is in the process of ensuring this data is regularly
available across the Basin.

52
Decomposition only emerged as a low priority in the Lower Murray River and did not
rate at any of the other areas, despite most major water quality issues (blackwater,
wetland acidification and blue-green algal blooms) being linked to decomposition
processes. The open water method recommended for primary production in river
channels also provides some information on decomposition and this would be enough to
enable the CEWO to report on their influence on decomposition. Consideration could be
given to monitoring floodplain surface (leaf litter) and sediment organic matter levels at
Junction of Warrego and Darling rivers, Murrumbidgee river system, Edward-Wakool
river system and Lachlan river system. The priority accorded to monitoring floodplain
organic matter will depend to some extent on the future of The Living Murray Program
that has been considering monitoring floodplain organic matter to inform management of
blackwater.
Decomposition is a CED. The indicators for decomposition are river channel metabolism,
floodplain surface and sediment organic matter.
Nutrient and carbon cycling also emerged as a low priority in the Lower Murray River
but did not rate at any of the other areas. While important to ecosystem function, it is not
recommended that monitoring go beyond standard water quality measurements at this
time. The CEWO can meet reporting requirements through the information generated
from primary production, decomposition and standard water quality measurements.
Nutrient and carbon cycling is a CED. The indicators for nutrient and carbon cycling are
total nitrogen, total phosphorus, NOx, filtered reactive phosphorus and dissolved organic
carbon.
Ecosystem resilience was rated a low priority in both the Lower Murray River and
Lachlan river system selected areas. The CEDs and indicators for ecosystem resilience
are the same as those for ecosystem diversity and so the recommendation is the same
and is captured at all sites under ecosystem diversity.
Population resilience was rated a high priority in both the Goulburn River and Lachlan
river system and a low priority in the Murrumbidgee river system selected area. In the
Lachlan river system, the associated expected outcomes include protecting long-lived
vegetation and refuges for frogs and turtles. This reflects similar expected outcomes in
the Murrumbidgee river system and Edward-Wakool river system. The relevant CED for
long lived vegetation is ‘resistance’ and the indicator is population condition, in particular,
population structure and individual condition. Long lived vegetation is included in
monitoring at all seven areas and the information generated could be used to report on
long-lived tree condition across the Basin. For frogs, the relevant CED is ‘refuge’ and the
indicator would be changes in distribution and abundance through time. Frog monitoring
has been recommended for the Gwydir river system, Edward-Wakool river system and
Murrumbidgee river system areas and consideration of refugia could be incorporated into
the design to enable reporting on other vertebrate population resilience. The other
expected outcome in the Murrumbidgee river system, Edward-Wakool river system,
Junction of Warrego and Darling rivers, and Gwydir river system is the presence of
refugia or depth of pools. These could be monitored within the sediment transport and
geomorphology monitoring recommended under the sediment transport ecosystem
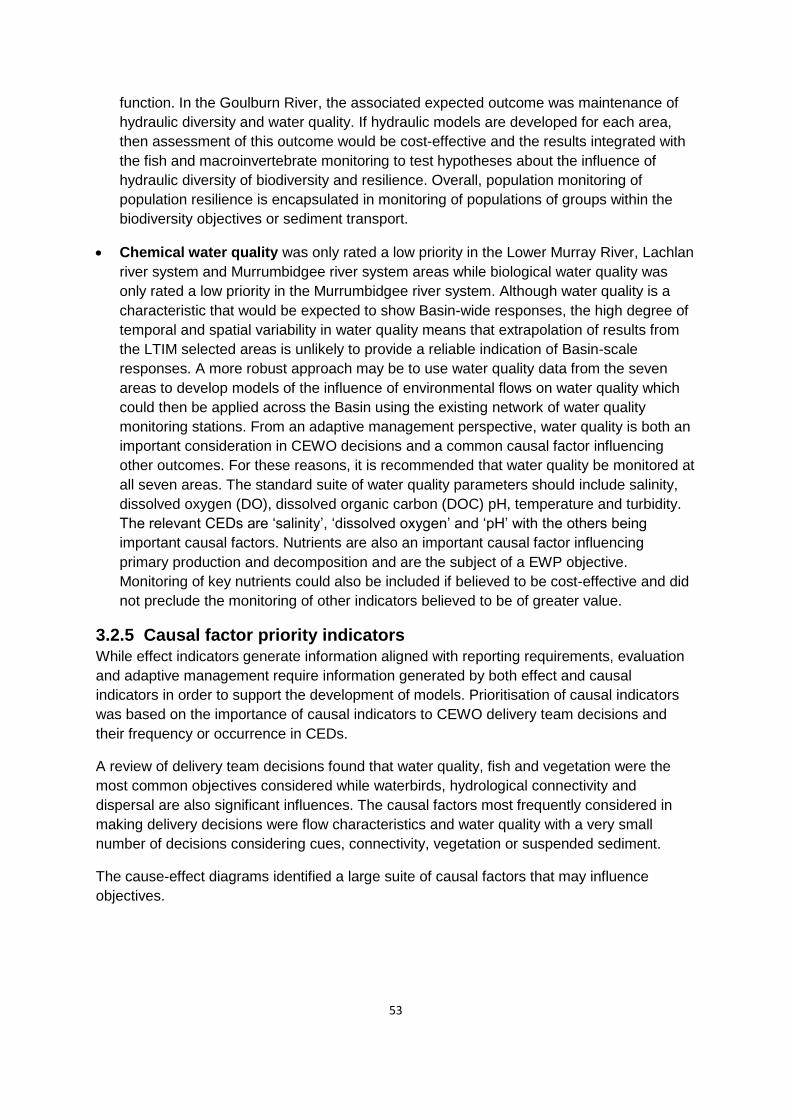
53
function. In the Goulburn River, the associated expected outcome was maintenance of
hydraulic diversity and water quality. If hydraulic models are developed for each area,
then assessment of this outcome would be cost-effective and the results integrated with
the fish and macroinvertebrate monitoring to test hypotheses about the influence of
hydraulic diversity of biodiversity and resilience. Overall, population monitoring of
population resilience is encapsulated in monitoring of populations of groups within the
biodiversity objectives or sediment transport.
Chemical water quality was only rated a low priority in the Lower Murray River, Lachlan
river system and Murrumbidgee river system areas while biological water quality was
only rated a low priority in the Murrumbidgee river system. Although water quality is a
characteristic that would be expected to show Basin-wide responses, the high degree of
temporal and spatial variability in water quality means that extrapolation of results from
the LTIM selected areas is unlikely to provide a reliable indication of Basin-scale
responses. A more robust approach may be to use water quality data from the seven
areas to develop models of the influence of environmental flows on water quality which
could then be applied across the Basin using the existing network of water quality
monitoring stations. From an adaptive management perspective, water quality is both an
important consideration in CEWO decisions and a common causal factor influencing
other outcomes. For these reasons, it is recommended that water quality be monitored at
all seven areas. The standard suite of water quality parameters should include salinity,
dissolved oxygen (DO), dissolved organic carbon (DOC) pH, temperature and turbidity.
The relevant CEDs are ‘salinity’, ‘dissolved oxygen’ and ‘pH’ with the others being
important causal factors. Nutrients are also an important causal factor influencing
primary production and decomposition and are the subject of a EWP objective.
Monitoring of key nutrients could also be included if believed to be cost-effective and did
not preclude the monitoring of other indicators believed to be of greater value.
3.2.5 Causal factor priority indicators
While effect indicators generate information aligned with reporting requirements, evaluation
and adaptive management require information generated by both effect and causal
indicators in order to support the development of models. Prioritisation of causal indicators
was based on the importance of causal indicators to CEWO delivery team decisions and
their frequency or occurrence in CEDs.
A review of delivery team decisions found that water quality, fish and vegetation were the
most common objectives considered while waterbirds, hydrological connectivity and
dispersal are also significant influences. The causal factors most frequently considered in
making delivery decisions were flow characteristics and water quality with a very small
number of decisions considering cues, connectivity, vegetation or suspended sediment.
The cause-effect diagrams identified a large suite of causal factors that may influence
objectives.

54
The ten causal factors that occurred most frequently in the CEDs were:
1. water quality
2. water depth
3. vegetation
4. hydraulics
5. flow duration
6. flow timing
7. infrastructure
8. connection type
9. sediment
10. landscape position.
The outcomes of this evaluation reveal that hydrological and water quality indicators are the
main two groups of indicators that are both common causal factors influencing outcomes
and, as a consequence, factors that influence CEWO decisions. The hydrological indicators
enable identification of the influence of an environmental flow on critical habitat and
connectivity characteristics. Key hydrological indicators include depth, velocity, duration and
timing. The water quality indicators provide information on habitat, connectivity and cues for
biota. Key indicators include salinity, dissolved oxygen, pH, temperature, turbidity and
nutrients. There are a number of options available to monitor both flow characteristics and
water quality at the seven selected areas. These options are discussed in Sections 3.2.6,
3.2.7 and 3.2.8.
There were three other causal factors identified within the CEDs that commonly influence a
response to flow. In terms of their frequency within the CEDs these were vegetation, food
and predation. The recommendation that vegetation condition be monitored at all sites and
vegetation diversity be monitored at four sites should enable evaluation of the influence of
vegetation on outcomes. Food availability is more problematic as diets vary widely among
species; however, microinvertebrate abundance is widely believed to be a significant limiting
factor in the growth and survival of larval and juvenile fish. Monitoring of microinvertebrates
could therefore, be included if believed to be cost-effective and did not preclude the
monitoring of other indicators believed to be of greater value.
The last common causal factor was predation which may be important for fish and other
vertebrates. Large fish community information will be available for all river channel and
wetland habitats in the Gwydir river system, Lachlan river system and Murrumbidgee river
system and in the first instance, this is believed to be adequate. The inclusion of monitoring
of bird feeding pressure does not appear justified at this point although some very general
relationships may be discerned from examination of data from different habitats within the
Gwydir river system, Lachlan river system and Murrumbidgee river system selected areas
during breeding events.

55
3.2.6 Flow characteristic monitoring options – river channel
Options for monitoring flow characteristics in river channels include:
Water level recording (single or multiple cross-sections):
o Description: This approach represents the minimum required to inform the
interpretation of environmental outcomes.
o Causal factors monitored: Depth.
o Benefits: Standard methods are available and permanently installed equipment is low
cost and robust.
o Drawbacks: Unless there is a stream-flow gauge nearby, these surveys alone do not
provide data on stream discharge or flow velocity. Additional measurements are
required (see next option). This approach becomes more complicated and costly in
multi-channel rivers.
o Cost: Logging water level recorders are approximately $500 per site. Loggers may be
placed at the top and bottom cross-section if multiple cross-sections are being
monitored. Recorders need to be cleaned and downloaded approximately every two
months (longer is possible with loss of accuracy/precision). An initial survey of the
channel cross-sectional profile is required to convert water level to water depth.
Costs can vary depending on the type of survey, number of cross-sections and site
conditions. Typically it would require 2-3 days for a survey team for a 1 km river
reach with some additional time processing data after the field survey. Channel
surveys would need to be repeated after channel-forming flow events (every ~2-5
years).
Stage-Discharge rating curve (modelled or fitted):
o Description: This approach would include all items in (1) in addition to measurements
of streamflow at one or more discharge levels.
o Causal factors monitored: Depth, stream discharge and cross-sectional flow velocity.
o Benefits: Standard methods are available and permanently installed equipment is low
cost and robust. The choice of one-dimensional hydraulic modelling or curve-fitting to
observed discharges at multiple water levels should be made by an experienced
hydrographer/hydraulic modeller based on required precision and cost.
o Drawbacks: This approach becomes more complicated and costly in multi-channel
rivers. Hydraulic modelling, particularly in irregular channels and at low flows can be
quite inaccurate and multiple surveys of water levels are desirable but scheduling of
surveys to coincide with different discharges can be difficult.
o Cost: Logging water level recorders are approximately $500 per site and need to be
cleaned and downloaded approximately every two months. An initial survey of the
channel cross-sectional profile is required to convert water level to water depth.
Costs can vary depending on the type of survey, number of cross-sections and site

56
conditions. Typically it would require 2-3 days for a survey team for a 1 km river
reach with some additional time processing data after the field survey. Stream flow
gauging (i.e. discharge measurement) would need to be repeated approximately
once per 2-4 months and would require a field team of ~two people for half a day on
average. Hydraulic modelling or curve fitting would require 1-3 days. Channel
surveys would need to be repeated after channel-forming flow events (every ~2-5
years) and the rating curve/hydraulic model revised.
Flow velocity profiles (measured) at multiple cross-sections:
o Description: This approach would include all items in (2) in addition to measurements
of velocity at all surveyed cross-sections for multiple discharges.
o Causal factors monitored: Depth, stream discharge, flow velocity variations across
the channel and turbulence (if using acoustic Doppler velocimetry).
o Benefits: No modelling is required.
o Drawbacks: This approach becomes more complicated and costly in multi-channel
rivers. Surveys must be repeated at multiple discharges to establish the discharge-
dependencies. Scheduling of surveys to coincide with different discharges can be
difficult.
o Cost: Logging water level recorders are approximately $500 per site and need to be
cleaned and downloaded approximately every two months. An initial survey of the
channel cross-sectional profile is required to convert water level to water depth.
Costs can vary depending on the type of survey, number of cross-sections and site
conditions. Typically it would require 2-3 days for a survey team for a 1 km river
reach with some additional time processing data after the field survey. Stream flow
gauging (i.e. discharge measurement) and velocity measurements (at each cross-
section) would need to be repeated approximately once per 2-4 months and would
require a field team of ~two people for one day on average.
Flow velocity profiles (modelled) at multiple cross-sections with digital elevation model of
channel:
o Description: This approach would include all items in (3) although velocity
measurements are only used for model testing and may be restricted to one or two
discharge levels and a sample of cross-sections.
o Causal factors monitored: Depth, stream discharge, cross-sectional flow velocity,
turbulence, channel bed and bank survey to generate digital elevation model.
o Benefits: Provides detailed information of velocity variations with a river reach.
o Drawbacks: This approach becomes more complicated and costly in multi-channel
rivers. Hydraulic modelling, particularly in irregular channels and at low flows can be
quite inaccurate. Modelling is a specialised activity and modellers need to be
involved with field survey design.

57
o Cost: Logging water level recorders are approximately $500 per site and need to be
cleaned and downloaded approximately every two months. An initial survey of the
channel cross-sectional profile is required to convert water level to water depth.
Costs can vary depending on the type of survey, number of cross-sections and site
conditions. Typically it would require 2-3 days for a survey team for a 1 km river
reach with some additional time processing data after the field survey. Stream flow
gauging (i.e. discharge measurement) would need to be repeated approximately
once per 2-4 months and would require a field team of ~two people for half a day on
average. Hydraulic modelling or curve fitting would require 1-3 days. Channel
surveys would need to be repeated after channel-forming flow events (every ~2-5
years) and the rating curve/hydraulic model revised.
3.2.6.1 Recommendations
The choice of option will be informed by a number of factors, including channel length and
morphology, extent of existing infrastructure and opportunities for collaboration. It is
recommended that discussions be held with relevant state agencies and the Bureau of
Meteorology to identify an optimal strategy. Where digital elevation models already exist,
consideration should be given to the development of velocity profile models as these will
facilitate interpretation of fish responses to changes in flow.
3.2.7 Flow characteristic monitoring options – floodplain
Water level recorders and floodplain survey:
o Causal factors monitored: Water level, water depth.
o Benefits: Standard methods available.
o Drawbacks: Information limited to individual floodplain units being surveyed.
o Cost: Water level recorders cost approximately$500 per station. These need to be
cleaned and downloaded every two months. Floodplain survey costs are highly site
dependent but might require a survey team for one day in addition to data
processing. Light detection and ranging (LiDAR) surveys may also be used but costs
and logistical complexity increases and would only be justified for more extensive
surveys.
Satellite remote sensing:
o Causal factors monitored: Flood extent and connectivity.
o Benefits: Extensive data of entire floodplain is possible.
o Drawbacks: Resolution of data is limited in time or spatial detail for free products.
o Cost: Data processing is a specialised activity and quotes would need to be obtained.
Costs for high-resolution tasked satellite imagery would need to be determined on a
case-by-case basis.
Flood Modelling:

58
o Causal factors monitored: Flood depth, extent and connectivity.
o Benefits: All key causal factors are monitored.
o Drawbacks: Cost and accuracy for low gradient floodplains needs to be considered.
o Cost: Needs to be determined on a case-by-case basis
3.2.7.1 Recommendations
The choice of option will be informed by a number of factors, including the selected area
characteristics, extent of existing infrastructure and opportunities for collaboration. There are
significant benefits in the utilisation of a single provider to manage all flow data collection
and management in terms of consistency of data, quality assurance and access. It is
recognised that this may not be feasible in light of the opportunities to collaborate and build
on existing infrastructure. It is recommended that discussions be held with relevant state
agencies and the Bureau of Meteorology to identify an optimal strategy. This will require
identification of each selected area’s specific flow monitoring requirements and existing
infrastructure and models.
3.2.8 Water quality monitoring options
There have been considerable developments in the area of water quality monitoring over the
last few decades. These developments provide opportunities to improve the cost-
effectiveness of water quality monitoring through either reducing the cost or increasing
sampling accuracy and intensity to improve statistical power. The following section is a brief
overview of some of the options.
Spot field measurements. The development of the Sustainable Rivers Audit (SRA)
evaluated the value of water quality spot measurements to assessing water quality as
part of the assessment of river condition. The evaluation identified that the parameters
evaluated varied independently and there was no redundancy that would enable one
indicator to be used as a surrogate for other indicators. The SRA also identified issues
with the identification of reference conditions that led them to exclude water quality from
the assessment. This is not a significant issue for LTIM as the question is how changes
in flow cause changes in water quality. Of greater concern was the level of variation
observed in spot measurements that, for the SRA, limited their capacity to assess
condition but within the LTIM process may make identifying changes difficult.
o Causal factors monitored: There are a range of probes available that are capable of
reliably measuring conductivity (salinity), pH, turbidity, temperature, dissolved
oxygen, water depth, current speed, chlorophyll a, ammonia, nitrate and chloride.
Samples can also be collected for an enormous variety of water quality parameters
that can be stored and processed in the laboratory.
o Benefits: Spot measurements are relatively cheap once staff are in the field and
relatively flexible in terms of the number of measurements and their location. Spot
measurements are also lower risk in terms of equipment failure, damage or loss.
There is also flexibility in terms of the parameters that can be monitored.

59
o Drawbacks: Many water quality parameters vary through time in response to a
variety of influences, only some of which are related to flow. High flows can limit
access to sites limiting the samples that can be taken.
o Cost: As noted above, once staff are in the field, basic water quality parameters are
relatively cheap.
Logged data
Any of the probe mounted sensors can be associated with a data logger that enables the
continuous logging of water quality parameters.
o Causal factors monitored: Include conductivity (salinity), pH, turbidity, temperature
and dissolved oxygen.
o Benefits: Logging enables quantification of variations in water quality over the course
of a day, weeks or months. Daily variations are important for parameters such as
dissolved oxygen and temperature and logging these over 24 hours enables the
calculation of aquatic metabolism. Longer term variations are likely to occur during
environmental flows as water quality is known to change rapidly in response to initial
connection and disconnection and it becomes expensive to maintain staff in the field
for extended periods. The additional data also greatly increases the power of
analysis thereby increasing chances of detecting significant changes.
o Drawbacks: The reliability of loggers has improved significantly, but they do
occasionally fail or are lost due to natural events or human interference. The loss of a
logger is associated with a loss of data and often there is no indication that the logger
has failed or disappeared until the next scheduled maintenance event.
o Cost: Loggers are more expensive than manual probes and to achieve reasonable
spatial replication requires the deployment of several loggers in each area.
Logged and telemetered data
In addition to logging capacity, it is also possible to have telemetered probes that enable
remote data access. Many of the water authority’s water quality monitoring stations are now
telemetered in order to provide ready access to support operational decisions.
o Causal factors monitored: Include conductivity (salinity), pH, turbidity, temperature
and dissolved oxygen.
o Benefits: The review of CEWO decisions revealed that real-time information was an
important input to many delivery decisions during an environmental flow. Having
access to real-time data may improve decisions and thereby improve outcomes from
the flow. Remote access also enables regular checking of the probe to ensure that it
is functioning properly.
o Drawbacks: There are significant cost implications in terms of both the probes and
the host institution from the perspective of their information technology (IT) support
for the probes.

60
3.2.8.1 Recommendations
The choice here is about the balance between spot measurements, logging and telemetered
logging. It is always of value to ensure field staff have a multi-probe and a few additional
sample bottles in order to take additional spot measurements. It is recommended that at a
minimum, logging dissolved oxygen and temperature should be undertaken in order to
enable calculation of river metabolism. The extent to which loggers should be telemetered
will be informed by a number of factors, including the selected area characteristics, extent of
existing water quality monitoring infrastructure and opportunities for collaboration. It is
recommended that discussions be held with relevant state agencies and the Bureau of
Meteorology to identify each selected area’s existing capacity and opportunities for
enhancement.
3.2.9 Summary of priority indicators
Based on the process outlined above, priority objectives and indicators have been identified
for each of the selected areas (Table 5). The priority indicators set the scope for what could
ultimately be monitored in each area, noting that a final set of indicators will not be selected
until the detailed monitoring design stage is completed in each area. The indicators
ultimately selected will depend on their priority as outlined here, along with a practical
monitoring and cost consideration.
Table 5 outlines eighteen priority objectives and forty priority indicators, spread among the
seven selected areas. Ten of the objectives were identified as priorities at all sites, including
ecosystem diversity, vegetation condition and reproduction, and landscape fish diversity.
Two indicators in Table 5 have been listed as potential indicators (?) for the selected areas if
it represents greater value than other priority indicators and/or is determined to be a priority
during the development of the detailed Monitoring and Evaluation Plans.
There are several indicators that would rely on remote sensing, including ecosystem
diversity, vegetation condition and extent, and the floodplain component of primary
production. One benefit of remote sensing is that it can provide an estimate of the entire
selected area in a cost-effective way. For this reason, these four indicators can be monitored
at all areas.
Other indicators identified as priorities in all areas were chemical water quality, hydrological
connectivity, suspended sediment, river channel primary production and
decomposition. These indicators are both important to the outcome of an environmental flow
and relatively inexpensive to collect.

61
Table 5. Summary of the CEDs and indicators that are monitoring priorities for Basin Plan
reporting, adaptive management and at each of the seven selected areas. Effect indicators are
those that quantify an expected outcome (denoted with a ‘E’ in type column) while others are
causal factors that link flow to an expected outcome (denoted with a ‘C’ in type column). Many
indicators provide information on both expected outcomes and causal factors, depending on
the CED and these are designated with both a ‘C’ and an ‘E’. A ‘Y’ in the area column denotes
that the indicator is a priority for that area. A ‘?’ in the table denotes a potential indicator.
CED Indicators
Ty
pe
(Effe
ct o
r Ca
us
e)
Ba
sin
Pla
n
Ad
ap
tive
Ma
na
ge
me
nt
Ed
wa
rd-W
ak
oo
l rive
r
sy
ste
m
Go
ulb
urn
Riv
er
Gw
yd
ir rive
r sy
ste
m
La
ch
lan
rive
r sy
ste
m
Lo
we
r Mu
rray
Riv
er
Mu
rrum
bid
ge
e riv
er
sy
ste
m
Ju
nc
tion
of th
e W
arre
go
an
d D
arlin
g riv
ers
Landscape ecosystem
diversity
Ecosystem type and
extent
E Y Y Y Y Y Y Y Y
Landscape vegetation
diversity
Species number and
abundance
E C Y Y Y Y Y
Vegetation recruitment
and extent
Extent, distribution
and contiguousness
of long-lived
vegetation
E C Y Y Y Y Y Y Y
Vegetation condition
and reproduction
Individual condition E C Y Y Y Y Y Y Y Y Y
Within ecosystem
macroinvertebrate
diversity
Species number and
abundance
E C Y Y Y Y
Landscape fish
diversity (channel)
Native species
number and
abundance
E Y Y Y Y Y Y Y Y
Landscape fish
diversity
Microinvertebrate
abundance
C Y ? ? ? ? ? ? ?
Landscape fish
diversity (wetland)
Species number and
abundance
E Y Y Y Y
Fish larval growth and
survival
Size frequency data E Y Y Y
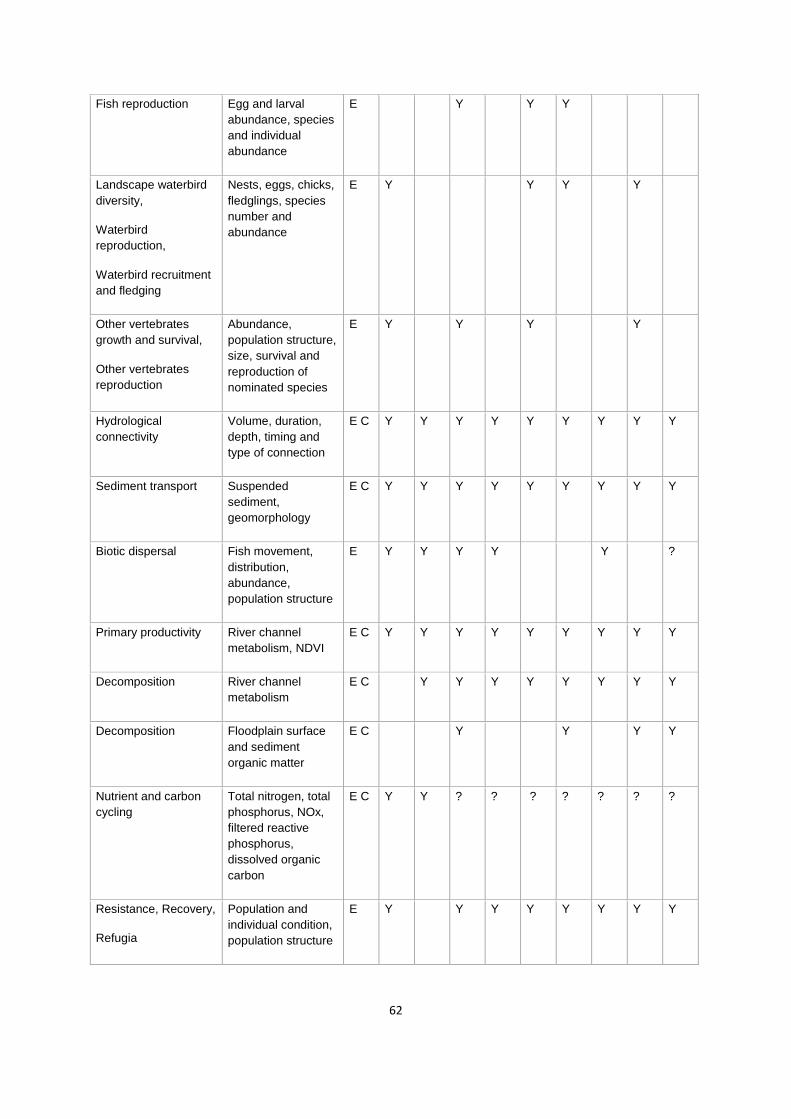
62
Fish reproduction Egg and larval
abundance, species
and individual
abundance
E Y Y Y
Landscape waterbird
diversity,
Waterbird
reproduction,
Waterbird recruitment
and fledging
Nests, eggs, chicks,
fledglings, species
number and
abundance
E Y Y Y Y
Other vertebrates
growth and survival,
Other vertebrates
reproduction
Abundance,
population structure,
size, survival and
reproduction of
nominated species
E Y Y Y Y
Hydrological
connectivity
Volume, duration,
depth, timing and
type of connection
E C Y Y Y Y Y Y Y Y Y
Sediment transport Suspended
sediment,
geomorphology
E C Y Y Y Y Y Y Y Y Y
Biotic dispersal Fish movement,
distribution,
abundance,
population structure
E Y Y Y Y Y ?
Primary productivity River channel
metabolism, NDVI
E C Y Y Y Y Y Y Y Y Y
Decomposition River channel
metabolism
E C Y Y Y Y Y Y Y Y
Decomposition Floodplain surface
and sediment
organic matter
E C Y Y Y Y
Nutrient and carbon
cycling
Total nitrogen, total
phosphorus, NOx,
filtered reactive
phosphorus,
dissolved organic
carbon
E C Y Y ? ? ? ? ? ? ?
Resistance, Recovery,
Refugia
Population and
individual condition,
population structure
E Y Y Y Y Y Y Y Y

63
*Hydrology is not a CED, however is a major driver of environmental outcomes, refer section
3.2.6 and 3.2.7.
3.3 Monitoring design
This section provides a brief introduction to some of the issues to be considered in the
development of the LTIM study design. The discussion is generic because the study design
is dependent on the indicator, the specific question and the structure of the models to be
developed. These issues will be finalised once service providers have been engaged and
specific models have been conceptualised. The study design is also influenced by the
analysis to be undertaken. Section 3.3 focuses on the study design and analysis required to
meet CEWO reporting requirements. Consideration of the study design requirements for
development of models to meet the requirements of adaptive management are described in
Section 4.3.3.
3.3.1 General principles of good study design
Sound experimental design is essential for quantifying the outcomes of environmental flows.
Good design starts with setting clear, realistic, measurable and unambiguous objectives that
inform the development of clear objectives and questions. This document describes the
broad objectives of the LTIM and our understanding of the relationships between flow and
EWP objectives (see Section 2.2). These will both be refined through the development of
watering area monitoring plans. It will be important through this process to distinguish
between environmental flow objectives which define the purpose(s) of delivering
environmental water and monitoring objectives which define the purpose(s) of monitoring.
The expected outcomes of environmental watering provide the basis for developing
hypotheses to be tested by the monitoring program (see Section 2.4). The specific
hypotheses then provide the basis for measureable end-points (Downes et al. 2002;
Cottingham et al. 2005a).
The aim of the LTIM Project is to quantify the outcomes of Commonwealth environmental
water over set periods of <1 and 1-5 years to underpin reporting requirements and adaptive
management. It may also be used to understand changes in the condition of areas where
CEWO long-term intervention monitoring is occurring. This requires being able to distinguish
the responses to Commonwealth environmental watering from the myriad of other factors
that affect aquatic ecosystems and their associated biota within the watering areas.
Experimental designs for generating inferences concerning environmental watering are
diverse (Eberhardt and Thomas 1991, Stewart-Oaten and Bence 2001). The monitoring
Salinity,
Dissolved oxygen, pH,
Dissolved organic
carbon
Salinity, dissolved
oxygen, pH,
temperature,
turbidity, dissolved
organic carbon
E C Y Y Y Y Y Y Y Y Y
Hydrology* Depth, duration,
timing, hydraulics,
dry rate, rise rate,
area, hydroperiod,
dry duration
C Y Y Y Y Y Y Y Y

64
design will be informed by both the question being asked and the characteristics of the
subject of the question (e.g. spatial and temporal scale of response). For reporting purposes,
the CEWO is required to report on the outcomes of individual watering events, answering the
question; what was the outcome of the specific environmental flow? For adaptive
management purposes, the CEWO seeks the development of models based on relationships
between environmental flow characteristics and the outcomes.
An additional consideration for the LTIM, associated with the nested nature of the objectives
and associated questions is that, as far as possible, the design needs to be able to answer a
question at a small-scale (unit, element or zone, <1 year) (Figure 23) and contribute to
answering a question at a larger scale (area, Basin, 1-5 years). One element of this is that
the CEWO wish to utilise the information from the watering areas to predict the outcomes at
sites that are watered, but at which there is either no or only limited monitoring. This will
require careful consideration of the ecosystem types that are sampled.
Figure 23. An illustration of the different spatial scales including zone, unit and element that will be used for the adaptive management and modelling.
For reporting purposes, the conventional view has been that establishing a causal link
between an environmental watering and an ecosystem response requires Before-After-
Control-Impact (BACI) or Multiple-Before-After-Control-Impact (MBACI) study designs
(Downes et al. 2002). These involve measuring indicators before and after the watering
event at impact sites (i.e. sites that receive environmental watering) and control sites (sites
that are similar to impact sites in all ways, except that they did not receive environmental

65
watering). Responses detected at impact sites that are not detected at control sites can then
be attributed to the watering event with a level of certainty.
There are a number of difficulties associated with the implementation of BACI and MBACI
designs, particularly in environmental monitoring. Downes et al. (2002) summarised these
into three categories:
1. The inherent nature of aquatic ecosystems makes it difficult to locate adequate control
sites.
2. The variability in environmental variables and indicators makes it difficult to reliably
detect change and assign causal links.
3. Institutional arrangements such as time and resource constraints limit proper application
of the design (e.g. limited or no opportunity to collect ’before’ data; financial constraints
for adequate sample size; requirements for reporting in too short a timeframe to reliably
detect change).
One alternative is that in the absence of control sites, reference sites have been suggested
as a useful alternative. A reference site is one that is as close to conditions unimpacted by
human activity as possible (Downes et al. 2002). Reference sites then act as a benchmark
against which change at impact sites can be compared (Cottingham et al. 2005a).
Cottingham et al. (2005b) summarised the type of design relative to the availability of before,
control and reference sites in Table 6. In some situations it may be possible to develop a
synthetic reference condition based on base-line data, monitoring and models.
Table 6. Potential study designs (Cottingham et al. 2005b).
Before
data
After
data
Control
sites
Reference
sites
Timeframe of response
No Yes No No Intervention only
No Yes No Yes Reference – Intervention
No Yes Yes No Control – Intervention
No Yes Yes Yes Control – Reference – Intervention
Yes Yes No No Before – After – Intervention
Yes Yes No Yes Before – After – Reference – Intervention
Yes Yes Yes No Before – After – Control – Intervention
Yes Yes Yes Yes Before – After – Control – Reference –
Intervention

66
In some situations, control or reference sites are not available. This is often the case in rivers
where even the differences between rivers in adjacent catchments can prevent their being
used as suitable reference sites. Even in situations where control or reference systems
appear to be available, such as wetlands, the diversity among wetlands may preclude their
use as reference sites. In these instances, the use of an unreplicated design may be the only
solution; however, it is important to be clear about the scale of inference (Hargrove and
Pickering 1992; Stewart-Oaten, Bence et al. 1992; Stewart-Oaten and Bence 2001). If
control or reference sites are available, consideration will still need to be given to the
advantages and disadvantages associated with expanding the number of wetlands studied
(Carpenter 1990; Oksanen 2001; Stewart-Oaten and Bence 2001; Johnson 2002).
In other situations, variations in the timing of environmental flows confound simple before-
after designs. Freshwater biota are very sensitive to temperature and responses may be
cued by temperature and day length which means seasonal variation has an enormous
impact on what we observe. This raises the issue of how to compare and contrast responses
to environmental water that is delivered to, or arrives at, different sites at different times.
Recently, there has been a move toward the use of sites along a gradient of environmental
stress (Bunn et al. 2010; Sheldon et al. 2012) or flow (Beesley et al. 2011; Webb et al. 2010)
to quantify the effect of flow. This approach requires an increased number of sites to be
sampled in order to generate the gradient. The LTIM approach of considering each watering
area to be a nested hierarchy of zones, elements and units may enable the identification of
sampling sites that would be amenable to this type of design.
Another important consideration in the design of a monitoring program is determining the
required sample size. This relates to the power to detect effects and how we scale the risk of
making both Type I and Type II errors. Type I errors occur when we conclude an impact has
occurred when, in reality, it had not. Conventionally, scientists will either accept or reject a
hypothesis while assuming the critical probability of making this error is 5%, αc = 0.05. In
very powerful experimental designs this may seem reasonable. However, when the system
we study is extremely ‘noisy’, when well-replicated designs are difficult or impossible, or
when the social-economic-political consequences of not detecting impacts are great, we may
be more concerned with making a Type II error; concluding ‘no impact,’ when in reality there
has been one. The probability of making Type I and II errors is dependent on statistical
power, which is in turn dependent on the spatial and temporal variability of the study system,
and the associated spatial and temporal design of sampling (Clarke and Green 1988;
Osenberg et al. 1994). Moreover, there exist methods to rescale αc based on the variability
of our system and the relative socio-economic risks associated with making Type I and II
errors (Mapstone 1995; Osenberg et al. 1994). It may be worth investigating these methods
and their applicability to the assessment of Commonwealth environmental water use, given
the level of investment in environmental water (but see Stewart-Oaten et al. 1992).
Cottingham et al. (2005b) suggested that effect size is best achieved through a three step
process of:
1. Discussions with stakeholders to examine the level of evidence required from the
monitoring program.
2. Conducting a pilot study to determine the variability in indicators to be measured.

67
3. Further discussions with stakeholders to consider benefits, costs and trade-offs of
different effect sizes and reach a decision.
Cottingham et al. (2005a) recognise that this process is rarely done, due to time and
financial constraints. However, again the implications of not conducting a pilot study and
determining an appropriate effect size needs to be made explicit. In the case of the LTIM,
both the CEWO short-term monitoring and other intervention monitoring programs may be
able to provide this information. It is highly recommended that statistical advice be taken at
the monitoring design phase to ensure that the design trade-offs are made with full
knowledge of the implications and the best possible design, given resource constraints, can
be implemented.
There are other factors that will shape the experimental design and associated analyses
(Walters and Holling 1990; Osenberg et al. 1994; Mapstone 1995). All of these factors and
associated modelling will need to be refined in the next phase of the development of LTIM.
This process will be complicated by the need to design a sampling program that meets the
needs of both short-term reporting and modelling requirements.
3.3.2 Data analysis considerations for monitoring design
Study design and data analysis are inextricably linked. The way in which monitoring data are
collected will dictate the type of analysis that can be undertaken. Therefore, it is important to
consider the type(s) of analysis that will be required to test the hypotheses and meet
monitoring objectives in the study design phase of the program (Quinn and Keough 2002).
Traditional hypothesis testing relies on comparing data from at least two different types of
sites (control and intervention, intervention and reference, and so forth). These methods use
a variety of parametric or non-parametric statistical models to answer the question: ‘Is there
a significant difference between sites?’ (Quinn and Keough 2002). That is, is there a
significant difference between sites that received environmental water and sites that did not?
The inference is then that at a defined level of probability, the ecological effects of
environmental watering can be inferred.
In recognition of the difficulties of applying traditional sampling designs and statistical
analyses to monitoring of environmental watering, the Victorian Environmental Flow
Monitoring and Assessment Program (VEFMAP) suggest the use of Bayesian hierarchical
modelling (Chee et al. 2006; Cottingham et al. 2005a). Bayesian data analysis uses
probability models based on our scientific understanding of the issue (in this case
environmental watering), observed (collected data) and expert judgement to evaluate the fit
of the models and draw conclusions (Gelman et al. 2004).
The advantages of a Bayesian approach are in ‘borrowing power’, in that data from one site
can be used to interpret responses at other sites within the same model (Chee et al. 2006).
The use of Bayesian approaches to data analysis will have an effect on the study design
requirements. As such, it is necessary to consider whether Bayesian hierarchical modelling
may be useful for the program in the design phase, and again, appropriate statistical advice
should be considered to ensure the study design will match data requirements.

68
3.3.3 Standard methods
The list of specific questions that can drive a long-term monitoring is potentially as diverse as
the reasons for establishing long-term monitoring project. What is evident is that specific
questions are necessary to direct the monitoring; otherwise, they become an exercise in
data collection with no real purpose (ANZECC 2000; Butcher 2003; Cottingham et al. 2005a;
Lindenmayer et al. 2011 ). An important component of the LTIM design and implementation
phases will be to employ standard methods for indicator measurement, site selection and
data management. Continuity, reliability and comparability of information are only assured if
monitoring and evaluation plans are implemented to an appropriate standard with
consistency and transparency being key elements. As such, standard methods are critical
considerations in monitoring design, particularly if trends are to be determined within and
between selected areas (Beard et al. 1999; ANZEEC 2000; Baldwin et al. 2005; Chee et al.
2006 ). In some instances, standard methods have been developed and recommendations
made. In other instances, variation among practitioners and ecosystems will require
agreement on an appropriate standard method to answer the questions posed by LTIM. A
summary of the major indicators and either the standard method or next step to defining the
standard method is summarised in Table 7.
Table 7. Summary of major indicators and associated standard method or the next step required to define the standard method.
CED Indicators Method Reference
Landscape
ecosystem diversity
Ecosystem type and extent Method to follow
ANAE
classification
project
methodology
Landscape
vegetation diversity
Species number and
abundance
Species
identification
within quadrats or
along transects.
To be refined
Baldwin et al.,
2005
Vegetation condition
and reproduction
Individual condition TLM Tree
condition
Cunningham et al
2009
Within ecosystem
macroinvertebrate
diversity
Species number and
abundance
To be determined Humphries et al.
1998
Landscape fish
diversity (channel)
Native species number and
abundance
SRA Protocol

69
CED Indicators Method Reference
Landscape fish
diversity
Microinvertebrate
abundance
To be refined Tan & Shiel 1993
Nielsen et al.
2005
Landscape fish
diversity (wetland)
Species number and
abundance
To be determined Beesley et al.
2010
Fish larval growth
and survival
Size frequency data To be determined Beesley et al.
2010
Fish reproduction Egg and larval abundance,
species and individual
abundance
Netting and/or
light trapping.
To be refined
Kelso &
Rutherford 1996
Vilizzi et al., 2008
Neal et al., 2012
Landscape waterbird
diversity,
Waterbird
reproduction
Waterbird
recruitment and
fledging
Nests, eggs, chicks,
fledglings, species number
and abundance
Aerial Surveys
Nest Surveys
Kingsford and
Thomas 2004
Brandis et al.,
2011
Other vertebrates
growth and survival
Other vertebrates
reproduction
Abundance, population
structure, size, survival and
reproduction of nominated
species
Species
dependent
Frogs:
Wassens et al.,
2010
Baldwin et al.
2005
Turtle:
Roe and Georges
2008
Hydrological
connectivity
Volume, duration, depth,
timing and type of
connection
See section 3.2.6
to 3.2.7.
Requires further
development
70
CED Indicators Method Reference
Sediment transport Suspended sediment,
geomorphology
Australian
Standard 3550.4
Biotic dispersal Fish movement,
distribution, abundance,
population structure
Infrastructure
dependent
Primary productivity River channel metabolism,
NDVI
Replicate single
station open
water
measurements
Young and Huryn
1996
Simms et al.,
2009
Decomposition River channel metabolism,
Floodplain surface and
sediment organic matter
Replicate single
station open
water
measurements
Young and Huryn
1996
Glazebrook and
Robertson, 1999
Nutrient and carbon
cycling
Total nitrogen, total
phosphorus, NOx, filtered
reactive phosphorus,
dissolved organic carbon
Standard
methods
Baldwin et al.,
2005
Resistance,
Recovery,
Refugia
Population and individual
condition, population
structure
Geomorphology
TLM Tree
condition
See section 3.2.6
to 3.2.7.
Requires further
development
Salinity,
Dissolved Oxygen,
Dissolved Organic
Carbon
pH
Salinity, dissolved oxygen,
pH, temperature, turbidity,
dissolved organic carbon
Needs refinement
Standard
commercial
probes or loggers
Baldwin et al.,
2005

71
CED Indicators Method Reference
Hydrological
connectivity
Depth, duration, timing,
hydraulics, dry rate, rise
rate, area, hydroperiod, dry
duration
See section 3.2.6
to 3.2.7.
Requires further
development
Cunningham et al
2009
As part of establishing the Monitoring and Evaluation Requirements for each selected area,
it will be important to develop and implement appropriate quality assurance and control
measures to ensure standards are upheld across all selected areas and that the data
collected is of a high quality (Chee et al. 2006). Whilst in the past there has been substantial
effort paid to study design, sampling methodology and methods of analysis, this has often
failed to translate to consistency of method in long-term programs (Beard et al. 1999). In an
adaptive monitoring program it will be essential to ensure that changes in monitoring design
still maintain consideration of standard methods.
Long Term monitoring projects tend to have a poor record in terms of success, due to a
number of factors including (Lindenmayer et al. 2011):
lack of questions
poor study design
failure to properly articulate what to monitor and why it is important to monitor targeted
entities
an inappropriate assumption that there is a single approach to monitoring that is
uniformly applicable to all monitoring programs.
The LTIM will evolve as it is an adaptive monitoring project; however, it therefore becomes
critical to ensure that standard methods and quality assurance are a major element of the
adaptive phase of the project.
3.3.4 Data storage and management
The successful delivery of the LTIM MERI Framework is reliant on multiple stakeholders and
service providers contributing data towards annual and five-yearly reporting and evaluation
cycles. Data collected by monitoring at individual watering areas also contributes to the
analysis and evaluation of Basin level objectives. It is therefore, imperative that data being
collected is of high quality, complete, compatible and available in consistent and
standardised formats to meet reporting and evaluation needs.
Data management for this LTIM Project is guided by the following principles:
Good governance - Leadership and coordination is essential to ensure the effective
delivery of the LTIM Project.
72
Custodianship - Data custodians are trustees that do not ‘own’ data but responsibly
manage and maintain it for use by a wider community of users. Data is maintained in one
location and the custodian becomes the authoritative source for the dataset.
Shared responsibility - Those collecting the data are responsible for the quality of the data.
The CEWO is responsible for the integrity of the dataset. Data users are responsible for the
wise and appropriate use of the data.
Standards and interoperability - Consistent adherence to data standards facilitates
linkages with related or complementary data and preserves the utility and comparability of
data through time.
Metadata - Accurate metadata accompanying each dataset provides contextual information
on where, who, how and why the data were collected and document known assumptions or
limitations to guide interpretation.
To help promote the collection of high quality data that is fit for purpose, an LTIM Data
Standards document is under development to outline the base requirements for monitoring
data and will be refined during the development of the Monitoring and Evaluation Plans. This
will include information about valid data ranges, lookup lists, schema for site naming and
other rules about data values. In addition, it will define the required fields (e.g. unique
identifier, foreign key relationships) that all data must have. The data standards document
will also identify the essential metadata fields that must be provided when data is submitted.
Data should be maintained in a central data repository that provides version control, data
security, metadata compilation, and automated quality control procedures to ensure
consistency and adherence to standards. The data repository will accommodate a variety of
file formats that are submitted electronically according to delivery schedules developed
during the design of the monitoring. Those undertaking the monitoring can approach their
data collection and management as they wish, with the requirement that data conforms to
the required data standards and is submitted on time. Once submitted, the data in the
repository becomes a source for use by the CEWO and stakeholders to meet Basin Plan
reporting obligations and for distribution to other data users.
Data is made available to users from the repository under a Creative Commons license1,
unless extenuating circumstances require restrictive access and licensing (e.g.
confidentiality, threatened species, use of protected information).
For each data set being collected, monitoring service providers must include:
quality assurance and quality control (QA/QC) procedures
data delivery schedules for electronic submission to the data repository
a nominated data custodian responsible for data delivery and QA/QC.
1 Creative Commons Attribution - 3.0 Australia http://creativecommons.org/licenses/by/3.0/au

73
3.3.5 Risk assessment and mitigation strategies
Risk associated with LTIM Project monitoring measuring progress towards the EWP
objectives should be considered in the monitoring design. Appropriate mitigation measures
to minimise these risks need to be identified and residual risk made explicit. Risks
associated with implementing the monitoring both to the environment and to service
providers should be documented in a Health, Safety and Environment Plan (HSEP) with Job
Safety Analysis (JSAs) completed for each activity.
Monitoring and evaluation service providers will be required to assess the potential risks
associated with the LTIM Project monitoring in each of the Selected Areas. The risks
identified will vary, and the risks assessments will need to account for external factors
specific to each Selected Area. Categories of risks that need to be assessed in all areas will
include, but will not be limited to:
1. risks that monitoring will not be able to be implemented, or will not meet project
objectives
2. risks to the environment and aquatic ecosystems as a result of monitoring activities
3. risks to the health and safety of consultants undertaking monitoring activities.
The risk assessment method must be consistent with the Australian/New Zealand Standard:
Risk Management (AS/NZS 4360:2004; Standards Australia and Standards New Zealand
2004) and the Standards Australia Handbook: Environmental risk management - principles
and process (HB 203-2000; Standards Australia and Standards New Zealand 2006). This
approach follows a structured and iterative process (Figure 24 and should use the likelihood,
consequence and risk categories provided (Table 8, Table 9 and Table 10).

74
Figure 24. Risk assessment method (adapted from AS/NZS 2004).
Table 8. Risk likelihood rating
Almost certain Is expected to occur in most circumstances
Likely Will probably occur in most circumstances
Possible Could occur at some time
Unlikely Not expected to occur
Rare May occur in exceptional circumstances only
Table 9. Risk consequence ratings.
Insignificant Minor Moderate Major Critical
Monitoring objectives
Monitoring according to design with data from all planned samples available.
Minor disruptions to the program with a small number of planned samples (<
Data from some watering areas or some events not collected / unavailable,
Data from more than 50% of planned samples not collected / available. Limited monitoring outcomes reported.
No useable data collected, analyses unable to be performed, no monitoring

75
Insignificant Minor Moderate Major Critical
10%) not collected or data not available.
sufficient for planned analyses.
outcomes reported.
Environment No environmental damage.
Minor instances of environmental damage that could be reversed.
Isolated but significant instances of environmental damage that might be reversed with intensive efforts.
Severe loss of environmental amenity and danger of continuing environmental damage.
Major widespread loss of environmental amenity and progressive, irrecoverable environmental damage.
Health and safety
Minor injury/illness, no formal medical treatment required.
Minor injury/illness, medical assistance required.
Moderate injury/illness, short term hospitalisation required.
Major injury/illness, emergency treatment/extensive hospitalisation required.
Fatality.
Table 10. Risk analysis matrix.
Likelihood Consequence
Insignificant Minor Moderate Major Critical
Almost certain Low Medium High Severe Severe
Likely Low Medium Medium High Severe
Possible Low Low Medium High Severe
Unlikely Low Low Low Medium High
Rare Low Low Low Medium High
As stated above, service providers will be required, as part of the detailed monitoring design
phase, to undertake a risk analysis identifying specific threats or conditions at the watering
area which may provide a risk to the successful implementation of the project. This will
include tailoring risk categories and risk consequence ratings and options for mitigation for
each Selected Area, and should be linked to the adaptive management process associated
with annual water planning.
Chapter 4. Evaluation, reporting and adaptive management
This LTIM Project generates information to be used for evaluation, reporting and adaptive
management. This chapter describes the way in which LTIM information will be utilised in
these processes with a heavy emphasis on the use of models to support predictions of the
expected outcomes in response to and in the absence of environmental flows. The chapter
then goes on to discuss some data requirements in order to ensure data will support model
development.

76
4.1 Evaluation
Evaluation is essential to identifying change, supporting adaptive management in a dynamic
system and supporting learning at an individual, community and institutional level (Bellamy
et al. 2001). To be effective, evaluation needs to follow a program logic that links objectives,
interventions and performance. Within this context, the LTIM will contribute to evaluation
through:
support the development of expected outcomes for watering actions that align with EWP
objectives
develop appropriate performance criteria (indicators)
develop experimental designs and sampling techniques to quantify responses and build
capacity
identify appropriate analytical techniques and develop models to support evaluation and
build capacity and identify progress.
In doing this, the LTIM faces a number of challenges, including:
Breadth of outcomes. The environmental water allocations are likely to influence a
diverse array of ecosystems, species, functions and water quality parameters, each of
which may interact with each other to shape system resilience.
Changing knowledge base. Considerable progress has been made in our
understanding of water-dependent ecosystems in the MDB and it is likely that our
knowledge will continue to improve during implementation of the Basin Plan. Improved
knowledge will influence our perception of the system thereby influencing the priority
indicators, methods or analytical techniques.
Changing climatic conditions. Australian water-dependent ecosystems are highly
variable and this variability will lead to changes in management priorities and challenges
in terms of the assessment of progress toward objectives. In addition, climate change
may lead to additional changes that may require revision of objectives, still further
complicating the evaluation process.
Changes in other pressures and threats. While the Basin Plan will address one of the
major pressures on the system (water resource development), other pressures and
stressors will either continue or change (e.g. land use and climate change). This will
result in complex outcomes for the system and further challenges in terms of evaluating
the effectiveness of environmental water management.
Identifying causality. Identification of causality is important, as a causal understanding
of system dynamics leads to more effective, efficient and targeted management of water
allocations. However, water-dependent ecosystems are characterised by context-
dependent behaviour and multiple interacting components, which often makes identifying
causal links difficult. Such complexity needs to be carefully factored into the design of
monitoring programs.

77
Scale of responses. Ecological responses to flow restoration will occur over a variety of
spatial and temporal scales (Figure 25). Only some of the response scales will align with
the evaluation processes undertaken by the CEWO. As a consequence, the full system
response to flow restoration will be difficult to quantify.
These challenges in no way reduce the need for, or value of, evaluation. There are a number
of ways that the LTIM Project will endeavour to overcome the challenges and ensure that the
effectiveness of Commonwealth environmental water is captured and supports ongoing
improvements in environmental water management. The first of these is to ensure there is a
clear and robust program logic underpinning the monitoring program. The need for program
logic has been acknowledged in the Basin Plan monitoring principles and adopted by the
CEWO (based on the scientific rationale for environmental watering outlined in Chapter 2).
The second is that the assumptions and hypotheses underlying decisions are considered.
Development of the Monitoring and Evaluation Plans will consider assumptions and explicitly
state hypotheses to be tested as part of the detailed design phase of the project. Finally, the
LTIM Project recognises the complex and nested nature of the MDB and has imbedded this
in the development of the logic document and associated CEDs.
In recognition of the complex and nested nature of the system, the CEWO will undertake the
evaluation process at multiple spatial and temporal scales (Figure 25). An effective Basin-
scale evaluation will require that smaller-scale evaluations complement the larger scale. The
use of the objectives hierarchy and CEDs that underpin the development of expected
outcomes provide a foundation for the alignment. The alignment will be a key consideration
in the development of the evaluation process which is one of the next steps after the design
of the LTIM.
At each scale, the process will be similar. The process will be;
what was expected
what actually happened?
If the outcome was as expected, then what were the key success factors in terms of:
our understanding of the system (cause-effect diagrams and models)
the design of the water allocation
the monitoring and analysis?
If the outcome did not meet or exceeded expectations, then what were the key lessons in
terms of:
our understanding of the system (cause-effect diagrams and models)
the design of the water allocation
the monitoring and analysis?

78
Figure 25. An illustration of the evaluations that will be undertaken by the CEWO. Light blue
boxes are evaluations based on single expected outcomes and dark blue boxes indicate
evaluations based on multiple expected outcomes.
At the selected area-scale (Figure 25), the outcomes of individual watering events will first
be evaluated against the less-than-1-year expected outcomes for that individual selected
area. This will be undertaken using LTIM data for those actions undertaken at one of the
seven selected areas and using modelled outputs for watering actions undertaken in other
parts of the Basin. Wherever possible, the outcomes of environmental flows will be
compared to data from both before the intervention and from units located within other
elements or zones within the selected area that have not received environmental water.
Over time, models will become increasingly important in the process to provide the
evaluation with a prediction of what would have happened in the absence of Commonwealth
environmental water in situations where no reference is available (e.g. large floods) or where
the CEWO water is only one part of the overall environmental flow.
Each individual watering event will also be evaluated across all expected outcomes in the
selected area. This will enable identification of possible inter-dependencies or trade-offs
among the possible outcomes that may be associated with intervention at the area-scale.
With respect to temporal scale, at the five-year scale, the observed five-year outcomes
within each objective will be evaluated against the five-year expected outcomes in the
selected area. Models will be particularly important in this process to provide a reference as
there will be limited access to before data and a high probability that appropriate reference
sites will also receive environmental water over the course of the five years. There will also
be an evaluation across all objectives in the selected area. This will enable identification of
area responses to the restored flow regime over the five-year period and any differential
responses among expected outcomes.

79
The five-year outcomes will also be evaluated across the seven selected areas to provide an
assessment of progress toward EWP objectives. The form of the evaluation will vary among
objectives but it will be affected by the way in which selected area outcomes influence Basin-
scale outcomes. This is described in more detail in the Reporting Section (4.2). The
aggregation of area outcomes to the Basin-scale (CEWO 2012) will:
Demonstrate the outcomes of the use of Commonwealth environmental water and how it
has contributed to achieving the environmental objectives of the environmental watering
plan (Section 114 of the Water Act and items 7 and 9 of Schedule 12 of the Basin Plan).
Support adaptive management and improvement in the management of Commonwealth
environmental water to meet ecological objectives.
Identify information gaps to help build new knowledge.
In addition to the challenges of spatial and temporal scale, we must face those presented by
changes in our understanding of the system, management processes and climate. In order
to respond to these changes, it is likely that refinement of monitoring activities will occur over
the long-term. The annual evaluation of outcomes of LTIM will inform decisions on
refinement and will need to be captured annually as part of the evaluation process.
It will be important for LTIM to be undertaken in a way that supports aggregation to the
Basin-scale. This will facilitate the aggregation of monitoring results to evaluate the
ecological outcomes and effectiveness of the Environmental watering plan that will be
undertaken by the MDBA.
4.2 Reporting
At the highest level, the reporting requirements for the LTIM will be to identify whether the
management of Commonwealth environmental water has made a contribution to the
protection of biodiversity, ecosystem function and resilience in the water dependent
ecosystems of the MDB. The CEWO has a number of reporting obligations under the Basin
Plan. Key amongst those is the obligation to report on the contribution of Commonwealth
environmental water to the objectives of the environmental watering plan. Outputs from the
LTIM project will contribute to meeting these reporting requirements. Assessing ecological
responses underpins the CEWOs capacity to meet its reporting requirements which include
(modified from COA 2012):
Annual reporting on the management of Commonwealth environmental water be
provided to the Commonwealth Water Minister, to be tabled in each House of Parliament
and given to relevant State Ministers for each of the Basin states (Section 114(1)). The
report must include information on achievements against the objectives of the Basin
Plan’s environmental watering plan (Section 114(2a)).
Reporting annually to the MDBA on the following matters:
o the extent to which local knowledge and solutions inform the implementation of the
Basin Plan (Basin Plan Schedule 12, item 6)

80
o the identification of environmental water and the monitoring of its use (Basin Plan
Schedule 12, item 9)
o the implementation of the environmental management framework (which includes the
Basin-wide environmental watering strategy, the development of Basin annual
environmental watering priorities and the principles to be applied to environmental
watering) (Basin Plan Schedule 12, item 10)
o the implementation of the water quality and salinity management plan, including the
extent to which regard is had to the objectives in Chapter 9 when making flow
management decisions (Basin Plan Schedule 12, item 14).
Reporting every five years to the MDBA on the achievement of environmental outcomes
at a Basin-scale, by reference to the targets to measure progress towards the
environmental objectives in Schedule 7 (Basin Plan Schedule 12, item 7).
The CEWO is committed to having a high level of transparency about its operations and this
is underpinned by statutory and non-statutory reporting arrangements.
Beyond statutory reporting obligations described in the preceding section, there will be
regular reporting of Commonwealth environmental water arrangements as part of broader
public service obligations of accountability and good governance. Service providers engaged
in the LTIM Project will be expected to contribute to this process. The CEWO will (modified
from CEWO 2012):
publish results from all monitoring and evaluation work that is commissioned
continue to produce an annual environmental water outcomes report, which will
summarise overall environmental outcomes at both the area and Basin-scales.
These reporting requirements provide the context for LTIM and guide its development to
ensure it is fit for purpose. One of the key areas for LTIM will be generating information on
the contribution of Commonwealth environmental water to achievement of EWP objectives
and the evaluation of outcomes at the Basin-scale. Towards this end, LTIM needs to identify
the contribution that selected area outcomes make to the achievement of Basin-scale
objectives. This will be achieved by classifying outcomes into one of five different categories
that then inform the way that selected area based or regional outcomes may report on one-
to-five-year outcomes at the Basin-scale.
1. Basin-scale responses – some animals and functions respond to flow regimes at the
Basin-scale and so local effects have an influence on environmental condition at the
Basin-scale. Waterbirds are an obvious example as they are known to disperse over
large distances to breed and forage. Nutrient and carbon transport is a function that may
be driven by local events but have large-scale influence. For example, flooding in the
upper reaches may lead to nutrients and carbon being transported long distances
downstream. For waterbird outcomes, any area based change in population condition or
diversity can be treated as a Basin-wide outcome. For water-quality outcomes, the
selected area outcomes will need to be integrated with downstream water quality
information from other programs.

81
2. Recruitment of potentially mobile species - some animals and plants are capable of
dispersing long distances. As a consequence, recruitment of these species at a local
scale may lead to population changes across a wide range. For example, golden perch
movements have been observed up to 1000 km. While less well understood, it is also
possible that plant propagules may disperse long distances. For fish outcomes, area
based recruitment information would be integrated with subsequent dispersal
information. For vegetation outcomes, the challenge is greater; however, some
information could be inferred from changes in the distribution and extent of vegetation,
but this will vary among selected areas.
3. Protecting/restoring local biodiversity - populations of rare and endangered species often
have limited distributions. This can mean that if a species is lost from an area, it may be
lost from the Basin which would result in a decline in biodiversity at the basin-scale. For
rare and endangered species outcomes, any area based change in population condition
or diversity can be treated as a Basin-wide outcome.
4. Ecosystem diversity - the Basin Plan includes reference to protecting or restoring
adequate and representative ecosystem types. The loss or degradation of an ecosystem
type within a selected area may mean that there are no longer adequate and
representative examples of this ecosystem type in the MDB. Completion of the
ecosystem classification project will enable interpretation of the protection or restoration
of ecosystems within a selected area in a Basin-scale context.
5. Basin-wide responses - some objectives refer to biota or functions that are widespread
throughout the Basin. Reporting on the influence of Commonwealth environmental water
requires aggregating local responses to provide an assessment of their response across
the whole MDB. An example would be river red gum condition as they are widespread
across the Basin, but the influence of environmental flows is localised. Reporting on
Basin-wide responses will require integration of information from all selected areas and
where available other data sources such as the MDBA remote sensing data on
vegetation condition. In these instances, a standard method will be recommended that
enables aggregation of monitoring from all seven selected areas and the extrapolation of
outcomes to other areas in the Basin.
4.3 Adaptive Management
The Australian Government MERI Framework describes MERI as:
‘a continuous cycle of participation and communication rather than as a single evaluation
event. MERI promotes learning and adaptive management in response to progressive
monitoring and evaluation which enables improvement in program design and achievement
of desired outcomes’ (Commonwealth of Australia 2009).
Implicit within this is the idea that MERI leads to changes in program direction or
arrangements based on monitoring results and outcomes. In recognition of this, the Basin
Plan has developed nine MERI principles that the CEWO has incorporated into its MERI
Framework. Two of these principles relate to adaptive management, specifically (CEWO
2012):
82
Principle 2: Monitoring and evaluation should be undertaken within the conceptual
framework of program logic. The program logic approach guides adaptive management of
watering activities to better meet the ecological objectives of the Basin Plan.
Principle 4: Monitoring and evaluation findings, including in respect of progress towards
meeting objectives and trends in condition and availability of the Basin water resources,
should enable decision-makers to use adaptive management.
The CEWO MERI Framework recognises that adaptive management is critical to the
achievement of EWP objectives and continual improvement in the management of
Commonwealth environmental water (CEWO 2012). The framework indicates that the
improvement process will be based on evaluation of the ecological outcomes from the use of
water and will include:
mechanisms for incorporating new knowledge into decision making
selection of management activities that are specifically designed to test hypotheses
through ecosystem-scale experiments. The LTIM is based on testing the hypotheses that
underpin the development of the expected outcomes. The LTIM is designed to enable
monitoring of most of the possible watering experiments that are currently envisaged. If,
through time, improved understanding of the system supports undertaking an ecosystem
scale experiment that would not be appropriately monitored by the existing
arrangements, then there is provision through the evaluation and improvement steps to
refine the monitoring to ensure an adequate test can be undertaken.
Specifically, improvement will result in refinement of:
future watering actions, including decisions on whether to water, prioritisation of watering
actions and the design of watering events (e.g. timing, delivery or volume)
annual and five-year portfolio management plans
the Basin Plan (to be undertaken by the MDBA through reviews including under Section
50 of the Act).
The focus of LTIM is the ecological response to Commonwealth environmental water at the
Basin- and selected area-scales. LTIM Project
In light of these principles and commitments, the LTIM Project will develop to deliver
information that can be used to develop predictive models. The models will provide a
mechanism for integrating new knowledge and applying that knowledge to decision making
in line with the principles of adaptive management. The models will inform management and
planning decisions and thereby improve capacity to achieve EWP objectives.
4.3.1 General principles
Adaptive management is a way of dealing with uncertainty in the management of complex
systems and learning from experience to improve environmental outcomes as part of an
iterative process (McDaniels et al. 1999). Effective adaptive management requires defined
targets, intervention monitoring and the capacity to assimilate new information in a way that
influences both our understanding of the system and future decisions (Meredith and Beesley

83
2009). Models that improve managers’ capacity to predict the outcomes of different
decisions facilitate adaptive management and increase the value of information generated
by intervention monitoring.
An adaptive management approach is often advocated for flow management (Stanford et al.
1996; Poff et al. 2003; Poff et al. 2010; Richter and Thomas 2007), but capturing new
information and applying it effectively and transparently to future decisions remains a
significant challenge (McDaniels et al. 1999; Hillman and Brierley 2002; Richter and Thomas
2007). Meeting this challenge requires a commitment across the entire institution in order to
ensure that there are processes in place to generate, communicate, assimilate and apply
new knowledge to improve monitoring, evaluation, understanding of the system being
managed and future interventions. Most of these institutional challenges are beyond the
scope of the LTIM Project. The LTIM objective is to ensure that processes are established to
generate and assimilate intervention monitoring information and that this information is
converted to a form that can be applied to future decisions. Section 3 described the
approach to information generation, the data management component of the project will
address the data assimilation while this section on adaptive management will address the
process to ensure that new monitoring information is capable of being assimilated and
applied to evaluation and improvement.
4.3.2 Models
Planning, prioritisation, implementation and evaluation all rely on predictions of the outcomes
of management actions. Predictions rely on mathematical models and the strength of the
adaptive management approach is that management decisions are used as opportunities to
improve models and ultimately future decisions. Models are also a powerful way of explicitly
describing the system and the incorporation of new information represents an effective way
to synthesise and apply knowledge derived from intervention monitoring to water allocation
decisions. Models can accept new information about the response of individual system
components and then bring those pieces of information together so that we may understand
and forecast whole-of-system responses to water allocation decisions, whether the ‘system’
is a population, community or ecosystem.
While many elements of the CEWO approach to adaptive management are still in
development, the LTIM Project can still ensure that it generates information about key
environmental relationships and models that can then be incorporated into communication,
evaluation and decision making processes as they are developed. An example is
development of the systematic conservation planning decision support tool that is capable of
accepting a wide range of ecological response relationships and integrating them to inform
watering decisions. The LTIM Project will identify key relationships and support the
development of models. A key consideration in this process is alignment between the
decisions and evaluations to be supported, the models that will be developed, the
relationships on which they are based and the data collected. The decisions to be supported
exist within a hierarchy, with Basin Plan decisions setting the context for water planning
decisions over one- and five-year timeframes, which in turn set the context for delivery
decisions. The form of the models required to support these decisions will reflect the
decision hierarchy. The evaluations to be supported are described in Section 4.1.

84
At the Basin-scale, the model used to identify the Sustainable Diversion Limit (SDL) in the
Basin Plan was based on the water requirements of open wetlands, red gum and black box
condition and waterbird reproduction applied at a suite of key environmental assets. There
are several ways that the MDBA’s capacity to predict the outcomes of different SDL could be
improved over the next ten years. These, in order of difficulty, are:
improve the current species’-based water requirement models
develop new species’ water requirement models
develop new models of the response of ecosystem functions, resilience and water quality
to flow
develop ecosystem flow requirement models
develop Basin-scale biodiversity, ecosystem function, resilience models.
The MDBA will need to determine which of these options it wants to pursue, but it is
important to consider these options in the development of LTIM to ensure that, where
appropriate, LTIM information facilitates their refinement or development. The improvement
of existing and the development of new species’ water requirement models will be
undertaken as part of the LTIM adaptive management process. It is also expected that LTIM
information could make a significant contribution to the development of new models that
describe the relationship between flow events and species, ecosystem function and
resilience that could be applied to SDL decisions in a similar manner to the species models
used in the current Basin Plan. The development of ecosystem flow requirement models and
Basin-scale models may also include LTIM data, but it is likely that ecosystem models will
require a mix of both long-term intervention monitoring and condition assessment data while
Basin-scale models would be heavily reliant on condition assessment data.
At the next level in the decision hierarchy, five-year planning decisions will be supported
through access to models that predict the likely outcomes from sequences of flow events.
There are three types of models that may be developed. The first are population models for
species that are either of significant value (e.g. endangered or charismatic species) or are
believed to be good indicators of the broader ecological response. Population models rely on
the development of information on rates of fecundity, survivorship and mortality within the
population and in the case of LTIM, how these vary in response to flow. The models are
often probabilistic which means that the outputs are expressed as a range of potential
outcomes and the models estimate the likelihood of the outcome and the associated
uncertainty around that likelihood.
The second model type would be simple ecosystem models that would seek to capture not
only the influence of flow on specific populations but also the response of multispecies
communities to flow. Although useful, single-species models provide a very limited picture of
how freshwater systems respond to management and may in fact heavily bias both our
assessment of outcomes and watering decisions in the future. Multi-species models provide
a more holistic approach to adaptive management of flows; one that enables us to better
incorporate both costs and benefits associated with planning decisions. To date, this type of
model has not been attempted in freshwater systems in Australia; however, implementation

85
of the Basin Plan has created a demand and the LTIM monitoring will provide an opportunity
to attempt the development of these types of models.
Finally, some adjustments in the physical environment occur over these time-scales, such as
shifting groundwater levels and some adjustments in channel morphology. Models of these
hydro-geomorphic responses may be developed and refined based on monitoring at the five-
year time scale.
For annual planning and delivery decisions it is useful to consider that the ecological
outcomes of individual environmental watering events emerge from the interaction between
the characteristics of the flow event, the asset type and the current condition of the asset
(Figure 26). From a planning perspective the condition of the system and its response to
watering decisions (including deferring watering) will be significant considerations in planning
annual allocations. If, for instance, species are in poor condition and likely to suffer
irrecoverable decline in the absence of an environmental flow, meeting their water
requirements becomes a high priority. Ecosystem type is also an important input to planning
decisions in terms of both achieving ecosystem diversity objectives and optimising outcomes
for nominated species.
.
Figure 26. An illustration of the high level influences on the ecological outcome from an
environmental flow, specifically flow characteristics, asset condition and asset type.
From a delivery perspective, it is important to understand the influence of flow characteristics
such as the timing, duration, depth and frequency of flow events on ecological outcomes.
The type of ecosystem into which the water is delivered will also have a significant influence
due to the different habitat and connectivity requirements of different species.
Annual planning and delivery decisions will be supported through the development of
statistical models of the relationship between flow, casual factors and outcomes (asset
characteristics in Figure 26) expected to occur within twelve months of the environmental
flow.
4.3.3 Data requirements
In order to facilitate the incorporation of LTIM data into models it will be important to identify
the model data requirements prior to the collection of data. In nearly every instance, model
refinement or development will require the integration of data from multiple events across

86
multiple areas. In order to achieve this it is critical that standard methods are used across
the seven selected areas. The following sections give a very brief overview of some of the
data requirements to ensure data informs models.
4.3.3.1 Data labelling
One of the requirements is that there is a standard site labelling protocol for all data
collected. This ensures that sites are named consistently and that the spatial scale of the
data is explicit in the data label. For the LTIM we suggest a four level hierarchy with area
being the entire selected area, zone being a portion of the area comprised of river, wetland
and floodplain elements. Each element would be comprised of a number of units which
would correspond to a single ANAE classification type and have a unique identifier.
4.3.3.2 Flow events
Flow events and flow conditions at the time of sampling will also need to be captured in a
consistent form to enable comparison among events and sites. The flow characteristics will
need to be described in both absolute terms (e.g. megalitres/day) and relative terms (e.g. %
change and return interval).
4.3.3.3 Experimental design
Sound experimental design is essential for both the estimation of parameters for predictive
models and for making defensible inferences concerning flow impacts, in general. The
design considerations will be similar to those considered in Section 3.3: The ecosystem type
and availability of reference sites. For a number of reasons, control or reference sites are
often not available. This is most often the case in rivers where even the differences between
rivers in adjacent catchments can prevent their being used as suitable reference sites. Even
in situations where control or reference systems appear to be available, such as wetlands,
the diversity among wetlands may preclude their use as reference sites. In these instances,
the use of unreplicated designs may be the only solution; however, it is important to be clear
about the scale of inference (Hargrove and Pickering 1992, Stewart-Oaten, Bence et al.
1992, Stewart-Oaten and Bence 2001). If control or reference sites are available,
consideration will still need to be given to the advantages and disadvantages associated with
expanding the number of wetlands studied (Carpenter 1990, Oksanen 2001, Stewart-Oaten
and Bence 2001, Johnson 2002).
When estimating the parameters of a predictive model, ‘intervention analysis’ targeting
particular parameters may be appropriate, and time-series’ of responses are of paramount
importance because the analysis relies on a comparison of a series of samples prior to and
then after the intervention (Box and Tiao 1975, Carpenter 1990, Stewart-Oaten and Bence
2001).
There are numerous other factors that will shape the experimental design and associated
analyses (e.g. Walters and Holling 1990, Osenberg, Schmitt et al. 1994, Mapstone 1995), All
of these factors and associated modelling will need to be refined in the next phase of the
development of LTIM. This process will be complicated by the need to design a sampling
program that meets the needs of both short-term reporting and modelling requirements.

87
4.3.5 Effects
Development of models to inform annual decisions requires information on the influence of
environmental flows on effect indicators. Ideally, data should be collected on the state of the
indicator prior to the environmental flow and then at time intervals during and/or after the
flow. The duration of the time intervals will be informed by our conceptual understanding of
the ecological response to the planned flow. When the monitoring objective is to report an
outcome, it is necessary to have both reference or control sites to evaluate whether there
has been a response (Section 3.3.1). For the adaptive management component of the LTIM,
the model will be derived from multiple events across the seven selected areas that occur
along a gradient of the relevant cause indicator.
Development of five-year models will require monitoring of the state of the effect indicator
over the five-year period. This monitoring will occur at a specific time of year. Due to the
longer timeframes involved, model development will be more reliant on comparisons among
zones within areas and comparisons among areas. In years where there is no environmental
flow applied, this annual monitoring will contribute to our understanding of both levels of
variability within the system and system responses in the absence of environmental flows,
providing a temporal reference for the watering effects. For indicators that vary over
relatively short time frames (e.g. macroinvertebrates, some species of life history stages of
fish) it may be desirable to include two sampling events in years where there is no
environmental allocation.
As noted in Section 4.3.2, the type of models that will be used to inform revision of the SDL
will be identified by the MDBA.
In each case, LTIM data may make a contribution to these models:
Improve the current species’ based water requirement models. The annual response to
flow event data could be used to improve the open wetland, red gum, black box and
waterbird breeding models.
Develop new species’ water requirement models. LTIM annual response to flow event
data will enable the development of a number of new species models.
Develop new models of the response of ecosystem functions, resilience and water
quality to flow. LTIM annual response to flow event data will enable the development of a
number of new ecosystem function and resilience models.
Develop ecosystem flow requirement models. The monitoring of multiple biotic
components, ecosystem functions and resilience over several years may enable the
development of ecosystem models that include interdependencies among species and
ecosystem functions.
Develop Basin-scale biodiversity, ecosystem function, resilience models. The LTIM
information will provide information on the response of the seven selected areas to flow
restoration. This information, in conjunction with other large-scale data could contribute
to the development of Basin-scale models.
88
Chapter 5. Conclusion Monitoring, evaluation, reporting and improvement are critical for supporting the efficient and
effective use of Commonwealth environmental water, and demonstrating the achievement of
environmental objectives. The LTIM Project will represent a significant part of the CEWO
commitment to good governance and adaptive management in the implementation of the
Basin Plan.
This Logic and Rationale document is an important step in the implementation of LTIM
providing a means of promoting a number of the MERI principles. First among these is that
the Logic and Rationale document provides a conceptual framework and program logic for
LTIM Project. The document also provides a focus for the application of best available
scientific knowledge to the development and implementation of LTIM. By clearly articulating
LTIM needs and direction, the document also supports the development of collaborative
relationships between state and Commonwealth governments.
In developing clear links between objectives, decisions and monitoring, the Logic and
Rational document supports the effective implementation of adaptive management. The
document, takes this one further step by identifying a process for capturing information
generated by the LTIM and applying it in order to improve future decision. Ensuring that the
LTIM is fit for purpose is one of the means by which this document helps ensure that LTIM is
cost-effective, consistent and supplies the information needed for evaluation. The document
has also included consideration of timeliness, efficiency, cost-effectiveness, consistency in
the LTIM structure and in the selection of indicators.
The Logic and Rationale document is, however, a high level, generic document designed to
guide development of the LTIM. It is almost certain that the application of information
contained in the document to specific circumstances should only be undertaken with
consideration of the context and appropriate modification of the logic, advice and
information. For example, the CEDs describe in broad terms the relationship between flow,
a suite of causal factors and an effect relating to an objective. This does not mean that all
flows will influence all of the causal factors or the nominated effect. Rather, the CED is
designed to guide the process of developing intervention monitoring that will comply with the
principles outlined in the CEWO MERI Framework (2012).
The development of the Logic and Rationale document is one step in the development of the
processes the CEWO need to undertake initiated by the development of the MERI
Framework. The Logic and Rationale document provides a foundation for the development
of specific Monitoring and Evaluation Requirements documents and Monitoring and
Evaluation plans for each of the selected areas. The development of the selected area
Monitoring and Evaluation Plans will influence the overall program logic and it is therefore
anticipated that the Logic and Rationale document will be modified as the selected area
Monitoring and Evaluation plans are refined. The major areas of refinement are likely to be
in the areas of the CEDs, standard methods for indicators, experimental design, analysis
and models to support adaptive management.
The Logic and Rationale document is not the only input to the development of the selected
area Monitoring and Evaluation Plans. A plan is also being developed to manage data to
ensure it is reliable and accessible for reporting and modelling activities. The development

89
of the data management plan will have consequences for Quality Assurance and Quality
Control procedures that will influence the way in which monitoring is undertaken and this
may, in some instances lead to refinement of this document.
Overall, the Logic and Rationale document is part of the adaptive management process and
should therefore be treated as an evolving document. Over time, the institutional context
within which the CEWO operates will change and this may require changes to the logic and
rationale. More certain is that with developments in our knowledge, generated by LTIM,
other monitoring programs and research, that the indicators, sampling designs, analytical
methods, CEDs and associated descriptions and objectives hierarchy may all be modified to
reflect our improved understanding.
A measure of the success of this document will be the extent to which it evolves and
continues to inform the implementation of LTIM over at least the next five years.
90
References ANZECC and ARMCANZ (2000) Australian Guidelines for Water Quality Monitoring and
Reporting, Canberra.
Baldwin D S, Nielsen D L, Bowen P M and Williams J (2005) Recommended methods for
monitoring floodplains and wetlands. Murray–Darling Basin Commission, Canberra.
Beard G R, Scot, W A and Adamson J K (1999) The value of consistent methodology in long
term environmental monitoring. Environmental Monitoring and Assessment 54: 239–258.
Beesley, L., et al. (2010). Watering floodplain wetlands in the Murray-Darling Basin for native
fish. Waterlines Series. Canberra, ACT, National Water Commission.
Beesley L, Price A, King A, Gawne B, Nielsen, D, Koehn J, Meredith S, Vilizzi, L and Hladyz
S (2011) Watering floodplain wetlands in the Murray–Darling Basin for native fish. Waterlines
report, National Water Commission, Canberra.
Bellamy J A, Walker D H, McDonald G T and Syme G J (2001) A systems approach to the
evaluation of natural resource management initiatives. Journal of Environmental
Management, 63: 407-423.
Box G E P and Tiao G C (1975) "Intervention analysis with applications to economic and
environmental problems." Journal of the American Statistical Association 70: 70-79.
Brandis K, Kingsford R, Ren S, Ramp D (2011) Crisis water management and Ibis breeding
at Narran Lakes in arid Australia. Environmental Management 48:489-498.
Bunn S E, Abal E G, Smith MJ, Choy S C, Fellows C S, Harch B D, Kennard M J and
Sheldon F (2010) Integration of science and monitoring of river ecosystem health to guide
investments in catchment protection and rehabilitation. Freshwater Biology, 55: 223–240.
Butcher R (2003) Developing a long-term environmental fixed sites monitoring program for
Melbourne Water. Report prepared for Melbourne Water.
Carpenter S R (1990) "Large-scale perturbations: Opportunities for innovation." Ecology
71(6): 2038-2043.
CEWO (2011) A Framework for Determining Commonwealth Environmental Water Use,
Commonwealth Environmental Water, Canberra.
CEWO (2012) Commonwealth Environmental Water - Monitoring, Evaluation, Reporting and
Improvement Framework v2.0, Commonwealth Environmental Water, Canberra.
Chee Y E, Webb J A, Stewardson M and Cottingham P (2006) Victorian environmental flows
monitoring and assessment program: Monitoring and evaluation of environmental flow
releases in the Broken River. Report prepared for the Goulburn Broken Catchment

91
Management Authority and the Department of Sustainability and Environment by eWater
Cooperative Research Centre, Canberra.
Chessman B and Jones H (2001) Integrated Monitoring of Environmental Flows: Design
Report. New South Wales Department of Land and Water Conservation, NSW Government,
Parramatta.
Clarke, K R & Green, R H (1988) Statistical design and analysis for a 'biological effects'
study. Marine Ecology Progress Series, 46, 213–226.
Commonwealth of Australia (2009) NRM MERI Framework: Australian Government natural
resource management monitoring, evaluation, reporting and improvement framework p 40.
Commonwealth of Australia (2012) Murray Darling Basin Plan, Federal Register of
Legislative Instruments F2012L02240.
Cottingham P, Quinn G, King A, Norris R, Chessman B and Marshall C (2005a)
Environmental flows monitoring and assessment framework. CRC for Freshwater Ecology,
Canberra.
Cottingham P, Stewardson M and Webb A (2005b) Victorian Environmental Flows
Monitoring and Assessment Program: Stage 1 Statewide framework. CRC Freshwater
Ecology and CRC Catchment Hydrology report to the Department of Sustainability and
Environment.
Cottingham P, Brooks S, Butcher, R and Hale J (2012) Murray-Darling Basin aquatic
ecosystem classification: Stage 1 report. Peter Cottingham and Associates report to the
Department of Sustainability, Environment, Water, Population and Communities, Canberra.
Cunningham S, Mac Nally R, Griffioen P, White M (2009) Mapping the Condition of River
Red Gum and Black Box Stands in The Living Murray Icon Sites. A Milestone Report to the
Murray-Darling Basin Authority as part of Contract MD1114. Murray-Darling Basin Authority,
Canberra. p 54.
Dale V H and Beyeler S C (2001) Challenges in the development and use of ecological
indicators, Ecological Indicators, 1: 3–10.
Donnelly A, Jones M, O’Mahony T and Byrne G (2007) Selecting environmental indicator for
use in strategic environmental assessment, Environmental Impact Assessment Review, 27:
161–175.
Downes B J, Barmuta, L A, Fairweather P G, Faith D P, Keough M J, Lake P S, Mapstone B
D and Quinn G P (2002) Monitoring Ecological Impacts: Concepts and Practice in Flowing
Waters. Cambridge University Press, Cambridge.
Eberhardt L L and Thomas J M (1991) Designing environmental field studies. Ecological
Monographs 61(1): 53-73.
Gawne B (2012) Resilience Knowledge Requirements to support implementation of the
Basin Plan: Outcomes of an MDBA workshop. Wodonga, Vic, Murray-Darling Freshwater
Research Centre: 9.

92
Gelman A, Rubin J B, Stern H S and Rubin D B (2004) Bayesian Data Analysis. Chapman
and Hall/CRC, Boca Raton, Florida.
Glazebrook H, Robertson A (1999) The effect of flooding and flood timing on leaf litter
breakdown rates and nutrient dynamics in a river red gum (Eucalypytus camaldulensis)
forest. Australian Journal of Ecology 24:625-635.
Gross J E (2003) Developing Conceptual Models for Monitoring Programs. National Park
Service US Department of the Interior. Available from URL:
http://science.nature.nps.gov/im/monitor/docs/Conceptual_Modelling.pdf.
Hargrove W W and Pickering J (1992). Pseudoreplication: A sine qua non for regional
ecology. Landscape Ecology 6(4): 251-258.
Hillman M and Brierley G (2002) Information needs for environmental-flow allocation: A case
study from the Lachlan River, New South Wales, Australia. Annals of the Association of
American Geographers 92: 617-30.
Humphries P, King AJ, Koehn JD (1999) Fish, flows and floodplains: link between freshwater
fishes and their environment in the Murray Darling River system, Australia. Environmental
Biology of Fishes 56:129-151.
Jackson DA, Peres-Neto P R and Olden J D (2001) What controls who is where in
freshwater fish communities - the roles of biotic, abiotic, and spatial factors. Canadian
Journal of Fisheries and Aquatic Sciences, 58, 157-170.
Johnson D H (2002) The importance of replication in wildlife research. Journal of Wildlife
Management 66(4): 919-932.
Kelso W and Rutherford D (1996) Collection, Preservation, and Identification of Fish Eggs
and Larvae. In: Murphy B, Willis D (eds) Fisheries Techniques, 2 edn.
King A, Brooks J, Quinn G, Sharpe A and McKay S (2003) Monitoring Programs for
Environmental Flows in Australia — A Literature Review. Department of Sustainability and
Environment, Sinclair Knight Merz and the CRC Freshwater Ecology.
Kingsford R T, Biggs H C, Pollard S R (2011) Strategic adaptive management in freshwater
protected areas and their rivers. Biological Conservation, 144(4): 1194-1203.
Kingsford R and Thomas R (2004) Destruction of wetlands and waterbird populations by
dams and irrigation on the Murrumbidgee River in arid Australia. Environmental
Management 34:383-396.
Lindenmayer D B, Likens G E, Haywood A and Miezis L (2011) Adaptive monitoring in the
real world: proof of concept. Trends in Ecology and Evolution, 26: 641-666.
Mapstone B D (1995). Scalable decision rules for environmental impact studies: effect size,
Type I and Type II errors. Ecological Applications 5(2): 401-410.

93
McDaniels T L, Gregory R S and Fields D (1999) Democratizing risk management:
Successful public involvement in local water management decisions. Risk Analysis 19: 497-
510.
MDBA (2011) The proposed “environmentally sustainable level of take” for surface water of
the Murray-Darling Basin: Methods and outcomes, MDBA publication no: 226/11, Murray-
Darling Basin Authority, Canberra.
MDFRC (2012) Evaluation of the ecological benefits of Commonwealth environmental water
in the southern basin. Draft Report prepared for the Commonwealth Environmental Water
Office by The Murray-Darling Freshwater Research Centre, Albury.
MDFRC (in prep) IECA Framework Victorian Icon Sites ‘Proof of concept’ Trial, Scoping
Report, December 2012. Report to Department of Sustainability, Environment, Water,
Population and Communities, Canberra.
Meredith S and Beesley L (2009) Watering floodplain wetlands in the Murray-Darling Basin
to benefit fish: a discussion with managers. Arthur Rylah Institute, Heidelberg, Vic.
Neal J, Adelsberger C, Lochman S (2012) A Comparison of Larval Fish Sampling Methods
for Tropical Streams. Marine and Coastal Fisheries 4:23-29
Nielsen D, Watson G, Petrie R (2005) Microfaunal communities in three lowland rivers under
differing flow regimes. Hydrobiologia 543:101-111 doi: 10.1007/s10750-004-6946-9
Niemeijer D, and de Groot R S (2008) A conceptual framework for selecting environmental
indicator sets, Ecological Indicators, 8: 14–25.
Noss R F (1990) Indicators for monitoring biodiversity: a hierarchical approach. Conservation
biology, 4(4), 355-364.
Oksanen L (2001) Logic of experiments in ecology: is pseudoreplication a pseudoissue?
Oikos 94(1): 27-38.
Osenberg C W, Russell J, Schmitt S J, Holbrook K E A and Flegal A R (1994) Detection of
environmental impacts: natural variability, effect size, and power analysis. Ecological
Applications 4, no. 1 (1994): 16-30.
Poff N L, Allan J D, Palmer M A, Hart D D, Richter B D, Arthington A H, Rogers KH, Meyers
J L, and Stanford J A (2003) Fiver flows and water wars: emerging science for environmental
decision making. Frontiers in Ecology and the Environment, 1: 298-306.
Poff N L, Richter B D, Arthington A H, Bunn S E, Naiman R J, Kendy E, Acreman M, Apse C,
Bledsoe BP, Freeman M C, Henriksen J, Jacobson R B, Kennen J G, Merritt D M, O'keeffe,
J H, Olden J D, Rogers K, Tharme RE and Warner A (2010) The ecological limits of
hydrologic alteration (ELOHA): a new framework for developing regional environmental flow
standards. Freshwater Biology, 55, 147-170.
Quinn G P and Keough MJ (2002) Experimental design and data analysis for biologists.
Cambridge University Press, Cambridge.

94
Richter B D and Thomas G A (2007) Restoring environmental flows by modifying dam
operations. Ecology and Society 1212.
Reid J, Kingsford R, Jaensch R (2009) Waterbird Surveys in the Channel Country Floodplain
Wetlands, Autumn 2009. Report by Australian National University, Canberra, University of
New South Wales, Sydney, and Wetlands International, Oceania, Brisbane, for the
Australian Government Department of Environment, Water, Heritage and the Arts
Roe J and Georges A (2008) Terrestrial activity, movements and spatial ecology of an
Australian freshwater turtle, Chelodina longicollis, in a temporally dynamic wetland system.
Austral Ecology 33:1045-1056 doi: 10.1111/j.1442-9993.2008.01877.x
Rose P, Metzeling L and Catzikiris S (2008) Can macroinvertebrate rapid bioassessment
methods be used to assess river health during drought in south eastern australian streams?
Freshwater Biology 53, 2626-2638.
Sheldon F, Peterson EE, Boone EL, Sippel S, Bunn SE, Harch BD (2012) Identifying the
spatial scale of land use that most strongly influences overall river ecosystem health score.
Ecological Applications 22:2188-2203.
Sims N, Colloff M and Guerschman J P (2009) Basin-scale vegetation (Chapter 12). In:
Overton, I.C., Colloff, M.J., Doody, T.M., Henderson, B. and Cuddy, S.M. (eds). Ecological
Outcomes of Flow Regimes in the Murray-Darling Basin. Report prepared for the National
Water Commission by CSIRO Water for a Healthy Country Flagship, CSIRO.
Stanford J A, Ward J V, Liss W J, Frissell C A, Williams R N, Lichatowich J A, and Coutant
CC (1996) A general protocol for restoration of regulated rivers. Regulated Rivers: Research
and Management, 12: 391-413.
Stewart-Oaten A and Bence J R (2001) Temporal and spatial variation in environmental
impact assessment. Ecological Monographs 71(2): 305-339.
Stewart-Oaten A, Bence J R, Osenberg C W (1992) Assessing effects of unreplicated
perturbations: no simple solutions. Ecology 73(4): 1396-1404.
Tan L and Shiel RJ (1993) Responses of billabong rotifer communities to inundation.
Hydrobiologia 255/256:361-369.
Vilizzi L, Meredith S, Sharpe CP, Rehwinkle R (2008) Evaluating light trap efficiency by
application of mesh to prevent inter- and intra-specific in situ predation on fish larvae and
juveniles. FISHERIES RESEARCH 93: 146-153 Fisheries Research 93:146-153.
Walters C J and Holling C S (1990) LARGE-SCALE MANAGEMENT EXPERIMENTS AND
LEARNING BY DOING. Ecology 71(6): 2060-2068.
Wassens S, Hall A, Osborne W, Watts RJ (2010) Habitat characteristics predict occupancy
patterns of the endangered amphibian Litoria raniformis in flow-regulated flood plain
wetlands. Austral Ecology 35:944-955 doi: 10.1111/j.1442-9993.2010.02106.x
Water Act (2007) Commonwealth of Australia, Canberra.

95
Webb J A, Stewardson M J, Koster W M (2010) Detecting ecological responses to flow
variation using Bayesian hierarchical models. Freshwater Biology 55:108-126.
Young R and Huryn A (1996) Interannual variation in discharge controls ecosystem
metabolism along a grassland river continuum. Canadian Journal of Fisheries and Aquatic
Sciences 53:2199-2211.
96
Appendix A: Basin Plan more specific Level 2 objectives.
1. Biodiversity: ‘To protect and restore water-dependent ecosystems of the Murray-
Darling Basin’ (Part 2, 8.05, (1), (2), & (3))
To protect and restore a subset of all water-dependent ecosystems by ensuring that:
o Declared Ramsar wetlands that depend on Basin water resources maintain
their ecological character (see paragraph 21(3)(c) of the Act); and
o Water-dependent ecosystems that depend on Basin water resources and
support the life cycles of species listed under the Bonn Convention, CAMBA,
JAMBA or ROKAMBA continue to support those species; and
o Water-dependent ecosystems are able to support episodically high ecological
productivity and its ecological dispersal.
To protect and restore biodiversity that is dependent on Basin water resources by
ensuring that:
o Water-dependent ecosystems that support the life cycles of a listed
threatened species or listed threatened ecological community, or species
treated as threatened or endangered (however described) in State law, are
protected and, if necessary, restored so that they continue to support those
life cycles; and
o Representative populations and communities of native biota are protected
and, if necessary, restored.
2. Function: ‘To protect and restore the ecosystem functions of water-dependent
ecosystems’ (Part 2, 8.06, (1), (2), (3, (4), (5), (6) & (7)).
That the water quality of Basin water resources does not adversely affect water-
dependent ecosystems and is consistent with the water quality and salinity
management plan.
To protect and restore connectivity within and between water-dependent
ecosystems, including by ensuring that:
o The diversity and dynamics of geomorphic structures, habitats, species and
genes are protected and restored; and
o Ecological processes dependent on hydrologic connectivity:
longitudinally along watercourses; and

97
laterally between watercourse and their floodplains (and associated
wetlands); and
vertically between the surface and subsurface; and
are protected and restored; and
o The Murray Mouth remains open at frequencies, and for durations, sufficient
to ensure that the tidal exchanges maintain the Coorong’s water quality (in
particular salinity levels) within the tolerance of the Coorong ecosystem’s
resilience (Note: This is to ensure that water quality is maintained at a level that
does not compromise the ecosystem and that hydrologic connectivity is restored and
maintained); and
o The levels of the Lower Lakes are managed to ensure sufficient discharge to
the Coorong and Murray Mouth and help prevent river bank collapse and
acidification of wetlands below Lock 1, and to avoid acidification and allow
connection between Lakes Alexandrina and Albert, by:
maintaining levels above 0.4 metres Australian Height Datum for 95%
of the time, as far as practicable; and
maintaining levels above 0.0 metres Australian Height Datum all of the
time; and
o Barriers to the passage of biological resources (including biota, carbon and
nutrients) through the Murray-Darling Basin are overcome or mitigated.
Natural in-stream and floodplain processes that shape landforms are protected and
restored.
Habitat diversity for biota is supported at a range of scales (including, for example,
the Murray-Darling Basin, riverine landscape, river reach and asset class).
Protect and restore ecosystem functions of water-dependent ecosystems that
maintain populations (for example recruitment, regeneration, dispersal, immigration
and emigration) including that:
o Flow sequences and inundation and recession events meet ecological
requirements (for example, cues for migration, germination and breeding);
and
o Habitat diversity, extent, condition and connectivity that supports the life
cycles of biota of water-dependent ecosystems (for example, habitats that
protect juveniles from predation) is maintained.
To protect and restore ecological community structure, species interactions and food
webs that sustain water-dependent ecosystems, including by protecting and restoring
energy, carbon and nutrient dynamics, primary production and respiration.

98
3. Resilience: ‘To ensure that water-dependent ecosystems are resilient to climate
change and other risks and threats’ (Part 2, 8.07, (1), (2), (3, (4), (5) & (6)).
That water-dependent ecosystems are resilient to climate change, climate variability
and disturbances (for example drought and fire).
To protect refugia in order to support the long term survival and resilience of water-
dependent populations of native flora and fauna, including during drought to allow for
subsequent re-colonisation beyond the refugia.
To provide wetting and drying cycles and inundation intervals that do not exceed the
tolerance of ecosystem resilience or the threshold of irreversible change.
To mitigate human-induced threats (for example, the impact of alien species, water
management activities and degraded water quality).
To minimise habitat fragmentation.
4. Water Quality: ‘To ensure water quality is sufficient to achieve the above objectives
for water-dependent ecosystems; and for Ramsar wetlands, sufficient to maintain
ecological character’ (Part 3, 9.04, (1) & (2)).
Water quality must be sufficient to maintain the ecological character of Ramsar
wetlands.
For those wetlands other than declared Ramsar wetlands, the quality of the water
must be sufficient to:
o To protect and restore ecosystems; and
o To protect and restore the ecosystem function; and
o To ensure that the ecosystems are resilience to climate change and other
risks and threats.

99
Appendix B: Broad Indicators Table B1. Biodiversity objectives Level 2 and 3, and associated CEDs and broad indicators.
Level 2
Objective
Level 3 Objective CED Indicators
Ecosystem
diversity
Landscape ecosystem
diversity
Ecosystem type using ANAE
classification or suitable alternative
Individual ecosystem’s extent
Within ecosystem diversity Species number and abundance
Species diversity Vegetation Diversity Landscape vegetation
diversity
species number and abundance
Population Vegetation condition and
reproduction
Individual condition (mean and
variance)
Population structure
Abundance
Vegetation reproduction (e.g.
flowering)

100
Level 2
Objective
Level 3 Objective CED Indicators
Vegetation recruitment and
extent
Recruitment
Germination
Seedling recruitment
Population structure
Vegetation distribution
Vegetation extent
Contiguousness of long-lived
vegetation
Macroinvertebrates Within ecosystem
macroinvertebrate diversity
Species number and abundance
Fish Diversity Landscape fish diversity Species number and abundance
Microinvertebrate abundance
Population
condition
Fish condition Individual condition
Abundance
Fish population structure
Fish reproduction Egg and larval abundance

101
Level 2
Objective
Level 3 Objective CED Indicators
Individual abundance
Change in gonad condition
Fish larval growth and
survival
Juvenile abundance
Size-frequency
Spawning dates
Rate and timing of growth
Waterbirds Diversity Landscape waterbird
diversity
Species number and abundance
Population Waterbird survival and
condition
Waterbird survival
Changes in abundance over time
Waterbird reproduction Nest, eggs, chicks and species
abundance
Population structure
Waterbird recruitment and
fledging
Fledgling abundance
Other vertebrates Population Other vertebrate condition
(individual)
Length: weight ratio
Size-distribution
Other vertebrate Egg numbers

102
Level 2
Objective
Level 3 Objective CED Indicators
reproduction Tadpole abundance
Juvenile abundance
Other vertebrate growth and
survival
Growth and survival of nominated
species
Frog and tadpole abundance
Turtle size distribution over time
Population structure
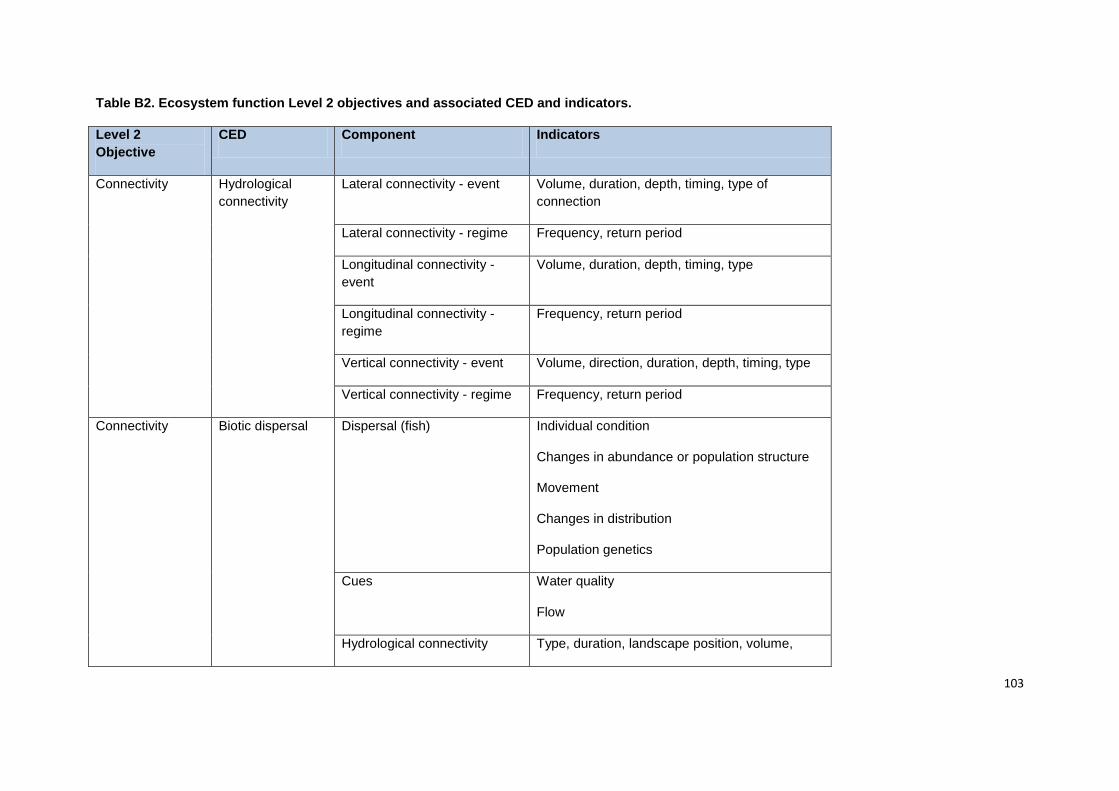
103
Table B2. Ecosystem function Level 2 objectives and associated CED and indicators.
Level 2
Objective
CED Component Indicators
Connectivity Hydrological
connectivity
Lateral connectivity - event Volume, duration, depth, timing, type of
connection
Lateral connectivity - regime Frequency, return period
Longitudinal connectivity -
event
Volume, duration, depth, timing, type
Longitudinal connectivity -
regime
Frequency, return period
Vertical connectivity - event Volume, direction, duration, depth, timing, type
Vertical connectivity - regime Frequency, return period
Connectivity Biotic dispersal Dispersal (fish)
Individual condition
Changes in abundance or population structure
Movement
Changes in distribution
Population genetics
Cues Water quality
Flow
Hydrological connectivity Type, duration, landscape position, volume,

104
Level 2
Objective
CED Component Indicators
depth, timing, type of connection
Vegetation
recruitment and
extent
Dispersal Movement
Abundance
Changes in distribution and population structure
Connectivity Sediment
transport
Suspended sediment Suspended sediment
Geomorphology
Bed load Bed load sediment
Sediment deposition or
erosion
Changes in morphology
Changes in sediment character
Ecosystem
process
Primary
productivity
Aquatic phase Aquatic metabolism
Biomass accumulation
Terrestrial phase Vegetation Production
Biomass accumulation
NDVI
Remote Sensing
Ecosystem Decomposition Aquatic phase Aquatic metabolism

105
Level 2
Objective
CED Component Indicators
process Biomass loss
Terrestrial phase Microbial production
Biomass loss
Ecosystem
process
Nutrient and
carbon cycling
Changes in nutrient concentration or speciation
Total nitrogen, total phosphorus, NOx, filtered
reactive phosphorus, DOC.

106
Table B3. Resilience Level 2 objectives and associated CED and indicators.
Level 2 Objective CED Category Indicators
Ecosystem resilience Landscape refugia Refuges Distribution
Abundance
Population condition Individual and population
condition
Population structure
Abundance
Distribution
Connectivity Ecosystem connectivity
Landscape position
Dispersal
Population resilience Refugia Population condition Individual condition
Population structure
Changes in distribution and
abundance through time

107
Habitat Species dependent but may
include:
Geomorphology
Water quality
Vegetation
Connectivity Dispersal
Landscape position
Flow
Population resilience Resistance Population condition Individual and population
condition
Abundance
Population structure
Habitat Species dependent but may
include:
Geomorphology
Water quality
Vegetation
Connectivity Flow
Landscape position
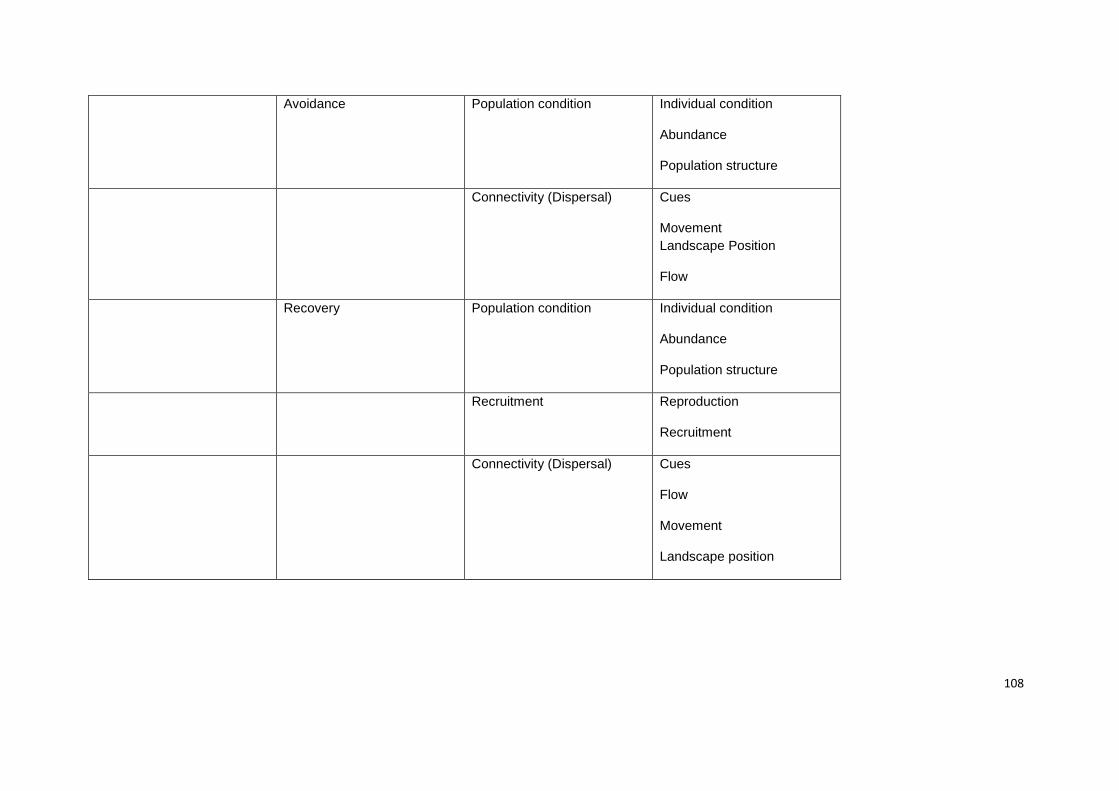
108
Avoidance Population condition Individual condition
Abundance
Population structure
Connectivity (Dispersal) Cues
Movement
Landscape Position
Flow
Recovery Population condition Individual condition
Abundance
Population structure
Recruitment Reproduction
Recruitment
Connectivity (Dispersal) Cues
Flow
Movement
Landscape position

109
Table B4. Water quality objectives Level 2 and associated CED and indicators.
Objective Level 2 CED Component Indicators
Chemical Salinity Water Salt concentration or loads
Ionic composition
Sediment Salt concentration
Ionic composition
pH pH
Buffering capacity
Dissolved oxygen (DO) Dissolved oxygen
Dissolved organic carbon
(DOC)
DOC concentration
DOC bioavailability
Biological Algal blooms Cyanobacterial species and
abundance
Turbidity