long term instability of high priority incident response · long term instability of high priority...
TRANSCRIPT

1
Long term instability of
high priority incident response
Johannes Wiik, Ph.D. Fellow
Prof. José J. Gonzalez
Agder University College
Faculty of Engineering and Science
Grimstad, Norway
Dr. Klaus-Peter Kossakowski
Carnegie Mellon University
Software Engineering Institute
Frankfurt, Germany
2
Overview
1. Context and problem
2. Research approach
3. Simulation model structure
4. Management strategies
5. Conclusion
2
3
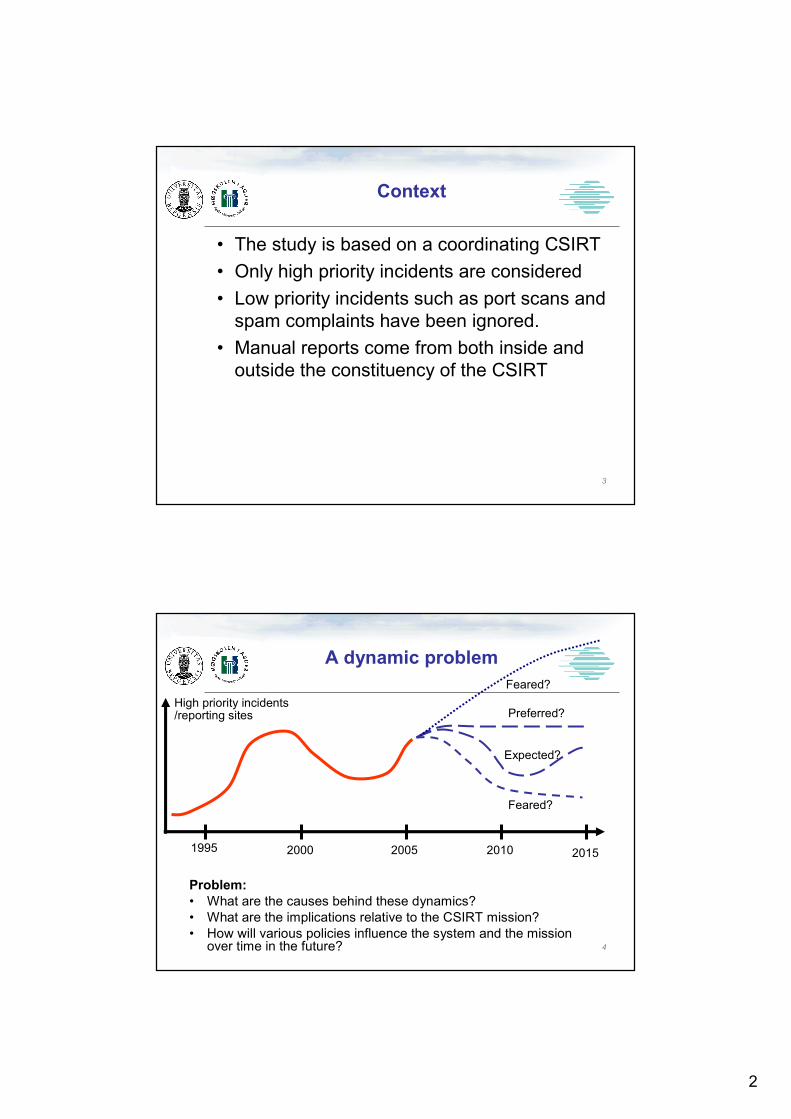
Context
• The study is based on a coordinating CSIRT
• Only high priority incidents are considered
• Low priority incidents such as port scans and
spam complaints have been ignored.
• Manual reports come from both inside and
outside the constituency of the CSIRT
4
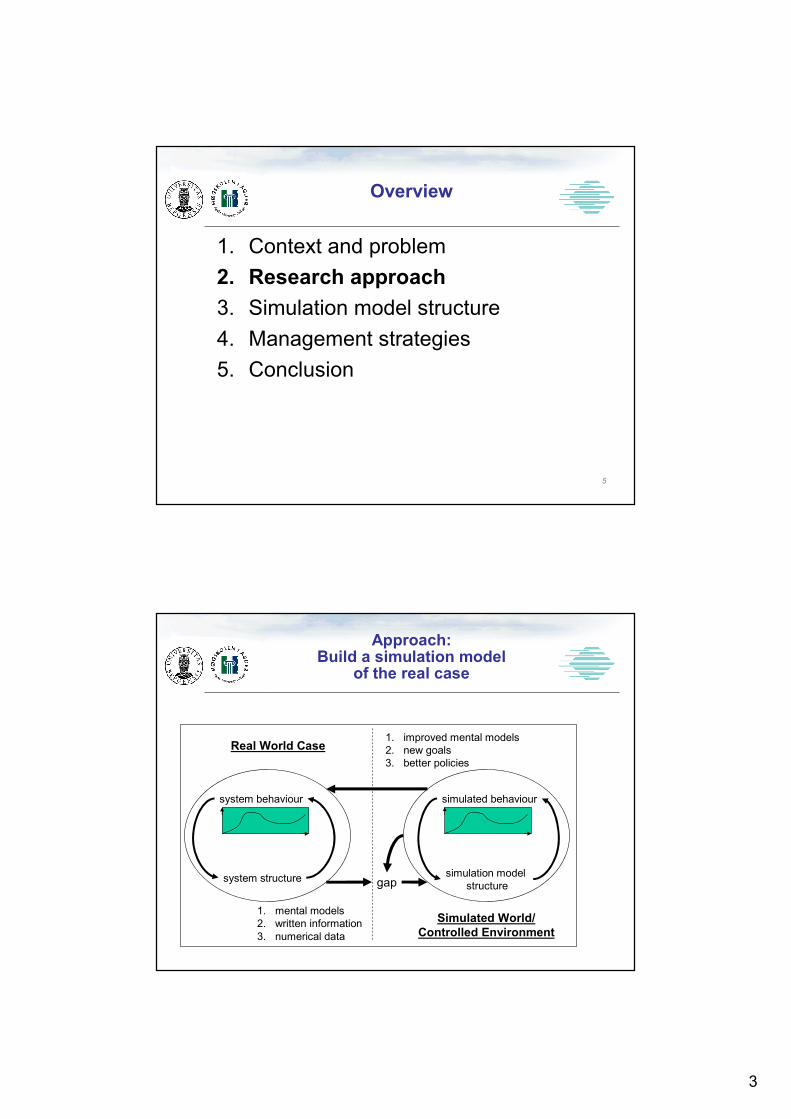
A dynamic problem
Problem:
• What are the causes behind these dynamics?
• What are the implications relative to the CSIRT mission?
• How will various policies influence the system and the mission over time in the future?
1995 2000 2005 20152010
Preferred?
Expected?
Feared?
Feared?
High priority incidents/reporting sites
3
5
Overview
1. Context and problem
2. Research approach
3. Simulation model structure
4. Management strategies
5. Conclusion
1. mental models
2. written information
3. numerical data
1. improved mental models
2. new goals
3. better policies
gap
Real World Case
Simulated World/
Controlled Environment
system behaviour
system structure
simulated behaviour
simulation model
structure
Approach: Build a simulation model
of the real case

4
7
Overview
1. Context and problem
2. Research approach
3. Simulation model structure
4. Management strategies
5. Conclusion
8
Feedback
loop
delay
mark
Quick intro to
system dynamics concepts
stock
flow
Feedback
loop
5
9
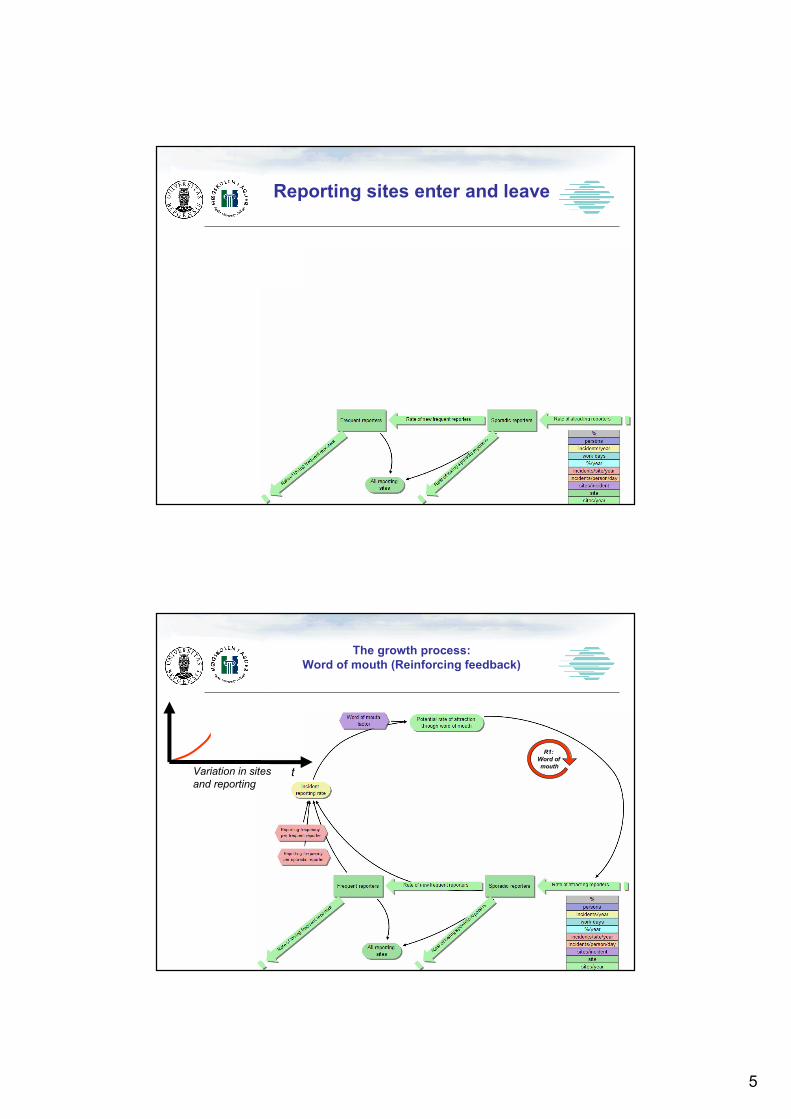
Reporting sites enter and leave
10
The growth process:
Word of mouth (Reinforcing feedback)
tVariation in sites
and reporting
R1:
Word of
mouth

6
11
Limits to growth:
Capacity, quality of service and turnover
(Balancing feedback)
tVariation in sites
and reporting
R1:
Word of
mouth
B5:
2nd hand service
quality
B4: 1st hand
service
quality
12
Decline:
Site turnover starts to dominate (balancing feedback)
tVariation in sites
and reporting
R1:
Word of
mouth
B5:
2nd hand service
quality
B1:
Building trustB3:
Turnover
frequent
reporters
B4: 1st hand
service
quality
B2:
Turnover
sporadic
reporters

7
13
Overshoot, undershoot and oscillations:
Changes in reporting sites and perception of quality
(Delays)
tVariation in sites
and reporting
R1:
Word of
mouth
B5:
2nd hand service
quality
B1:
Building trustB3:
Turnover
frequent
reporters
B4: 1st hand
service
quality
B2:
Turnover
sporadic
reporters
14
Overview
1. Context and problem
2. Research approach
3. Simulation model structure
4. Management strategies
5. Conclusion

8
15
Base case 1993-2015
Behaviour generated from the structure:
S-shaped growth (or decline) followed by damped oscillations
Note:
This is a replication
of behaviour patterns
only.
The exact numbers
are not comparable
to historical data.
Note:
This is a replication
of behaviour patterns
only.
The exact numbers
are not comparable
to historical data.
16
Base case continued:Perceived versus actual quality of service
Notice:
• Perceived quality is smoother and delayed compared to the actual quality
• Important to understand overshoot and oscillations

9
17
A new goal:
Stable balance
workload/
reporting
workforce/
capacity
Variation in sites
and reportingVariation in sites
and reporting
Historical behaviour Desired behaviour
18
What-if 1:
We double the staff
R1:
Word of
mouth
B5:
2nd hand service
quality
B1:
Building trustB3:
Turnover
frequent
reporters
B4: 1st hand
service
quality
B2:
Turnover
sporadic
reporters
10
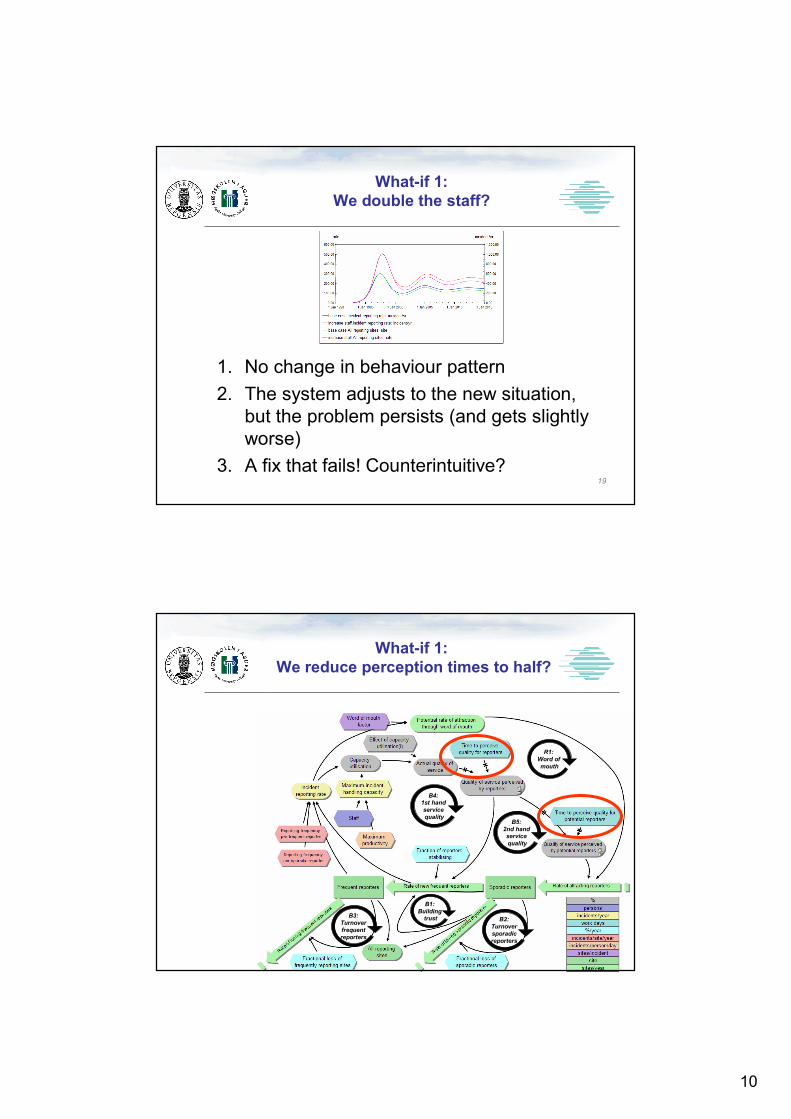
19
What-if 1:
We double the staff?
1. No change in behaviour pattern
2. The system adjusts to the new situation,
but the problem persists (and gets slightly
worse)
3. A fix that fails! Counterintuitive?
20
What-if 1:
We reduce perception times to half?
R1:
Word of
mouth
B5:
2nd hand service
quality
B1:
Building trustB3:
Turnover
frequent
reporters
B4: 1st hand
service
quality
B2:
Turnover
sporadic
reporters
11
21
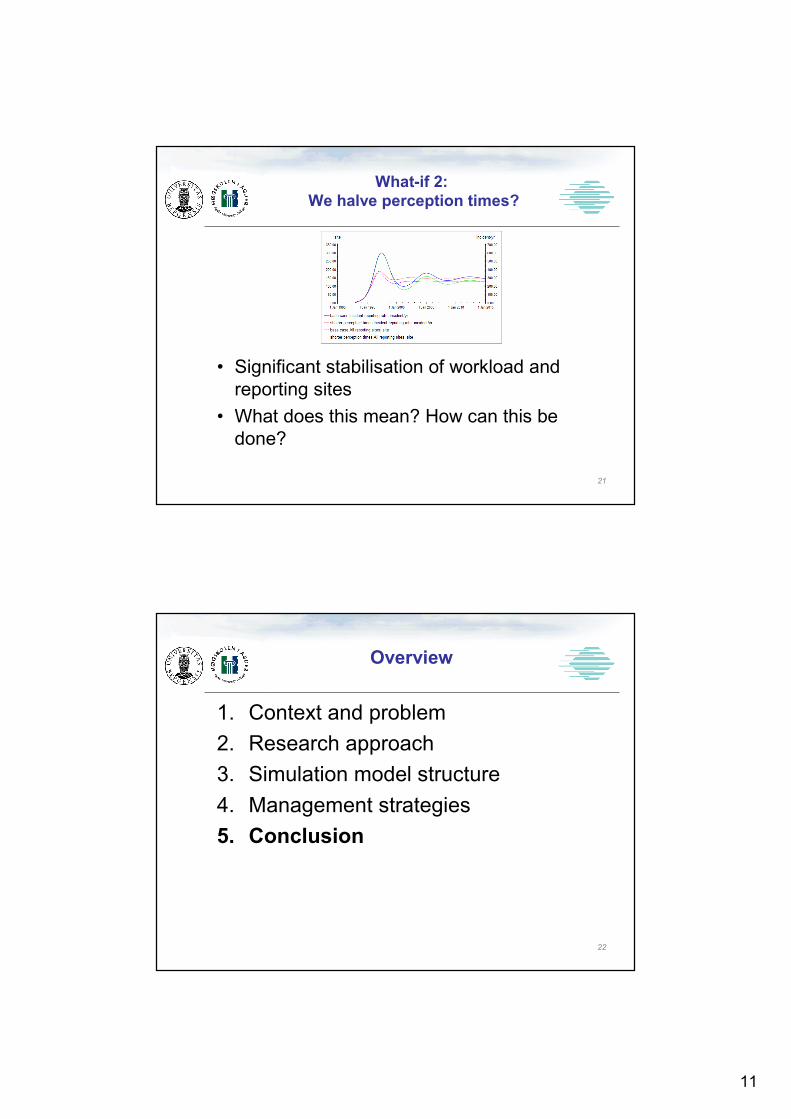
What-if 2:
We halve perception times?
• Significant stabilisation of workload and
reporting sites
• What does this mean? How can this be
done?
22
Overview
1. Context and problem
2. Research approach
3. Simulation model structure
4. Management strategies
5. Conclusion

12
23
Conclusion
• The oscillations are primarily caused by long time delays related to customer quality perception and changes to the number of reporting sites
• Goal: Stability (sufficient service to sufficiently many)
• Adding more resources does not solve the problem – rather makes it worse
• Reducing perception times for QoS has a dramatic effect on stabilisation.
• Future challenge: How can we implement this insight in practise?
24
A historical perspective:
Building up your Constituency
• In even the oldest presentations on CSIRTs
the importance of building up your
constituency was highlighted
• Direct impacts were not known – beside
funding – before
• Calling for more staff and resources might
still be necessary, but not for this reason
• Define the right service level, get resources
right and then communicate, communicate,
communicate, ...