long-term growth as a sequence of exponential modes
TRANSCRIPT

Long-Term Growth As A
Sequence of Exponential Modes
Robin Hanson ∗
Department of Economics
George Mason University†
December, 2000
First Version September 1998
Abstract
A world product time series covering two million years is well fit by either a sum of four
exponentials, or a constant elasticity of substitution (CES) combination of three exponential
growth modes: “hunting,” “farming,” and “industry.” The CES parameters suggest that farming
substituted for hunting, while industry complemented farming, making the industrial revolution
a smoother transition. Each mode grew world product by a factor of a few hundred, and grew
a hundred times faster than its predecessor. This weakly suggests that within the next century
a new mode might appear with a doubling time measured in days, not years.
JEL Categories: O00, N10
Keywords: Long World Growth Industrial Revolution
∗For their comments, I thank Curt Adams, Bryan Caplan, Joel Cohen, Roger Congleton, Tyler Cowen, Mark Crain,Eirikur Hallgrimsson, Carl Feynman, Hal Finney, Brad De Long, Perrin Meyer, Carlos Ramirez, John Schroeter,Didier Sornette, Hal Varian, and participants of the GMU economics Brown Bag talk series and the SEA 2000Annual Meeting.
†[email protected] http://hanson.gmu.edu 704-993-2326 FAX: 704-993-2323 MSN 1D3, Carow Hall, Fairfax VA22030
1

Introduction
Many have argued that current U.S. stock prices are much higher than can be justified by reasonable
profit forecasts based on empirical models derived from the recorded history of the U.S. economy
(Shiller, 2000). While it might be theoretically possible for the economy to suddenly switch to a
fundamentally new mode with much higher corporate profits, our experience with the U.S. economy
offers little evidence that a mode switch of this magnitude has happened anytime in the last century
or so (Barro & Sala-i-Martin, 1995), though we may be able to understand smaller changes in stock
prices in terms of milder fluctuations in profit trends (Barsky & De Long, 1993).
The arguments against high current U.S. stock prices are thus largely empirical, in contrast
with the theoretical nature of the (typically informal) arguments offered in support of investor
optimism. These empirical arguments, however, are based primarily on the last century or so of
economic experience. Could empirical forecasts based on a longer term history of economic growth
offer more support for the rationality of high stock prices? To address this question, this paper
will take an empirical approach to modeling very long term data on economic growth, with an eye
toward inferring the chances for very large changes in economic growth modes.
In order to empirically model very long term economic history, we need one or more very long
term time series, and we need to choose one or more functional forms to use in modeling those time
series.
Most attempts to formally model long term human history have focused on population time
series, as population estimates have been offered going back many thousands of years, and such
time series have been considered to be the most reliable long term series available. Also, for
most of human history population seems to have reasonably reflected most fundamental changes,
including areas colonized, capital accumulated, and technologies adopted. This seems to be because
new productive abilities have mainly resulted in larger populations under Malthusian conditions of
near-subsistence per capita consumption.
Nearly constant per capita consumption, however, implies that reasonable estimates of total
2

consumption can be obtained from reasonable estimates of population. We thus have reasonable
estimates of world product up until about 1500, when per capita product began to rise. Economic
historians have also provided us with reasonable estimates for world product over the past century
or so (Maddison, 1995). So all that has stood in the way of a full long term world product time
series was to fill in the gap from roughly 1500 to 1850.
Recently economic historian Brad De Long has cleverly used a simple empirical Malthusian
relation to fill this gap, and has thus created a world product time series ranging from one million
B.C. to today (De Long, 1998). His estimates for before 10,000 B.C., however, are based on forty
year old speculations (Deevey, 1960). This paper will therefore replace those old speculations with
recent published estimates going back to two million B.C. (Hawks, Hunley, Lee, & Wolpoff, 2000).
This paper will then attempt to empirically model that time series with a few simple functional
forms. After considering models of gradually accelerating growth, which have been the most popular
in formal models of long term population growth, we will turn to attempting to formalize the more
common informal descriptions of history as a sequence of growth modes. And since exponential
growth is the most common formal description of short term growth, we will consider modeling
long term world product history as a sequence of exponential growth modes.
The simplest sequence of exponentials is a sum of exponentials, and we will find that a sum
of four exponential modes fits the data with less than a 2% average error, which is less than the
average uncertainty in the estimates. One of these modes, however, appears to be there just to allow
a more gradual transition between two other modes than a simple sum of exponentials will allow.
So we will then try a constant elasticity of substitution (CES) form for combining exponentials,
which can allow a transition to be smooth or sudden by varying a single parameter. We will find
that a CES combination of three exponential modes also fits the data with less than a 2% average
error.
After describing these models, and discussing their interpretation, we will then use them to
consider when we might see a transition to yet another mode of economic growth, and how fast
growth might then be. It seems quite unreasonable to expect an infinite series of faster and faster
3
growth modes, since that leads to an infinite world product in finite time. But it may be reasonable
to wonder if a world that has so far seen at least three distinct growth modes might see yet one
more growth mode.
The Data
Economic historians have reasonable estimates for world product over the last century or so, while
other historians have reasonable estimates for world population over the last ten thousand years,
and cruder estimates for the two million years before that. Until a few centuries ago, per-capita
consumption was typically near subsistence levels, making it easy to infer world product from world
population. Thus the obstacle to having a full long term world product time series has been to get
reasonable estimates for the intermediate period, from roughly 1500 to 1850.
Recently, economic historian Brad De Long found a simple linear relation between world pop-
ulation growth rates and per capita product, a relation which seems valid at the low values of
per capita product observed from roughly 1850 to 1950 (De Long, 1998). This linear relation has
allowed him to created world product estimates for the missing intermediate period, and thus to
create a world product time series ranging from one million B.C. to today.
De Long developed several time series based on alternative assumptions, and this paper uses his
preferred world product series. The only change made here is to substitute more recent estimates for
population prior to 10,000 B.C. De Long continued the use by Kremer (Kremer, 1993) of population
estimates from McEvedy and Jones (McEvedy & Jones, 1978) going back to 10 thousand B.C., and
of three population estimates from Deevey (Deevey, 1960) for 25 thousand B.C., 300 thousand B.C.
and one million B.C.
Deevey’s estimates, however, were never published in a peer-reviewed journal, cite no other
sources, and are now forty years old. The data set used here excises Deevey’s forty year old estimates
and instead substitutes two more recent population estimates. Hawks and coauthors (Hawks et al.,
2000) estimate a “population bottleneck” of about ten thousand at about two million B.C., and
4
that we “cannot reject exponential growth from” then until ten thousand B.C. Consistent with
that conclusion, they also accept a Weiss (Weiss, 1984) population estimate of about half a million
between one million B.C. and 500 thousand B.C., which I’ve coded as at 750 thousand B.C.1
The resulting world product time series has 54 data points, is graphed in Figure 1, and is
listed in the appendix. In Figure 1, world product is described in units of an equivalent number of
humans at a subsistence consumption level.2 Time is described by the number of years before the
somewhat arbitrary date of 2050. This data is also graphed later in Figure 2, which shows world
product growth rates versus levels, displaying each step between data points as a horizontal line.
This graph looks noisier, because growth rates are noisier, but it has the virtue of avoiding the
arbitrary choice of a reference date like 2050.3
Choosing a Functional Form
What functional form should we use to model our world product time series? Simple exponential
growth is probably the most popular general model for describing positive quantities that grow in
time by many orders of magnitude, as both population and world product have. It is, for example,
widely used to model the last half century of economic growth (Barro & Sala-i-Martin, 1995) and
1These estimates are based on a “multi-regional” model of human evolution (Relethford, 1998). An alternative“out of Africa” model posits a similar population bottleneck at roughly 200 thousand B.C. (Rogers & Jorde, 1995;Ingman, Kaessmann, Paabo, & Gyllensten, 2000). The multi-regional model is based more heavily on non-geneticfossil evidence. Genetic evidence may well estimate the number of our direct ancestors alive on a given date, but non-genetic fossils seem better estimates of the size of the economy or ecological niche occupied by our direct ancestors andtheir very close relatives on that date. Further footnotes will, however, mention how the alternative model changesthis paper’s estimates.
2Specifically, “subsistence” is $80 1990 “International” dollars, which is the ratio of De Long’s preferred worldproduct and population estimates for one million B.C. This per capita product has been assigned to my substitutedates of two million B.C. and 750 thousand B.C., and retained De Long’s estimates for all other dates.
3In the analysis which follows, we will occasionally compare world product growth since two million B.C. to theearlier exponential growth of maximum brain size. Maximum animal mass and relative brain size have both grownroughly exponentially since the Cambrian explosion about 550 million years ago, when animals first appeared in largenumbers in the fossil record. The mass of the currently largest animal doubled roughly every 70 million years, whilemaximum brain volume relative to body volume (raised to the 2/3 power) has doubled roughly every 50 million years(Russell, 1983). (More details on the details of brain size history are given by Jerison (Jerison, 1991).) Togetherthese estimates suggest that maximum animal brain size has doubled roughly every 34 million years over the last 550million years (for a total of about 16 doublings). For comparison, the exponential decay rate of Marine genera overthis period was a half-life of about 23 million years (Valen, 1973; Newman & Sibani, 1999).
5

the last few centuries of growth in scientific literature (de Solla Price, 1963). Simple variations on
exponential growth, such as linear trends in growth rates, have been particularly popular in making
short term population forecasts (Lee, 1990), but seem clearly inadequate for longer term forecasts.
Variations on logistic growth have also long been popular in estimating various population trends
(Meyer & Ausubel, 1999), but also seem clearly inadequate for modeling very long term population
trends (Cohen, 1995).
Many researchers have had more empirical success explicitly modeling long term population
histories with functions that describe accelerating change. The first such efforts used simple hyper-
bolics (von Foerster, Mora, & Amiot, 1960), and soon became infamous warnings against taking
one’s model too literally, since they predicted an infinite human population in the early twenty first
century.
More recent related efforts (Kremer, 1993; Kapitza, 1996; Johansen & Sornette, 2000) have all
included corrections which could describe a recent or upcoming slowdown and other complexities,
mostly to allow growth to today be approaching fundamental limits, and hence a final end to
accelerating growth.
Some authors have also informally summarized world history as continually accelerating change,
but the more common informal summary is of human history as a sequence of specific growth modes.
History has, for example, been described as the slow expansion of hunter-gatherers, followed by
faster growth following the domestication of plants and animals, followed by even faster growth
with commerce, science, and industry (Cipolla, 1967).
Simple exponential growth is a very common model for describing particular historical periods.
It is, for example, widely used to model the last half century of world economic growth (Barro &
Sala-i-Martin, 1995). Since historical periods tend to be described as exponential growth, formal
models of transitions between periods tend to be models of transitions between exponential growth
asymptotes. Many have modeled the industrial revolution this way (Marvin Goodfriend, 1995;
Hansen & Prescott, 1998; Jones, 1999; Steinmann, Prskawetz, & Feichtinger, 1998; Galor & Weil,
2000; Lucas, 2000). At least one earlier transition, to cities, has also been modeled this way
6

(Marvin Goodfriend, 1995). And possible current or upcoming transitions, such as due to computers
or the internet, have also been modeled this way (Helpman, 1998).
Given all this, it seems natural to formally model the long term history of humanity as a sequence
of exponential growth modes. Yet to my knowledge no one has done this. Some authors seem to
have come close, by drawing exponential curves suggestively next to data on log-log graphs of
population growth (Deevey, 1960; Kates, 1996; Livi-Bacci, 1997). (Some of these authors, however,
do not seem to have realized that it could be simple exponentials they were drawing, and instead
of “exponential growth followed by a period of approximate stability” (Kates, 1996).)
One author did more explicitly consider and reject a sum of exponentials model for world
population history, though without any explicit model fitting or test (Cohen, 1995). (Another
author considered a sum of two exponentials, one of which was decreasing (Lee, 1988).) In this
paper we thus take on the neglected task of more formally modeling long term human history as a
sequence of exponential growth modes. In particular, we consider such a model of world product
history.
Once we have chosen to model history as a sequence of exponential modes, there still remains the
question of how we should mathematically model transitions between exponential growth modes.
We will first try a simple sum of exponentials, and then try to replace this sum with a CES (constant
elasticity of substitution) form. Such a form allows each transition to be sudden or gradual,
depending on a single free parameter per transition. We will end up with a model describing the
three classic economic growth modes, which we might call hunting, farming, and industry.
A Sum of Exponentials Model
Apparently, no one has yet tried to formally model long-term growth as a sequence of exponentially
growing modes. This paper thus attempts to do so for world product. One very simple model of a
sequence of growth modes is a sum of exponentials, which for n modes we will write as Y (t) = Yn(t),
where Y0(t) = 0, and for i from 1 to n,
7

Yi(t) = Yi−1(t) + Mi(t),
Mi(t) = ci 2t/τi .
The parameter τi is the doubling time of mode i. If data consists of pairs (tj , Yj), a min-square-error
of logs method searches for model parameters of a function Y (t) that minimize
∑
j
(log(Y (tj))− log(Yj))2.
Applying this method to my data, the best fit sum of four exponential terms gives an eyeball-
pleasing fit, and a (root mean square) average percentage error of 1.8%. This is about the same
magnitude as the smallest uncertainty or “indifference range” attributed to the population estimates
that this data is based in part on, which is about 2% (McEvedy & Jones, 1978).
Figure 1 compares this model with the data, and indicates that the main errors seem to be due
to unmodeled fluctuations with a period of roughly 500-1500 years. Figure 1 also shows the best
fit hyperbolic model,4
Y (t) = c(T − t)−α,
which has a power of α = 1.46, goes to infinity at T = 2004, and has a much inferior average
percentage error of 9.6%. (Using three terms instead of four in the sum of exponentials model also
gives a visibly much worse fit.)
For each term, Table 1 lists a mode description, doubling time5, the factor by which the doubling
4The best fit “log-periodic model,” of the form Y (t) = c(T − t)−α(1+ b cos(ω ln(T − t)+φ)) (Johansen & Sornette,2000), has a power of α = 1.48, goes to infinity at T = 2005, and has an average percentage error of 7.4%.
5Under the “out of Africa” theory, the hunting mode began ten times more recently, at 200 thousand B.C.Substituting this estimate for the two multi-regional estimates would reduce the hunting doubling time, increase thehunting doubling time factor, and reduce the farming doubling time factor, all by a factor of ten. All other entrieswould remain unchanged.
8
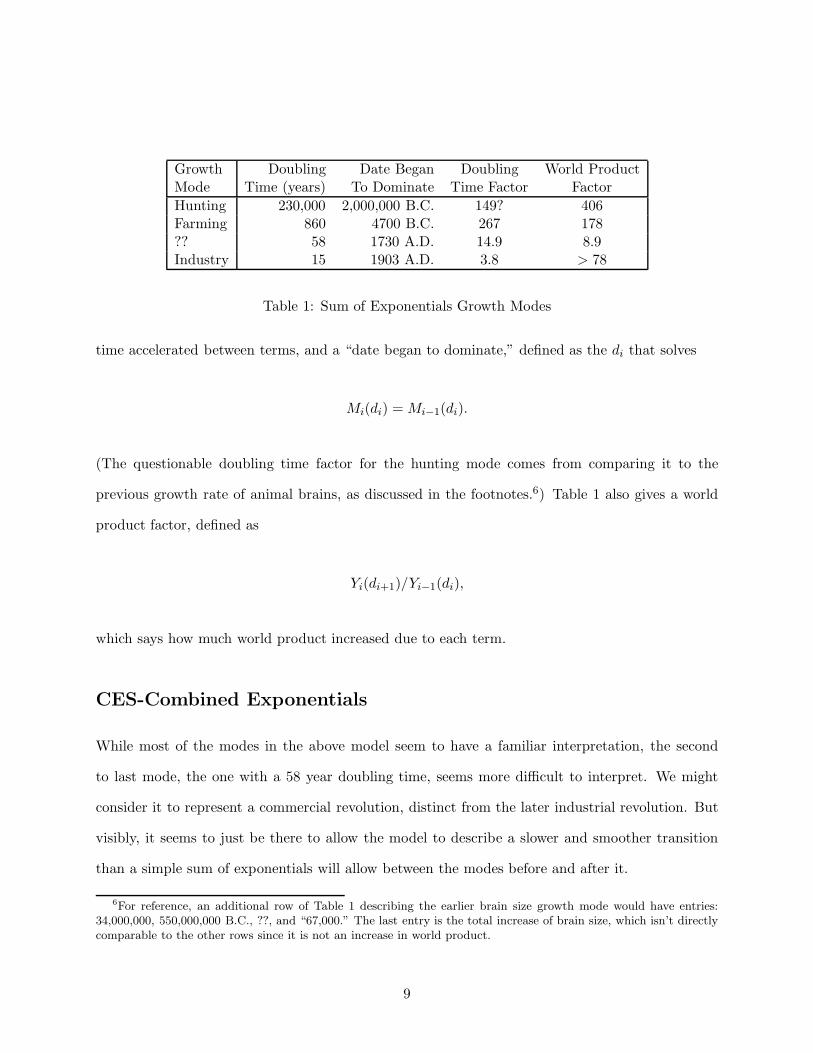
Growth Doubling Date Began Doubling World ProductMode Time (years) To Dominate Time Factor FactorHunting 230,000 2,000,000 B.C. 149? 406Farming 860 4700 B.C. 267 178?? 58 1730 A.D. 14.9 8.9Industry 15 1903 A.D. 3.8 > 78
Table 1: Sum of Exponentials Growth Modes
time accelerated between terms, and a “date began to dominate,” defined as the di that solves
Mi(di) = Mi−1(di).
(The questionable doubling time factor for the hunting mode comes from comparing it to the
previous growth rate of animal brains, as discussed in the footnotes.6) Table 1 also gives a world
product factor, defined as
Yi(di+1)/Yi−1(di),
which says how much world product increased due to each term.
CES-Combined Exponentials
While most of the modes in the above model seem to have a familiar interpretation, the second
to last mode, the one with a 58 year doubling time, seems more difficult to interpret. We might
consider it to represent a commercial revolution, distinct from the later industrial revolution. But
visibly, it seems to just be there to allow the model to describe a slower and smoother transition
than a simple sum of exponentials will allow between the modes before and after it.
6For reference, an additional row of Table 1 describing the earlier brain size growth mode would have entries:34,000,000, 550,000,000 B.C., ??, and “67,000.” The last entry is the total increase of brain size, which isn’t directlycomparable to the other rows since it is not an increase in world product.
9

Growth Doubling Date Began Doubling World Product TransitionMode Time (year) To Dominate Time Factor Factor CES PowerHunting 224,000 2,000,000 B.C. 153? 480 ?Farming 909 4860 B.C. 247 190 2.4Industry 6.3 2020 A.D. 145 > 590 0.094
Table 2: CES-combined Exponentials Growth Modes
To more directly model the possibility of a slow versus fast transitions between modes, we can
combine terms not with a sum, but instead with a constant elasticity of substitution (CES) form
(Barro & Sala-i-Martin, 1995), as in
Yi(t) = (Yi−1(t)ai + Mi(t)ai)1/ai .
When the CES power is ai = 1, this is x + y, the previous case. When ai = 0, this is proportional
to√(Yi−1Mi), which for exponential terms essentially makes an infinitely slow transition. When
ai is positive infinity, this is max(Yi−1,Mi), with an infinitely fast transition. Other positive values
of ai allow for other intermediate speeds of transition.
If we now fit such a CES combination of three exponential terms to our data, again using the
min square error of logs method, we get an eyeball-pleasing fit, and an average percentage error
of 1.7%. This model is described7 in Table 2, and compared to the data in Figures 1 and 2. This
model has the same number of free parameters as the four-term sum of exponentials model, and a
modestly smaller total squared error of logs.
Note that the industry mode will not begin to dominate until 2020, has a doubling time which is
half of what we have observed over the last half century, and is already responsible for a larger world
product factor than either of the previous two modes. The very low transition power allows a new
mode to have a strong influence long before it officially dominates, and predicts a mid-transition
7An additional row describing the earlier brain size growth mode would have the same entries as before, and the“out of Africa” theory would change the same entries by a factor of ten.
10

growth rate of about half of the new mode growth rate.
Interpreting the Modes
By describing world product history as either a sum or CES-combination of exponentials, one seems
to essentially be saying that among the thousands of large and important changes that the world
economy has seen, only a handful are fundamentally big news. Other changes are either “small,”
at least in the big picture, or such that a change of broadly similar economic magnitude and timing
was largely predetermined by the fundamental economic forces at play. Typically, the economy is
dominated by one particular mode of economic growth, which produces a roughly constant growth
rate.
While there are often economic processes which grow exponentially at a rate much faster than
that of the economy as a whole, such processes almost always slow down as they become limited
by the size of the total economy. Very rarely, however, a faster process reforms the economy
so fundamentally that overall economic growth rate accelerates to track this new process. The
economy might then be thought of as composed of an old sector and a new sector, a new sector
which continues to grow at its same speed even when it comes to dominate the economy.
Following this line of interpretation, the simple sum of exponentials model seems to assume that
during each transition, the “new” and “old” economies co-exist but do not influence each other. In
contrast, the CES-combination form seems to describe interactions between modes. Modes might
complement each other (0 < a < 1), making for a more gradual transition, or substitute for each
other (a > 1), making for a sharper transition.
The large transition centered around 5000 B.C. (but surely begin thousands of years earlier) is
naturally interpreted as the transition to from “hunting” to “farming” (both broadly construed).
Populations relying on food from the domestication of plants and animals seem to have grown
exponentially for several millennia before this transition date, nicely fitting a simple interpretation of
co-existing new and old economies (Diamond, 1997). In the CES model, the power estimate for the
11
farming transition suggests that farming mostly substituted for hunting, rather than complementing
it. Because the data is poor, this suggestion can only be weak. But it does make sense, given that
hunting and farming economic modes competed for the use of both land and labor.8
The recent “industrial revolution” transition has a CES power describing a much more gradual
transition, suggesting less substitution and more complementarity between the old and new eco-
nomic growth modes. If we interpreted the old and new modes relatively literally as “farming”
and “industry”, this makes some sense, in that improved farming technology has freed workers for
industry while improved industry technology has often transferred to farming technology.
Such a literal interpretation, however, is argued against by the CES model estimate that we will
not “officially” transition to the new mode until 2020, in the sense of having the new contribution to
the world economy exceed the old part. For this to make sense, much of our non-farming economy
needs to be interpreted as still dominated by the “old” growth mode.
The form of our model suggests that the new growth mode might be found in small quantities
well before it has a noticeable effect on total growth rates, and that what distinguishes this new
economy inside the old one is that it is growing rapidly, at a rate closely related to what will
become the new total economic growth rate. We might thus better understand what distinguishes
the current “new” and “old” growth modes by looking for processes which doubled before the
transition at a rate similar to the modeled new rates of 6 or 15 years.
Some interesting candidates are found in measures of scientific progress. The number of scientific
journals has doubled steadily about every 15 years since about 1750, even though the world product
doubling time in 1750 was around a century. (From about 1650 to 1750 both journals and scientific
societies doubled roughly every 30 years.) Narrower measures of progress grow slower, while broader
measures grow faster. For example, the number of “important” discoveries has doubled every 20
years, while the number of U.S. engineers has doubled every 10 years (de Solla Price, 1963).
8Maximum brain size does not translate very directly into world product, but the long roughly steady growth inmaximum brain size has been mentioned in this paper because it may be the relevant growth mode prior to the earlyspread of the human population. Product growth in an economy of human-like creatures seems to have awaited theevolution of a land-based animal with hands, a large enough brain, and perhaps other unknown prerequisites.
12

This rough coincidence in timing and doubling times suggests, though only weakly, that a
new “scientific” evolution and diffusion of knowledge via a subject-specific network of articulate
specialists is fundamental to the new industry growth mode. Perhaps the diffusion of seeds and
artifacts via a simpler more spatial network of less specialized people is fundamental to the farming
mode. If so, the new 15 year doubling time of the sum of exponentials model suggests that published
papers are close to the fundamental unit of growth, while the 6 year doubling time of the CES model
suggests that a very broad measure of “scientific”-like activity is closer to the fundamental unit of
growth.
How can we make sense of the basic idea of the world economy repeatedly switching to new
growth modes? That is, if the economy is capable of faster growth modes, what prevented them
from happening earlier? Among the many models mentioned before of transitions between historical
economic growth modes, perhaps the simplest postulate minimum scale effects, so that a new growth
mode will not occur in economies below a certain size, density, or technology level. A stochastic
variation on this is to make the number of attempts or chances to discover and transition to a new
growth mode be proportional to the current scale of the economy. This variation also predicts that
a transition will occur at roughly the time when the economy reaches some predetermined scale.
Such models could interpret the roughly stair-step shape of Figure 2 somewhat literally. The lip
of each step would describe a new mode which would not be realized until world product, moving
along the x-axis, reached the base of that step.
Could It Happen Again?
Current U.S. stock prices seem to be much higher than can be justified by the expectation that the
U.S. economy will continue much as it has for the last century (Shiller, 2000). If speculators are
rational, it seems that they must be assigning a substantial probability to the possibility of a large
change in the economy, such as a fall in the risk-premium investors demand, a fall in the real risk of
corporate profits, a rise in the share of income taken by corporate profits, or a rise in real economic
13

growth rates. It is this last possibility, of a large rise in economic growth rates, that seems to be
offered some support by the empirical analysis of very long term economic growth.
If one takes seriously the idea of long-term economic history as a sequence of exponential growth
modes, one might naturally wonder if a world economy that seems to have so far seen at least three
dramatic transitions to much faster growth modes will see yet another such transition. One pair
of authors, Ausubel and Meyer, did informally “speculate on a fourth [Deevey-like] ‘information’
pulse starting now that would enable another order-of-magnitude rise” in population. But they
took the idea no further (Ausubel & Meyer, 1994).
Are there ways an economy can grow fast that will not be possible until the world economy
reaches a threshold in size, density, or the price of some key technology? While it is certainly
possible that the economy is approaching fundamental limits to economic growth rates or levels, so
that no faster modes are possible, we should also consider the other possibility.
To use our models to estimate how soon the world economy might jump again to a faster growth
mode, and how much faster that mode might be, we must make some assumptions about what it
is that is similar across past and future modes and mode transitions. The apparent regularities
in Figure 2 suggest one approach. They suggest that we treat multiples of world product and
growth rates as similar across growth modes. More precisely, if we assume that at each transition
new values of the doubling time factor and world product factor are drawn again from the same
constant-in-time distributions for these parameters, then previous values of these parameters offer
“sample” estimates of future parameter values.
In the sum of four exponentials model, if the current mode were to last through as large a world
product factor as one of the previous three growth modes, it would last until one of the sample
dates of 1963, 2032, or 2066. If the next doubling time factor were the same as one of the last three
values, the next doubling time would be either would be .05, 1, or 4 years.9
Table 3 describes sample forecasts based on the CES model (which the author prefers). It
9If the next mode were like the brain growth mode, it would start in 2162 and have a doubling time of 0.1 years.
14

Growth Doubling Time New Doubling World Product New Date New DateMode (DT) Factor Time (days) (WP) Factor from WP from DTHunting 153? 14.9? 480 1996 2075Farming 247 9.3 190 1976 2067Industry 145 15.8 > 590
Table 3: Using the CES Model to Forecast The New Mode
includes sample forecasts of the next economic doubling time, and two kinds of estimates of the
next transition date.10 The world product method expects that the world product factor, as
previously defined, of the current mode will be similar to that of the previous modes. The doubling
time method instead expects to see a similar value for
(di+1 − di)/τi,
which is the number of doubling times during the period when a mode is dominant. Since the
“current” mode does not even start to dominate until 2020, the doubling time method naturally
gives later date estimates.
The estimates of the new doubling time offer what seems to be a remarkably precise estimate
of an amazingly fast growth rate. One is tempted to immediately reject such rapid growth as too
preposterous to consider, until one remembers how preposterous it would have seemed to forecast
the previous two transitions that did in fact occur.
The robustness of these forecasts can be examined by considering what these types of models
would have predicted using only the data up to 1900. From 1900 to 2000, world product increased
by a factor of 37. The best fit four term sum of exponentials model forecasts that a factor of 35
increase, while the best fit three term CES model forecasts a factor of 22 increase. The main reason
for the CES model failure here is estimating a transition date of about 2060, instead of the 2020
date suggested by the larger dataset. Other parameter estimates were in much closer agreement.
10Another row corresponding to a brain growth mode would give sample dates of 2072 and 2120. Using the out ofAfrica population estimate would change the new doubling time estimates from 14.9?,9.3,15.8 to 1.49?,93,15.8.
15
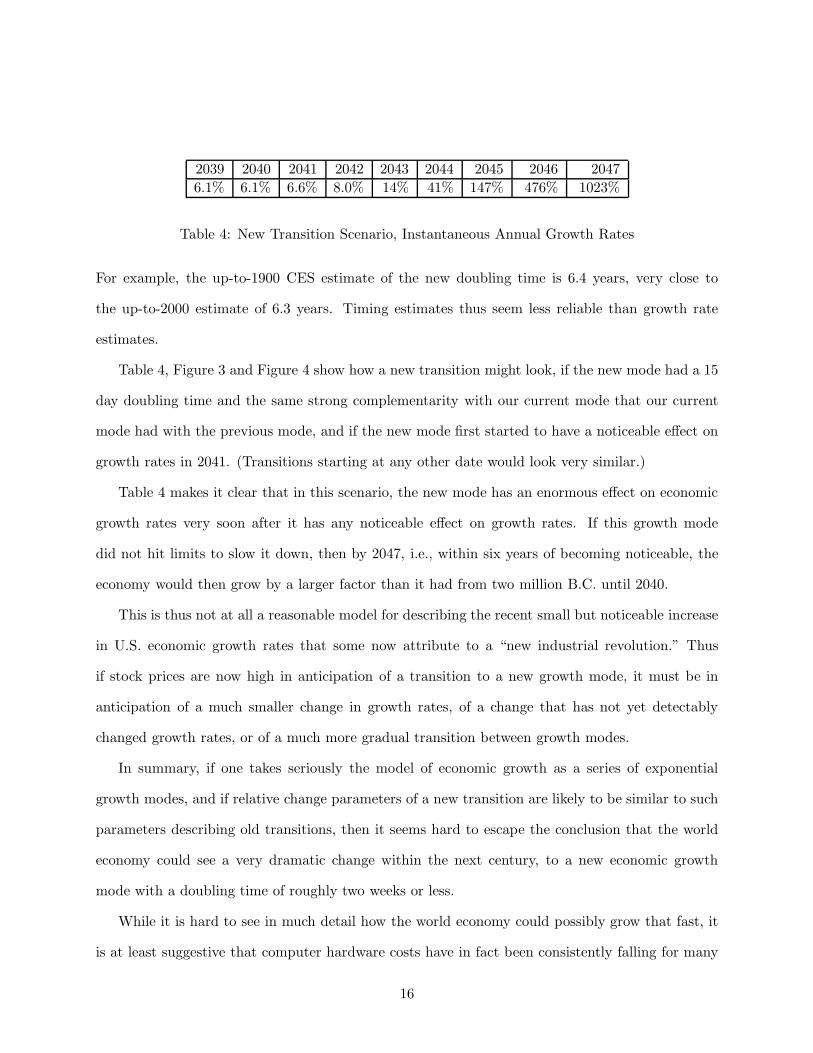
2039 2040 2041 2042 2043 2044 2045 2046 20476.1% 6.1% 6.6% 8.0% 14% 41% 147% 476% 1023%
Table 4: New Transition Scenario, Instantaneous Annual Growth Rates
For example, the up-to-1900 CES estimate of the new doubling time is 6.4 years, very close to
the up-to-2000 estimate of 6.3 years. Timing estimates thus seem less reliable than growth rate
estimates.
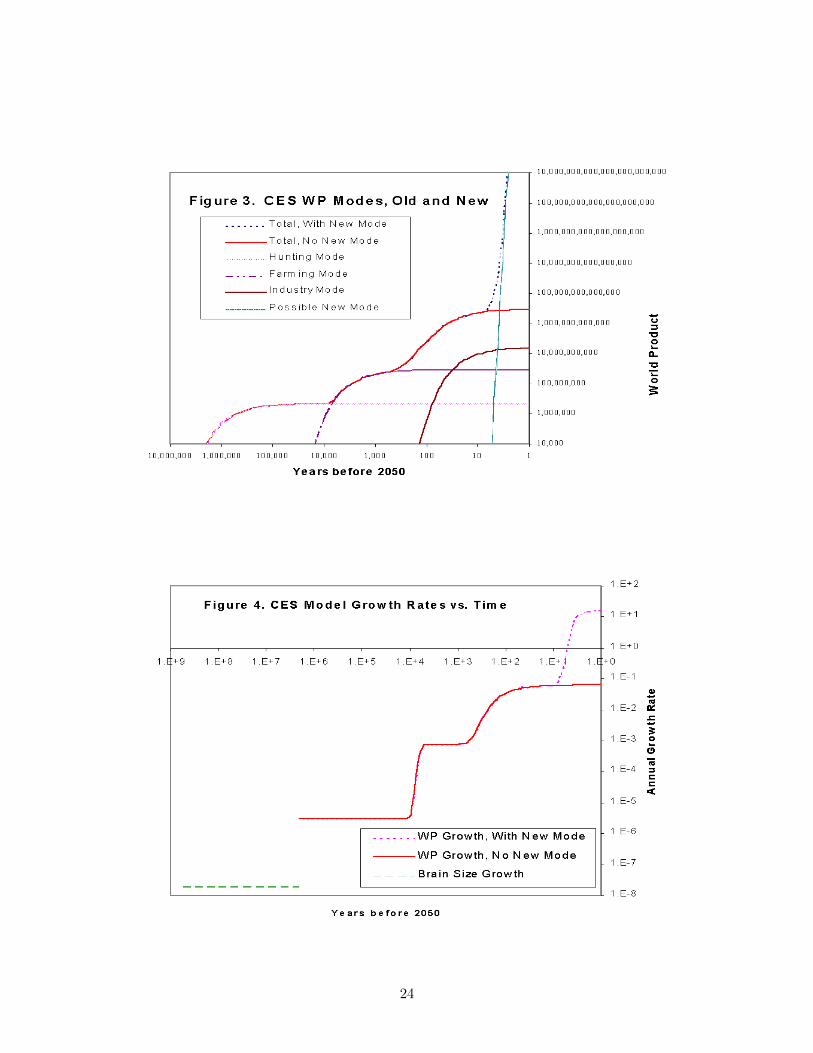
Table 4, Figure 3 and Figure 4 show how a new transition might look, if the new mode had a 15
day doubling time and the same strong complementarity with our current mode that our current
mode had with the previous mode, and if the new mode first started to have a noticeable effect on
growth rates in 2041. (Transitions starting at any other date would look very similar.)
Table 4 makes it clear that in this scenario, the new mode has an enormous effect on economic
growth rates very soon after it has any noticeable effect on growth rates. If this growth mode
did not hit limits to slow it down, then by 2047, i.e., within six years of becoming noticeable, the
economy would then grow by a larger factor than it had from two million B.C. until 2040.
This is thus not at all a reasonable model for describing the recent small but noticeable increase
in U.S. economic growth rates that some now attribute to a “new industrial revolution.” Thus
if stock prices are now high in anticipation of a transition to a new growth mode, it must be in
anticipation of a much smaller change in growth rates, of a change that has not yet detectably
changed growth rates, or of a much more gradual transition between growth modes.
In summary, if one takes seriously the model of economic growth as a series of exponential
growth modes, and if relative change parameters of a new transition are likely to be similar to such
parameters describing old transitions, then it seems hard to escape the conclusion that the world
economy could see a very dramatic change within the next century, to a new economic growth
mode with a doubling time of roughly two weeks or less.
While it is hard to see in much detail how the world economy could possibly grow that fast, it
is at least suggestive that computer hardware costs have in fact been consistently falling for many
16

decades at a doubling time of one to two years (Moravec, 1998; Kurzweil, 1999). Several observers
have predicted a transition to a dramatically new economic mode where computers substitute for
most human labor, perhaps not long after the raw computational ability of a desktop computer
matches the computational ability of a human brain, around 2025 (Moravec, 1998; Kurzweil, 1999).
Simple formal models have even been developed suggesting that adding robots to very standard
growth models can allow growth rates to naturally increase by a factor of ten, a hundred, or even
more (Hanson, 1998). Others have speculated that even faster growth rates are possible with
mature nanotechnology.
If the next mode had a “slow” doubling time of two years, and if it lasted through twenty
doubling times, longer than any mode seen so far, it would still last only forty years. After that,
it is not clear how many more even faster growth modes are possible before hitting fundamental
limits. But it is hard to see how such fundamental limits would not be reached within a few decades
at most.
Conclusion
Many people have tried to make sense of very long term time series estimating human population.
Some have explicitly modeled this history as steadily accelerating growth, while others have more
informally described it as a sequence of growth modes. And exponential growth is by far the most
common formal model of shorter term growth. Meanwhile, Brad De Long has recently constructed
long term world product estimates from recent world product estimates and older population esti-
mates.
This paper has thus attempted the neglected task of more formally describing long term world
product growth as a sequence of exponential growth modes. We have found that a time series
of world product over the last two million years can be comfortably described as either as a sum
of four exponentials, or as a CES-combination of three exponentials. But the CES model seems
preferable on theoretical grounds, which can be thought of as describing the three modes of “hunt-
17

ing,” “farming,” and “industry,” broadly construed. (An earlier period of exponential growth in
brain sizes may be the relevant previous growth mode.)
In the CES-combination model, there is a sharp transition between hunting and farming, and a
smooth transition between farming and industry. These can be interpreted as due to the interaction
between hunting and farming being more one of substitution, relative to a more complementary
relation between farming and industry. The rough timing and doubling time coincidence between
industry and measures of scientific progress weakly suggests that scientific-like creation and diffusion
of knowledge might be a key to the current growth mode.
Since there seem to be some rough regularities regarding how much the economy grows between
transitions, and how much faster each new growth mode is, this paper has also considered what
these regularities suggest about when we might see yet another transition to a much faster mode,
if such faster modes are possible. The suggestion is fantastic, namely of a transition to a doubling
time of two weeks or less sometime within roughly the next century.
One might think this suggestion too fantastic to consider, were it not for the fact that similar
predictions before previous transitions would have seemed similarly fantastic. We should also keep
in mind that investors in U.S. stocks seem to be betting that a large change in the nature of the
economy is likely soon. They may well be wrong, but this paper shows that the empirical case
against such expectations is not as clear as one might expect from empirical analyzes looking at
the last century or so. From a purely empirical point of view, very large changes are actually to be
expected within the next century.
18
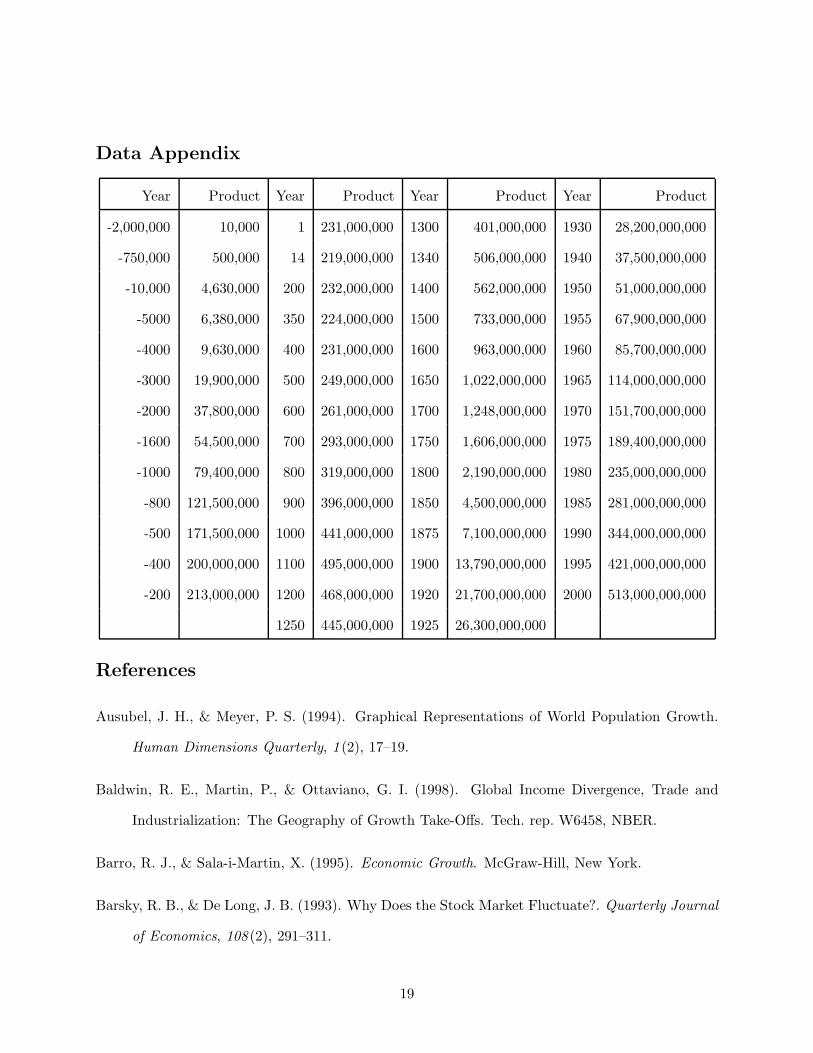
Data Appendix
Year Product Year Product Year Product Year Product
-2,000,000 10,000 1 231,000,000 1300 401,000,000 1930 28,200,000,000
-750,000 500,000 14 219,000,000 1340 506,000,000 1940 37,500,000,000
-10,000 4,630,000 200 232,000,000 1400 562,000,000 1950 51,000,000,000
-5000 6,380,000 350 224,000,000 1500 733,000,000 1955 67,900,000,000
-4000 9,630,000 400 231,000,000 1600 963,000,000 1960 85,700,000,000
-3000 19,900,000 500 249,000,000 1650 1,022,000,000 1965 114,000,000,000
-2000 37,800,000 600 261,000,000 1700 1,248,000,000 1970 151,700,000,000
-1600 54,500,000 700 293,000,000 1750 1,606,000,000 1975 189,400,000,000
-1000 79,400,000 800 319,000,000 1800 2,190,000,000 1980 235,000,000,000
-800 121,500,000 900 396,000,000 1850 4,500,000,000 1985 281,000,000,000
-500 171,500,000 1000 441,000,000 1875 7,100,000,000 1990 344,000,000,000
-400 200,000,000 1100 495,000,000 1900 13,790,000,000 1995 421,000,000,000
-200 213,000,000 1200 468,000,000 1920 21,700,000,000 2000 513,000,000,000
1250 445,000,000 1925 26,300,000,000
References
Ausubel, J. H., & Meyer, P. S. (1994). Graphical Representations of World Population Growth.
Human Dimensions Quarterly, 1 (2), 17–19.
Baldwin, R. E., Martin, P., & Ottaviano, G. I. (1998). Global Income Divergence, Trade and
Industrialization: The Geography of Growth Take-Offs. Tech. rep. W6458, NBER.
Barro, R. J., & Sala-i-Martin, X. (1995). Economic Growth. McGraw-Hill, New York.
Barsky, R. B., & De Long, J. B. (1993). Why Does the Stock Market Fluctuate?. Quarterly Journal
of Economics, 108 (2), 291–311.
19
Cipolla, C. M. (1967). The Economic History of World Population (Forth edition). Penguin Books,
Baltimore.
Cohen, J. E. (1995). How Many People Can The Earth Support. W.W.Norton & Company, New
York.
De Long, J. B. (1998). Estimating World GDP, One Million B.C. - Present.
http://econ161.berkeley.edu/TCEH/.
de Solla Price, D. J. (1963). Little Science, Big Science. Columbia University Press, New York.
Deevey, E. S. (1960). The Human Population. Scientific American, 203, 195–204.
Diamond, J. (1997). Guns, Germs and Steel. W.W. Norton & Company, New York.
Galor, O., & Weil, D. N. (2000). Population, Technology, and Growth: From Malthusian Stagnation
to the Demographic Transition and Beyond. American Economic Review, 90 (4), 806–828.
Hansen, G. D., & Prescott, E. C. (1998). Malthus to Solow. Tech. rep. W6858, NBER.
Hanson, R. (1998). Economic Growth Given Machine Intelligence.
http://hanson.gmu.edu/aigrow.pdf.
Hawks, J., Hunley, K., Lee, S.-H., & Wolpoff, M. (2000). Population Bottlenecks and Pleistocene
Human Evolution. Molecular Biology and Evolution, 17 (1), 2–22.
Helpman, E. (1998). General Purpose Technologies and Economic Growth. MIT Press, Cambridge,
Mass.
Ingman, M., Kaessmann, H., Paabo, S., & Gyllensten, U. (2000). Mitochondrial genome variation
and the origin of modern humans. Nature, 408, 708–713.
Jerison, H. J. (1991). Brain Size and the Evolution of Mind. American Museum of Natural History,
New York.
20
Johansen, A., & Sornette, D. (2000). Finite-time singularity in the dynamics of the world popula-
tion, economic and financial indices. http://xxx.lanl.gov/abs/cond-mat/0002075.
Jones, C. I. (1999). Was an Industrial Revolution Inevitable? Economic Growth Over the Very
Long Run. Tech. rep. W7375, NBER.
Kapitza, S. (1996). Phenomenological Theory of World Population Growth. Physics-Uspekhi, 39 (1).
Kates, R. W. (1996). Population, Technology, and the Human Environment: A Thread Through
Time. Daedalus, 125 (3), 43–71.
Kremer, M. (1993). Population Growth and Technical Change, One Million B.C. to 1990. Quarterly
Journal of Economics, 108 (3), 681–716.
Kurzweil, R. (1999). The Age of Spiritual Machines. Viking Penguin, New York.
Lee, R. D. (1986). Malthus and Boserup: A Dynamic Synthesis. In Coleman, D., & Schofield, R.
(Eds.), The State of Population Theory. Basil Blackwell Ltd., Oxford.
Lee, R. D. (1988). Induced population growth and induced technological progress: Their interaction
in the accelerating stage. Mathematical Population Studies, 1 (3), 265–288.
Lee, R. D. (1990). Long-Run Global Population Forecasts: A Critical Appraisal. Population and
Development Review, 16 (Supplement), 44–71.
Livi-Bacci, M. (1997). A Concise History of World Population. Blackwell Publishers.
Lucas, R. E. (2000). Some Macroeconomics for the 21st Century. Journal of Economic Perspectives,
14 (1), 159–168.
Maddison, A. (1995). Monitoring the World Economy 1820-1992. OECD, Paris.
Marvin Goodfriend, J. M. (1995). Early Development. American Economic Review, 85 (1), 116–133.
McEvedy, C., & Jones, R. (1978). Atlas of World Population History. Penguin Books.
21
Meyer, P. S., & Ausubel, J. H. (1999). Carrying Capacity: a Model with Logistically Varying
Limits. Technological Forecasting and Social Change, 61 (3), 209–214.
Moravec, H. (1998). When will computer hardware match the human brain?. Journal of Transhu-
manism, 1. http://www.transhumanist.com.
Newman, M. E. J., & Sibani, P. (1999). Extinction, diversity and survivorship of taxa in the fossil
record. Proceedings of the Royal Society of London B, 266, 1593–1599.
Relethford, J. H. (1998). Genetics of Modern Human Origins and Diversity. Annual Review
Anthropology, 27, 1–23.
Rogers, A. R., & Jorde, L. B. (1995). Genetic Evidence on Modern Human Origins. Human Biology,
67 (1), 1–36.
Russell, D. A. (1983). Exponential Evolution: Implications for Intelligent Extraterrestrial Life.
Advances in Space Research, 3 (9), 95–103.
Shiller, R. J. (2000). Irrational Exuberance. Princeton University Press.
Steinmann, G., Prskawetz, A., & Feichtinger, G. (1998). A Model on the Escape from the Malthu-
sian Trap. Journal of Population Economics, 11 (4).
Valen, L. M. V. (1973). A New Evolutionary Law. Evolutionary Theory, 1, 1–30.
von Foerster, H., Mora, P. M., & Amiot, L. W. (1960). Doomsday: Friday, 13 November, A.D.
2026. Science, 132, 1291–95.
Weiss, K. M. (1984). On the number of members of the genus Homo who have ever lived, and some
evolutionary implications. Human Biology, 56, 637–649.
22

23
24