long-term evaluations of northern pike experimental
TRANSCRIPT

1
Minnesota Department of Natural Resources
Investigational Report 556, February 2010
LONG-TERM EVALUATIONS OF NORTHERN PIKE
EXPERIMENTAL REGULATIONS IN MINNESOTA LAKES1
Rodney B. Pierce
Minnesota Department of Natural Resources
Division of Fisheries and Wildlife
1201 East Highway 2
Grand Rapids, Minnesota 55744
Abstract.
__ The effects of maximum, minimum, and slot length limits (along with one
catch-and-release regulation) on sizes and relative abundance of northern pike Esox lucius were
evaluated in 23 Minnesota lakes. The regulations began in 1989-1998 and lasted 9-15 years.
Pre-regulation information was available back to the 1970s so that evaluation periods covered
21-37 years in each lake. For experimental control, comparisons were made during the same ex-
tended period with reference populations from 47 ecologically similar lakes. Although regula-
tions did not work in every lake, the broader-scale statewide finding was that regulations
improved size structure of northern pike populations but produced no consistent trends in rela-
tive abundance. The improvements were detected against the backdrop of reference populations
that initially appeared to have similar sizes and relative abundances of northern pike. Maximum
length limits protecting fish over 20, 22, or 24 inches total length produced significant long-
term increases in percentages of northern pike > 24 inches and > 30 inches compared with ref-
erence populations. The percentages of fish > 20 inches increased in all three lakes with 30-inch
minimum length limits, but improvements did not carry over to fish > 30 inches. A mix of slot
length limits produced results more difficult to interpret, but generally improved size structure.
A meta-analysis incorporating all the length regulations indicated that changes in northern pike
size structure in regulated lakes relative to unregulated lakes were very large for ecological ex-
periments. However, these changes in size structure did not seem to affect yellow perch Perca
flavescens and walleye Sander vitreus populations. Length limits protected large northern pike
with the expectation that reduced yields were an acceptable trade-off for producing larger fish
for recreational fisheries. This study revealed the range and magnitude of responses we can rea-
sonably expect from length limits, as well as the substantial value of conserving large fish when
the goal is improved population size structure.
1 This project was funded in part by the Federal aid in Sport Fish Restoration (Dingell-Johnson) Program. Completion Report, Study 602, D-J Project F-26-R Minnesota.

2
Recreational fishing in Minnesota has
historically influenced northern pike Esox
lucius populations. Recreational fishing is
highly selective for large northern pike with
creel surveys illustrating that fish over 24
inches compose a large portion of the harvest
even though fish as small as 12-14 inches can
be readily caught (Cook and Younk 1998). A
result of this size selectivity, combined with
historical increases in fishing effort, is that
size structures of northern pike populations
have suffered and fewer trophy-size northern
pike are caught today. A unique analysis of
long-term records from a fishing contest in
northwestern Minnesota (Olson and Cunning-
ham 1989) offered insights into the historical
changes in northern pike size structure in re-
sponse to increasing levels of exploitation by
recreational fishing. Contest entries of north-
ern pike 9.5 lb and larger peaked in 1948 and
then steadily declined, with average weights
of entered fish declining from 10.1 lb in the
1930s to 6.8 lb in the 1980s. Statewide an-
gling regulations after 1947 included a daily
bag limit of three northern pike, but no length
limits. During the 1980s, increasing numbers
of anglers and fisheries managers became
concerned about the long-term declines in
northern pike sizes, and advocated for more
restrictive length-based regulations to im-
prove opportunities for catching larger fish in
at least some Minnesota waters. The daily bag
limit was further modified in 1994 to allow
only one northern pike over 30 inches in the
daily bag limit of three fish, but there have
been no other statewide restrictions on lengths
of fish that could be harvested.
Long-term evaluations of length limit
regulations for recreational fisheries are
needed to effectively manage fish species with
life spans of 10 or more years, yet long-term
studies are not common in the literature. Rea-
sons for the lack of long-term studies include
poor funding of long-term monitoring pro-
grams, and monitoring protocols that have not
been consistent over time (Margenau et al.
2008). In many cases, evaluations of length
limit regulations have been case studies with
no replication among water bodies, and have
seldom included comparisons with reference
fish populations for experimental control. In
two of the earliest studies of northern pike
length limits, minimum length limits of 18
inches (Snow and Beard 1972) and 22 inches
(Kempinger and Carline 1978) were not found
to be effective. The two case studies monitored
northern pike populations for 4 years and 9
years, respectively, with results indicating that
the minimum length limits were not restrictive
enough to protect large northern pike. Snow
and Beard (1972) and Kempinger and Carline
(1978) contended that the length limits reduced
yields, and that high natural mortality of pro-
tected-size fish more than compensated for
decreased fishing mortality. Pierce et al.
(1995) argued that length limits protecting
northern pike under 22 inches would be coun-
terproductive in lakes with good recruitment
and slow growth of small northern pike. Eval-
uations of higher minimum length limits (26,
32, and 40 inches) in Wisconsin (Margenau et
al. 2008) found inconsistent responses that
were difficult to interpret, in part because
evaluations had low sample sizes, consisted of
only one year pre-regulation and one year post-
regulation sampling, and the three control
lakes showed high variability.
The Minnesota Department of Natural
Resources (MNDNR) began experimenting
with length-based regulations for northern pike
in the late 1980s. The length regulations in-
cluded maximum, minimum, and slot length
limits. A study of slot length limits was in-
itiated during 1989-1991 in five moderate size
(313-627 surface acres) north-central Minneso-
ta lakes (Pierce and Tomcko 1997). The five
populations received slot length limits protect-
ing fish 20-30 or 22-30 inches total length.
During 1996-1997, a larger experimental initi-
ative (Goeman and Radomski 1997) resulted in
maximum length limits protecting fish larger
than 20, 22, or 24 inches in 11 lakes. The max-
imum length limits were used in moderate to
larger size (184-5,406 acres) central Minnesota
lakes. A contrasting approach using minimum
length limits was attempted in southern Min-
nesota. Three small (91-193 acres) southern
Minnesota lakes were given 30-inch minimum
length limits in 1998. A few other ad hoc regu-
lations have also been evaluated. The ad hoc
regulations included slot length limits in two
very large (> 100,000 acres) lakes noted more

3
for their walleye Sander vitreus populations, a
slot length limit in a 10,945-acre northeast
Minnesota lake, and a catch-and-release-only
regulation in a 158-acre lake located in an ur-
ban setting.
The variety of these regulations re-
flects the considerable variety of northern pike
population characteristics found within Minne-
sota’s geographical setting, which grades from
prairie in the southwest, to a more mixed cen-
tral area including hardwood forests, and then
to heavily forested glacial shield in the north-
east. Lakes along this southwest to northeast
axis tend to grade from shallow, turbid, and
eutrophic waters in the southwest to deeper,
more clear and oligotrophic waters in the
northeast, with fish communities changing ac-
cordingly along this geographical axis (Moyle
1956). Minnesota’s thousands of lakes have
been further categorized into 44 ecological
lake classes based on variables associated with
lake basin size, shape, and depth, variables
associated with chemical fertility of the lakes,
and length of the growing season (Schupp
1992). Within this wide range of ecological
settings, it is difficult to generalize about
northern pike population characteristics. How-
ever, populations from lakes in southern Min-
nesota tend to be more limited in natural
recruitment due to loss of habitat from agricul-
tural and other shore-land development. In
contrast, many populations in central and
northern regions of the state have good natural
recruitment that has historically supported a
large recreational fishery. Levels of natural
recruitment were the principal rationale for
choosing which regulation to use. Maximum
and slot length limits were used in lakes ex-
pected to have good or consistent natural re-
cruitment, whereas minimum length limits
were used where recruitment was more likely
to be limited.
As a top-level predator, northern pike
have the potential to both compete with and
prey upon walleye, another important sport
fish in Minnesota and elsewhere (Wesloh and
Olson 1962; Colby et al. 1987). Yellow perch
Perca flavescens is often a key component of
the diet for both northern pike and walleye
even when minnows and small centrarchids are
readily available (Seaburg and Moyle 1964).
Some researchers have even considered the
northern pike-yellow perch predator-prey rela-
tionship to be an important controlling aspect
of aquatic community structure in small lakes
(Anderson and Schupp 1986; Goeman et al.
1990; Findlay et al. 1994; Craig 2008).
The usual goal of experimental regula-
tions was to improve northern pike size struc-
ture and the purpose of this study was to
quantify the long-term effects of experimental
regulations on sizes and relative abundances of
northern pike. Each of the experimental regula-
tions listed above was in effect for periods
ranging from 9 to 15 years. Pre-regulation in-
formation was available back to the early
1980s for all of the lakes, and in some cases
back to the 1970s, so that a unique aspect of
this study was the duration of the evaluation
periods (21-37 years). Additionally, I eva-
luated how changes in the northern pike popu-
lations affected sizes of yellow perch, and
relative abundances of both walleye and yel-
low perch in some of the regulation lakes. For
experimental control, northern pike, walleye,
and yellow perch population changes in regu-
lation lakes were further compared with
changes in populations from ecologically simi-
lar reference lakes in the same geographic
areas and over the same extended time periods.
Study Lakes and Regulations
Maximum length limits were imple-
mented in 11 lakes selected by fisheries man-
agers in central and west-central Minnesota.
The lakes fell into three ecological classifica-
tions (lake classes 22, 27, 31; Table 1) that are
typified by moderate to large surface areas
(one lake was 184 acres but the rest were 496-
5,406 acres), relatively clear water, and hard to
very hard (> 150 mg CaCO3 /l) water; and the
lakes historically had good natural recruitment
of northern pike. Two lakes received length
limits protecting northern pike 20 inches and
larger; one lake received a 22-inch maximum
length limit; and the other eight lakes received
24-inch maximum length limits. The regula-
tions were enacted in May 1996 or May 1997
and were in effect through 2006 or 2007.
Green Lake was an exception, with the regula-
tion dropped after 2005. Changes observed in

4
Table 1. Ecological lake class, lake dimensions, and Secchi depth measurements for lakes with maximum and mini-mum length regulations for northern pike (shaded), and comparable information for reference lakes. Reference lakes had 3 fish/day bag limits, and after 1994, bag limits were further restricted to allow only one of the three fish to be over 30 inches long.
Surface Percent Maximum Secchi Regulation Ecological area littoral depth depth Start Lake classification (acres) area (ft) (ft) Length date Maximum Length Limits Andrew 27 946 35 83 11.5 24-inch 1997 Big Birch 22 2,108 30 81 10.5 24-inch 1996 Big Swan 27 918 44 45 6.6 24-inch 1997 Burgen 31 184 29 43 6.3 24-inch 1997 East Battle 22 1,949 42 87 8.2 22-inch 1997 Green 22 5,406 38 110 8.0 24-inch 1997 Melissa 27 1,831 51 37 10.5 24-inch 1996 Rachel 27 496 25 65 7.9 24-inch 1997 Sallie 27 1,246 46 50 8.0 24-inch 1996 Sturgeon 27 1,405 35 40 9.9 20-inch 1997 Ten Mile 22 4,669 28 208 18.0 20-inch 1997 Big Floyd 27 1,178 73 34 8.0 Reference Big Pine 27 4,730 50 76 5.7 Reference Black Hoof 31 183 44 29 14.5 Reference Brophy 31 293 51 44 8.0 Reference Cotton 27 1,783 44 28 10.0 Reference Detroit 22 3,083 61 89 7.3 Reference Le Homme Dieu 22 1,744 44 85 8.0 Reference Marion 27 1,624 42 62 11.5 Reference Minnewaska 27 8,050 27 32 9.5 Reference North Lida 27 5,513 43 58 6.0 Reference Osakis 22 6,389 53 73 3.5 Reference Pine Mountain 22 1,567 47 80 6.1 Reference Rush 27 5,338 62 68 6.5 Reference Star 22 4,454 63 94 5.2 Reference Steamboat 22 1,756 30 93 7.5 Reference Toad 27 1,716 33 29 3.5 Reference Washburn 22 1,554 48 111 12.5 Reference Minimum Length Limits Kelly-Dudley 30 125 62 60 8.0 30-inch 1998 Reeds 24 193 57 58 5.5 30-inch 1998 St. Olaf 29 91 56 33 4.0 30-inch 1998 Roemhildts 30 70 63 60 7.0 Reference Auburn 24 261 61 66 9.5 Reference Bavaria 24 162 40 66 5.0 Reference Fish 24 171 43 28 6.5 Reference Long 24 261 50 33 9.5 Reference Medicine 24 886 45 49 5.8 Reference Minnewashta 24 738 50 70 7.1 Reference Riley 24 297 37 49 3.5 Reference Sarah 24 574 65 59 2.7 Reference

5
fish populations from maximum length limit
regulation lakes were compared with changes
observed in 17 reference lakes from the same
geographic fisheries management areas. Refer-
ence lakes were other available waters of the
same three ecological lake classes that had
comparable sampling histories and were 183-
8,050 acres surface area (Table 1).
Minimum length limits were imposed
in three southern Minnesota lakes that had low
to moderate levels of natural recruitment for
northern pike. One lake, St. Olaf Lake, was
historically stocked with hatchery fish to sup-
plement recruitment. Ecologically, the lakes
were small (91-193 acres), hard-water lakes
with moderately good water clarity considering
their location in southern Minnesota (Table 1).
Beginning in May 1998, 30-inch minimum
length limits were in effect at all three lakes
through 2007. Comparable reference lakes in
the same fisheries management area were not
available except for Roemhildts Lake (Table
1), a 70-acre lake. Therefore, additional data
were obtained from eight reference lakes (162-
886 acres) that had comparable sampling histo-
ries and were in an adjacent management area
in the Minneapolis metropolitan area north of
the study lakes (Table 1).
Slot length limits were used in five
moderate-size north-central Minnesota lakes
with relatively clear water that traditionally
had good natural recruitment of northern pike
(Table 2). The lakes had similar surface areas
(313-627 acres), but spanned four ecological
lake classes because their basin shapes differed
(littoral habitat ranged from 28% to 80%
among the lakes). Two lakes received slot
length limits protecting 22-30-inch northern
pike in 1989; the other lakes received 20-30-
inch slot length limits in 1991. Regulations in
these lakes were in effect through 2005 or
2006. Reference lakes for these four ecological
lake classes were fairly common in the three
local fisheries management areas represented
by the slot limits. As a result, I was able to ob-
tain fisheries data from 18 reference lakes (69-
736 acres) with comparable sampling histories
(Table 2). Platte and Sullivan lakes, two well-
connected central Minnesota lakes, had 24-30-
inch slot length limits but results from those
lakes were not included in this analysis due to
complications from winterkill in one of the
basins.
Two different slot length limits were
implemented on very large hard-water walleye
lakes. These regulations had different goals
than did slot limits in smaller lakes. Lake-of-
the-Woods (Table 2) is a shared-border water
with Canada, the Minnesota portion of 345,000
acres being only about a third of the total lake
size. Through the 1980s, the Minnesota portion
of Lake-of-the-Woods had a population of
very large size northern pike, but the fishery
was beginning to attract more effort, harvest,
and media attention during the early 1990s. In
an effort to preserve the good size structure, a
slot length limit protecting 30-40-inch northern
pike was enacted in May 1996. Thus, the goal
was to protect rather than improve fish sizes.
Mille Lacs (Table 2), in contrast, is a 132,516-
acre shared fishery between the State of Min-
nesota and several bands of Chippewa Indians.
The fishery is managed with a quota system
and the state uses slot length limits to keep
northern pike harvests below an annual quota
for non-band fishers. Initially, a slot length
limit protecting 26-36-inch fish was enacted
(May 1998), but the regulation was made more
restrictive in 2003 when it was adjusted to 24-
36 inches. Two other very large hard-water
walleye lakes, Leech (102,948 acres) and
Winnibigoshish (58,544 acres) located in
north-central Minnesota, were used as refer-
ence lakes for Lake-of-the-Woods and Mille
Lacs (Table 2). All of these very large lakes
are renowned sport fisheries for walleye, but
they also support important northern pike fish-
ing.
An additional slot length limit was
enacted in Pelican Lake, a large (10,945 acres)
lake in the glacial shield area of northeast
Minnesota (Table 2). Pelican Lake was judged
to have good natural recruitment and lakes of
its ecological classification typically have soft
water (< 60 mg CaCO3 /l) and a very irregular
shoreline. The only reference lake of the same
ecological classification near Pelican Lake was
Sturgeon Lake (1,664 acres), located in the
same fisheries management area.
Finally, I also observed the results of a
catch-and-release-only regulation in Steiger
Lake, a 158-acre lake in the Minneapolis
6
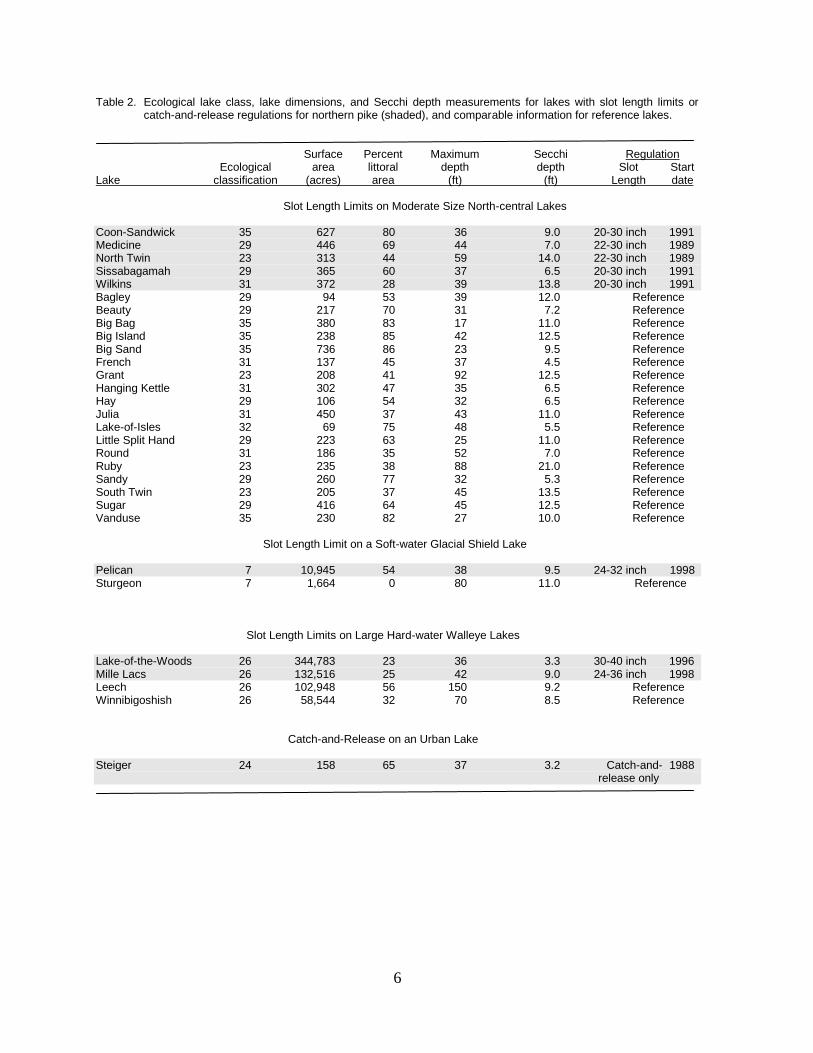
Table 2. Ecological lake class, lake dimensions, and Secchi depth measurements for lakes with slot length limits or catch-and-release regulations for northern pike (shaded), and comparable information for reference lakes.
Surface Percent Maximum Secchi Regulation Ecological area littoral depth depth Slot Start Lake classification (acres) area (ft) (ft) Length date Slot Length Limits on Moderate Size North-central Lakes Coon-Sandwick 35 627 80 36 9.0 20-30 inch 1991 Medicine 29 446 69 44 7.0 22-30 inch 1989 North Twin 23 313 44 59 14.0 22-30 inch 1989 Sissabagamah 29 365 60 37 6.5 20-30 inch 1991 Wilkins 31 372 28 39 13.8 20-30 inch 1991 Bagley 29 94 53 39 12.0 Reference Beauty 29 217 70 31 7.2 Reference Big Bag 35 380 83 17 11.0 Reference Big Island 35 238 85 42 12.5 Reference Big Sand 35 736 86 23 9.5 Reference French 31 137 45 37 4.5 Reference Grant 23 208 41 92 12.5 Reference Hanging Kettle 31 302 47 35 6.5 Reference Hay 29 106 54 32 6.5 Reference Julia 31 450 37 43 11.0 Reference Lake-of-Isles 32 69 75 48 5.5 Reference Little Split Hand 29 223 63 25 11.0 Reference Round 31 186 35 52 7.0 Reference Ruby 23 235 38 88 21.0 Reference Sandy 29 260 77 32 5.3 Reference South Twin 23 205 37 45 13.5 Reference Sugar 29 416 64 45 12.5 Reference Vanduse 35 230 82 27 10.0 Reference Slot Length Limit on a Soft-water Glacial Shield Lake Pelican 7 10,945 54 38 9.5 24-32 inch 1998 Sturgeon 7 1,664 0 80 11.0 Reference
Slot Length Limits on Large Hard-water Walleye Lakes
Lake-of-the-Woods 26 344,783 23 36 3.3 30-40 inch 1996 Mille Lacs 26 132,516 25 42 9.0 24-36 inch 1998 Leech 26 102,948 56 150 9.2 Reference Winnibigoshish 26 58,544 32 70 8.5 Reference Catch-and-Release on an Urban Lake
Steiger 24 158 65 37 3.2 Catch-and- 1988 release only

7
metropolitan area (Table 2). Eight reference
lakes were compared with this catch-and-
release regulation lake. These reference popu-
lations were the same lakes used in compari-
sons with the populations under minimum
length limits (Table 1) except that the time pe-
riods were shifted to account for a different
regulation start date.
Methods
Gill Netting
Minnesota’s rich tradition of standar-
dized fish population sampling was critical to
this analysis. Multimesh experimental gill nets
are one of our oldest standardized sampling
tools and their use in sampling northern pike
dates back to the 1940s. The experimental gill
nets are 250 ft long and consist of five panels
(50 ft × 6 ft) with graded bar mesh sizes of
0.75-, 1.0-, 1.25-, 1.5-, and 2.0-inch multifila-
ment nylon, and size selectivity of these nets
was previously described by Pierce et al.
(1994). Gill nets are set in the morning and
lifted the following morning.
Long-term sampling frequency for
each lake has been dependent on the lake’s
size and importance to recreational fishing. For
this study, lakes larger than 1,000 acres were
sampled every 1-5 years but the interval be-
tween samples for lakes smaller than 500 acres
was sometimes as long as 10 years. Gill netting
occurred from the end of June through August
with sampling dates for individual lakes re-
peated as closely as possible each year (usually
within the same calendar week). In each lake,
the historical sampling stations were intended
to represent important habitats except deep
water with low hypolimnetic dissolved oxygen.
Since 1993, the number of gill-net sets
used in each lake has been standardized by
lake size with more nets used in larger lakes.
Up to 6 experimental nets were set in lakes up
to 300 acres, 9 nets in lakes up to 600 acres, 12
nets in lakes up to 1,500 acres, and 15 or more
nets in lakes over 1,500 acres. Prior to 1993,
numbers of net sets were also dependent on
lake size, but were sometimes lower and varied
somewhat among fisheries management areas.
Catch rates from gill nets (i.e. numbers of
northern pike per overnight experimental net
set; CPUE) were used to track changes in ab-
undance over time within individual lakes.
Gill-net catch rates of northern pike have cor-
related with population estimates, and the utili-
ty of catch rates for monitoring changes in
relative abundance within a lake was previous-
ly described by Moyle (1950) and Pierce and
Tomcko (2003a).
Ice-out Trap Netting
Ice-out trap netting when northern pike
were staging for spawning, primarily during
April, was used as a second method for sam-
pling. Ice-out trapping was useful for capturing
large numbers of northern pike, but, unfortu-
nately, trap-net catch rates have not been use-
ful indices of abundance because they have not
correlated with population estimates (MNDNR
file data, Grand Rapids). Therefore, trap net-
ting was only used to measure size structure of
the northern pike populations. Trap nets were
0.75- or 1.0-inch bar mesh and each trap had
two throats, a 3-ft × 6-ft rectangular frame
opening into the trap, and a 40-ft lead that ex-
tended into shore. Ice-out trapping was consi-
dered specialized sampling and not part of
standard fish surveys. As a result, long-term
pre-regulation data were not available to con-
trast with post-regulation data because ice-out
trapping prior to the regulations consisted of
only 1-3 consecutive years of sampling. An
exception was Mille Lacs, which had 6 years
of pre-regulation trapping data. Ice-out trap-
ping was used in all regulation lakes but in
only seven of the reference lakes.
Creel Surveys
Creel surveys were used to identify
how recreational fisheries adjusted to experi-
mental regulations. Creel surveys were not
useful for determining changes in size struc-
ture of the northern pike populations because
the regulations affected sizes of fish kept by
anglers, and recollections from anglers about
sizes of fish they released were subjective. On-
ly a limited amount of creel information was
available for regulation lakes included in this
study, and even less from reference lakes.
Creel survey designs varied somewhat because
of differences in lake size, but typically in-
cluded instantaneous angler counts and angler

8
interviews during daylight hours. In addition,
surveys were stratified by season (such as win-
ter and early, middle, and late summer) and by
weekdays versus weekends and holidays. If
more than one creel survey was available for
pre-regulation or post-regulation sampling
years in a given lake, a single mean creel sur-
vey statistic for that lake and period was used
for calculating average creel survey statistics
across lakes.
Monitoring Changes in Size Structure
Long-term changes in size structure of
the northern pike populations were determined
by comparing proportions of fish 24 inches and
longer, and fish 30 inches and longer, between
pre-regulation and post-regulation periods. For
some of the regulations with lower or higher
length limits, changes in proportions of north-
ern pike 20 inches and longer or 36 inches and
longer were also evaluated. For determining
the influence of a regulation in an individual
lake, I used a repeated measures analysis that
accommodated within-year correlations in the
binary size structure data (Fleiss et al. 2003).
The analysis relied on AICc model selection
procedures (Burnham and Anderson 2002) to
choose between model m1 that allowed only
for year-to-year variation in the proportions of
fish in a length group, and model m2 that in-
cluded a fixed effect of the regulation along
with year-to-year variation. A generalized li-
near mixed effects modeling approach (Bolker
et al. 2008; Laplace approximation) using the
“lmer” function (Bates et al. 2008) in the sta-
tistical software package “R” (R Development
Core Team 2008) was used to fit models m1
and m2. If calculated AICc was lower for mod-
el m2 (with a regulation effect), then the length
regulation was judged to have influenced the
proportion of northern pike in a length class. A
difference in AICc ( i from Burnham and An-
derson 2002) >2 between models m1 and m2
was considered good evidence for a regulation
effect, whereas i <2 provided very weak sup-
port for the regulation effect. I did not calcu-
late Akaike weights and evidence ratios
(Burnham and Anderson 2002) for each of the
analyses, but because only two models were
used, weights and evidence ratios could be
readily calculated from i to examine the rela-
tive importance of the two models where i
<2. In cases where fewer than 10 fish were gill
netted in a particular year, length data from
that year were not used.
Pre-regulation periods were all sam-
pling years before the regulations were imple-
mented and post-regulation periods were all
sampling years at least 2 years after the regula-
tions were implemented (Tables 3, 4, and 5).
The same time periods were used for reference
lakes (Tables 3, 4, and 5). Confidence limits
for proportions of fish in each size category
were calculated with a quadratic formula
(Fleiss et al. 2003) that allowed for non-
symmetric confidence limits as proportions
approached 0% or 100%.
For maximum, minimum, and slot
length limits in small to moderate size lakes,
there were enough replicates of regulation and
reference populations to draw comparisons
between the two. I tested for initial differences
between regulation and reference populations
during the pre-regulation periods by comparing
size structures of the northern pike popula-
tions. Non-parametric Wilcoxon rank sum tests
were used to compare proportions of fish > 24
inches and > 30 inches in gill-net catches
(pooled across years) at regulation versus ref-
erence lakes during the pre-regulation periods.
Statistical evaluations of the effectiveness of
the regulations compared differences (changes
between pre- and post-regulation periods) in
the proportions of northern pike in each size
class between regulation and reference lakes.
Normality of the differences was checked with
normal probability plots and Shapiro-Wilk sta-
tistics (Zar 1984), then two-sample t tests or
Wilcoxon rank sum tests were used to test for
response differences between regulation versus
references lakes. Results were considered sig-
nificant if P<0.10.
A meta-analysis approach was used to
provide an overall assessment of the effective-
ness of length-based regulations for changing
the size structure of northern pike populations.
The approach treated northern pike regulation
lakes and their associated reference lakes as
four separate experiments: 1) maximum length
limit lakes, 2) minimum length limit lakes, 3)
slot length limits in moderate size lakes (20-
30-inch and 22-30-inch limits), and 4) slot

9
Table 3. Gill-net catch rates (CPUE) for northern pike, walleye, and yellow perch populations in lakes with maximum length limits for northern pike and reference lakes during pre-regulation and post-regulation sampling years.
Gill-net CPUE (SE)
Sampling years Northern pike Walleye Yellow perch Lake Pre Post Pre Post Pre Post Pre Post
Maximum Length Limits
Andrew 1980,1985,1988,1991,1995 2003,2007 7.3 9.8 15.1 13.3 30.2 24.5 (2.6) (5.4) (2.4) (1.1) (3.1) (10.5) Big Birch 1981,1986,1991,1995 1999,2003,2007 8.7 8.0 14.2 10.0 20.4 16.7 (2.2) (1.4) (3.3) (3.5) (8.9) (14.2) Big Swan 1981,1986,1991,1996 2000,2004 12.1 10.8 6.5 5.0 21.2 8.4 (0.7) (1.0) (0.6) (0) (5.2) (1.9) Burgen 1978,1983,1987,1992,1996 2000,2004 5.3 4.3 1.3 2.0 8.5 0.7 (1.1) (1.5) (0.4) (1.3) (3.8) (0.3) East Battle 1976,1983,1986,1989,1992,1996 2002,2005 9.5 9.4 9.2 7.7 12.5 1.3 (0.6) (2.2) (1.3) (1.4) (4.4) (0.8) Green 1979,1982,1986,1990,1991,1992 2002,2003,2004, 3.0 2.5 9.0 6.7 19.5 9.3 1993,1994,1995,1996 2005 (0.3) (0.2) (0.8) (1.0) (2.8) (4.1) Melissa 1982,1984,1989,1994 2000,2004 10.1 16.5 6.0 7.5 26.7 13.7 (2.7) (0.4) (1.0) (1.8) (6.3) (3.6) Rachel 1977,1982,1987,1992,1997 2002,2006 5.7 11.3 2.7 2.1 5.3 13.8 (1.6) (2.8) (1.4) (0.1) (1.6) (11.8) Sallie 1981,1984,1989,1994 2000,2004 10.4 16.4 6.2 15.3 51.8 43.0 (4.1) (4.6) (1.8) (11.0) (7.8) (10.5) Sturgeon 1979,1982,1986,1991, 2001,2006 10.4 4.9 6.5 2.2 14.1 4.0 (1.1) (1.4) (1.2) (0.9) (6.3) (3.9) Ten Mile 1978,1983,1988,1991,1994,1995 2000,2003,2006 9.2 8.1 8.4 8.4 15.6 11.6 (0.8) (1.2) (1.1) (1.0) (3.3) (2.2)
Reference Lakes
Big Floyd 1981,1986,1991,1996 2001 14.8 24.5 4.0 4.9 10.5 5.3 (2.6) (-) (0.6) (-) (4.3) (-) Big Pine 1979,1983,1986,1989,1992 1999,2002,2005 4.2 4.6 15.6 22.5 78.6 73.4 (0.4) (1.0) (1.2) (3.7) (11.2) (22.0) Black Hoof 1979,1984,1989,1994,1995 1999, 2004 11.4 15.1 3.7 6.0 25.9 17.8 (3.0) (3.6) (1.9) (3.3) (8.7) (13.5) Brophy 1975,1979,1984,1988,1992 2002,2006 13.0 9.0 3.2 2.8 1.1 0.1 (4.3) (2.2) (0.9) (0.2) (0.7) (0.1) Cotton 1981,1986,1991,1996 2001 8.4 18.9 7.5 9.3 16.5 21.6 (1.4) (-) (2.0) (-) (2.4) (-) Detroit 1979,1983,1986,1989,1992,1994 2003,2007 11.0 6.9 6.9 4.9 3.1 8.9 (1.9) (1.1) (0.5) (1.2) (1.2) (1.7) Le Homme 1979,1984,1985,1989,1992 2000,2004 8.6 7.0 6.0 6.3 13.6 1.5 Dieu (1.6) (1.8) (1.7) (1.2) (6.0) (0.6) Marion 1979,1983,1987,1990,1994 2000,2003,2006 4.4 9.9 5.0 9.6 71.5 18.8 (1.0) (1.2) (0.6) (1.9) (10.2) (1.5) Minnewaska 1976,1981,1986,1989,1992 2002,2006 2.6 4.2 11.3 9.0 104.4 41.2 (0.7) (0.4) (1.9) (0.1) (15.3) (13.1) North Lida 1982,1985,1988,1991,1993,1995 2000,2003,2006 3.2 4.7 9.8 11.4 17.2 8.6 (0.5) (0.2) (1.3) (1.4) (2.6) (4.1) Osakis 1981,1986,1989,1990,1994,1995 2001,2002,2003, 5.0 6.0 14.1 8.3 19.7 5.5 2006 (0.5) (0.9) (1.2) (1.3) (5.1) (2.3) Pine 1976,1983,1988,1991,1994 1999,2002,2005 3.9 5.3 6.8 6.7 34.2 34.4 Mountain (0.8) (1.1) (1.0) (1.4) (6.6) (14.9) Rush 1981,1985,1989,1992,1995 2001,2004,2007 3.1 3.2 11.6 10.6 15.9 10.0 (0.7) (0.5) (1.4) (1.7) (3.6) (7.3) Star 1982,1985,1988,1991,1994 2000,2003,2006 7.4 8.5 6.4 8.4 26.2 23.3 (1.3) (1.2) (0.4) (1.2) (7.0) (7.5) Steamboat 1980,1985,1990,1993 2000,2003,2006 4.8 5.4 5.9 5.4 38.9 70.3 (1.0) (0.4) (0.9) (1.0) (5.1) (21.2) Toad 1981,1986,1991,1996 2001,2006 10.3 12.0 14.2 12.6 6.0 2.7 (1.0) (5.7) (1.5) (3.1) (2.4) (0.2) Washburn 1983,1988,1993 2003 4.0 5.3 2.4 5.3 3.6 1.1 (0.7) (-) (0.3) (-) (1.2) (-)

10
Table 4. Mean gill-net catch rates (CPUE) and size structure (proportions of fish larger than designated sizes) of north-ern pike populations in reference lakes and lakes with minimum length limits, slot length limits, and a catch-and-release regulation (shaded), along with sample sizes (n) for the proportions.
Gill-net CPUE Northern pike size structure Years sampled (SE) % ≥ 24 inches % ≥ 30 inches n Lake Pre Post Pre Post Pre Post Pre Post Pre Post
Minimum Length Limits
Kelly-Dudley 1971,1983,1986, 2002,2006 4.7 8.5 11.8 39.2 0.7 2.9 153 102 1988,1993,1996 (0.8) (2.3) Reeds 1979,1984,1989, 2002,2006 11.8 6.4 10.2 71.9 0.6 12.5 167 64 1996 7.4) (1.4) St. Olaf 1970,1979,1981 2002,2006 0.9 9.0 28.6 50.9 5.7 1.9 35 53 1989,1990,1996 (0.3) (0.7) Roemhildts 1983,1985,1987, 2001,2006 3.6 5.0 27.6 25.0 5.2 0.0 58 20 1989,1993,1996 (0.7) (0.0) Auburn 1975,1980,1985, 2000,2006 12.1 8.6 14.7 30.1 0.3 3.9 320 103 1990,1995 (4.0) (1.6) Bavaria 1975,1980,1985, 2002,2007 6.3 7.4 18.6 37.2 3.2 9.3 156 86 1990,1995 (1.2) (4.4) Fish 1973,1978,1982, 2003 3.9 4.6 55.7 38.9 11.5 0.0 61 18 1987,1992,1997 (0.7) - Long 1976,1981,1986, 2001,2004, 3.1 7.0 31.2 55.6 1.3 14.3 77 126 1991,1996 2006 (1.1) (2.8) Medicine 1976,1981,1986, 2000,2004, 6.5 9.8 25.4 45.1 3.1 9.2 288 348 1991,1997 2006 (0.5) (1.7) Minnewashta 1974,1979,1984, 2001,2003, 13.9 19.8 9.9 14.1 2.8 1.9 252 617 1989,1994 2007 (4.1) (3.3) Riley 1976,1980,1985, 1999,2005 14.5 9.3 33.9 55.4 8.5 12.5 283 112 1990,1995 (4.5) (1.8) Sarah 1976,1981,1986, 2001,2007 14.1 8.8 27.6 62.4 5.4 26.2 388 149 1991,1996 (2.6) (1.7)
Slot Length Limits
Pelican 1977,1980,1986, 2001,2007 10.9 16.1 16.3 29.8 1.3 4.0 762 450 1989,1992,1995 (1.3) (6.l) Sturgeon 1975,1979,1984 2002 6.0 4.2 17.5 22.2 1.2 4.8 331 63 1990,1995 (0.7) (-) Lake-of-the-Woods 1984-1995 1999-2007 1.6 1.8 57.9 63.2 12.9 21.4 1,012 827 (0.2) (0.1) Mille Lacs 1983-1997 2002-2006 1.2 1.4 81.8 87.5 24.3 34.8 581 224 (0.1) (0.1) Leech 1983-1995 2000-2006 - - 22.1 20.3 4.5 3.0 2,152 1,248 Winnibigoshish 1983-1995 2000-2006 - - 30.5 20.4 2.6 2.8 2,457 1,781
Catch-and-Release
% ≥ 20 inches
Steiger 1978,1983,1988 1993,1998, 18.3 12.7 60.2 90.4 4.2 8.5 118 188 2003 (5.6) (0.9) Auburn 1975,1980,1985, 1990,1995, 8.0 13.4 43.3 72.9 0.8 1.3 120 303 2000,2006 (2.8) (4.6) Bavaria 1975,1980,1985, 1990,1995, 5.6 7.4 63.4 67.3 7.0 4.7 71 171 2002,2007 (0.7) (2.3) Fish 1973,1978,1982, 1992,1997, 3.9 4.0 87.5 87.2 5.0 12.8 40 39 1987 2003 (0.6) (1.3) Long 1976,1981,1986, 1991,1996, 1.5 6.4 94.7 85.9 5.3 9.8 19 184 2001,2004, (0.1) (1.7) 2006

11
Table 4. Continued Gill-net CPUE Northern pike size structure Years sampled (SE) % ≥ 24 inches % ≥ 30 inches n Lake Pre Post Pre Post Pre Post Pre Post Pre Post Medicine 1976,1981,1986, 1991,1997, 6.3 8.6 58.8 86.6 3.0 7.6 165 471 2000,2004, (0.9) (1.2) 2006 Minnewashta 1974,1979,1984, 1989,1994, 10.3 18.8 33.8 44.6 5.2 1.7 77 960 1998, 2001 (2.9) 2003,2007 Riley 1976,1980,1985, 1990,1995 15.8 11.0 34.9 82.1 3.0 14.4 166 229 1999,2005 (8.1) (1.2) Sarah 1976,1981,1986, 1991,1996, 15.3 10.5 62.2 88.8 4.1 15.9 217 320 2001,2007 (2.7) (2.9)
Table 5. Gill-net catch rates (CPUE) for northern pike, walleye, and yellow perch populations in reference lakes and
moderate size north-central lakes with slot length limits (shaded) for northern pike during pre-regulation and post-regulation sampling years.
Gill-net CPUE (SE)
Sampling years Northern pike Walleye Yellow perch Lake Pre Post Pre Post Pre Post Pre Post Coon- 1976,1979,1984,1990 1995,2000,2005 8.5 9.2 1.3 0.9 8.7 13.3 Sandwick (1.5) (1.4) (0.9) (0.1) (2.7) (1.0) Medicine 1970,1980,1986,1988 1993,1998,2003 12.0 7.4 5.9 5.3 6.6 14.5 (2.9) (1.1) (2.1) (1.8) (1.6) (3.9) North Twin 1970,1978,1985,1988 1993,1998,2003 10.9 8.9 4.4 4.4 10.2 8.9 (1.8) (0.5) (1.2) (1.3) (1.8) (3.6) Sissabagamah 1980,1986,1989 1994,1999,2004 7.5 6.6 0.9 1.7 1.0 0.4 (1.0) (0.8) (0.7) (0.3) (0.9) (0.1) Wilkins 1977,1985,1989 1994,1999,2004 7.1 6.5 3.8 3.5 1.8 0.7 (1.4) (1.6) (1.2) (1.0) (1.4) (0.7) Bagley 1978,1985 1993,2004 13.5 9.8 0.3 2.3 33.6 18.4 (1.5) (0.5) (0.3) (1.3) (1.4) (13.6) Beauty 1974,1979,1985 1991,1998,2005 4.1 6.4 0.0 4.1 2.4 1.0 (1.0) (1.7) (0.0) (0.3) (2.3) (0.6) Big Bass 1973,1982,1987 1997,2002 11.9 11.6 2.6 4.7 5.7 16.0 (2.7) (0.4) (0.5) (0.1) 1.2) (3.1) Big Island 1974,1979,1984 1990,2005 8.8 10.1 0.0 0.3 4.5 4.0 (1.3) (0.9) (0.0) (0.3) (0.6) (1.0) Big Sand 1978,1983,1990 1997,2005 9.1 12.1 2.8 3.3 25.8 24.7 (0.9) (2.4) (0.2) (0.1) (4.6) (11.1) French 1981,1989 1994,1999,2004 4.9 4.2 0.9 1.8 3.0 3.4 (2.3) (1.3) (0.3) (0.5) (2.2) (2.4) Grant 1969,1981,1987 1997,2005 12.8 14.6 0.0 0.2 7.3 4.5 (1.7) (2.2) (0.0) (0.2) (3.4) (2.1) Hanging 1977,1985,1990 1994,1998,2003 6.1 8.0 3.7 1.8 23.3 29.9 Kettle (2.1) (2.6) (1.8) (0.2) (15.2) (10.9) Hay 1980,1989 1994, 2004 8.6 8.4 0.1 0.0 6.2 5.1 (1.9) (0.9) (0.1) (0.0) (4.8) (0.6) Julia 1970,1975,1977,1983,1986 1991,1993,1996, 10.1 7.1 3.9 10.6 61.8 94.2 1988 2003 (3.3) (1.2) (1.0) (2.4) (15.9) (16.7) Lake-of-Isles 1971,1982,1991 1995,2001 7.5 10.1 2.2 2.1 3.7 7.2 (2.8) (0.6) (0.8) (0.3) (1.7) (1.3)

12
Table 5 continued __________________________________________________________________________________________ Gill-net CPUE (SE)
Sampling years Northern pike Walleye Yellow perch Lake Pre Post Pre Post Pre Post Pre Post Little Split 1975,1980,1985 1991,1996,2004 9.9 11.7 1.0 1.1 30.8 42.0 Hand (3.3) (1.3) (0.5) (0.3) (10.8) (14.5) Round 1985,1990 1994,1999 2.9 4.4 2.3 1.2 3.5 7.5 (0.8) (0.3) (0.8) (0.0) (0.7) (4.0) Ruby 1978,1983,1990 1996,2001,2004 8.9 9.3 2.8 4.4 10.3 4.7 (1.0) (1.1) (1.0) (1.7) (8.7) (1.0) Sandy 1970,1980,1985,1990 1996,2002 13.9 8.9 2.2 4.7 20.8 7.3 (1.6) (3.3) (0.6) (0.1) (6.5) (3.7) South Twin 1981,1987 1995,2000,2004 12.5 17.7 4.0 4.4 72.2 25.9 (6.9) (4.7) (0.4) (1.1) (40.9) (1.4) Sugar 1980,1985 1990,1996 11.1 7.1 2.0 2.9 3.9 4.1 (1.3) (1.6) (0.6) (0.4) (2.9) (1.3) Vanduse 1982,1987 1997,2002 14.6 16.9 0.0 0.0 13.3 5.5 (2.2) (1.4) (0.0) (0.0) (6.7) (2.3)
length limits that had upper bounds greater
than 30 inches in large lakes (Lake-of-the-
Woods, Mille Lacs, and Pelican Lake). The
response evaluated across all experiments was
the change in proportion of fish > 24 inches.
Since only one class of regulation was eva-
luated (length-based regulations), the meta-
analysis was reduced to a comparatively sim-
ple calculation of combined effect size for the
four experiments using a fixed effects model.
Statistical solutions for the model are detailed
in Gurevitch and Hedges (1993). In short, ef-
fect sizes (dj) were calculated for each experi-
ment that contrasted regulation and references
lakes in relation to a pooled standard deviation
of the differences, and a correction for small
sample bias. Variances of estimated effect siz-
es for each experiment (vj) were used to com-
bine effect sizes across experiments. The
cumulated effect size across experiments (d)
was an average weighted by reciprocals of the
vj. Confidence intervals for d were constructed
from the variance s2(d), which was the reci-
procal of cumulated weights across experi-
ments.
Shorter-term changes in northern pike
size structure were evaluated from ice-out trap-
net catches. Comparisons of size structure
were the same as for gill-net catches except
that only 1-3 consecutive years of pre-
regulation data were available from regulation
lakes, and there were few samples from refer-
ence lakes (Table 6). Evaluation of trap-net
catches also used repeated measures analyses
to identify changes in size structure within
each lake.
Monitoring Changes in Abundance
Long-term changes in abundances of
northern pike were measured using gill-net
catch rates. The average gill-net catch rate
each year (CPUE) was considered an indepen-
dent observation of relative abundance since
net surveys were typically about 5 years apart.
For maximum, minimum, and slot length lim-
its in small to moderate size lakes, I tested for
initial differences between regulation and ref-
erence populations during the pre-regulation
periods by comparing mean CPUE of the
northern pike populations. Non-parametric
Wilcoxon rank sum tests were used to compare
mean gill-net CPUEs from regulation versus
reference lakes during the pre-regulation pe-
riods. In individual lakes, CPUEs from pre-
regulation years were compared with post-
regulation years allowing at least 2 years lag
time after the regulations were implemented.
The difference between mean CPUE post-
regulation and mean CPUE pre-regulation was
considered the change in relative abundance of
northern pike for each lake. To test for effects
of the regulations, changes in relative abun-
dances for regulation lakes were compared
with changes for reference lakes using non-
parametric Wilcoxon rank sum tests. To ex-
amine the relationship between changes in
proportions of gill-netted northern pike > 24
inches and changes in CPUE among lakes,

13
Table 6. Size structure and sample sizes (n) for northern pike caught during ice-out trap netting from reference lakes and lakes with maximum length limits for northern pike during pre-regulation and post-regulation periods. Size structure for northern pike populations was described as proportions of trapped fish that were >24 inches and proportions that were >30 inches. Included are comparable data from lakes with minimum length limits and from very large walleye lakes with slot length limits for northern pike.
_______________________________________________________________________________________________ Years Sampled % ≥ 24 inches % ≥ 30 inches n
Lake Pre Post Pre Post Pre Post Pre Post
Maximum Length Limits Andrew 1994,1995,1996,1997 2001,2003,2004,2006 5.2 12.7 0.7 1.3 712 973 Big Birch 1993,1994,1996 2001,2003,2005,2007 14.6 14.4 0.4 2.1 465 2,680 Big Swan 1993,1994,1995,1997 2001,2003,2005,2007 12.8 36.3 1.9 9.6 740 658 Burgen 1995,1996,1997 2002,2004,2005 16.5 19.0 4.0 3.7 520 347 East Battle 1994,1995,1996 2000,2004,2006 3.3 2.2 0.6 0.3 672 720 Green 1994,1995,1996,1997 2001,2005,2006 24.3 43.8 4.5 11.7 2,323 1,527 Melissa 1997 2003,2006,2007 17.6 35.0 0.5 3.3 193 394 Rachel 1995,1996,1997 2002,2003,2005,2006 8.5 28.0 1.6 3.1 386 574 Sallie 1997 2004,2006,2007 59.5 73.0 7.4 11.1 215 189 Sturgeon 1994,1995 2002,2004,2005,2006,2007 4.6 8.2 0.7 2.9 564 2,776 Ten Mile 1994,1995,1997 2005,2007 13.1 22.1 1.2 2.9 723 375
Reference Lakes for Maximum Length Limits Black Hoof 1995,1996 1999,2001,2003 8.3 6.7 2.2 1.0 360 521 Detroit 1995,1996 2001,2003,2005,2007 3.2 10.1 0.0 0.7 279 417 Star 1994,1995,1996 2000,2002,2004,2006 5.6 1.7 0.3 0.0 320 474 Toad 1994,1995,1996 2000,2002,2004,2006 4.5 12.6 0.0 0.2 553 476 Washburn 1994,1995 2000,2002,2004,2006 3.3 1.5 0.6 0.3 478 791
Minimum Length Limits Kelly-Dudley 1996,1997,1998 2004,2005,2006 8.1 16.9 0.6 0.0 161 178 Reeds 1996,1997,1998 2004,2005,2006 20.5 36.1 1.4 1.4 73 144 St. Olaf 1996,1997,1998 2004,2005,2006 3.5 41.0 0.5 4.6 425 346
Slot Length Limits on Large Walleye Lakes Lake-of-the- 1995,1996 2001,2002,2003,2005 33.6 43.3 11.1 22.0 3,430 6,013 Woods Mille Lacs 1992-1998 2005,2006 49.6 67.4 17.7 28.8 13,155 12,261 _______________________________________________________________________________________________
information was pooled across all regulation
lakes except the two very large hard-water
lakes (Lake-of-the-Woods and Mille Lacs,
which had different regulation goals).
Fish Community Interactions
Gill-net catch rate data were also ob-
tained for walleye and yellow perch in regula-
tion and reference lakes for the experiments
with slot length limits (moderate size lakes)
and maximum length limits. The catch rate
data were used to determine if changes in ab-
undances of walleye and yellow perch were
related to changes in the northern pike popula-
tions. Catch rates were obtained in the same
years that northern pike were collected (Tables
3 and 5) and catch rates for these species re-
ceived the same statistical treatment as north-
ern pike catch rates. I also tested to see if
consistent shifts in sizes of yellow perch, a
preferred prey species, could be related to
changes in the northern pike populations. In-
formation about changes in size structure of
the yellow perch populations was obtained
during the maximum length limit experiment.
The response monitored was the proportion

14
of yellow perch > 8 inches in pre-regulation
versus post-regulation periods from both regu-
lation and reference lakes. Statistically, these
data were treated the same as northern pike
size structure data.
Results
Maximum Length Limits
Maximum length limits generally im-
proved the size structure of northern pike pop-
ulations by increasing proportions of large fish.
Compared with reference populations, signifi-
cant long-term increases were observed in per-
centages of northern pike > 24 inches (t=2.92;
df=14.8; P=0.01) and percentages of northern
pike > 30 inches (t=3.37; df=13.5; P<0.01) in
gill-net catches from regulation lakes (Figure
1). Normal probability plots and Shapiro-Wilk
statistics indicated that differences between
pre- and post-regulation size distributions were
normally distributed (all regulation and refer-
ence lakes were included). The average in-
crease in percentage of fish > 24 inches was
18% in maximum length limit lakes compared
with 2% in reference lakes. Not all of the regu-
lation lakes responded that well, however, as
there was a broad range of responses. The
changes in percentage of fish > 24 inches
ranged from a decline of 3% in Burgen Lake to
a surprisingly large increase of 50% in Lake
Sallie (Table 7). Of the 11 regulation lakes,
Andrew, Burgen, and East Battle lakes showed
no increase in percentage of fish > 24 inches in
the repeated measures analysis (AICc for model
m1 was lower than m2). The i for Big Birch
and Rachel lakes were only 0.4 and 1.8 respec-
tively, but i ranged from 2.3 to 14.4 in the
other lakes.
The average increase in percentage of
northern pike > 30 inches was 5.1% in regula-
tion populations compared with 0.7% in refer-
ence populations. In regulation lakes, the
responses varied from a decline of 0.1% of the
catch being > 30 inches to an increase of
13.1%. Repeated measures analysis for four of
the regulation lakes (Burgen, East Battle, Sal-
lie, and Ten Mile) did not indicate an increase
in percentage of pike > 30 inches. The i for
Andrew Lake was only 0.1, but other lakes had
i from 4.1 to 9.5. Comparisons of regulation
and reference populations during the pre-
regulation period suggested no significant dif-
ference in percentages of northern pike > 24
inches (Wilcoxon rank sum test P=0.41) or
percentages > 30 inches (P=0.12).
Shorter-term improvements in northern
pike size structure were also noted from ice-out
trap-net catches in lakes with maximum length
limits. Differences between pre- and post-
regulation samples were not always normally
distributed, so Wilcoxon rank sum tests were
used to compare regulation and reference pop-
ulations. The tests indicated significant in-
creases in percentages of northern pike > 24
inches (P=0.04) and also for fish > 30 inches
(P=0.01). The median increase in percent > 24
inches in regulation lakes was 9% (range of –
1% to 24%) compared with a decline of 2%
(range of –4% to 8%) in reference lakes (Table
6). The median increase in percent > 30 inches
was 1.7% (range of –0.3% to 7.7%) in regulation
lakes compared with a decline of 0.3% (range
of –1.3% to 0.7%) in reference lakes (Table 6).
Northern pike relative abundance did
not appear to change as a response to the max-
imum length limits. Pre-regulation differences
in gill-net CPUE were not evident between
reference and regulation populations (Wil-
coxon rank sum test P=0.28). Nor were consis-
tent increases or decreases in gill-net mean
CPUE observed after the regulations were
enacted and contrasted with CPUE changes in
the reference lakes (Wilcoxon rank sum test
P=0.42). Changes in mean CPUE ranged from
–5.5 to 6.4 fish/net in regulation lakes, and –
4.1 to 10.5 fish/net in reference lakes (Table
3). The median change in regulation lakes was
a decline of 0.5 fish/net whereas the median
change in reference lakes was an increase of
1.3 fish/net.
Minimum Length Limits
Minimum length limits protecting
northern pike up to 30 inches long increased
the percentages of fish longer than 20 inches
and longer than 24 inches, but those improve-
ments did not carry over into fish longer than
30 inches. Long-term analyses of gill-net
catches showed increases in percentages of
northern pike > 20 inches in all three lakes.

15
Figure 1. Mean changes ( 1 SE) between pre- and post-regulation periods in percentages
of northern pike 24 inches and 30 inches in lakes with maximum length limits for northern pike (labeled as Reg in the figure) and associated reference lakes (labeled as Refs). Data were from gill-net surveys.

16
Table 7. Size structure and sample sizes (n) for northern pike and yellow perch in gill-net catches from reference lakes and lakes with maximum length regulations for northern pike during pre-regulation and post-regulation periods. Size structure for northern pike populations was described as proportions of captured northern pike that were ≥ 24 inches and proportions that were ≥ 30 inches. Size structure for yellow perch populations was described as proportions of fish ≥ 8 inches.
_______________________________________________________________________________________________ Northern pike Yellow perch
% ≥ 24 inches % ≥ 30 inches n % ≥ 8 inches n
Lake Pre Post Pre Post Pre Post Pre Post Pre Post
Maximum Length Limits
Andrew 7.0 11.5 0.6 2.1 344 235 11.3 14.8 870 411 Big Birch 12.8 23.7 1.0 3.9 517 355 12.2 1.9 566 750 Big Swan 11.2 43.5 0.8 9.0 509 255 9.3 2.0 431 203 Burgen 12.3 9.6 0.7 3.2 146 52 8.9 62.5 316 8 East Battle 4.8 3.6 0.2 0.7 604 279 45.1 13.2 649 38 Green 21.5 59.7 4.9 18.0 344 139 10.6 4.7 2,260 446 Melissa 14.2 38.5 2.2 11.4 324 431 3.7 0.7 517 307 Rachel 13.8 32.0 1.3 6.9 152 203 3.4 0.0 175 248 Sallie 15.7 66.1 3.3 7.9 210 392 15.1 3.1 720 739 Sturgeon 5.6 21.4 1.3 8.9 395 112 7.0 1.1 316 87 Ten Mile 12.5 20.6 1.4 1.4 625 291 17.6 20.9 646 417
Reference lakes Big Floyd 7.0 15.4 2.1 3.6 386 195 31.0 11.9 281 42 Big Pine 31.8 39.7 7.3 9.6 192 209 20.1 10.7 657 3,302 Black Hoof 18.5 2.4 0.6 0.0 168 125 5.9 8.3 288 120 Brophy 5.5 12.0 0.0 0.0 235 108 4.5 0.0 22 1 Cotton 7.3 5.8 1.3 2.2 315 226 41.1 13.6 633 258 Detroit 6.9 20.2 0.7 1.9 692 208 7.7 9.4 286 266 Le Homme Dieu 19.7 31.0 3.1 4.2 421 168 12.4 5.6 574 36 Marion 32.3 15.8 1.6 2.3 248 444 8.7 6.2 829 846 Minnewaska 31.4 25.2 5.4 11.8 223 127 14.0 32.0 4,604 1,236 North Lida 18.0 20.8 2.9 4.2 245 212 3.7 3.4 912 386 Osakis 13.3 18.5 1.7 2.5 420 362 14.8 23.1 1,622 333 Pine Mountain 23.7 22.7 5.8 4.9 190 203 9.4 6.0 785 1,425 Rush 12.0 4.1 1.8 0.7 166 145 10.8 4.0 710 448 Star 10.5 5.2 2.9 1.3 545 381 17.2 7.6 951 1,047 Steamboat 19.2 42.3 5.5 8.3 219 241 24.8 5.6 767 3,165 Toad 7.1 8.8 1.2 0.7 254 307 14.1 4.1 220 74 Washburn 6.1 7.6 3.0 0.0 132 79 4.2 17.6 120 17
Percentages of fish > 20 inches increased from
43% to 85% ( i =14.1) in Kelly-Dudley Lake,
from 44% to 92% ( i =1.2) in Reeds Lake,
and 69% to 98% ( i =3.2) in St. Olaf Lake.
Percentages of fish > 24 inches in gill-net
catches (Table 4) showed increases following
regulation in Kelly-Dudley Lake (12% to 39%;
i =7.2), Reeds Lake (10% to 72%; i =2.1),
and St. Olaf Lake (29% to 51%; i =6.9).
None of these lakes showed evidence of in-
creasing percentages of fish > 30 inches from
the repeated measures analysis.
Shorter-term evaluations using ice-out
trapping showed similar results. All three lakes
provided some evidence for increases in per-
centages of northern pike > 20 inches and > 24
inches, but percentages of fish > 30 inches did
not necessarily change (Table 6). In Kelly-
Dudley Lake, percentages of fish > 20 inches
increased from 27% to 53% ( i =1.9), percen-
tages of fish > 24 inches increased from 8% to
17% ( i =1.9), and percentages > 30 inches
were 0.6% and 0.0%. In Reeds Lake, percen-
tages of fish > 20 inches increased from 48%
to 85% ( i =7.6), percentages > 24 inches

17
from 21% to 36% ( i =1.4), and percentages >
30 inches were 1.4% in both periods. In St.
Olaf Lake, percentages of northern pike > 20
inches increased from 10% to 76% ( i =5.7),
percentages > 24 inches from 4% to 41% ( i
=3.2), and percentages > 30 inches also in-
creased from 0.5% to 4.6% ( i =5.5).
Small sample sizes (i.e. number of
years sampled with gill nets; Table 4) perhaps
made it difficult to observe any changes in rel-
ative abundance that may have resulted from
the minimum length limits. Median gill-net
CPUEs before and after the regulations were
implemented were 4.5 and 8.5 pike/net (Wil-
coxon rank sum test P=0.29) in Kelly-Dudley
Lake, and 5.4 and 6.4 fish/net (P=0.80) in
Reeds Lake. While only significant at P<0.10,
there was some evidence of an increase in gill-
net CPUE from 0.6 to 9.0 fish/net in St. Olaf
Lake (P=0.07).
The local reference lake, Roemhildts
Lake, did not show the same long-term
changes in size structure or gill-net catch rates
of northern pike. No differences between per-
iods corresponding to pre- and post-regulation
were found in percentages of northern pike >
20 inches, or percentages > 24 inches (Table
4). Repeated measures analysis even provided
very weak evidence that percentages of fish >
30 inches may actually have declined in the
reference lake ( i =0.2; Table 4). Median
CPUEs were 3.0 fish/net pre-regulation and
5.0 fish/net post-regulation (Wilcoxon rank
sum test P=0.61).
An interesting result from reference
lakes in the Minneapolis metropolitan area was
that many of the reference northern pike popu-
lations showed substantial improvements in
size structure (Table 4). For example, changes
in proportions of fish > 24 inches ranged from
–17% to 35% but averaged 15% (95% confi-
dence interval = 3-28%) among the eight popu-
lations. Similarly, average increases were 15%
for proportions of fish > 20 inches and 5% for
fish > 30 inches. During the pre-regulation per-
iod, proportions of northern pike > 24 inches
and > 30 inches were not significantly different
between regulation and reference populations
(Wilcoxon rank sum tests P=0.35-0.48).
In spite of the increases observed in
reference lakes, the 30-inch minimum length
limits still performed fairly well until fish ex-
ceeded 30 inches. When the eight reference
lakes from the Minneapolis metropolitan area
were included with Roemhildts Lake in the
analysis, the regulation lakes still showed some
improvements in size structure compared with
the reference lakes (Figure 2). The average
increase in proportion of northern pike > 20
inches was 40% compared with an average
increase of 13% among reference lakes (t=-
2.82; df=10; P=0.02). Although only signifi-
cant at P<0.10, the increase in proportions of
northern pike > 24 inches (mean = 37%) also
tended to be greater than the average increase
across reference lakes (mean = 13%; t=-2.11;
df=10; P=0.06). No significant difference was
observed between regulation and reference
lakes in changes in proportions of fish > 30
inches (t=0.79; df=10; P=0.79). Altered size
structure did not translate into changes in rela-
tive abundance of northern pike as changes in
gill-net CPUE did not differ between regula-
tion and reference lakes (Table 4; Wilcoxon
rank sum test P=0.86). Nor were differences in
CPUE apparent between regulation and refer-
ence lakes during the pre-regulation period
(Wilcoxon rank sum test P=0.37).
Slot Length Limits in Moderate Size Lakes
Slot length limits in moderate size
lakes in north-central Minnesota produced re-
sults that were more difficult to interpret.
Three of the five regulation lakes showed large
improvements in size structure of their north-
ern pike populations during the long-term gill-
net sampling (Figure 3). Proportions of north-
ern pike > 20 inches increased from 14% to
56% ( i =12.7) in Medicine Lake, from 27%
to 58% ( i =3.5) in North Twin Lake, and
from 20% to 47% ( i =1.2) in Coon-Sandwick
Lake (Table 8). Proportions of fish > 24 inches
increased from 3% to 19% ( i =13.2) in Medi-
cine Lake, from 12% to 26% ( i =1.6) in North
Twin Lake, and from 11% to 23% ( i =3.0) in
Coon-Sandwick Lake . Evidence of an increase
from 16% to 28% of fish > 20 inches ( i =1.7)
was found in Lake Sissabagamah (Table 8),

18
Figure 2. Mean changes ( 1 SE) between pre- and post-regulation periods in percentages
of northern pike 20 inches, 24 inches, and 30 inches in lakes with 30-inch minimum length limits for northern pike (labeled as Reg in the figure) and asso-ciated reference lakes (labeled as Refs). Data were from gill-net surveys.

19
Figure 3. Pre-regulation versus post-regulation percentages of northern pike 20 inches or
22 inches, 24 inches, and 30 inches in moderate size north-central Minneso-ta lakes that had 20-30-inch or 22-30-inch protected slot length limits for northern pike. Data were from gill-net surveys.

20
Table 8. Size structure and sample sizes (n) for northern pike caught with gill nets from reference lakes and moderate size north-central Minnesota lakes with slot length limits for northern pike during pre-regulation and post-regulation periods. Size structure for northern pike populations was described as proportions of fish that were >20 inches and >30 inches.
% 20inches % 30 inches n Lake Pre Post Pre Post Pre Post
Slot Length Limits at Moderate Size Lakes Coon-Sandwick 19.8 47.3 3.1 3.9 318 330 Medicine 14.3 56.0 1.2 3.8 322 182 North Twin 27.1 58.4 3.3 4.5 332 245 Sissabagamah 15.9 28.2 1.3 3.4 157 174 Wilkins 41.6 36.4 3.4 0.5 149 184
Reference Lakes Bagley 29.6 23.0 1.9 1.1 108 87 Beauty 29.1 29.7 1.8 2.7 55 111 Big Bass 39.3 68.3 5.5 3.8 163 208 Big Island 42.0 66.1 7.1 3.6 112 112 Big Sand 24.8 51.2 0.4 2.3 246 217 French 25.8 38.1 1.5 0.0 66 97 Grant 35.4 47.4 2.4 2.6 209 156 Hanging Kettle 53.7 60.1 0.8 4.2 123 143 Hay 23.2 51.2 0.0 6.1 95 82 Julia 31.9 57.0 1.7 2.5 288 242 Lake-of-Isles 21.8 8.1 1.8 0.0 55 135 Little Split Hand 32.9 56.5 1.8 2.0 164 200 Round 16.7 32.1 0.0 1.9 54 53 Ruby 33.8 56.9 4.5 6.1 133 181 Sandy 67.0 32.7 2.9 5.6 206 107 South Twin 45.3 52.7 7.0 5.0 86 319 Sugar 20.9 25.2 1.4 3.4 139 119 Vanduse 9.0 30.5 3.4 4.4 145 203
but evidence was not found for increasing pro-
portions > 24 inches. The Wilkins Lake north-
ern pike population had much better size
structure than other lakes prior to the regula-
tion, with 42% of gill-net catches > 20 inches
(compare the panels in Figure 3). After the
regulation, no improvements were observed in
northern pike size structure in Wilkins Lake.
Proportions of northern pike > 30 inches did
not improve with these slot length limits (with
the possible exception of Medicine Lake; i
=1.4; Table 8). No significant differences in
percentages of fish > 24 or > 30 inches were
observed between regulation and reference
populations during the pre-regulation period
(Wilcoxon rank sum tests P=0.15-0.87).
Similar results were obtained from ice-
out trap netting where the largest short-term
increases in northern pike size structure were
from Medicine, North Twin, Coon-Sandwick,
and Sissabagamah lakes (Table 9). Increases in
proportions of fish > 20 inches were 7% to
36% ( i =5.5) in Medicine Lake, 28% to 46%
( i =4.3) in North Twin Lake, 26% to 55% (
i =1.2) in Coon-Sandwick Lake, and 9% to
21% ( i =7.4) in Lake Sissabagamah. All the
northern pike populations except Wilkins Lake
showed increases in proportions of fish > 24
inches ( i =2.2-11.1). Lake Sissabagamah had
very weak evidence of an increase in the pro-
portion of fish > 30 inches from 0.4% to 1.2%
( i =1.7), but the other lakes had no apparent
change (Table 9). Wilkins Lake had no appar-
ent changes in any of the size structure catego-
ries.

21
Table 9. Size structure and sample sizes (n) for northern pike caught during ice-out trap netting from reference lakes and moderate size north-central Minnesota lakes with slot length limits for northern pike during pre-regulation and post-regulation periods. Size structure for northern pike populations was described as proportions of trapped fish that were >20 inches and proportions that were >30 inches.
Years Sampled % 20 inches % 30 inches n
Lake Pre Post Pre Post Pre Post Pre Post
Slot Length Limits at Moderate Size Lakes Coon-Sandwick 1990 1995,2004,2005 25.7 54.6 1.0 0.7 680 1,225 Medicine 1988 1993,2002,2003 7.0 35.7 0.1 0.3 939 1,693 North Twin 1988 1993,2002,2003 27.9 46.0 1.5 1.2 458 1,086 Sissabagamah 1989 1994,2004 8.7 20.7 0.4 1.2 1,270 859 Wilkins 1989 1994,2004 40.9 41.2 0.8 1.1 714 944
Reference Lakes French 1989 1994,2004 33.0 45.3 0.0 1.3 821 972 Julia 1988 1993,2002,2003 48.7 46.1 0.0 1.4 575 1,808
Reference lakes for these slot length
limits also showed substantial improvements in
northern pike size structure, and the improve-
ments appeared to begin in the 1990s. Refer-
ence lakes from the same ecological lake
classes and from the same geographic man-
agement areas as the slot length limit lakes
showed large amounts of variation in northern
pike size structure during the long-term gill-net
sampling (Table 8). However, across the 18
reference lakes there was an average increase
in proportions of northern pike > 20 inches of
11% (95% confidence interval = 3% to 20%),
and an average increase in proportions of pike
> 24 inches of 5% (95% confidence interval =
2% to 9%). Corresponding average increases
across the five regulation lakes were 22% for
fish > 20 inches and 14% for fish > 24 inches.
Increases in Medicine, North Twin, and Coon-
Sandwick lakes were well above the confi-
dence intervals for reference lakes. The in-
creases in Lake Sissabagamah were equivalent
to the average increase among reference lakes,
and the regulation in Wilkins Lake performed
poorly compared with increases in the refer-
ence lakes. In the final analysis, when results
from the five regulation lakes were compared
with results from the reference lakes, there
were no significant differences between im-
provements of the two groups (two sample
t=0.15-1.17; df=21; P=0.25-0.36 for the vari-
ous size categories).
Changes in relative abundance of
northern pike were not apparent in either the
regulation lakes or the reference lakes (Table
5). The average pre-regulation gill-net CPUE
across the five regulation lakes was 9.2 fish/net
(SE=1.0) compared with a mean post-
regulation CPUE of 7.7 fish/net (SE=0.6), with
no statistical evidence that this was a signifi-
cant difference (Wilcoxon signed rank test
P=0.49). Across the 18 reference lakes, mean
gill-net CPUE during the pre-regulation period
was 9.5 fish/net (SE=0.8), and was 9.9 fish/net
(SE=0.9) during the post-regulation period
(Table 5). In addition, no significant difference
was observed in gill-net CPUE between regu-
lation and reference lakes during the pre-
regulation period (Wilcoxon rank sum test
P=0.60).
Slot Length Limits in Lake-of-the-Woods, Mille
Lacs, and Pelican Lake
The slot length limit protecting 30-40-
inch northern pike in Lake-of-the-Woods
achieved the goal of preventing a decline in
fish of those sizes. The proportion of fish > 30
inches in long-term gill-net catches actually
increased from 13% to 21% ( i =5.4; Table 4)
while CPUE remained about the same (Wil-
coxon rank sum test P=0.54). Gill-net CPUE
during 1984-1995 averaged 1.6 fish/net
(SE=0.2) and was 1.8 fish/net (SE=0.1) during
22
1999-2007 (Table 4). Ice-out trapping data
were consistent with the increase in proportion
of fish > 30 inches ( i =0.5; Table 6); the in-
crease was particularly evident for female
northern pike (Figure 4). One potential concern
with the regulation in Lake-of-the-Woods has
been that it might focus harvest effort on fish
over 40 inches. In fact, a downward trend in
proportions of female northern pike > 40 inch-
es (males are seldom over 40 inches) was ob-
served between 1995 and 2000, but a high
catch of fish > 40 inches in 2005 confounded
that viewpoint (Figure 4).
In Mille Lacs, size structure of the
northern pike population has shown some
modest improvements even though the 24-36-
inch slot limit only affected recreational fish-
ing by non-band anglers, and did not apply to
tribal harvests. Gill netting and ice-out trap
netting provided some weak evidence for in-
creases in proportions of northern pike > 30
inches following implementation of the regula-
tion (Tables 4 and 6). Proportions of fish > 30
inches increased from 24% to 35% ( i =1.8) in
gill-net catches (Table 4) and 18% to 29% ( i
=1.2) in trap-net catches (Table 6). Proportions
of northern pike > 24 inches were very high in
Mille Lacs gill-net catches during both the pre-
and post-regulation periods (82%-88%). No
significant difference was observed in gill-net
catch rates for northern pike between 1983-
1997 and 2002-2006 (Wilcoxon Rank Sum
Test P=0.46).
Lake Winnibigoshish and Leech Lake,
the two other large walleye lakes used as refer-
ence lakes, tended to show the opposite trend
compared with Lake-of-the-Woods and Mille
Lacs, indicating degrading size structures over
the same time periods. In Lake Winnibigo-
shish, proportions of northern pike > 24 inches
declined from 31% to 20% ( i =5.8) whereas
proportions of fish > 30 inches did not appear
to change (2.6% versus 2.8%; Table 4). In
Leech Lake, proportions of fish > 24 inches
did not appear to change (22% versus 20%)
but proportions of fish > 30 inches showed
very weak support for a decline from 4.5% to
3.0% ( i =0.2; Table 4). Ice-out trapping data
were not obtained for these reference popula-
tions.
The slot limit of 24-32 inches in Peli-
can Lake seemed to improve the size structure
of that northern pike population as well. Long-
term gill-net sampling showed weak evidence
that proportions of fish > 24 inches increased
from 16% to 30% ( i =1.4; Table 4) while
proportions of fish > 30 inches increased from
1.3% to 4.0% ( i =3.6). Gill-net CPUE aver-
aged 10.9 fish/net (SE=1.3) before the regula-
tion and 16.1 fish/net (SE=6.1) after the
regulation. The highest CPUE was 22.2
fish/net in 2007, but because CPUE was highly
variable in the 2 years of post-regulation sam-
pling (Table 4), no significant difference was
found in gill-net CPUE from pre- versus post-
regulation years (Wilcoxon rank sum test
P=0.29). No pre-regulation ice-out trapping
data were available for Pelican Lake. A com-
parison of ice-out trapping data from early
years of the regulation (1999-2001) versus later
years (2006-2007) indicated no differences in
proportion of northern pike > 24 inches (20%
versus 22%) or > 30 inches (2.5% for both pe-
riods). The reference lake, Sturgeon Lake, only
showed weak evidence for an increase in
northern pike over 30 inches. In Sturgeon
Lake, proportions of gill-netted fish > 24 inch-
es were 18% during the pre-regulation period
and 22% after the regulation. Proportions of
fish > 30 inches were 1.2% during the pre-
regulation period and 4.8% after ( i =0.7).
Unfortunately, sample sizes of fish during the
post-regulation period were relatively small in
Sturgeon Lake (Table 4).
Meta-analysis for Length-based Regulations
The meta-analysis suggested that, in
general, length-based regulations had a very
large effect on northern pike population size
structure. Calculated effect sizes (dj) and var-
iances (vj) for each group of regulations were
dmax =1.22 (vmax = 0.18) for the maximum
length limits, dmin = 1.30 (vmin = 0.51) for the
minimum length limits, dmslots = 0.45 (vmslots =
0.26) for the slot limits in moderate size lakes,
and dlslots = 1.37 (vlslots = 0.82) for the slot
length limits in large lakes (where the upper
bounds of the slot were greater than 30 inches).
The cumulated weighted effect size across all
four types of length-based regulations was d =
1.01 (sd = 0.28). The 95% confidence interval

23
Figure 4. Percentages of northern pike 30 inches and percentages of female northern
pike 40 inches in ice-out trap-net catches each year from Lake-of-the-Woods.

24
for d was 0.46 to 1.56. In comparison, the con-
ventional interpretation of effect sizes in eco-
logical experiments is that 0.2 is a small effect,
0.5 is a medium effect, 0.8 is large, and effects
greater than 1.0 are very large (Gurevitch and
Hedges 1993).
Catch-and-Release
The catch-and-release regulation in
Steiger Lake produced increases in proportions
of intermediate-size northern pike that were
equivalent to increases produced by some of
the length-based regulations. Increases in pro-
portions of northern pike > 20 inches were
found in the gill-net catches. In the case of
Steiger Lake, sampling during the first year of
the regulation (1988) was included with pre-
regulation data to increase sample sizes for
pre-regulation information. Proportions of gill-
netted fish > 20 inches were 60% during 1978-
1988 and 90% during 1993-2003 (Table 4; i
=3.8). Proportions of fish > 24 inches may
have also increased from 25% to 60% ( i
=0.4), but repeated measures analysis for pro-
portions of fish > 30 inches did not show evi-
dence of a regulation effect (4.2% versus
8.5%). Gill-net catch rates were variable
among years (Table 4), and, as a result, did not
seem to change significantly. Average gill-net
catch rate during 1978-1988 was 18.3 fish/net
(SE=5.6) compared with 12.7 fish/net
(SE=0.9) during 1993-2003 (Wilcoxon rank
sum test P=0.60).
Ice-out trapping during the first 2
years of the regulation also showed some very
weak evidence for smaller northern pike size
structure compared with later years of regula-
tion. Trapping during 1988-1989 showed pro-
portions of fish > 20 inches to be 72%
compared with 88% during 1991-2004 ( i
=0.8) and proportions of fish > 30 inches were
4.9% compared with 11.3%; i =0.5). Re-
peated measures analysis did not indicate a
regulation effect for proportions of fish > 24
inches (31% versus 52%).
Gill-net catches from eight reference
lakes in the Minneapolis metropolitan area also
showed increases in northern pike size struc-
ture, but increases in proportions of fish over
20 and 24 inches seemed to be greater in
Steiger Lake than in the references (Table 4).
In reference lakes, the average increase in pro-
portion > 20 inches was 17% (95% confidence
interval = 1% to 33%) and the average increase
in proportion of fish > 24 inches was 12%
(95% confidence interval = -1% to 25%). Pro-
portions of large fish > 30 inches also seemed
to increase in the reference lakes (mean in-
crease = 4%; 95% confidence interval = 0% to
9%). Meanwhile, gill-net CPUE seemed to
decline in Steiger Lake more than in the refer-
ence lakes (Table 4). The decline in Steiger
Lake between pre- and post-regulation periods
was 5.6 fish/net compared with an average in-
crease of 1.7 fish/net in reference lakes (95%
confidence interval for the changes in CPUE
among reference lakes was –2.3 to 5.6
fish/net).
Creel Survey Statistics
Creel survey statistics placed results
from the regulations in the context of the mag-
nitude of fishing effort and harvest rates found
in recreational fisheries for northern pike in
Minnesota lakes. Estimated annual recreational
fishing efforts prior to regulations ranged from
6.6 to 33.9 angler-hrs/acre among six small to
moderate size reference lakes (the average
among lakes was 21 angler-hrs/acre; Table 10).
Corresponding estimates of northern pike
harvest ranged from 0.3 to 1.6 fish/acre (0.9 to
3.2 lb/acre) among the reference lakes and the
average harvest was 0.9 fish/acre (1.8 lb/acre;
Table 10). Among 13 lakes that received max-
imum or slot length limits, estimated fishing
efforts prior to regulation ranged from 8.4 to
37.9 angler-hrs/acre with an average across
lakes of 24.5 angler-hrs/acre (Table 10). Esti-
mates of northern pike harvest prior to the reg-
ulations were 0.1 to 3.6 fish/acre (0.3 to 4.6
lb/acre) and averaged 1.1 fish/acre (2.2
lb/acre).
Post-regulation creel surveys were ob-
tained at 13 of the lakes, but only 2 were refer-
ence lakes. Post-regulation estimates of fishing
effort ranged from 5.7 to 34.0 angler-hrs/acre
with an average of 16.2 angler-hrs/acre among
the 11 regulation lakes (Table 10). Mean de-
cline in fishing effort among the regulation
lakes was 8.2 angler-hrs/acre (paired t=-3.76;
df=10; P<0.01). For the two reference lakes,
25
Table 10. Estimates of fishing effort and northern pike harvest from creel surveys at lakes with length regulations for northern pike and reference lakes. Years listed in italics are pre-regulation surveys and years listed in standard font are post-regulation surveys. Years with an asterisk denote creel surveys conducted only during the open-water season. The other creels list cumulative open-water and ice-fishing effort and harvest.
Fishing effort Northern pike harvest
Lake Year (angler-hrs/acre) fish/acre lbs/acre
Maximum Length Limits
Burgen 1995-96 28.8 0.7 1.5 Green 1995-96 19.0 0.3 1.0 2001* 5.7 0.02 0.04 2004* 6.9 0.03 0.08 2005 8.3 0.02 0.08 Melissa 1994-95 23.3 1.7 3.8 2003-04 12.5 4.1 10.1 Rachel 1995-96 21.5 1.1 2.5 1996-97 21.6 0.5 0.8 Sallie 1994-95 20.4 0.6 1.5 2003-04 18.2 3.0 9.0 Sturgeon 1995-96 33.2 1.4 3.3 2005* 19.4 0.3 0.8 Tenmile 1995* 10.9 0.1 0.4 1996* 8.4 0.1 0.3 2005* 6.2 0.01 0.01 2006 6.1 0.04 0.05
Slot Length Limits
Coon-Sandwick 1990-91 37.9 1.0 2.0 1995-96 25.7 0.4 0.6 2005* 7.9 0.4 0.7 Medicine 1988-89 32.3 3.6 4.6 1993-94 28.9 2.5 4.0 2003-04 16.7 0.8 1.5 North Twin 1988-89 21.7 0.9 3.1 1993-94 22.3 0.6 1.3 2003-04 18.7 0.4 0.8 Pelican 1993* 14.3 1.1 2.7 1994* 13.2 0.9 2.3 2007* 8.1 0.3 0.6 Sissabagamah 1989-90 35.8 1.7 2.1 1994-95 27.2 2.5 3.0 2005* 15.1 0.4 0.5 Wilkins 1989-90 21.7 0.7 1.6 1994-95 34.0 2.7 4.6 2005* 17.4 0.1 0.4
Reference Lakes
Detroit 1994-95 17.9 1.3 2.7 French 1989-90 32.3 1.4 2.4 1994-95 30.4 1.7 4.6 2003* 15.7 1.5 4.0 Julia 1988-89 16.4 1.3 3.0 1993-94 22.9 1.4 3.4 2003-04 20.1 0.6 1.1 Minnewaska 1995-96 26.9 1.6 3.2 1996-97 13.3 0.7 1.9 North Lida 1995-96 10.5 0.6 1.5 1996-97 6.6 0.3 0.9 Osakis 1995-96 33.9 1.1 2.3 1996-97 22.4 0.5 1.1

26
fishing effort averaged 22.3 angler-hrs/acre
during the post-regulation period. Estimated
post-regulation harvests of northern pike
ranged from 0.01 to 4.1 fish/acre (0.01 to 10.1
lb/acre) and averaged 1.2 fish/acre (2.7
lb/acre). Seven of the lakes showed declines in
harvests of northern pike (Table 10). In con-
trast, large increases in harvest were observed
at lakes Melissa and Sallie, where both relative
abundance and size structure of the northern
pike populations had increased. Catch rates in
lakes Melissa and Sallie were very high for
anglers who were specifically fishing for
northern pike; estimated catch rates were 0.8
and 0.6 fish/angler-hr, respectively, and angler-
released northern pike longer than 36 inches
were recorded for the first time during post-
regulation creel surveys.
While compliance with the regulations
was high in some lakes, lower compliance
rates were also observed in several lakes. From
questions asked of anglers during creel survey
interviews at lakes Melissa and Sallie, 97% of
summer anglers and 66-76% of winter anglers
were aware of the 24-inch maximum length
regulation and could recite it correctly (Erick-
son 2005). Creel clerks measured no illegal
fish from Lake Melissa and only two illegal
fish from Lake Sallie, indicating a high level of
compliance with the regulation. In the five
moderate size lakes with slot length limits, il-
legal fish averaged 13% of harvested northern
pike measured by creel clerks, and 19% of vo-
luntary tag returns from fish marked with plas-
tic anchor tags during spring 1993-1995
(details provided in Pierce and Tomcko 1998).
This level of noncompliance was observed 3-4
years after slot length limits were initiated, but
high rates of noncompliance were also ob-
served 10 years later (Moen 2004; Koski
2006). For example, illegal fish were 19.6% of
harvested northern pike measured by a creel
clerk in Coon-Sandwick Lake during 2005
even though angler awareness of the regulation
was relatively good. In Coon-Sandwick Lake
88.3% of anglers interviewed during 2005
were aware of the regulation, and of the aware
anglers, 82.2% could recite the regulation cor-
rectly (Koski 2006).
Despite high levels of noncompliance
in some lakes, exploitation of protected-size
fish would have been much greater without
regulations, as inferred from reference lakes
and regulation lakes prior to enactment of the
length limits. Length frequencies of creeled
northern pike showed that when regulations
were in effect, recreational anglers generally
released protected-size fish (Shavlik 2005;
Sewell 2006). The magnitude of potential sav-
ings in harvests from protective size limits was
illustrated at Pelican Lake, where length fre-
quencies of harvested and released fish showed
northern pike between 24 and 32 inches com-
posed 31-35% of the harvests during 1993-
1994 before the slot length limit was in effect
(Table 11; Burri 2008). After the slot length
limit was enacted, a 2007 creel census docu-
mented only one harvested fish over 24 inches
with 20% of released fish in the protected sizes
(Table 11). In two of the reference lakes
(French and Julia), an average of 57% of har-
vested northern pike documented in creel sur-
veys and 70% of tag returns were fish of sizes
that would have been protected by slot length
regulations (Pierce and Tomcko 1998). Creel
surveys coupled with tagging studies (Pierce
and Tomcko 1997) illustrated how slot length
limits significantly reduced exploitation rates
of northern pike > 20 inches compared with
those two reference lakes.
Fish Community Interactions
Overall changes in the northern pike
populations under slot or maximum length lim-
its did not seem to affect walleye and yellow
perch populations. One possible exception was
that increases in gill-net catch rates for north-
ern pike were correlated with increases in wal-
leye catch rates (r= 0.56; P=0.02; n=16 lakes;
Figure 5; Tables 3 and 5). Otherwise, differ-
ences between pre- and post-regulation gill-net
catch rates for northern pike did not corres-
pond with differences between pre- and post-
regulation catch rates of yellow perch (r= -
0.07; P=0.78) or changes in proportions of yel-
low perch > 8 inches (r= -0.11; P=0.75; Figure
5; Tables 3, 5, and 7). Nor did changes in the
proportions of northern pike > 24 inches corre-
late with differences between pre- and post-
regulation catch rates for walleye (r=0.44;
P=0.09), catch rates for yellow perch (r= -
0.27; P=0.32), or changes in proportions of

27
Table 11. Length frequency distribution of angler harvested and released northern pike in Pelican Lake, 1993, 1994, and 2007. The gray bar represents sizes of northern pike protected by the slot length limit during 2007.
Length 1993 1994 2007 (inches) Harvested Harvested Released Harvested Released <6.0 1 17 6.0 - 6.9 9 16 7.0 - 7.9 1 41 8.0 - 8.9 10 21 9.0 - 9.9 8 18 10.0 - 10.9 53 73 11.0 - 11.9 20 14 12.0 - 12.9 162 232 13.0 - 13.9 1 43 2 119 14.0 - 14.9 1 1 173 3 73 15.0 - 15.9 3 2 198 10 159 16.0 - 16.9 5 5 105 7 107 17.0 - 17.9 2 3 39 6 79 18.0 - 18.9 11 14 225 18 78 19.0 - 19.9 17 14 27 15 69 20.0 - 20.9 19 15 94 28 72 21.0 - 21.9 27 27 17 35 38 22.0 - 22.9 26 23 39 46 64 23.0 - 23.9 30 21 19 41 71 24.0 - 24.9 20 6 1 1 119 25.0 - 25.9 21 13 5 73 26.0 - 26.9 15 12 3 65 27.0 - 27.9 9 6 3 25 28.0 - 28.9 4 6 4 34 29.0 - 29.9 4 6 3 8 30.0 - 30.9 2 2 3 13 31.0 - 31.9 2 1 6 32.0 - 32.9 1 3 2 33.0 - 33.9 1 1 34.0 - 34.9 1 35.0 - 35.9 36.0 - 36.9 ____ ____ ____ ____ 1 Mean Length (inches) 22.8 22.9 15.7 20.7 17.5 n 218 183 1266 212 1,708 _______________________________________________________________________________________________
yellow perch > 8 inches in the gill-net catches
(r= -0.32; P=0.33; Figure 5; Tables 3, 5, and
7).
Enhanced proportions of large north-
ern pike did not appear to constrain northern
pike abundance via cannibalism. Changing
size structure in the regulated northern pike
populations did not cause corresponding trends
in relative abundance. Information was pooled
across all regulation lakes except the two very
large walleye fisheries (Lake-of-the-Woods
and Mille Lacs, which had different regulation
goals) to compare changes in proportions of
gill-netted northern pike > 24 inches and
changes in gill-net catch rates (Figure 6). The
changes in size structure were not correlated
with changes in gill-net catch rates (r=-0.03;
P=0.90; n=21 lakes). In all, altered northern
pike size structure at levels caused by the regu-
lations produced no trends in northern pike
relative abundance that led to predictable fish
community changes.
Discussion
Even though regulations did not work
in every lake, the broader-scale statewide find-
ing was that length regulations resulted in some

28
Figure 5. Fish community interactions at lakes with maximum length limits and moderate
size lakes with slot length limits for northern pike. Northern pike population metrics were changes between pre- and post-regulation gill-net catch rates and propor-tions of fish > 24 inches in gill-net catches. Walleye and yellow perch population metrics were changes between pre- and post-regulation gill-net catch rates, and for yellow perch, changes in proportions of fish > 8 inches in gill-net catches.
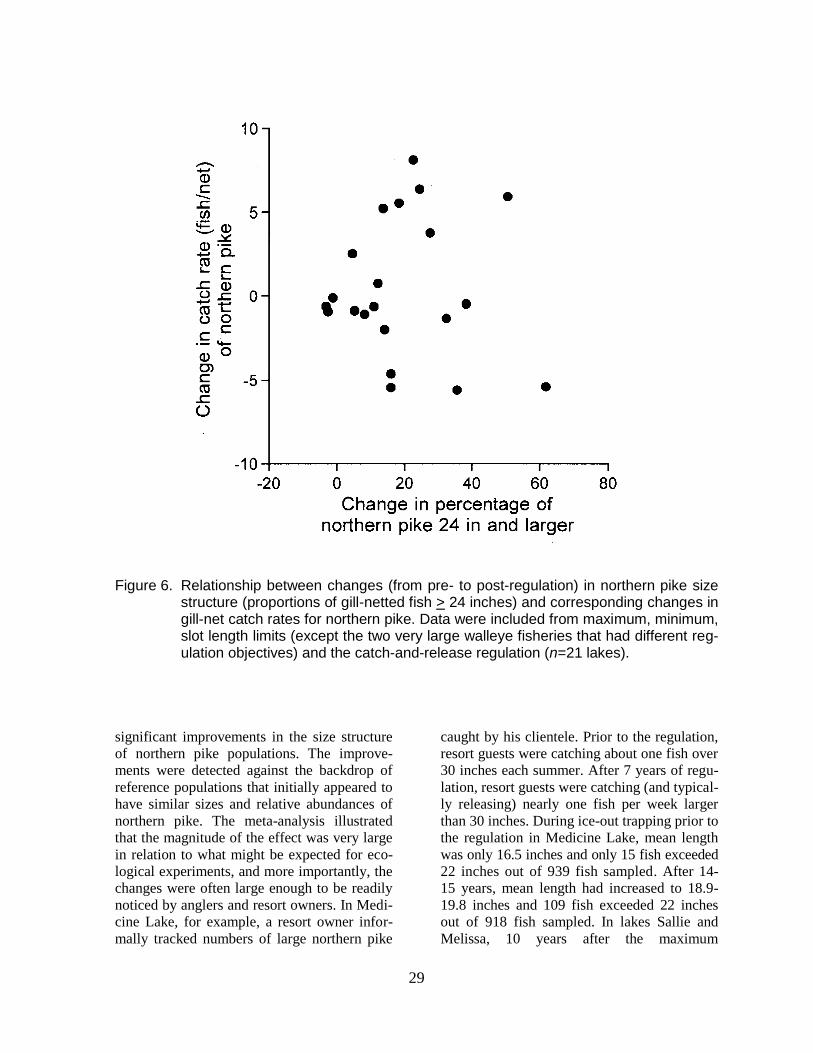
29
Figure 6. Relationship between changes (from pre- to post-regulation) in northern pike size structure (proportions of gill-netted fish > 24 inches) and corresponding changes in gill-net catch rates for northern pike. Data were included from maximum, minimum, slot length limits (except the two very large walleye fisheries that had different reg-ulation objectives) and the catch-and-release regulation (n=21 lakes).
significant improvements in the size structure
of northern pike populations. The improve-
ments were detected against the backdrop of
reference populations that initially appeared to
have similar sizes and relative abundances of
northern pike. The meta-analysis illustrated
that the magnitude of the effect was very large
in relation to what might be expected for eco-
logical experiments, and more importantly, the
changes were often large enough to be readily
noticed by anglers and resort owners. In Medi-
cine Lake, for example, a resort owner infor-
mally tracked numbers of large northern pike
caught by his clientele. Prior to the regulation,
resort guests were catching about one fish over
30 inches each summer. After 7 years of regu-
lation, resort guests were catching (and typical-
ly releasing) nearly one fish per week larger
than 30 inches. During ice-out trapping prior to
the regulation in Medicine Lake, mean length
was only 16.5 inches and only 15 fish exceeded
22 inches out of 939 fish sampled. After 14-
15 years, mean length had increased to 18.9-
19.8 inches and 109 fish exceeded 22 inches
out of 918 fish sampled. In lakes Sallie and
Melissa, 10 years after the maximum
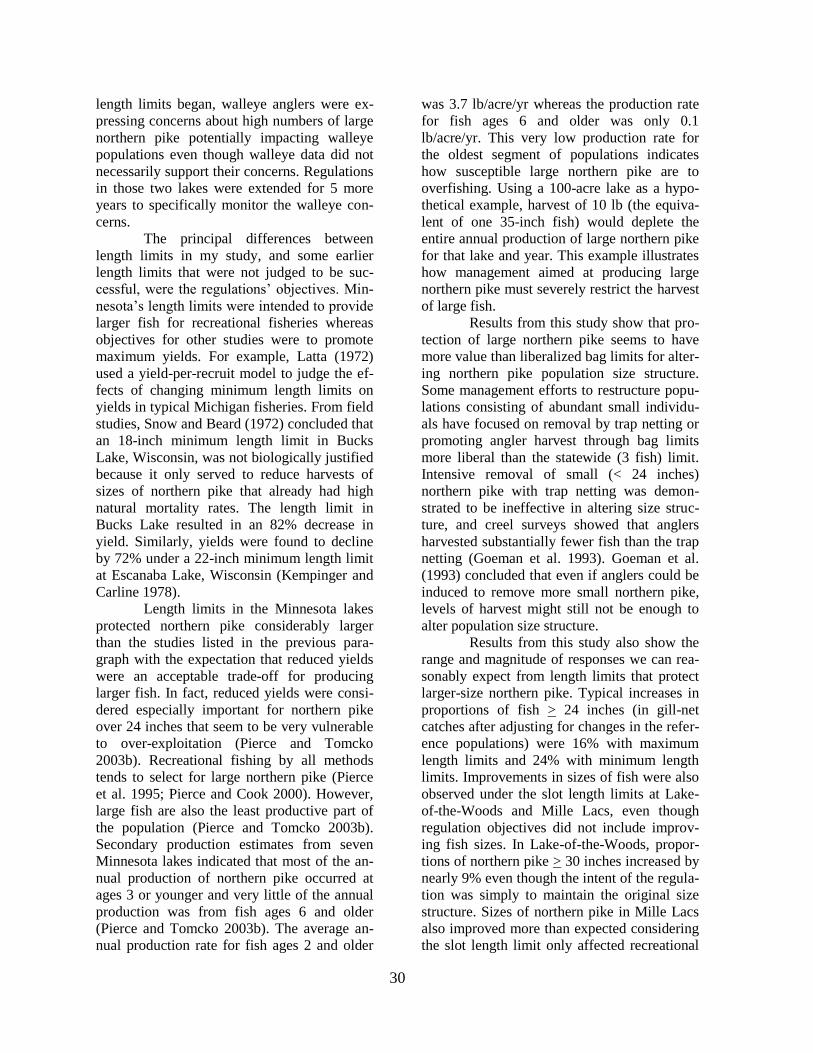
30
length limits began, walleye anglers were ex-
pressing concerns about high numbers of large
northern pike potentially impacting walleye
populations even though walleye data did not
necessarily support their concerns. Regulations
in those two lakes were extended for 5 more
years to specifically monitor the walleye con-
cerns.
The principal differences between
length limits in my study, and some earlier
length limits that were not judged to be suc-
cessful, were the regulations’ objectives. Min-
nesota’s length limits were intended to provide
larger fish for recreational fisheries whereas
objectives for other studies were to promote
maximum yields. For example, Latta (1972)
used a yield-per-recruit model to judge the ef-
fects of changing minimum length limits on
yields in typical Michigan fisheries. From field
studies, Snow and Beard (1972) concluded that
an 18-inch minimum length limit in Bucks
Lake, Wisconsin, was not biologically justified
because it only served to reduce harvests of
sizes of northern pike that already had high
natural mortality rates. The length limit in
Bucks Lake resulted in an 82% decrease in
yield. Similarly, yields were found to decline
by 72% under a 22-inch minimum length limit
at Escanaba Lake, Wisconsin (Kempinger and
Carline 1978).
Length limits in the Minnesota lakes
protected northern pike considerably larger
than the studies listed in the previous para-
graph with the expectation that reduced yields
were an acceptable trade-off for producing
larger fish. In fact, reduced yields were consi-
dered especially important for northern pike
over 24 inches that seem to be very vulnerable
to over-exploitation (Pierce and Tomcko
2003b). Recreational fishing by all methods
tends to select for large northern pike (Pierce
et al. 1995; Pierce and Cook 2000). However,
large fish are also the least productive part of
the population (Pierce and Tomcko 2003b).
Secondary production estimates from seven
Minnesota lakes indicated that most of the an-
nual production of northern pike occurred at
ages 3 or younger and very little of the annual
production was from fish ages 6 and older
(Pierce and Tomcko 2003b). The average an-
nual production rate for fish ages 2 and older
was 3.7 lb/acre/yr whereas the production rate
for fish ages 6 and older was only 0.1
lb/acre/yr. This very low production rate for
the oldest segment of populations indicates
how susceptible large northern pike are to
overfishing. Using a 100-acre lake as a hypo-
thetical example, harvest of 10 lb (the equiva-
lent of one 35-inch fish) would deplete the
entire annual production of large northern pike
for that lake and year. This example illustrates
how management aimed at producing large
northern pike must severely restrict the harvest
of large fish.
Results from this study show that pro-
tection of large northern pike seems to have
more value than liberalized bag limits for alter-
ing northern pike population size structure.
Some management efforts to restructure popu-
lations consisting of abundant small individu-
als have focused on removal by trap netting or
promoting angler harvest through bag limits
more liberal than the statewide (3 fish) limit.
Intensive removal of small (< 24 inches)
northern pike with trap netting was demon-
strated to be ineffective in altering size struc-
ture, and creel surveys showed that anglers
harvested substantially fewer fish than the trap
netting (Goeman et al. 1993). Goeman et al.
(1993) concluded that even if anglers could be
induced to remove more small northern pike,
levels of harvest might still not be enough to
alter population size structure.
Results from this study also show the
range and magnitude of responses we can rea-
sonably expect from length limits that protect
larger-size northern pike. Typical increases in
proportions of fish > 24 inches (in gill-net
catches after adjusting for changes in the refer-
ence populations) were 16% with maximum
length limits and 24% with minimum length
limits. Improvements in sizes of fish were also
observed under the slot length limits at Lake-
of-the-Woods and Mille Lacs, even though
regulation objectives did not include improv-
ing fish sizes. In Lake-of-the-Woods, propor-
tions of northern pike > 30 inches increased by
nearly 9% even though the intent of the regula-
tion was simply to maintain the original size
structure. Sizes of northern pike in Mille Lacs
also improved more than expected considering
the slot length limit only affected recreational

31
fishing by non-band anglers. These results
provide guidance for future management plan-
ning in individual lakes by giving a realistic
suite of expectations for length limits, includ-
ing the possibility that there will be no change
in fish sizes.
An important aspect of evaluating
length regulations is identifying factors causing
the regulations to fail. Unfortunately, no single
factor was implicated across all five lakes
(Andrew, Burgen, East Battle, Sissabagamah,
and Wilkins) where the regulations did not
improve size structure compared with refer-
ence lakes. Connections allowing fish move-
ment to and from other waters were a potential
factor. Lakes allowing the easiest migration of
northern pike were Burgen and Wilkins lakes,
and Wilkins Lake already had good size struc-
ture prior to the slot length limit (Figure 3).
East Battle Lake was also connected to other
waters, but the area fisheries manager sug-
gested that the extent of the connection was
not important for northern pike movement. Nor
did other differences in lake habitats consis-
tently affect results. Gill-net catch rates, which
give some indication of natural recruitment,
averaged 5.3-9.5 fish/net in lakes where regu-
lations failed, but fell within the range of catch
rates from other lakes where regulations
worked. East Battle Lake was historically
known for high recruitment and abundant
spawning and nursery habitat. Burgen Lake
had the smallest surface acreage used for
maximum length limits, but other lakes where
regulations failed were within the size range of
lakes where regulations worked. Nor did max-
imum depth or the amount of littoral habitat
seem to influence results.
Angler noncompliance was another
factor potentially influencing regulation results.
Giglioti and Taylor (1990) used a simulation
model to predict that effects of noncompliance
on legal harvests would vary by fish species,
and that illegal northern pike harvests of 20-
60% would reduce legal harvests by about 19-
47%. In my own work, noncompliance was
studied rigorously only in the moderate size
lakes with slot length limits (Pierce and
Tomcko 1998). Noncompliance was observed
first hand in Lake Sissabagamah, and rates of
noncompliance in Sissabagamah and Wilkins
lakes were relatively high. In those two lakes,
14-19% of fish measured during creel surveys
were illegal, and 21-29% of tag returns were
illegal fish (Pierce and Tomcko 1998). These
rates were not necessarily greater than rates in
North Twin and Coon-Sandwick lakes where
6-19% of creeled fish and 14-27% of tag re-
turns were illegal. Medicine Lake had the low-
est levels of noncompliance (5-7%; Pierce and
Tomcko 1998). Most fishing pressure on Med-
icine Lake was from a resort where the regula-
tion was actively promoted by the owners and
their clients. Building angler support and an
understanding of the value of length limits, as
witnessed at Medicine Lake, seemed to be as
important for compliance as enforcing the reg-
ulations.
Conversely, angler noncompliance and
hooking mortality rates for released fish were
not high enough to prevent length regulations
from affecting changes in northern pike size
structure in most lakes. Exploitation of pro-
tected-size fish was apparently greater in the
reference lakes (see Pierce and Tomcko 1998
for examples). Rates of hooking mortality were
not measured in this study, but a literature re-
view of previous studies found that average
hooking mortality for northern pike was less
than 5% (Tomcko 1997). Individual studies
covering various fishing methods reported
hooking mortality rates of 0-14%, although an
exceptionally high rate of 33% was found for
pike hooks (also known as Swedish hooks)
used in ice fishing (DuBois et al. 1994). Pike
hooks were not commonly used for ice fishing
in the Minnesota lakes. Telemetry studies with
northern pike in a German lake (Klefoth et al.
2008) showed that sublethal catch-and-release
impacts on behaviors such as movement and
habitat choice were short-term and reversible.
The lack of fish community responses
in my study was surprising considering the
magnitude of some northern pike population
changes, along with previous case studies
showing strong links between northern pike
predation and community dynamics. For ex-
ample, availability of yellow perch was likely
the most important biotic factor affecting
growth rate and body condition of northern
pike in Escanaba Lake, Wisconsin (Inskip and
Magnuson 1986). Establishment of the northern
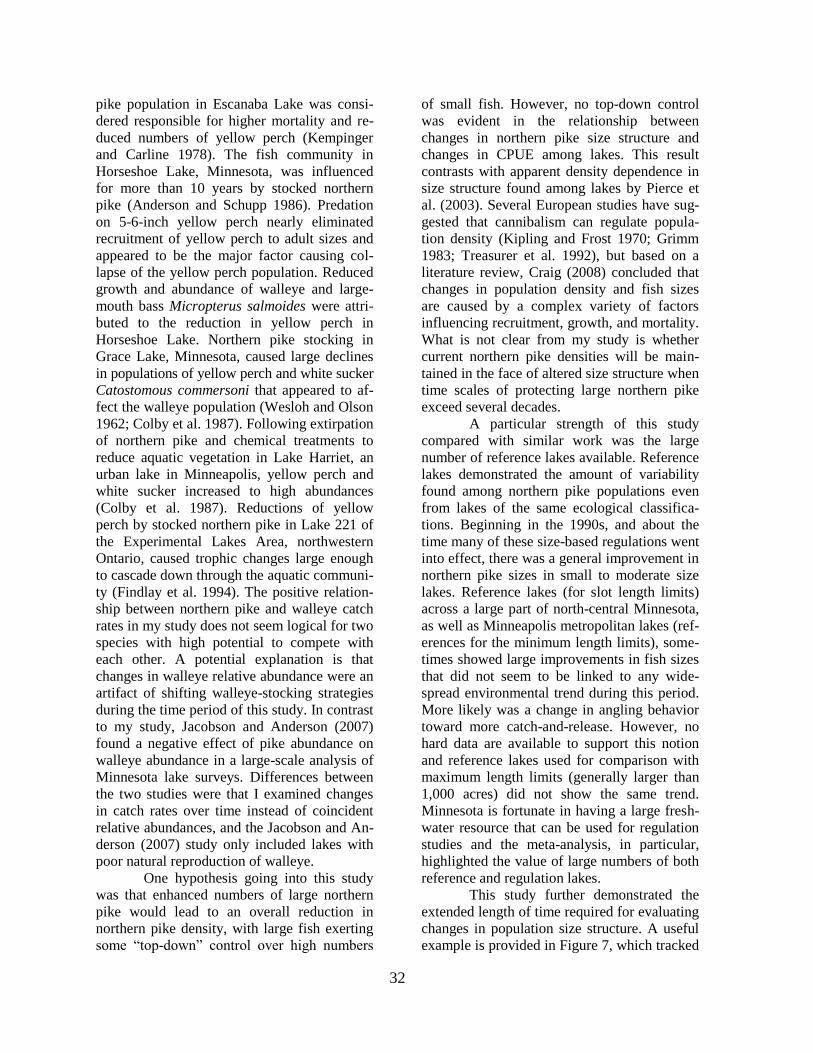
32
pike population in Escanaba Lake was consi-
dered responsible for higher mortality and re-
duced numbers of yellow perch (Kempinger
and Carline 1978). The fish community in
Horseshoe Lake, Minnesota, was influenced
for more than 10 years by stocked northern
pike (Anderson and Schupp 1986). Predation
on 5-6-inch yellow perch nearly eliminated
recruitment of yellow perch to adult sizes and
appeared to be the major factor causing col-
lapse of the yellow perch population. Reduced
growth and abundance of walleye and large-
mouth bass Micropterus salmoides were attri-
buted to the reduction in yellow perch in
Horseshoe Lake. Northern pike stocking in
Grace Lake, Minnesota, caused large declines
in populations of yellow perch and white sucker
Catostomous commersoni that appeared to af-
fect the walleye population (Wesloh and Olson
1962; Colby et al. 1987). Following extirpation
of northern pike and chemical treatments to
reduce aquatic vegetation in Lake Harriet, an
urban lake in Minneapolis, yellow perch and
white sucker increased to high abundances
(Colby et al. 1987). Reductions of yellow
perch by stocked northern pike in Lake 221 of
the Experimental Lakes Area, northwestern
Ontario, caused trophic changes large enough
to cascade down through the aquatic communi-
ty (Findlay et al. 1994). The positive relation-
ship between northern pike and walleye catch
rates in my study does not seem logical for two
species with high potential to compete with
each other. A potential explanation is that
changes in walleye relative abundance were an
artifact of shifting walleye-stocking strategies
during the time period of this study. In contrast
to my study, Jacobson and Anderson (2007)
found a negative effect of pike abundance on
walleye abundance in a large-scale analysis of
Minnesota lake surveys. Differences between
the two studies were that I examined changes
in catch rates over time instead of coincident
relative abundances, and the Jacobson and An-
derson (2007) study only included lakes with
poor natural reproduction of walleye.
One hypothesis going into this study
was that enhanced numbers of large northern
pike would lead to an overall reduction in
northern pike density, with large fish exerting
some “top-down” control over high numbers
of small fish. However, no top-down control
was evident in the relationship between
changes in northern pike size structure and
changes in CPUE among lakes. This result
contrasts with apparent density dependence in
size structure found among lakes by Pierce et
al. (2003). Several European studies have sug-
gested that cannibalism can regulate popula-
tion density (Kipling and Frost 1970; Grimm
1983; Treasurer et al. 1992), but based on a
literature review, Craig (2008) concluded that
changes in population density and fish sizes
are caused by a complex variety of factors
influencing recruitment, growth, and mortality.
What is not clear from my study is whether
current northern pike densities will be main-
tained in the face of altered size structure when
time scales of protecting large northern pike
exceed several decades.
A particular strength of this study
compared with similar work was the large
number of reference lakes available. Reference
lakes demonstrated the amount of variability
found among northern pike populations even
from lakes of the same ecological classifica-
tions. Beginning in the 1990s, and about the
time many of these size-based regulations went
into effect, there was a general improvement in
northern pike sizes in small to moderate size
lakes. Reference lakes (for slot length limits)
across a large part of north-central Minnesota,
as well as Minneapolis metropolitan lakes (ref-
erences for the minimum length limits), some-
times showed large improvements in fish sizes
that did not seem to be linked to any wide-
spread environmental trend during this period.
More likely was a change in angling behavior
toward more catch-and-release. However, no
hard data are available to support this notion
and reference lakes used for comparison with
maximum length limits (generally larger than
1,000 acres) did not show the same trend.
Minnesota is fortunate in having a large fresh-
water resource that can be used for regulation
studies and the meta-analysis, in particular,
highlighted the value of large numbers of both
reference and regulation lakes.
This study further demonstrated the
extended length of time required for evaluating
changes in population size structure. A useful
example is provided in Figure 7, which tracked

33
mean lengths of northern pike caught during
ice-out trapping at Coon-Sandwick Lake. The
15-year evaluation period illustrated in Figure
7 is not unreasonably long considering the life
span of individual northern pike in these lakes
can reach 11-14 years or longer, and regula-
tions protecting northern pike up to 40 inches
might require even longer evaluation periods.
Using modern aging techniques, Casselman
(1996) reported a northern pike from Lake
Athabasca, Saskatchewan, that was 29 years
old. Unfortunately, the fishing public tends to
demand quicker results that are not well
aligned with the life history of longer-lived
species like northern pike. Thus, when fish-
eries managers talk to the fishing public, we
need to stress the long time periods needed for
evaluating regulations, as well as promoting
the substantial value of conserving large fish
when the goal is to shift population size struc-
ture.
Figure 7. Mean lengths (+ 1 SE) of northern pike caught by ice-out trapping in Coon-
Sandwick Lake, 1990-2005.
34
References
Anderson, D. W., and D. H. Schupp. 1986.
Fish community responses to northern
pike stocking in Horseshoe Lake, Min-
nesota. Minnesota Department of Natu-
ral Resources, Section of Fisheries
Investigational Report 387, St. Paul.
Bates, D., M. Maechler, and B. Dai. 2008.
Lme4: linear mixed-effects models using
S4 classes. R package version 0.999375-
28. Available: http://lme4.r-forge.r-
project.org/.
Bolker, B. M., M. E. Brooks, C. J. Clark, S. W.
Geange, J. R. Poulsen, M. H. H. Stevens,
and J. S. White. 2008. Generalized linear
mixed models: a practical guide for
ecology and evolution. Trends in Ecol-
ogy and Evolution 24:127-135.
Burnham, K. P., and D. R. Anderson. 2002.
Model selection and multimodel infe-
rence a practical information-theoretic
approach, second edition. Springer
Science+Business Media, Inc. New
York.
Burri, T. M. 2008. Angler creel survey of Peli-
can Lake, St. Louis County, May 12,
2007 through September 30, 2007. Min-
nesota Department of Natural Resources,
Division of Fish and Wildlife Comple-
tion Report Job 786, F-29-R(P)-27. St.
Paul.
Casselman, J. M. 1996. Age, growth and envi-
ronmental requirements of pike. Pages
69-101 in J. F. Craig, editor. Pike biolo-
gy and exploitation. Chapman and Hall,
London.
Colby, P. J., P. A. Ryan, D. H. Schupp, and S.
L. Serns. 1987. Interactions in north-
temperate lake fish communities. Cana-
dian Journal of Fisheries and Aquatic
Sciences 44(Supplement 2):104-128.
Cook, M. F., and J. A. Younk. 1998. A histori-
cal examination of creel surveys from
Minnesota’s lakes and streams. Minneso-
ta Department of Natural Resources,
Section of Fisheries Investigational Re-
port 464, St. Paul.
Craig, J. F. 2008. A short review of pike ecol-
ogy. Hydrobiologia 601:5-16.
DuBois, R. B., T. L. Margenau, R. S. Stewart,
P. K. Cunningham, and P. W. Rasmus-
sen. 1994. Hooking mortality of northern
pike angled through ice. North American
Journal of Fisheries Management
14:769-775.
Erickson, M. L. 2005. Creel survey evaluation
of experimental northern pike regula-
tions on Lake Sallie and Lake Melissa,
summer 2003 and winter 2003-2004,
Becker County, Minnesota. Minnesota
Department of Natural Resources, Divi-
sion of Fish and Wildlife Completion
Report Job 702, F-29-R-24. St. Paul.
Findlay, D. L., S. E. M. Kasian, L. L. Hendzel,
G. W. Regehr, E. U. Schindler, and J. A.
Shearer. 1994. Biomanipulation of Lake
221 in the Experimental Lakes Area
(ELA): effects on phytoplankton and nu-
trients. Canadian Journal of Fisheries
and Aquatic Sciences 51:2794-2807.
Fleiss, J. L., B. Levin, and M. C. Paik. 2003.
Statistical methods for rates and propor-
tions, third edition. John Wiley and
Sons, Inc. Hoboken, New Jersey.
Gigliotti, L. M., and W. W. Taylor. 1990. The
effect of illegal harvest on recreational
fisheries. North American Journal of Fi-
sheries Management 4:106-110.
Goeman, T. J., and P. J. Radomski. 1997.
Statewide evaluation of experimental
fishing regulations based on ecological
lake classification. Minnesota Depart-
ment of Natural Resources, Section of
Fisheries Technical Report 1995-1997 to
the Legislative Commission on Minne-
sota Resources, St. Paul.
Goeman, T. J., D. W. Anderson, and D. H.
Schupp. 1990. Fish community responses
to manipulation of yellow perch and
walleye abundance. Minnesota Depart-
ment of Natural Resources, Section of
Fisheries Investigational Report 404, St.
Paul.
Goeman, T. J., P. D. Spencer, and R. B. Pierce.
1993. Effectiveness of liberalized bag
limits as management tools for altering
northern pike population size structure.
North American Journal of Fisheries
Management 13:621-624.

35
Grimm, M. P. 1983. Regulation of biomasses
of small (<41 cm) northern pike (Esox
lucius L.), with special reference to the
contribution of individuals stocked as
fingerlings (4-6 cm). Fisheries Manage-
ment 14:115-134.
Gurevitch, J., and L. V. Hedges. 1993. Meta-
analysis: combining the results of inde-
pendent experiments. Pages 378-420 in
S. M. Scheiner and J. Gurevitch, editors.
Design and analysis of ecological expe-
riments. Chapman and Hall, New York.
Inskip, P. D., and J. J. Magnuson. 1986. Fluc-
tuations in growth rate and condition of
muskellunge and northern pike in Esca-
naba Lake, Wisconsin. American Fish-
eries Society Special Publication 15:176-
188. Bethesda, Maryland.
Jacobson, P. C., and C. S. Anderson. 2007.
Optimal stocking densities of walleye
fingerlings in Minnesota lakes. North
American Journal of Fisheries Manage-
ment 27:650-658.
Kempinger, J. J., and R. F. Carline. 1978. Dy-
namics of the northern pike population
and changes that occurred with a mini-
mum size limit in Escanaba Lake, Wis-
consin. American Fisheries Society
Special Publication 11:382-389.
Kipling, C., and W. E. Frost. 1970. A study of
the mortality, population numbers, year
class strengths, production and food con-
sumption of pike, Esox lucius L., in
Windermere from 1944 to 1962. Journal
of Animal Ecology 39:115-157.
Klefoth, T., A. Kobler, and R. Arlinghaus.
2008. The impact of catch-and-release
angling on short-term behavior and habi-
tat choice of northern pike (Esox lucius
L.). Hydrobiologia 601:99-110.
Koski, K. 2006. Coon-Sandwick Lake creel
survey report for the summer season of
2005. Minnesota Department of Natural
Resources, Division of Fish and Wildlife
Completion Report Job 722, F-29-R(P)-
25. St. Paul.
Latta, W. C. 1972. To spear or not to spear the
northern pike in Michigan: a simulation
of regulations for fishing. Michigan
Academician 5:153-170.
Margenau, T. L., S. P. AveLallemant, D.
Giehtbrock, and S. T. Schram. 2008.
Ecology and management of northern
pike in Wisconsin. Hydrobiologia
601:111-123.
Moen, K. O. 2004. Summer and winter creel
surveys of Julia, Medicine, and North
Twin lakes, Beltrami County, Minnesota,
10 May 2003 – 15 February 2004. Min-
nesota Department of Natural Resources,
Division of Fish and Wildlife Completion
Report Job 703, F-29-R(P)-24. St. Paul.
Moyle, J. B. 1950. Gill nets for sampling fish
populations in Minnesota waters. Trans-
actions of the American Fisheries Society
79:195-204.
Moyle, J. B. 1956. Relationships between the
chemistry of Minnesota surface waters
and wildlife management. Journal of
Wildlife Management 20:303-320.
Olson, D. E., and P. K. Cunningham. 1989.
Sport-fisheries trends shown by an an-
nual Minnesota fishing contest over a
58-year period. North American Journal
of Fisheries Management 9:287-297.
Pierce, R. B., and M. F. Cook. 2000. Recrea-
tional darkhouse spearing for northern
pike in Minnesota: Historical changes in
effort and harvest and comparisons with
angling. North American Journal of Fi-
sheries Management 20:239-244.
Pierce, R. B., and C. M. Tomcko. 1997. Initial
effects of slot length limits for northern
pike in five north-central Minnesota
lakes. Minnesota Department of Natural
Resources, Division of Fish and Wildlife
Investigational Report 454, St. Paul.
Pierce, R. B., and C. M. Tomcko. 1998. Angler
noncompliance with slot length limits for
northern pike in five small Minnesota
lakes. North American Journal of Fishe-
ries Management 18:720-724.
Pierce, R. B., and C. M. Tomcko. 2003a. Vari-
ation in gill-net and angling catchability
with changing density of northern pike
in a small Minnesota lake. Transactions
of the American Fisheries Society
132:771-779.
Pierce, R. B., and C. M. Tomcko. 2003b. Inter-
relationships among production, density,
growth, and mortality of northern pike in

36
seven north-central Minnesota lakes.
Transactions of the American Fisheries
Society 132:143-153.
Pierce, R. B., C. M. Tomcko, and T. D. Kolan-
der. 1994. Indirect and direct estimates
of gill-net size selectivity for northern
pike. North American Journal of Fish-
eries Management 14:170-177.
Pierce, R. B., C. M. Tomcko, and T. L. Mar-
genau. 2003. Density dependence in
growth and size structure of northern pike
populations. North American Journal of
Fisheries Management 23:331-339.
Pierce, R. B., C. M. Tomcko, and D. H.
Schupp. 1995. Exploitation of northern
pike in seven small north-central Minne-
sota lakes. North American Journal of
Fisheries Management 15:601-609.
R Development Core Team. 2008. R: a lan-
guage and environment for statistical
computing. R Foundation for Statistical
Computing, Vienna, Austria. Available:
www.R-project.org.
Schupp, H. H. 1992. An ecological classifica-
tion of Minnesota lakes with associated
fish communities. Minnesota Depart-
ment of Natural Resources, Section of
Fisheries Investigational Report 417, St.
Paul.
Seaburg, K. G., and J. B. Moyle. 1964. Feed-
ing habits, digestive rates, and growth of
some Minnesota warmwater fishes.
Transactions of the American Fisheries
Society 93:269-285.
Sewell, D. 2006. Creel surveys of Sturgeon
Lake (58-0067) and Island Lake (58-
0062) during the 2005 open water an-
gling season May 14, 2005 to October
15, 2005. Minnesota Department of Nat-
ural Resources, Division of Fish and
Wildlife Completion Report Job 728, F-
29-R(P)-25. St. Paul.
Shavlik, C. E. 2005. Ten Mile Lake creel sur-
vey May 14 to September 30, 2005.
Minnesota Department of Fisheries and
Wildlife, Division of Fish and Wildlife
Completion Report Job 715, F-29-R(P)-
25. St. Paul.
Snow, H. E., and T. D. Beard. 1972. A ten-
year study of native northern pike in
Bucks Lake, Wisconsin, including eval-
uation of an 18.0-inch size limit. Wis-
consin Department of Natural Resources,
Technical Bulletin 56. Madison.
Tomcko, C. M. 1997. A review of northern
pike Esox lucius hooking mortality.
Minnesota Department of Natural Re-
sources, Division of Fish and Wildlife
Fish Management Report 32, St. Paul.
Treasurer, J. W., R. Owen, and E. Bowers.
1992. The population dynamics of pike,
Esox lucius, and perch, Perca fluviatilis,
in a simple predator-prey system. Envi-
ronmental Biology of Fishes 34:65-78.
Wesloh, M. L., and D. E. Olson. 1962. The
growth and harvest of stocked yearling
northern pike, Esox lucius Linnaeus, in a
Minnesota walleye lake. Minnesota De-
partment of Conservation, Division of
Game and Fish Investigational Report
242, St. Paul.
Zar, J. H. 1984. Biostatistical analysis, second
edition. Prentice-Hall, Inc. Englewood
Cliffs, New Jersey.