long-term ecosystem responses to the exxon valdez oil spill · exxon valdez oil spill 42 million...
TRANSCRIPT

LongLong--term Ecosystem term Ecosystem Responses to Responses to
the Exxon Valdez oil spillthe Exxon Valdez oil spillJ.L Bodkin, C.H. Peterson, S.D Rice, J.W. Short, J.L Bodkin, C.H. Peterson, S.D Rice, J.W. Short,
D.E. D.E. EslerEsler, B.E. Ballachey, D.B. Irons, B.E. Ballachey, D.B. Irons
Science 2003 v 302 :2082Science 2003 v 302 :2082--20862086
OutlineOutlineThe setting, the spill, acute effects and assumptionsThe setting, the spill, acute effects and assumptions
Shoreline/damage assessments Shoreline/damage assessments
Population assessmentsPopulation assessments
Delayed recoveries; why? Delayed recoveries; why?
Lingering oil and routes of exposureLingering oil and routes of exposure
Ecological cascadesEcological cascades
Revising oil pollution risk assessment Revising oil pollution risk assessment

PRINCE WILLIAM SOUNDPRINCE WILLIAM SOUND

Two Marine Ecosystem Components Two Marine Ecosystem Components
OffshoreNearshore
LINKS
DISTINCTIONS
Nutrient exchangeEgg/larvae/juvenile transportMigration/life cycles
Macroalgae-drivenBenthic inverts pathwaySpace limitedSubstrate importantDepth limits
Phytoplankton-drivenZoo/Fish pathwayNutrient limitedLight limitedExtreme depths
Nearshore Offshore

Offshore WebOffshore Web

Nearshore WebNearshore Web

Exxon ValdezExxon ValdezOil SpillOil Spill
42 million liters of crude oil spilled
March 24, 1989

100 Miles
Kodiak Is
Alaska P
eninsula
Kenai Pen.
Prince WilliamSound
Alaska
Gulf ofAlaska

The The Exxon ValdezExxon ValdezOil SpillOil Spill
Then and Now

-- Conventional assumptions about effects of oilConventional assumptions about effects of oilpollution on wildlife populations:pollution on wildlife populations:
- direct, acute effects are most important
250,000 dead seabirds, 3,000 dead sea otters

-- Conventional assumptions about effects of oilConventional assumptions about effects of oilpollution on wildlife populations:pollution on wildlife populations:
- direct, acute effects are most important
- oil is removed quickly by natural processes

-- Conventional assumptions about effects of oilConventional assumptions about effects of oilpollution on wildlife populations:pollution on wildlife populations:
- direct, acute effects are most important
- oil is removed quickly by natural processes
- therefore, long-term chronic oil exposureis not a problem, and affected populations should rebound from acute mortalities in a short period of time (months to a few years)
Not Necessarily………

Shoreline and Clean up and Shoreline and Clean up and Damage AssessmentDamage Assessment
1989-1991 assessments of oiled shorelines

Shoreline Assessment ResultsShoreline Assessment Results::1989: 2,000 km of oiled beach1992: 11 km of oiled beach,
1.15 ha subsurface oil (2.8 ac)
1992 Shoreline Assessment Conclusions:1992 Shoreline Assessment Conclusions:
Oil mostly in upper intertidalOil rapidly dispersing

Oil on PWS Beaches: 1989 Oil on PWS Beaches: 1989 –– 20012001(Actual (Actual and Projected)and Projected)
But some injured species But some injured species are not recovering, why ?are not recovering, why ?
0
2000
4000
6000
8000
10000
12000
14000
16000
18000
20000
1989 1990 1991 1992 1993 1994 1995 1996 1997 1998 1999 2000 2001
Year
Am
ount
Rem
aini
ng (m
^3)
Post SpillProjected

Nearshore Vertebrate PredatorsNearshore Vertebrate Predators1995

1995
NVP ApproachNVP Approach
Select top level nearshore predators that Select top level nearshore predators that represent:represent:
Birds and mammals Birds and mammals Invertebrate and fish trophic pathways, Invertebrate and fish trophic pathways, andand
Sample all populations in oiled and unoiled Sample all populations in oiled and unoiled areas (limited inference)areas (limited inference)

Study Areas

Types of DataTypes of Data
Have they recovered?Have they recovered?-- Population densityPopulation density-- Birth and survivalBirth and survival-- Health and conditionHealth and condition
Is it demography?Is it demography?-- Population modelsPopulation models
Is it food?Is it food?-- Prey abundancePrey abundance-- Predator conditionPredator condition-- Prey consumptionPrey consumption
Is it oil?Is it oil?-- CYP1ACYP1A-- Blood chemistryBlood chemistry-- HematologyHematology

How do we measure oil exposure?How do we measure oil exposure?
Cytochrome P450 1A (CYP1A) biomarker
• One of a family of enzymes involved in metabolism and detoxification
• Induced by recent exposure to polycyclic aromatic hydrocarbons (PAHs) and PCBs
• CYP1A is a sensitive and specific indicator of oil exposure

HARLEQUIN DUCK POPULATION TRENDSHARLEQUIN DUCK POPULATION TRENDSADFG Fall SurveysADFG Fall Surveys
1995 1996 1997
W. Prince William Sound (Oiled)
E. Prince William Sound (Unoiled)

0.7
0.8
0.9
MarchWeek
2 4 6 8 10 12 14 16 18 20 22 24 261 3 5 7 9 11 13 15 17 19 21 23 25October November December January February
Surv
ival
Pro
babi
lity
UnoiledOiled
1
Early Winter Mid Winter Late Winter
Adult Female Harlequin Duck SurvivalAdult Female Harlequin Duck SurvivalWinters 1995-96, 1996-97, and 1997-98Winters 1995-96, 1996-97, and 1997-98

Is it Food?Is it Food?
No difference in abundance of food at No difference in abundance of food at oiled and unoiled sitesoiled and unoiled sitesFood does not explain a significant Food does not explain a significant amount of variation in duck abundance amount of variation in duck abundance above that explained by other habitat above that explained by other habitat variablesvariables

Is it Oil?Is it Oil?
0
50
100
150
200
250
Montague Island (Unoiled)
Main Bay andCrafton Island (Oiled)
ERO
D A
ctiv
ity (p
mol
/min
/mg)
Average (Average (++ 95% CI) 95% CI) Cytochrome P450 1A Cytochrome P450 1A Induction in Harlequin Ducks - Winter 1998Induction in Harlequin Ducks - Winter 1998
Area

Sea Otter Recovery as of 1995Sea Otter Recovery as of 1995
Year
Estim
ated
pop
ulat
ion
size
0
50
100
150
200
Heavily oiled Knight Island
Minimum prespill Knight Island population size in 1989 (from Dean et al. 2000)
1989 1993 1994 1995

What can carcasses tell
us about survival?
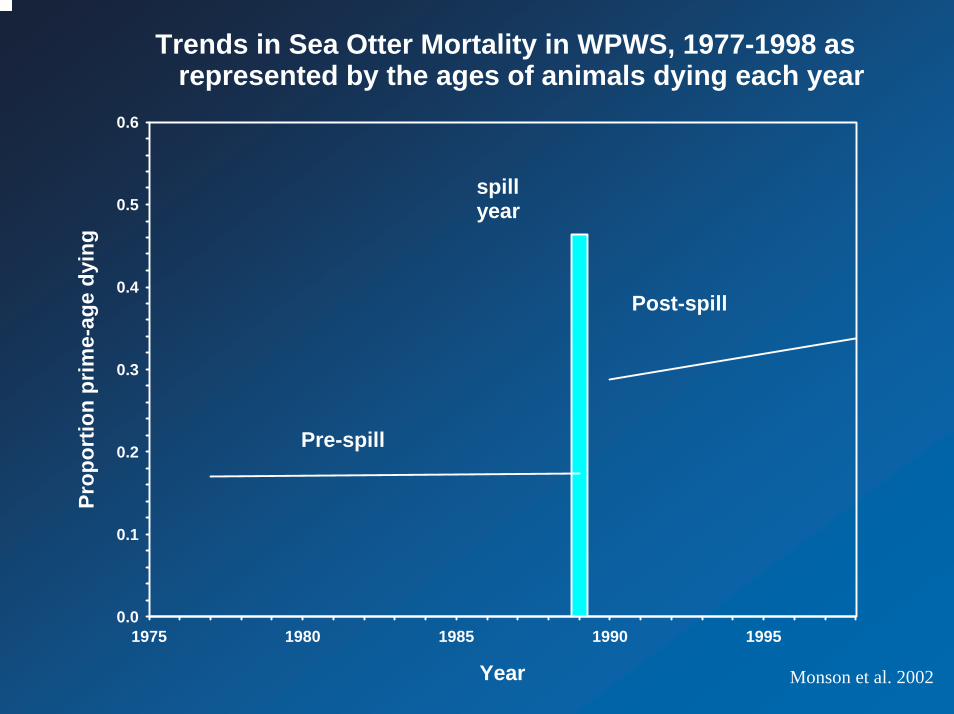
Trends in Sea Otter Mortality in WPWS, 1977-1998 as represented by the ages of animals dying each year
Year
1975 1980 1985 1990 1995
Prop
ortio
n pr
ime-
age
dyin
g
0.0
0.1
0.2
0.3
0.4
0.5
0.6
Pre-spill
spillyear
Post-spill
Monson et al. 2002

Sea otter population trends and predicted trajectories based on estimated survival rates
Year1993 1994 1995 1996 1997 1998
Prop
ortio
n
0.2
0.4
0.6
0.8
1.0
1.2
1.4
1.6
WPWS
Northern Knight Is
Monson et al. 2000

Measures of Food AvailabilityMeasures of Food Availability(all significantly > at oiled sites)(all significantly > at oiled sites)
(Kj/hr) (min/d) (g/cm)
0
500
1000
1500
2000
2500
Consumption Foragingefficiency
Condition
oiledunoiled
Dean et al. 2002

Is it Oil?Is it Oil?Oil exposure in WPWS sea otters, 1996-98, indicated by P4501A
Molecules of CYP1A mRNA/ng RNA
<55 < 10
10 < 15
15 < 20
20 < 25
25 < 30
30 < 35
35 < 40
40 < 45
45 < 50> 50
% o
f sea
otte
rs
0
10
20
30
40
90
100
Unoiled area (n=86)
Oiled area (n=71)

CYP1A Biomarker - Results from NVP Study
SpeciesSpecies 19961996 19971997 19981998
Sea ottersSea otters >> >>Harlequin ducks Harlequin ducks >>
River ottersRiver otters >> == ==
>>>>
>>
BarrowBarrow’’s Goldeneyess Goldeneyes
Masked GreenlingsMasked Greenlings >>
Pigeon guillemot chicksPigeon guillemot chicks ==Pigeon guillemot adultsPigeon guillemot adults(1999)(1999) >>

Nearshore RecoveryNearshore Recovery
Fish eaters Invert eatersRiver PigeonRiver PigeonOtter GuillemotOtter Guillemot
Harlequin SeaHarlequin SeaDuck OtterDuck Otter
Recovered? Yes No No No
Is it food? _ Yes No No Is it oil? _ Possibly Yes Yes

NVP Conclusions (1999)NVP Conclusions (1999)
SO/HADU share habits and habitats in the SO/HADU share habits and habitats in the nearshorenearshoreElevated mortality constraining recovery Elevated mortality constraining recovery Elevated biomarkers of oil exposureElevated biomarkers of oil exposureAccumulating evidence linking residual oil Accumulating evidence linking residual oil and continuing injuryand continuing injury

So what is the source and route of So what is the source and route of exposure?exposure?
Revisit shoreline assessment assumptionsRevisit shoreline assessment assumptionsRevisit sampling intertidal sedimentsRevisit sampling intertidal sediments
Continue monitoring exposure through Continue monitoring exposure through biomarkersbiomarkers
Investigate pathways of potential exposureInvestigate pathways of potential exposure

EL056A
EL056C
Site Photo
Oil residue in pit
2001Shoreline survey for residual EVOS oil

Stratified Random Sampling Grid
100 m12.5m
A B C D E F G H+4.6m
+1.8m
0.51.0
1.5
2.0
2.5
3.0
1/2 meterdrops
96 randomly selected
pit locations
Total # random pits = 6,775

2001 Subsurface Oil -Light Oil Residue
Moderate Oil Residue
Heavy Oil Residue
LOR MOR
HOR

Intertidal Subsurface Oil
2001 survey (+6ft)
Oil
Majority of Subsurface oil(+8.2ft – 3.3ft)
+16ft - 0ft
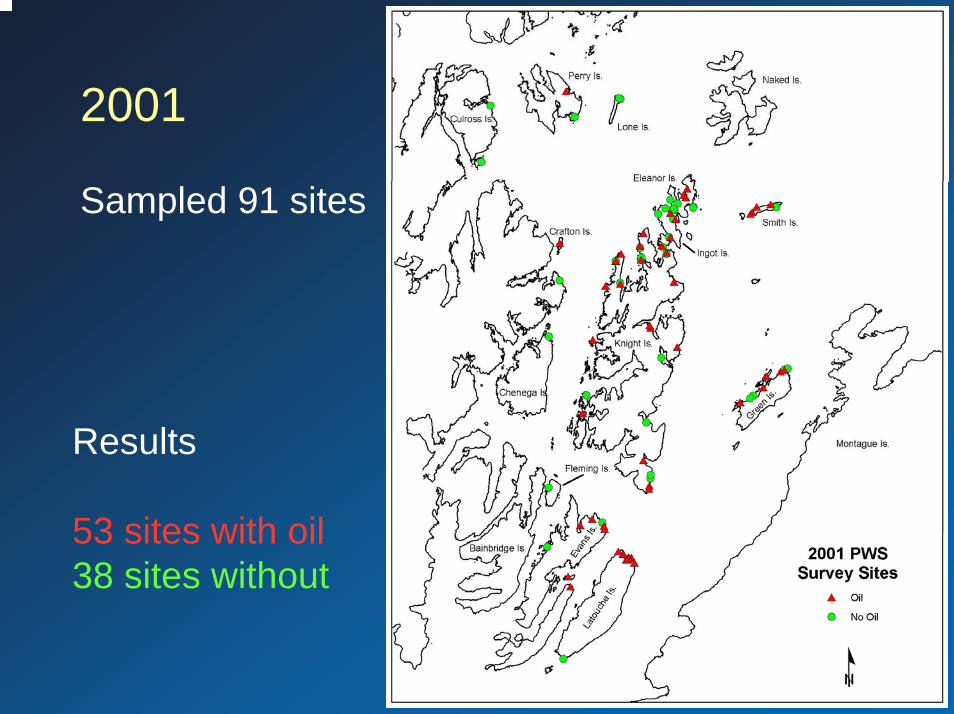
2001
Sampled 91 sites
Results
53 sites with oil38 sites without

Estimated Oiled Area 2001Estimated Oiled Area 2001Surface Oil: 4.13 ha (2.07 – 7.05 ha)
Subsurface Oil: 7.80 ha (4.06 – 12.7 ha)
Total: 11.3 ha (17.2 – 6.78 ha)
1992 estimate = 1.5 ha of subsurface oil

0
200
400
600
800
1000
1200
1400
1992 1993 1994 1995 1996 1997 1998 1999 2000 2001
Year
Amou
nt R
emai
ning
(m^3
)
Post Spill2001 ABL
Oil on PWS Beaches: 1992 Oil on PWS Beaches: 1992 –– 20012001(Projected (Projected vsvs Actual)Actual)
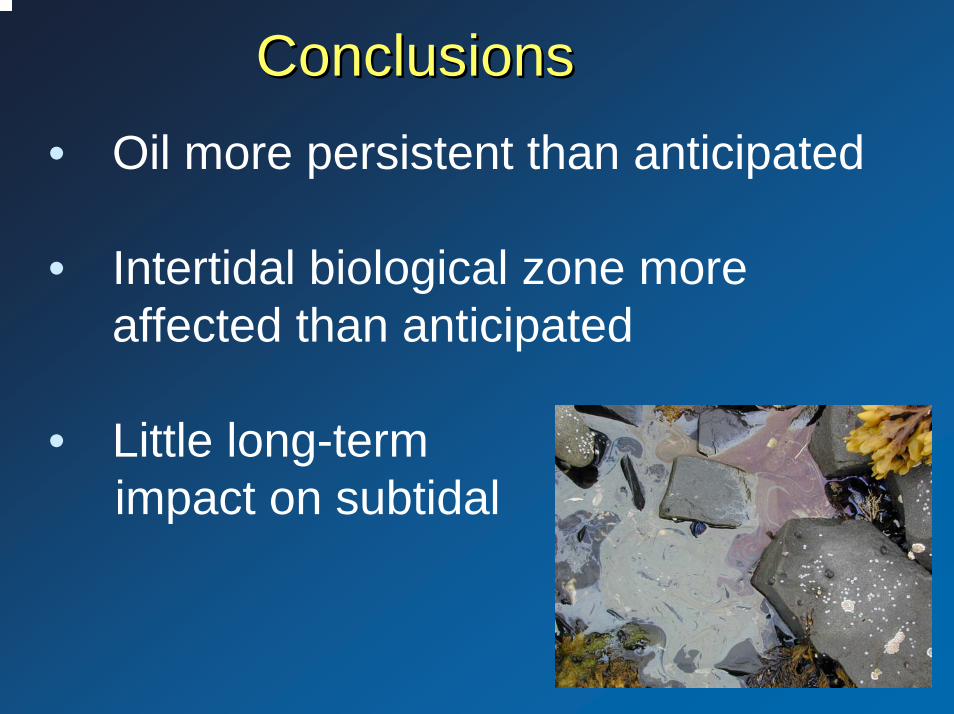
ConclusionsConclusions• Oil more persistent than anticipated
• Intertidal biological zone more affected than anticipated
• Little long-termimpact on subtidal

Exposure to lingering oil in sea otters(work in progress)

Do they use the oiled habitats?And if so how much? 2002/03

Known Diet of Sea Otters at Knight IslandBased on Visual Observations in 2002 (N = 459)
Freq
uenc
y of
Occ
urre
nce
(%)
0
10
60
80
clam mussel bivalve crab urchin stars other


Time Depth Recorder ImplantsTime Depth Recorder Implants2003 and 20042003 and 2004
T im e (h rs )0 1 2 3 4 5 6 7 8 9 1 0 1 1 1 2
Dep
th (m
)
-8 0
-6 0
-4 0
-2 0
0
2 0

How many intertidal pits do they dig?How many intertidal pits do they dig?
About 185 dives/otter/dayAbout 7% of foraging intertidalEquals about 13 intertidal dives/dIf each pit takes 4 dives = 3 pits/dEquals about 1,100 pits/year for the “average” sea otterAssuming 50 otters at N. Knight
Equals about 55,000 intertidal pits/year

AqAqPuPu
SiSiPiW
hChChReW
hLbWhLbLbGoWh
OrOr
WhWhYeY
eChWhReR
e
# of
inte
rtid
al d
ives
/day
0
10
20
30
40
50
60
Females Males
Individual variation in intertidal foraging by sea otters
Results in <100 to 4,400 pits/yrper individual
Molecules of CYP1A mRNA/ng RNA
<55 < 10
10 < 15
15 < 20
20 < 25
25 < 30
30 < 35
35 < 40
40 < 45
45 < 50> 50
% o
f sea
otte
rs
0
10
20
30
40
90
100
Unoiled area (n=86)
Oiled area (n=71)

50
40
30
20
10
01996 1997 1998 2001
oiled unoiled
P450
1A
(mol
ecul
es o
f CY
P1A
mR
NA
x 1
06/ 1
00 n
g R
NA
) Cytochrome P4501A in Sea OttersCytochrome P4501A in Sea Otters
from unoiled and oiled Areasfrom unoiled and oiled Areas

CYP1A content in sea otters from oiled and unoiled areas: 2003*
0
2
4
6
8
10
12
14
16
18
O iled 2003 Unoiled 2002
CY
P1A
cps
* Preliminary results

Harlequin ducks: Exposure and Survival9
OiledUnoiled
10.0% 6.9% 2.2% 2.8%
8
P450
Sca
led
Inde
x 76543210
1998 2000 2001 2002
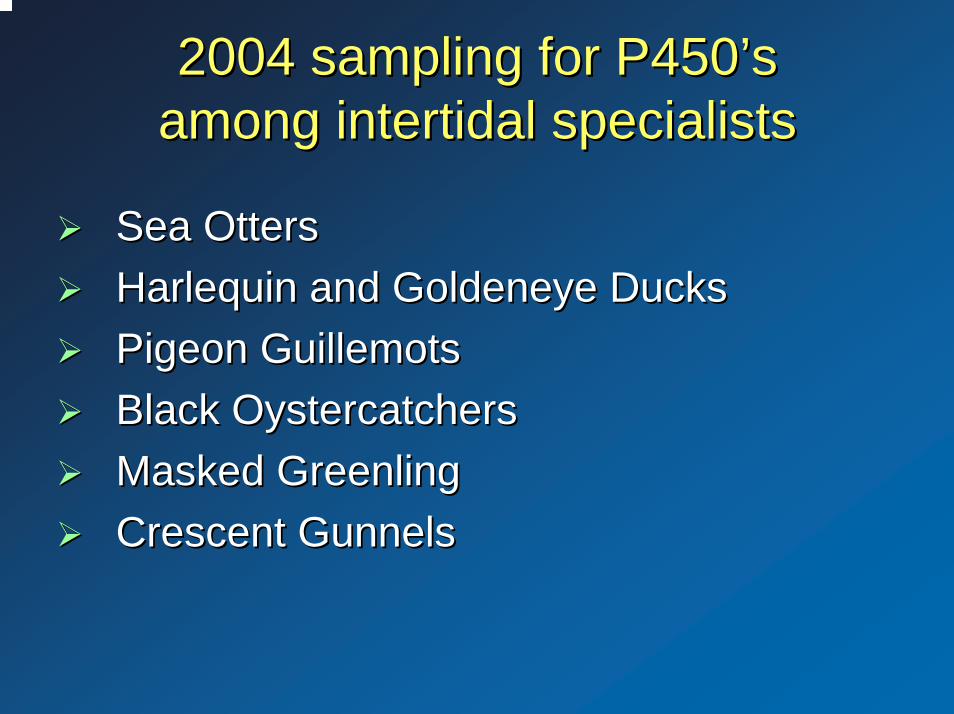
2004 sampling for P4502004 sampling for P450’’ssamong intertidal specialistsamong intertidal specialists
Sea OttersSea OttersHarlequin and Goldeneye DucksHarlequin and Goldeneye DucksPigeon Guillemots Pigeon Guillemots Black Oystercatchers Black Oystercatchers Masked GreenlingMasked GreenlingCrescent GunnelsCrescent Gunnels
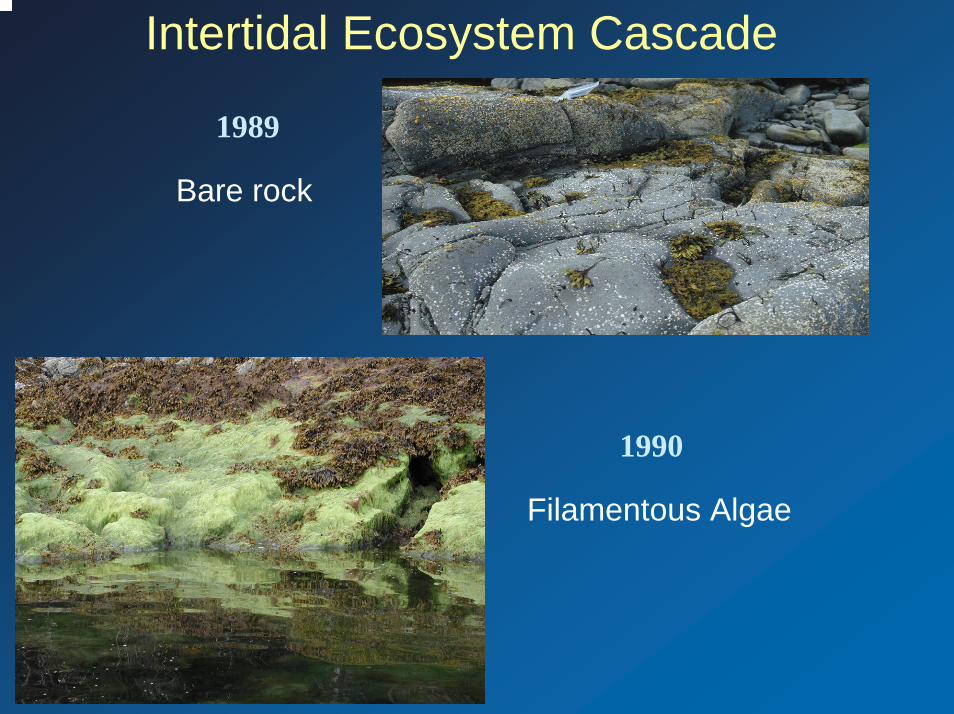
Intertidal Ecosystem Cascade
1989
Bare rock
1990
Filamentous Algae

2000
1992 Fucus settlementOn barnacles
Fucus/barnacle mortality
Fucus recovery
1991
Barnacle settlement

Revising paradigmsRevising paradigmsOld New
Laboratory toxicologyLaboratory toxicologyRapid dispersalRapid dispersalShortShort--term toxicityterm toxicityAcute mortality Acute mortality dominantdominant
Direct effects only
EcotoxicologyEcotoxicologyPotential persistencePotential persistenceLongLong--term toxicityterm toxicityChronic effects Chronic effects significant with significant with multiple pathwaysmultiple pathwaysCleanClean--up and up and ecological cascades ecological cascades extend injury
Direct effects only
extend injury

Thank you for your attention!Thank you for your attention!