long short equity strategy june 2017 - goodwood...
TRANSCRIPT

Long Short Equity Strategy
450 Laurel StreetSuite 1601Baton Rouge, LA 70801225.361.8888
JUNE2017
FUNDAMENTALLY DRIVEN. RESEARCH FOCUSED.
GOODWOODCAPITALMGMT.COM FUNDAMENTALLY DRIVEN. RESEARCH FOCUSED. 2
FIRM OVERVIEW
Long Short Managers with “Tiger Seed” Pedigree
Portfolio managers at Goodwood have been investing in long short equity strategies since 2002while at long short equity hedge fund Maple Leaf Partners, which was seeded by Tiger Management’s founder Julian Robertson. Goodwood is a spin-out of that “Tiger Seed” fund and is majority-owned by its employees.
Goodwood’s flagship long short small-mid cap strategy has a nine year track record. Goodwood claims compliance with the Global Investment Performance Standards (GIPS®).
Capacity constraint is a hallmark of our firm values. Our long short small-mid cap strategy will have a soft close at $500mm in assets.

GOODWOODCAPITALMGMT.COM FUNDAMENTALLY DRIVEN. RESEARCH FOCUSED. 3
PHILOSOPHY
We are looking to partner with a select group of investors who share our beliefs.
Goodwood was founded on the following beliefs:
FOCUS ON SMALL ANDMID-CAP STOCKS
INVEST LONGAND SHORT
LIMITCAPACITY
• We believe that “value-biased” small-mid cap companies offer the greatest long term risk-adjusted returns.
• Our investable universe of “SMID Cap” stocks includes over 2,500 securities with market capitalizations less than $20 billion.
• We believe that portfolio managers with the requisite skills and experience can add value by investing both long and short while reducing equity market risks.
• We aim to harness our fundamentally driven, research focused investment process in both long and short books to drive alpha and to hedge risks accordingly.
• We believe that asset bloat can significantly degrade a portfolio manager’s ability to generate alpha and have witnessed this under-performance firsthand… especially with more concentrated small and mid-cap strategies.
• Capacity constraint is key; it is our goal to build and maintain a “boutique” investment firm with capacity-constrained strategies.
GOODWOODCAPITALMGMT.COM FUNDAMENTALLY DRIVEN. RESEARCH FOCUSED. 4
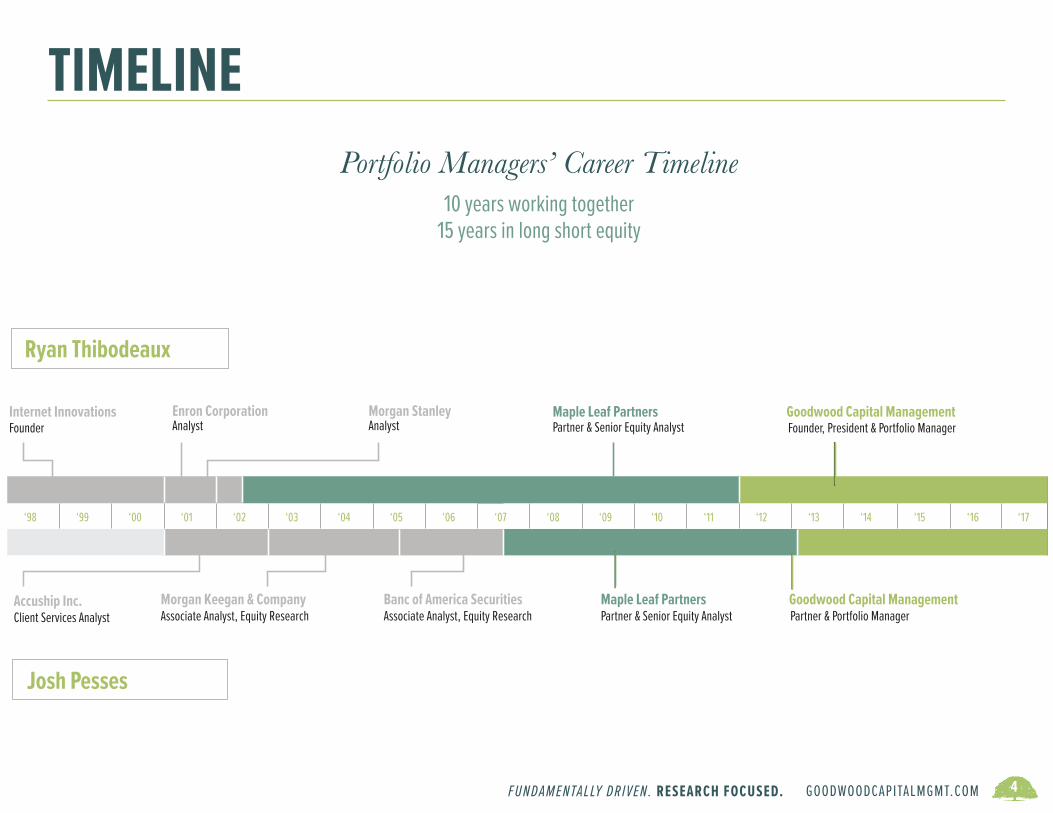
TIMELINEPortfolio Managers’ Career Timeline
10 years working together15 years in long short equity
‘98 ‘99 ‘00 ‘01 ‘02 ‘03 ‘04 ‘05 ‘06 ‘07 ‘08 ‘09 ‘10 ‘11 ‘12 ‘13 ‘14 ‘15
Internet Innovations Enron Corporation Morgan Stanley Maple Leaf Partners Goodwood Capital Management Founder Analyst Analyst Partner & Senior Equity Analyst Founder, President & Portfolio Manager
Accuship Inc. Morgan Keegan & Company Banc of America Securities Maple Leaf PartnersClient Services Analyst Associate Analyst, Equity Research Associate Analyst, Equity Research Partner & Senior Equity Analyst Partner & Portfolio Manager
Ryan Thibodeaux
Josh Pesses
‘16
Goodwood Capital Management
Portfolio Managers’ Career TimelineNine years working together
‘17
GOODWOODCAPITALMGMT.COM FUNDAMENTALLY DRIVEN. RESEARCH FOCUSED. 5
STRATEGY OVERVIEW
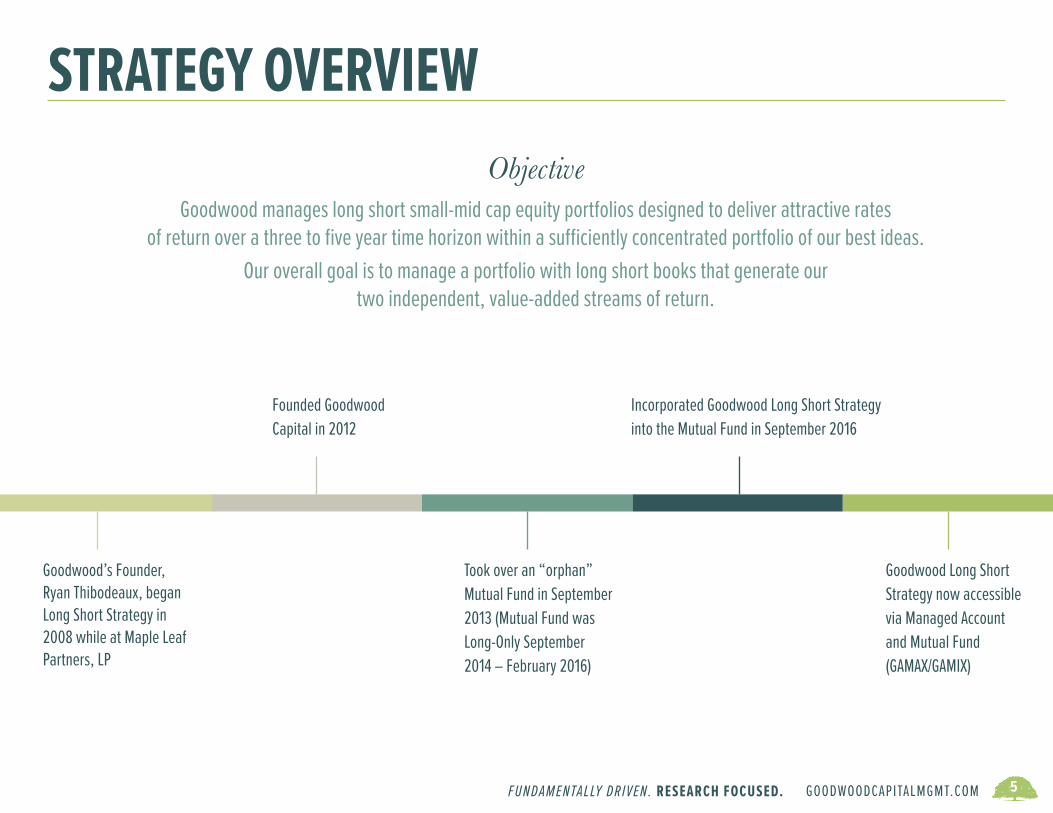
Goodwood’s Founder, Ryan Thibodeaux, began Long Short Strategy in 2008 while at Maple Leaf Partners, LP
Founded Goodwood Capital in 2012
Took over an “orphan” Mutual Fund in September 2013 (Mutual Fund was Long-Only September 2014 – February 2016)
Incorporated Goodwood Long Short Strategy into the Mutual Fund in September 2016
Goodwood Long Short Strategy now accessible via Managed Account and Mutual Fund (GAMAX/GAMIX)
ObjectiveGoodwood manages long short small-mid cap equity portfolios designed to deliver attractive rates
of return over a three to five year time horizon within a sufficiently concentrated portfolio of our best ideas. Our overall goal is to manage a portfolio with long short books that generate our
two independent, value-added streams of return.

GOODWOODCAPITALMGMT.COM FUNDAMENTALLY DRIVEN. RESEARCH FOCUSED. 6
UNIVERSE• Small/Mid-Cap U.S. equities (less than $20 billion market cap) • Benchmarks: Russell 2000, Morningstar Long Short Equity
PORTFOLIO OVERVIEWLong Portfolio
• Generally 75-95% Long Exposure• Generally 40-60 Individual Stocks • Average Position Weight: 2.0%• Average market cap comparable to Russell 2000 Index
Short Portfolio • Generally 15-35% Short Exposure• Generally 20-40 Individual Stocks• Average Position Weight: 1.0%• Average market cap comparable to Russell 2500 Index
Options• Generally 2-4% Net Exposure• Individual Equity Options, Index ETF Options • Hedge Underlying Positions/Efficient Use of Capital
STRATEGY SUMMARY as of 6/30/17
Past performance is not indicative of future results. Returns are presented in gross & net of management fees and include the reinvestment of all income. Please see appendix for disclosure presentation.
1 Year ReturnJuly 1, 2016 - June 30, 2017
Long Short Equity Strategy (gross)
8.5%
Long Short Equity Strategy (net)
Mstar Cat:Long Short Equity
6.9%8.4%
Long Short Equity Strategy (gross)
8.6%
Long Short Equity Strategy (net)
Mstar Cat:Long Short Equity
7.7%
1.6%
Annualized ReturnJanuary 1, 2008 - June 30, 2017
GOODWOODCAPITALMGMT.COM FUNDAMENTALLY DRIVEN. RESEARCH FOCUSED. 7
STATS WE ARE PROUD OF... as of 6/30/17
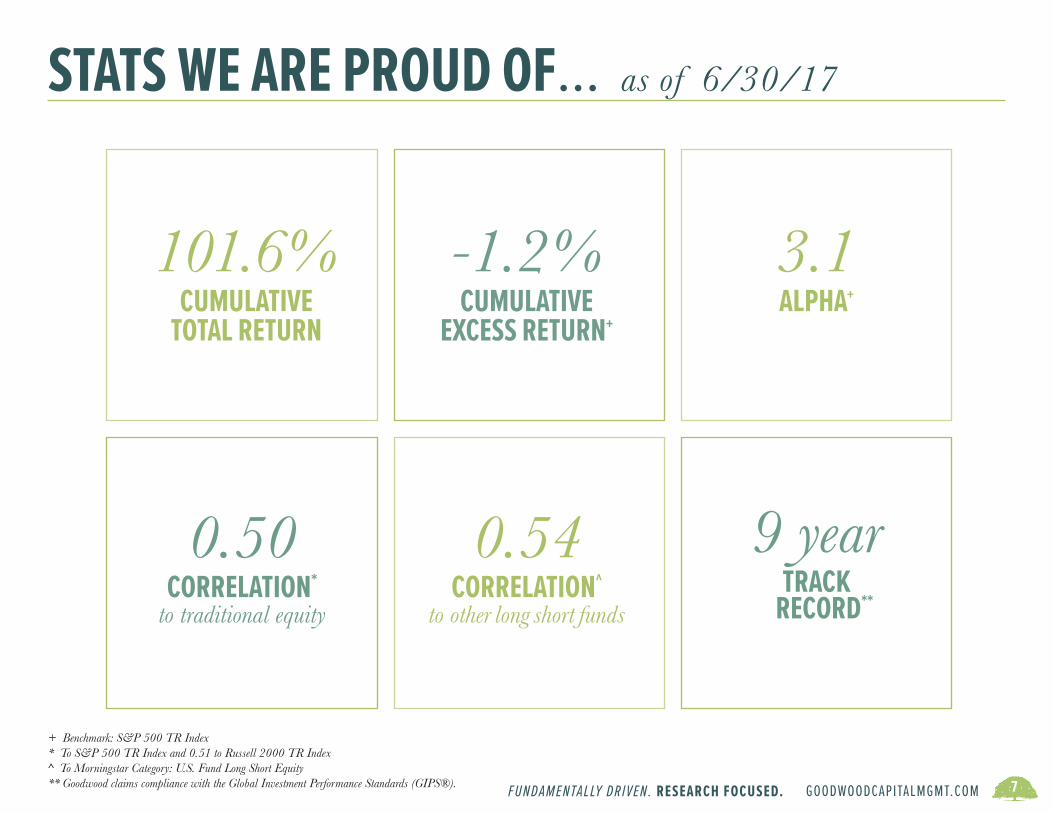
101.6%CUMULATIVE
TOTAL RETURN
-1.2%CUMULATIVE
EXCESS RETURN+
0.50CORRELATION*
to traditional equity
0.54CORRELATION^
to other long short funds
3.1ALPHA+
9 yearTRACK
RECORD**
+ Benchmark: S&P 500 TR Index* To S&P 500 TR Index and 0.51 to Russell 2000 TR Index^ To Morningstar Category: U.S. Fund Long Short Equity** Goodwood claims compliance with the Global Investment Performance Standards (GIPS®).
GOODWOODCAPITALMGMT.COM FUNDAMENTALLY DRIVEN. RESEARCH FOCUSED. 8
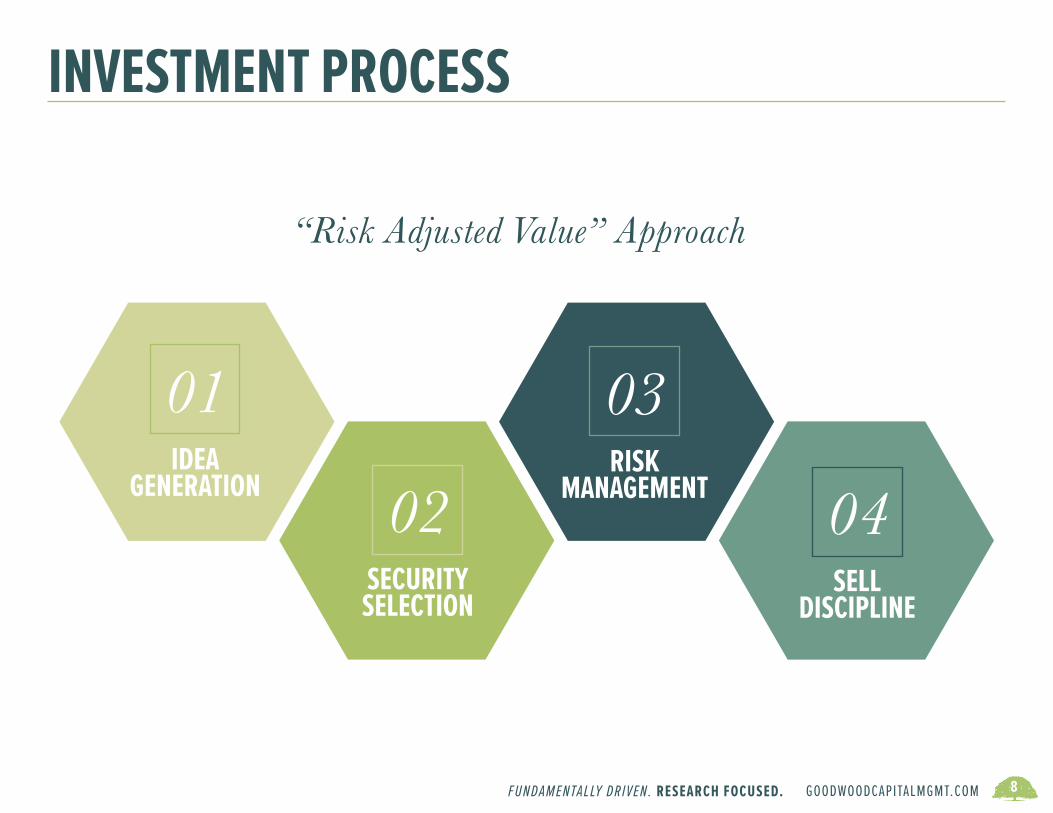
INVESTMENT PROCESS
01IDEA
GENERATION 02SECURITY
SELECTION
03RISK
MANAGEMENT 04SELL
DISCIPLINE
“Risk Adjusted Value” Approach
GOODWOODCAPITALMGMT.COM FUNDAMENTALLY DRIVEN. RESEARCH FOCUSED. 9
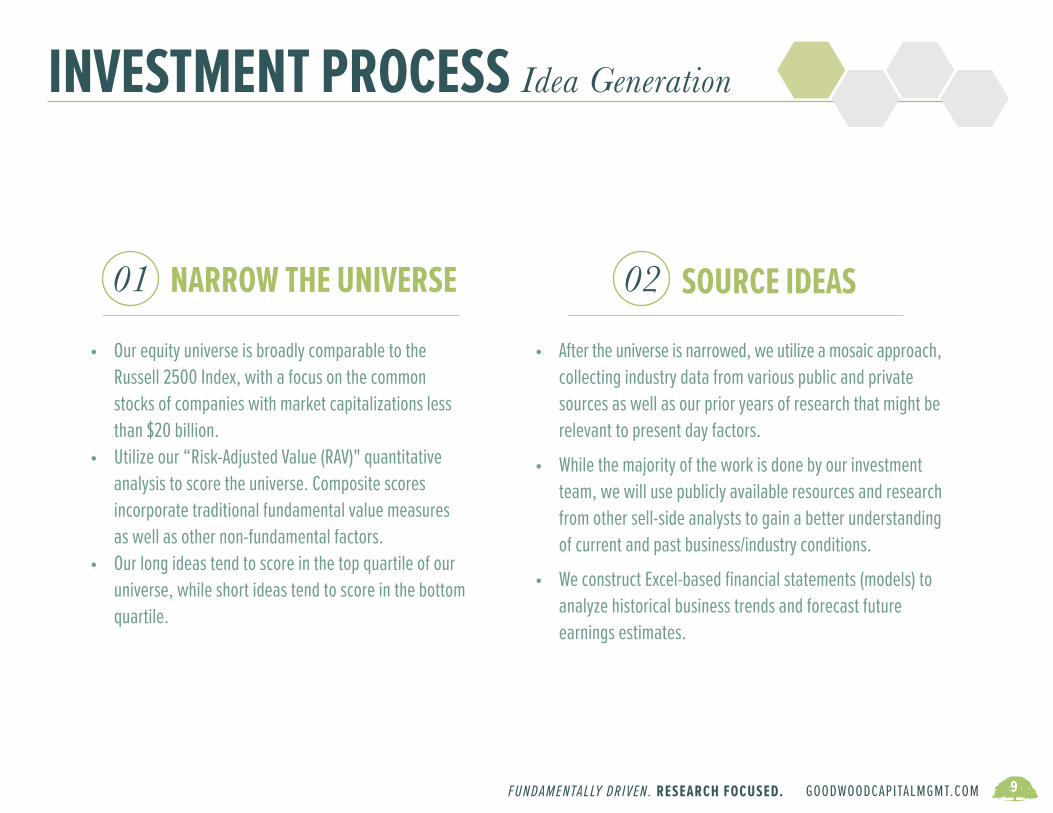
INVESTMENT PROCESS Idea Generation
• Our equity universe is broadly comparable to the Russell 2500 Index, with a focus on the common stocks of companies with market capitalizations less than $20 billion.
• Utilize our “Risk-Adjusted Value (RAV)" quantitative analysis to score the universe. Composite scores incorporate traditional fundamental value measures as well as other non-fundamental factors.
• Our long ideas tend to score in the top quartile of our universe, while short ideas tend to score in the bottom quartile.
NARROW THE UNIVERSE01 SOURCE IDEAS02
• After the universe is narrowed, we utilize a mosaic approach, collecting industry data from various public and private sources as well as our prior years of research that might be relevant to present day factors.
• While the majority of the work is done by our investment team, we will use publicly available resources and research from other sell-side analysts to gain a better understanding of current and past business/industry conditions.
• We construct Excel-based financial statements (models) to analyze historical business trends and forecast future earnings estimates.
GOODWOODCAPITALMGMT.COM FUNDAMENTALLY DRIVEN. RESEARCH FOCUSED. 10
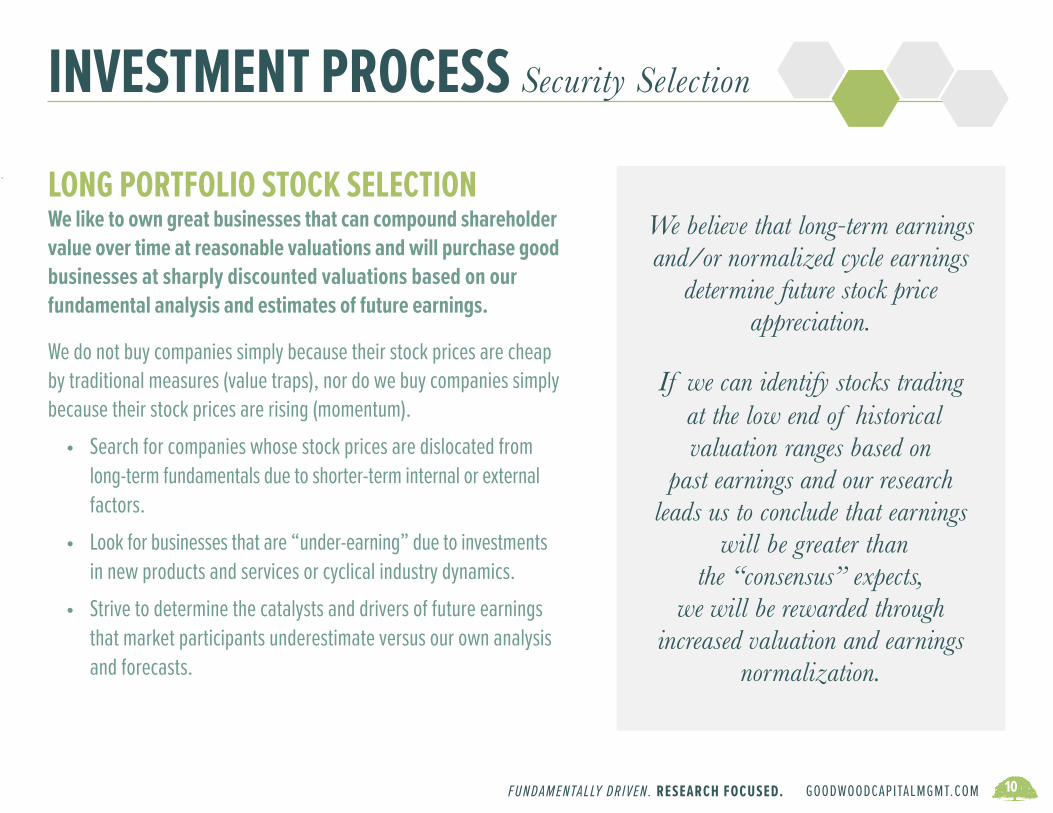
INVESTMENT PROCESS Security Selection
We like to own great businesses that can compound shareholder value over time at reasonable valuations and will purchase good businesses at sharply discounted valuations based on our fundamental analysis and estimates of future earnings.
We do not buy companies simply because their stock prices are cheap by traditional measures (value traps), nor do we buy companies simply because their stock prices are rising (momentum).
• Search for companies whose stock prices are dislocated from long-term fundamentals due to shorter-term internal or external factors.
• Look for businesses that are “under-earning” due to investments in new products and services or cyclical industry dynamics.
• Strive to determine the catalysts and drivers of future earnings that market participants underestimate versus our own analysis and forecasts.
We believe that long-term earningsand/or normalized cycle earnings
determine future stock price appreciation.
If we can identify stocks trading at the low end of historical valuation ranges based on
past earnings and our researchleads us to conclude that earnings
will be greater than the “consensus” expects,
we will be rewarded through increased valuation and earnings
normalization.
LONG PORTFOLIO STOCK SELECTION

GOODWOODCAPITALMGMT.COM FUNDAMENTALLY DRIVEN. RESEARCH FOCUSED. 11
INVESTMENT PROCESS Security Selection
We do not sell short companies simply because their stock prices are expensive by traditional measures (growth traps), nor do we sell short companies simply because their stock prices are falling (momentum).
• Search for companies whose stock prices are dislocated from long-term fundamentals due to shorter-term internal or external factors.
• Look for businesses that are “over-earning” due to transient fundamental factors.
• Strive to determine the catalysts and drivers of future earnings that market participants overestimate versus our own analysis and forecasts.
We believe that long-term earningsand/or normalized cycle earnings
determine future stock price appreciation.
If we can identify stocks trading at the high end of historical valuation ranges based on
past earnings and our researchleads us to conclude that earnings
will be less than the “consensus” expects,
we will be rewarded through decreased valuation and earnings
normalization.
SHORT PORTFOLIO STOCK SELECTION

GOODWOODCAPITALMGMT.COM FUNDAMENTALLY DRIVEN. RESEARCH FOCUSED. 12
INVESTMENT PROCESS Risk Management
We believe that an actively managed equity strategy should be fairly concentrated to generate above-average long term
investment returns.
CONCENTRATION01
We will invest greater amounts of capital in companies where we find greater
risk-adjusted value and vice versa. If we do not have ample evidence to indicate
that earnings growth will exceed our estimates and we cannot justify a higher
valuation, we will reduce the weighting of the position as the price appreciates or
exit the position if warranted.
SIZING02
We believe our risk-adjusted value approach to stock selection and portfolio construction, along with actively hedging
with options, can generate superior risk-adjusted returns over a three to
five-year time horizon.
03 ACTIVE HEDGING
GOODWOODCAPITALMGMT.COM FUNDAMENTALLY DRIVEN. RESEARCH FOCUSED. 13
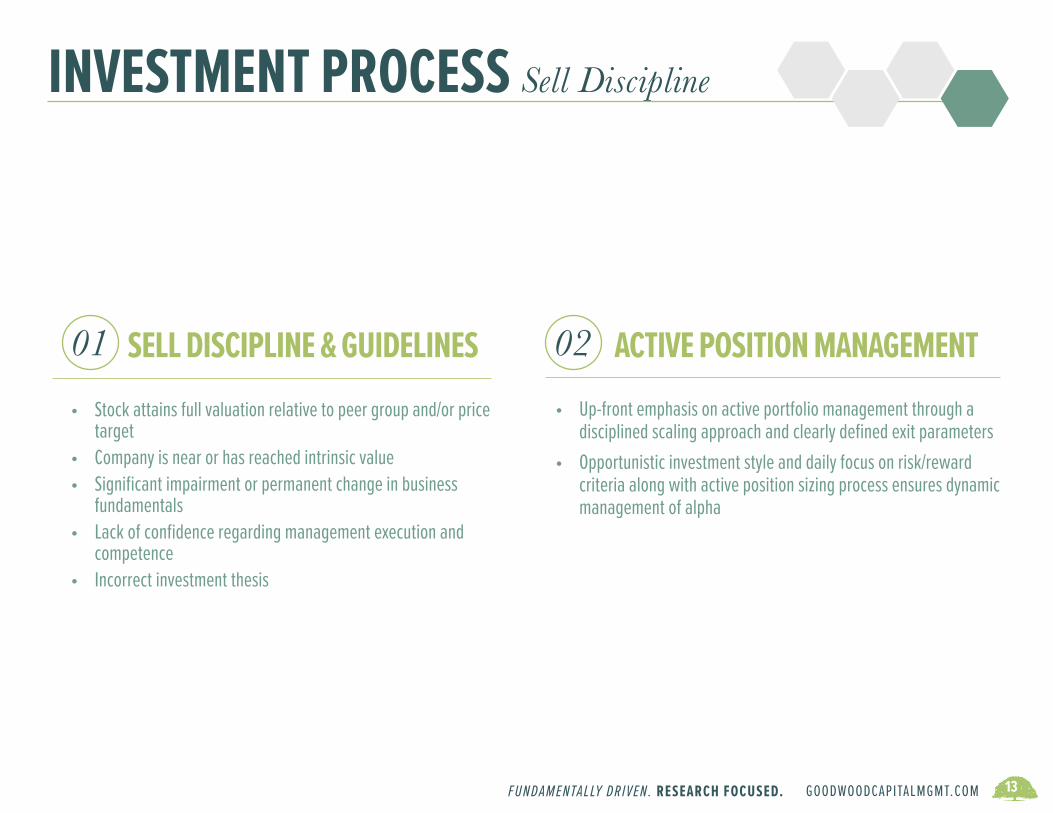
INVESTMENT PROCESS Sell Discipline
• Stock attains full valuation relative to peer group and/or price target
• Company is near or has reached intrinsic value• Significant impairment or permanent change in business
fundamentals• Lack of confidence regarding management execution and
competence• Incorrect investment thesis
SELL DISCIPLINE & GUIDELINES01 02• Up-front emphasis on active portfolio management through a
disciplined scaling approach and clearly defined exit parameters• Opportunistic investment style and daily focus on risk/reward
criteria along with active position sizing process ensures dynamic management of alpha
ACTIVE POSITION MANAGEMENT
GOODWOODCAPITALMGMT.COM FUNDAMENTALLY DRIVEN. RESEARCH FOCUSED. 14
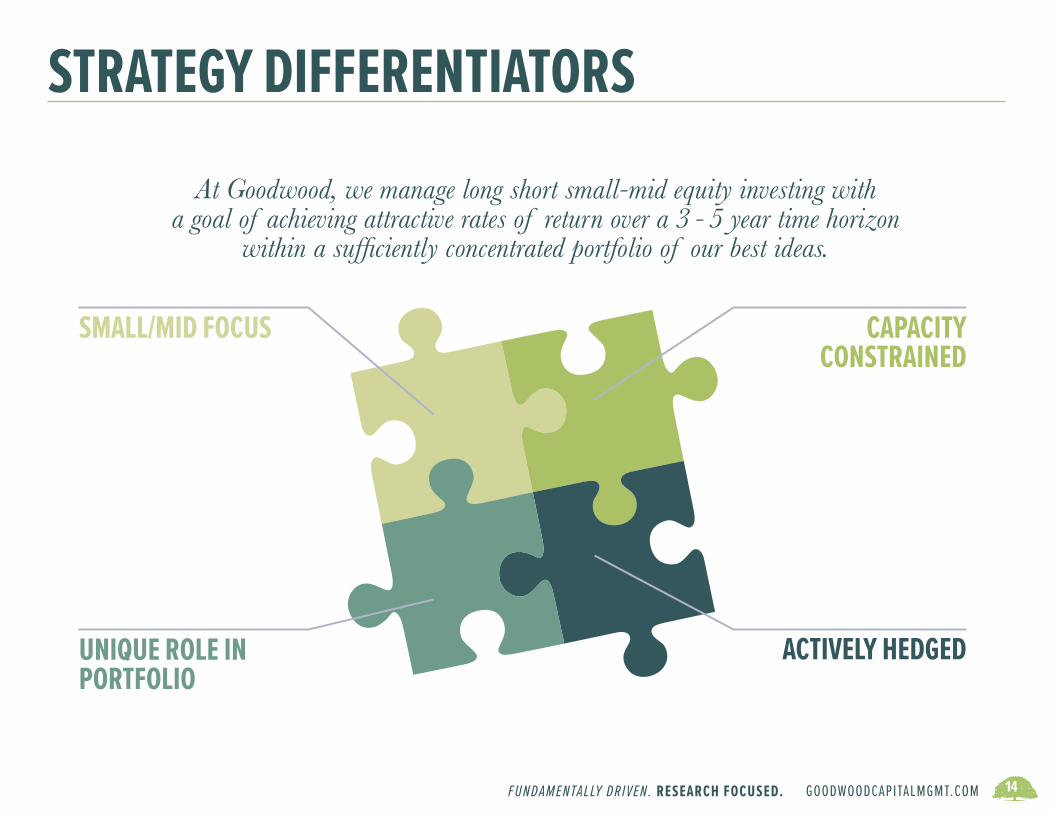
STRATEGY DIFFERENTIATORS
SMALL/MID FOCUS CAPACITYCONSTRAINED
ACTIVELY HEDGEDUNIQUE ROLE IN PORTFOLIO
At Goodwood, we manage long short small-mid equity investing with a goal of achieving attractive rates of return over a 3 - 5 year time horizon
within a sufficiently concentrated portfolio of our best ideas.

GOODWOODCAPITALMGMT.COM FUNDAMENTALLY DRIVEN. RESEARCH FOCUSED. 15
PORTFOLIO GUIDELINESInvestable Universe Long Short U.S. Equity
Market Cap Exposure Small-Mid Cap
Equity Exposure Longs: generally 75 - 95%Shorts: generally 15 - 35%
Position Size Generally 3 - 4% for largest holdings
Number of Positions Longs: generally 40 - 60Shorts: generally 20 - 40
Opportunistic Takes advantage of dislocations / special situations
Active Risk Management Options: generally 2 - 4% net exposureShort Selling: individual stocks
Capacity Constrained $500 mm soft close; $750 mm hard close
Investment Products Separately Managed Account and Mutual Fund

GOODWOODCAPITALMGMT.COM FUNDAMENTALLY DRIVEN. RESEARCH FOCUSED. 16
ROLE IN PORTFOLIO
Currently, investors are utilizing the Strategy as a return enhancer/alpha generator and/or as a diversifier to traditional equity and alternative strategies.
ALPHAGENERATOR DIVERSIFIER+
Alternative Strategy
Active Equity Strategy
* *
* *

GOODWOODCAPITALMGMT.COM FUNDAMENTALLY DRIVEN. RESEARCH FOCUSED. 17
ROLE IN PORTFOLIO Alpha GeneratorSince inception, the Strategy has produced an annualized alpha of 3.1%
and a cumulative excess return of -1.2%.
Goodwood Long Short Equity (net) Mstar Cat: Long Short Equity

GOODWOODCAPITALMGMT.COM FUNDAMENTALLY DRIVEN. RESEARCH FOCUSED. 18
ROLE IN PORTFOLIO Diversifier
Potential diversification benefits of adding Goodwood Long Short Strategy to an existing portfolio: • Low correlation to equity/fixed income/alternative asset classes
• High active share indicating little portfolio holdings overlap
Please note that active share is not indicative or predictive of investment performance. A strategy with high active share may or may not have better performance than a strategy with low active share.* Common portfolio date: 6/30/17
iShares Russell 2000 ETF
iShares Core S&P Mid-Cap ETF
MStar Cat:Long Short Equity
Active Share*
Goodwood Long Short Equity
99.0% 97.3% 97.8%
GOODWOODCAPITALMGMT.COM FUNDAMENTALLY DRIVEN. RESEARCH FOCUSED. 19
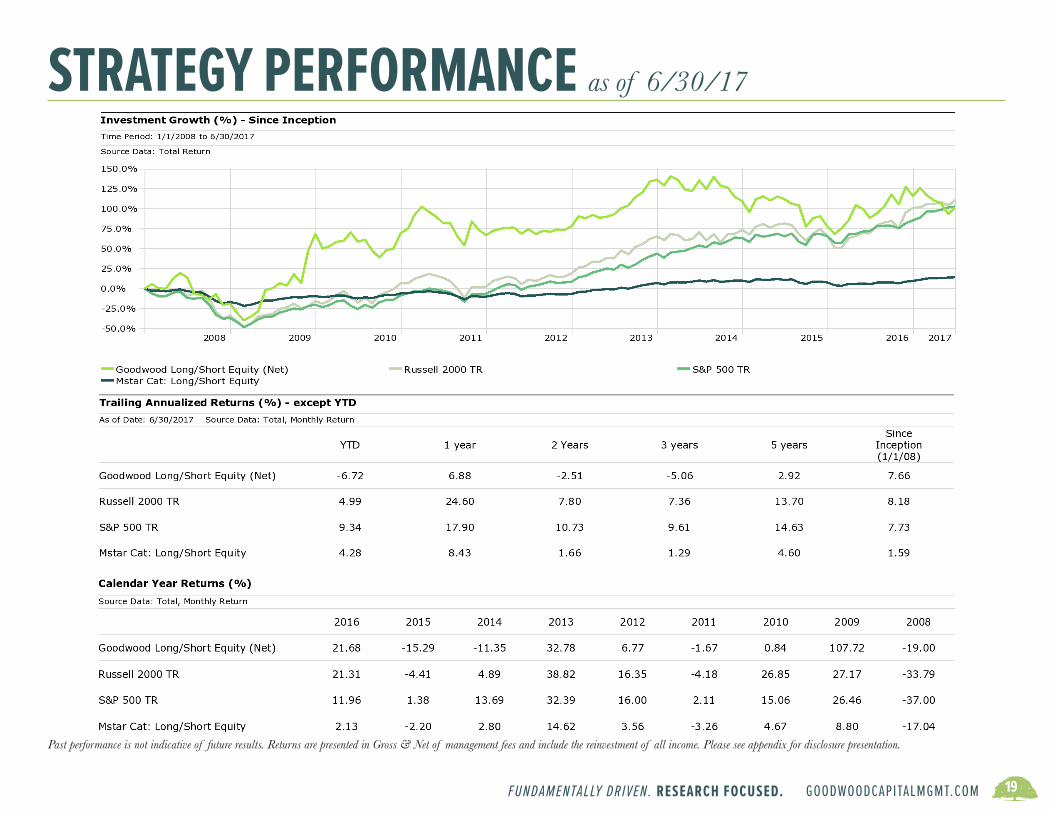
STRATEGY PERFORMANCE as of 6/30/17
Past performance is not indicative of future results. Returns are presented in Gross & Net of management fees and include the reinvestment of all income. Please see appendix for disclosure presentation.
GOODWOODCAPITALMGMT.COM FUNDAMENTALLY DRIVEN. RESEARCH FOCUSED. 20
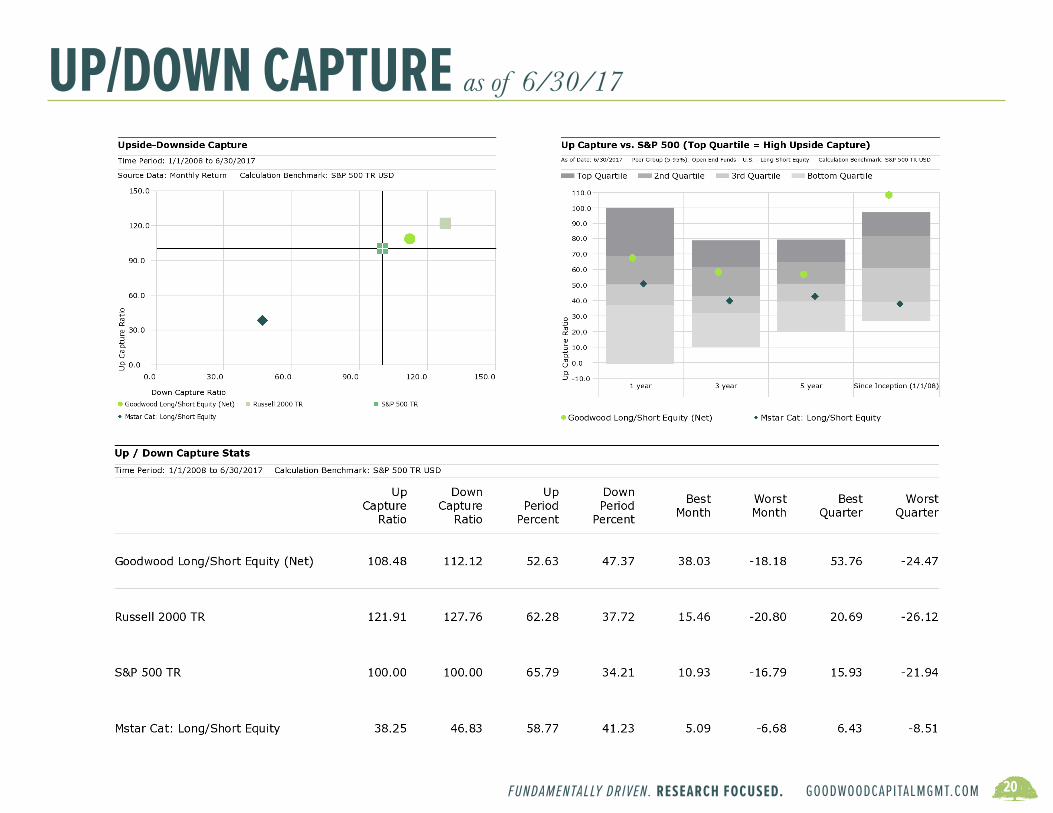
UP/DOWN CAPTURE as of 6/30/17

GOODWOODCAPITALMGMT.COM FUNDAMENTALLY DRIVEN. RESEARCH FOCUSED. 21
RISK/REWARD as of 6/30/17
GOODWOODCAPITALMGMT.COM FUNDAMENTALLY DRIVEN. RESEARCH FOCUSED. 22
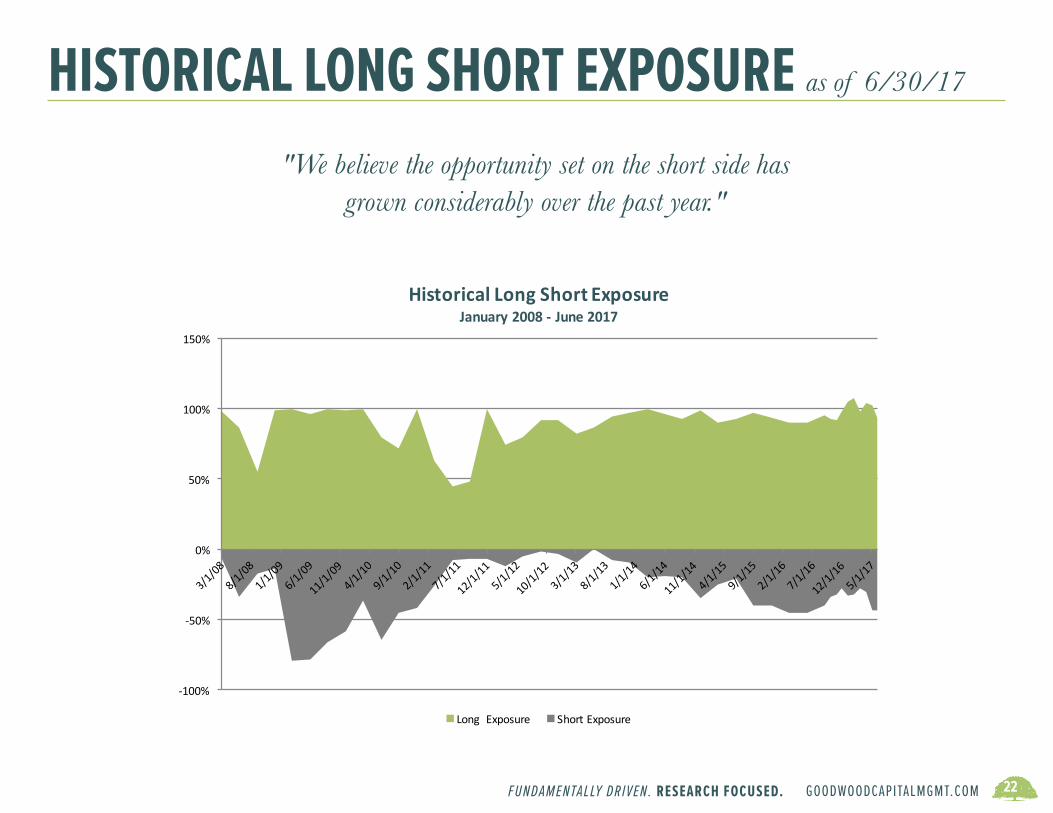
HISTORICAL LONG SHORT EXPOSURE as of 6/30/17
"We believe the opportunity set on the short side has grown considerably over the past year."
-100%
-50%
0%
50%
100%
150%
HistoricalLong/ShortExposureJanuary2008- June2017
LongExposure ShortExposure
-100%
-50%
0%
50%
100%
150%
HistoricalLongShortExposureJanuary2008- June2017
LongExposure ShortExposure

GOODWOODCAPITALMGMT.COM FUNDAMENTALLY DRIVEN. RESEARCH FOCUSED. 23
PORTFOLIO EXPOSURES as of 6/30/17
Long 94%Short (43)%Options (net) 3%Cash 3%Gross Exposure 143%Net Exposure 54%
EXPOSURE
Inception Date 1/1/2008
Investment Vehicle Mutual Fund, Separate Account
Benchmark Russell 2000, Morningstar Long Short Category
Compliance Global Investment Performance Standards (GIPS®)
Geographic Focus U.S.
KEY FACTS
Portfolio data presented based on a representative portfolio within the Strategy. Please see appendix for GIPS® disclosure.
SECTOR BREAKDOWN
Long Positions Short Positions

GOODWOODCAPITALMGMT.COM FUNDAMENTALLY DRIVEN. RESEARCH FOCUSED. 24
HOLDINGS SUMMARY as of 6/30/17
Portfolio holdings are subject to change and are not recommendations to buy or sell securities. The holdings identified do not represent all of the securities in the Strategy. A full list of holdings is available upon request.
Micro < 500 11% (0)%Small 500 < 1,000 11% (0)%Medium 1,000 < 8,000 54% (21)%Large 8,000 < 40,000 19% (22)%Average $4,605 $10,697Median $3,867 $8,734
MARKET CAP ($millions) LONG SHORT
Total 96
Long/(Short) 51 / (45)
Top 10 28%
Top 20 48%
Top 30 66%
HOLDINGS
Westlake Chemical Corporation (WLK) $8,544 Basic Materials Specialty Chemicals 3.95%Methanex Corporation (MEOH) $3,890 Basic Materials Chemicals 3.75%Spirit Airlines (SAVE) $3,583 Industrials Airlines 2.75%Jazz Pharmaceuticals (JAZZ) $9,344 Healthcare Biotechnology 2.65%Bio-Rad Laboratories (BIO) $6,700 Healthcare Diagnostics & Research 2.65%
TOP FIVE LONG HOLDINGS MARKET CAP SECTOR INDUSTRY % OF NET ASSETS
Lam Research (LRCX) $22,814 Technology Semiconductor Equip. & Materials (1.51)%International Flavors (IFF) $10,661 Basic Materials Specialty Chemicals (1.44)%Central Garden & Pet (CENT) $1,641 Consumer Defensive Packaged Foods (1.36)%Dr. Pepper Snapple Group (DPS) $16,747 Consumer Defensive Beverages - Soft Drinks (1.26)%McCormick & Co (MKC) $12,157 Consumer Defensive Packaged Foods (1.25)%
TOP FIVE SHORT HOLDINGS MARKET CAP SECTOR INDUSTRY % OF NET ASSETS

GOODWOODCAPITALMGMT.COM FUNDAMENTALLY DRIVEN. RESEARCH FOCUSED. 25
TEAM BIOSRyan Thibodeaux founded Goodwood Capital Management, LLC in March, 2012 and serves as a Portfolio Manager. Prior to starting Goodwood, Ryan was a Partner and Senior Equity Research Analyst with Maple Leaf Partners, LP. Maple Leaf Partners is a long short equity hedge fund started in New York by Dane Andreeff in 1996. In 2003, Julian Robertson’s Tiger Management seeded Maple Leaf and it became what is commonly referred to as a “Tiger Seed.” The firm eventually grew to over $2 billion in assets under management.Ryan worked in Maple Leaf’s Baton Rouge, Louisiana headquarters from 2002 to 2011. Prior to Maple Leaf, Ryan worked for Morgan Stanley (2002) and was an Analyst at Enron Corp (2001). In 1998, Ryan co-founded Internet Innovations, an Internet company that was acquired in 2000. Ryan earned a Bachelor of Science in Finance from Louisiana State University in 2000. He is also a founding Board Member for the Emerge School for Autism.RYAN THIBODEAUX
Josh joined Goodwood in January 2013 as a Portfolio Manager. Prior to joining Goodwood, Josh was a Partner and Senior Equity Research Analyst with Maple Leaf Partners, LP from 2007 to 2012. Maple Leaf Partners is a long short equity hedge fund started in New York by Dane Andreeff in 1996. In 2003, Julian Robertson’s Tiger Management seeded Maple Leaf and it became what is commonly referred to as a “Tiger Seed.” The firm eventually grew to over $2 billion in assets under management.Josh worked in Maple Leaf’s New York office beginning in 2007 and relocated to the Baton Rouge, Louisiana headquarters in 2010. Before joining Maple Leaf, Josh was an Equity Research Associate Analyst at Banc of America Securities (2005-2007). Prior to Banc of America, Josh was an Equity Research Associate Analyst at Morgan Keegan & Co (2003-2005). Josh earned a Bachelor of Arts in Business Administration from Rhodes College in 2001. He serves as Treasurer for St. James Episcopal Church.JOSH PESSES
Tim joined Goodwood as an Equity Research Analyst in January 2017 after spending eighteen months as an equity research intern. Born in Germany, Tim earned a Bachelor of Science in Finance, and Master of Science in Finance from Louisiana State University. Tim also attended the Colorado School of Mines where he studied petroleum engineering. During his time in Colorado, Tim interned with Nabors Industries and BHP Billiton. At Nabors, Tim worked as an Engineering Intern in the Draft & Design Department, which included working in Dubai. At BHP Billiton, Tim worked as a Production Engineering Intern in Trinidad & Tobago.
TIM MEISSNER

GOODWOODCAPITALMGMT.COM FUNDAMENTALLY DRIVEN. RESEARCH FOCUSED. 26
TEAM BIOS
JONATHAN BALE
Abby Brown joined Goodwood in April 2017 as Director of Marketing and Operations.
MEGHAN LANAHANABBY BROWN
Jonathan joined Goodwood in December 2013. Prior to joining Goodwood, Jonathan worked at FPL Asset Management. Prior to FPL Asset Management, Jonathan played golf internationally for the Golf Union of Wales. As a representative of his native county’s National Team Jonathan competed in over 100 World Ranking events across Europe and the United States, regularly participating in clinics, outings, and Pro-Ams benefiting various charities and non-profit organizations.
Jonathan played collegiate golf at Louisiana Tech University, where he also served on the Board of Directors for the NCAA Student Athletic Advisory committee. Jonathan received Academic and Athletic All-Conference Honors all four years, was named Outstanding Senior Scholar by the KPMG College of Business, selected for membership into the Beta Gamma Sigma International Honor Society for business, and was named Athletic and Academic Student of the Year. Born and raised in the United Kingdom, Jonathan earned a Bachelor of Science in Economics, and a Master of Science in Business Administration, from Louisiana Tech University.
GOODWOODCAPITALMGMT.COM FUNDAMENTALLY DRIVEN. RESEARCH FOCUSED. 27
CONTACT US
Goodwood Capital Management450 Laurel Street, Suite 1601Baton Rouge, LA 70801
Visit us online at www.goodwoodcapitalmgmt.com
GOODWOODCAPITALMGMT.COM FUNDAMENTALLY DRIVEN. RESEARCH FOCUSED. 28
DEFINITIONS Index Definitions
S&P 500 TR USD: A market-capitalization weighted index of 500 stocks chosen for market size, liquidity and industry grouping, among other factors. The index is designed to be a leading indicator of U.S. equities and is meant to reflect the risk/return characteristics of the large-cap universe. This index reflects the effects of dividend reinvestment. An investor may not invest directly in an index.
RUSSELL 2000 TR USD: A market-capitalization weighted index that measures the performance of the small-cap segment of the U.S. equity universe. The Russell 2000 Index is a subset of the Russell 3000® Index representing approximate-ly 10% of the total market capitalization of that index. It includes approximately 2000 of the smallest securities based on a combination of their market cap and current index membership. The Russell 2000 is constructed to provide a com-prehensive and unbiased small-cap barometer and is completely reconstituted annually to ensure larger stocks do not distort the performance and characteristics of the true small-cap opportunity set. This index reflects the effects of dividend reinvestment. An investor may not invest directly in an index.
MORNINGSTAR CATEGORY - LONG SHORT EQUITY: Morningstar U.S. open-end mutual funds and ETFs category of funds that hold sizable stakes in both long and short positions in equities and related derivatives. Some funds that fall into this category will shift their exposure to long and short positions depending on their macro outlook or the opportunities they uncover through bottom-up research. Some funds may simply hedge long stock positions through exchange-traded funds or derivatives. At least 75% of the assets are in equity securities or derivatives.
MSCI WORLD EX US NR USD: A free float-adjusted market capitalization weighted index that captures large and mid-cap representation across 22 of 23 Developed Markets (DM) countries --excluding the United States. With 994 constituents, the index covers approximately 85% of the free float-adjusted market capitalization in each country. This index is calculated with dividends reinvested after deduction of withholding tax. An investor may not invest directly in an index.
MSCI EM NR USD: A free float-adjusted market capitalization index that captures large and mid-cap representation across 23 Emerging Markets (EM) countries. With 822 constituents, the index covers approximately 85% of the free float-ad-justed market capitalization in each country. This index reflects the effects of dividend reinvestment. An investor may not invest directly in an index.
MSCI US REIT NR USD: The MSCI US REIT Index is a free float-adjusted market capitalization index that is comprised of equity REITs. The index is based on MSCI USA Investable Market Index (IMI) its parent index which captures large, mid and small caps securities. With 154 constituents, it represents about 99% of the US REIT universe and securities are classified in the Equity REITs Industry (under the Real Estate sector) according to the Global Industry Classification Standard (GICS®). It however excludes Mortgage REIT and selected Specialized REITs. This index is calculated with dividends reinvested after deduction of withholding tax. An investor may not invest directly in an index.
BARCLAYS US AGG BOND TR USD: A market-value weighted index generally representative of investment grade fixed-rate debt issues, including government, corporate, asset-backed and mortgage-backed securities with maturities of at least one year. An investor may not invest directly in an index.
BARCLAYS US CORP IG TR: The Barclays U.S. Corporate Investment Grade Index is an unmanaged index consisting of publicly issued US corporate and specified foreign debentures and secured notes that are rated investment grade (Baa3/BBB- or higher) by at least two ratings agencies, have at least one year to final maturity and have at least $250 million par amount outstanding.
BARCLAYS US CORP HY TR: The U.S. Corporate High-Yield Index measures the market of USD-denominated, non-investment grade, fixed-rate, taxable corporate bonds. Securities are classified as high yield if the middle rating of Moody’s, Fitch, and S&P is Ba1/BB+/BB+ or below, excluding emerging market debt.
BLOOMBERG BARCLAYS U.S. TREASURY INDEX: The Bloomberg Barclays U.S. Treasury Index is an unmanaged index of prices of U.S. Treasury bonds with maturities of 1 to 30 years. You cannot invest directly in an index.
BLOOMBERG COMMODITY INDEX TR USD: The index consists of exchange-traded futures on physical commodities and aims to provide broadly diversified representation of commodity markets as an asset class. The index represents 20 commodities which are weighted to account for economic significance and market liquidity.

GOODWOODCAPITALMGMT.COM FUNDAMENTALLY DRIVEN. RESEARCH FOCUSED. 29
DEFINITIONS Statistical Definitions
ACTIVE SHARE: A measure of the proportion of portfolio holdings that differ from those in the benchmark index.
ALPHA: Measures the difference between a fund’s actual returns and its expected performance, given its level of risk (as measured by beta). Alpha is often seen as a measure of the value added or subtracted by a portfolio manager.
BETA: A measure of a fund’s sensitivity to market movements. A portfolio with a beta greater than 1 is more volatile than the market, and a portfolio with a beta less than 1 is less volatile than the market.
CORRELATION: A measurement of investment risk that quantifies the degree to which a fund’s performance correlates with the performance of a benchmark. Correlation can vary between 100% (perfect correlation) and -100% (perfect negative correlation).
CUMULATIVE RETURN: Represents the total return generated for the period shown.
EXCESS RETURN: A measure of an investment's return in excess of a benchmark.
INFORMATION RATIO: A measure of the risk-adjusted return of an asset or portfolio. It is defined as active return divided by tracking error, where active return is the difference between the return of the asset or portfolio and the return of a selected benchmark index, and tracking error is the standard deviation of the active return.
RETURN/ANNUALIZED RETURN: Represents the annualized geometric return for the period shown.
SHARPE RATIO: Uses standard deviation and excess return to determine reward per unit of risk. It is calculated by subtracting the risk-free (T-bill) rate of return from a portfolio’s total return and then dividing by its standard deviation. The higher a portfolio’s Sharpe ratio, the better the risk-adjusted performance.
STANDARD DEVIATION: A statistical measure of the volatility of the fund’s returns. It is a statistical measure of dispersion about an average and depicts how widely returns varied over a designated time period. The larger the standard de-viation, the greater the volatility of return.
UP/DOWN CAPTURE RATIO: Measures a fund’s performance in up/down markets relative to the market/benchmark itself. It is calculated by taking the fund’s upside/downside capture return and dividing it by the benchmark’s upside/downside capture return.
UP/DOWN PERIOD PERCENT: Measures the percentage of time the fund’s returns were positive and negative.

GOODWOODCAPITALMGMT.COM FUNDAMENTALLY DRIVEN. RESEARCH FOCUSED. 30
DISCLOSURES
N.A.1 - Information is not statistically meaningful due to an insufficient number of portfolios in the composite for the entire year. N.A.2 – The three-year annualized standard deviation measures the variability of the composite and the benchmark returns over the preceding 36-month period. The Three-year annualized standard deviation is not presented for 2008 through 2009 due to less than 36 months of composite data.GCM Long Short Equity Composite includes all discretionary portfolios that purchase long positions and sell short stocks across all market capitalizations, both foreign and domestic, that are considered to attractively priced (longs) or poorly priced (shorts) relative to Goodwood’s estimate of fair value. A core position is 5% so that theoretically our clients would hold 20 names diversified across various industries. It is very rare that enough companies are sufficiently discounted to warrant this level of concentration, so concentration will vary with the price to fair value ratio. We will invest client assets in positions as small as 1% when price to value ratios are higher. We will not invest client assets in any business that is trading above our estimate of fair value. Goodwood may use up to 150% of the portfolio net assets as part of the investment strategy and will utilize margin for short sale positions. Goodwood uses “Regulation T” margin accounts only. Goodwood may also use long and short option positions as part of the investment strategy to hedge or add exposure to the entire portfolio or a specific security within the portfolio. The GCM Long Short Equity composite was created on March 1, 2012 and its inception date is January 1, 2008. For the time period January 1, 2008 to February 29, 2012 the GCM Long Short Equity composite was comprised solely of a single portfolio. During the same time period Goodwood’s managing member served as the Portfolio Manager for the account while employed at another advisor. Goodwood has met the GIPS portability requirements to link the returns of the portfolio to the GCM Long Short Equity Composite. The composite benchmark is the Morningstar ® US Fund Long Short Equity category which measures the performance of a large sample size of investable vehicles with similar investment strategies to the GCM Long Short Equity composite. Goodwood Capital Management, LLC (“Goodwood”) is a registered investment adviser with the U.S. Securities and Exchange Commission in accordance with the Investment Advisers Act of 1940. Goodwood claims compliance with the Global Investment Performance Standards (GIPS®) and has prepared and presented this report in compliance with the GIPS standards. Goodwood Capital Management has been independently verified for the periods March 1, 2012 – March 31, 2017. Verification assesses whether (1) the firm has complied with all the composite construction requirements of the GIPS standards on a firm-wide basis and (2) the firm’s policies and procedures are designed to calculate and present performance in compliance with the GIPS standards. The GCM Long Short Equity Composite has been examined for the periods March 1, 2012 – March 31, 2017. The verification and performance examination reports are available upon request. Results are based on fully discretionary accounts under management, including those accounts no longer with the firm. Composite performance is presented net of foreign withholding taxes on dividends, interest income, and capital gains. Withholding taxes may vary according to the investor’s domicile. Leverage/Derivatives/short positions may make up a material part of the composite strategy which includes short selling, with the short position covered by cash accounts that are marked to market on a daily basis. Past performance is not indicative of future results. The U.S. Dollar is the currency used to express performance. Returns are presented gross and net of management fees and include the reinvestment of all income. Net of fee performance was calculated using the highest management fee of 1.50% applied monthly to any portfolio within the composite for the period. The annual composite dispersion presented is an asset weighted standard deviation calculated for the accounts in the composite the entire year. Policies for valuing portfolios, calculating performance, and pre-paring compliant presentations are available upon request. The firm’s list of composite descriptions is available upon request. The investment management fee schedule for the composite is 1.50%. Actual investment advisory fees incurred by clients may vary.
YEAR END TOTAL FIRM ASSETS
COMPOSITE ASSETS
NUMBER OF ACCOUNTS
% OF NON-FEE-PAYING
COMPOSITE GROSS
COMPOSITE NET
MORNINGSTAR LONG/SHORT
CATEGORY
COMPOSITE DISPERSION
COMPOSITE GROSS 3YR STANDARD DEVIATION
BENCHMARK 3YR
STANDARD DEVIATION
2016 45,969,565 26,272,821 8 0% 23.5% 21.7% 2.1% 9.56% 19.04% 5.42%2015 39,385,343 2,266,545 7 0% -14.0% -15.3% -2.2% 3.60% 16.05% 5.39%2014 129,708,079 15,875,143 9 0% -10.0% -11.3% 2.8% 1.52% 12.03% 4.78%2013 71,292,317 5,687,609 7 0% 34.7% 32.8% 14.6% 1.38% 17.54% 6.13%2012 11,592,525 3,913,339 5 0% 8.4% 6.8% 3.6% N.A. 1 21.19% 6.47%2011 76,477 1 100% -1.7% -1.7% -3.3% N.A. 1 40.69% 7.19%2010 85,837 1 100% 0.8% 0.8% 4.7% N.A. 1 41.75% 8.18%2009 85,118 1 100% 107.7% 107.7% 8.8% N.A. 1 N.A. 2 N.A. 22008 36,392 1 100% -19.0% -19.0% -17.0% N.A. 1 N.A. 2 N.A. 2