long lake status of fishery report 2012-138 - som - state …€¦ · · 2016-02-26the oxygen...
TRANSCRIPT

Michigan Dept. of Natural Resources 2012-138 Status of the Fishery Resource Report Page 1
Long Lake St. Joseph County, T6S, T9W, S27 St. Joseph River watershed, 2011
Brian Gunderman, Fisheries Biologist, Plainwell
Environment
Long Lake is a 222-acre lake located approximately 3 miles southwest of the village of Colon. Three tributaries flow into Long Lake. Big Swan Creek enters at the southern end of the lake (Figure 1). The Lepley Lake outlet and a small unnamed stream flow into the eastern side of the lake. Water flows northward out of Long Lake and enters Palmer Lake. The water levels in Long and Palmer lakes are controlled by the Lamberson Dam. The legal lake levels are 850.7 ft in summer and 850.3 ft in winter. Wide shoals exist at the extreme northern and southern ends of the lake. Organic substrates predominate in these areas. Throughout the remainder of the shoreline, drop-offs are relatively steep and marl and sand substrates are common. About 58% of the lake (by surface area) is greater than 10 ft deep and 27% is greater than 20 ft deep (Figure 2). Long Lake is surrounded by deposits of glacial outwash sand and gravel and postglacial alluvium. Well-drained soils of the Coloma-Spinks-Oshtemo series are common around the lakes, whereas a variety of loams and sandy loams occur upstream of Long Lake. Agriculture is the predominant land use in the watershed. Major wetland complexes remain at the southern end of the lake and along the western shoreline between Lester Lane and Paradise Road. Smaller wetland complexes are located adjacent to the DNR public access site and at the mouth of the unnamed tributary. Additional wetlands exist along the channel between Long and Palmer lakes. Outside of these wetlands, residential and vacation homes surround most of the shoreline. The 2011 habitat survey revealed a total dwelling density of 32.9 dwellings/mile (20.5 dwellings/km) for Long Lake. Approximately 72% of the shoreline is armored with seawalls or riprap, which is one of the highest percentages recorded for lakes in southwest Michigan. Large woody structure is scarce. Since the fall of 2002, persistent algal blooms (primarily Fragilaria, Euglena, and Pseudanabaena) have reduced water clarity in Long Lake (Weed Patrol, Inc. 2008). The reduced water clarity has been accompanied by a decrease in the abundance of rooted aquatic plants. Limnological sampling was conducted at the deepest point in Long Lake on September 13, 2011. As expected, the lake was thermally stratified (Figure 3). The epilimnion extended from the surface to a depth of 14 ft. Water temperatures within the epilimnion were relatively uniform, ranging from 70.0 F to 68.9 F. The metalimnion (zone of thermal change) extended from 14 ft to 27 ft. Water temperatures declined from 68.9 F at the top to 56.6 F at the bottom of the metalimnion. The cold waters of the hypolimnion extended from 27 ft to the bottom of the lake. The oxygen distribution within Long Lake followed a clinograde curve, with the highest oxygen concentrations occurring near the surface (Figure 3). The dissolved oxygen concentration was <1 ppm at depths greater than 18 ft. The total alkalinity was 178 mg/L, which is indicative of a hardwater lake with substantial buffering capacity. The biological productivity of a lake is strongly dependent on its supply of two key nutrients: phosphorus and nitrogen. Nitrogen is the limiting nutrient when the ratio of total nitrogen to total phosphorus is <10:1, and phosphorus is the limiting nutrient when this ratio is >15:1 (Shaw et al.

Michigan Dept. of Natural Resources 2012-138 Status of the Fishery Resource Report Page 2 2004). In Long Lake, the ratio of total nitrogen to total phosphorus was 27:1, which suggests that phosphorus is the limiting nutrient in this system. The total phosphorus concentration was 0.0232 mg/L. The chlorophyll a concentration, which provides an index of algal biomass, was 0.0098 mg/L. The Secchi disk depth (an index of water clarity) was 3.0 ft. These water quality parameters indicate that Long Lake is a eutrophic or highly productive system (Carlson and Simpson 1996).
History The first fisheries survey of Long Lake was completed in 1887. Northern pike, bluegill, largemouth bass, black crappie, suckers, and bullheads were collected in this initial assessment. During 1935 through 1945, bluegills, largemouth bass, and yellow perch were stocked in Long Lake (Table 1). Subsequently, throughout the state, annual stocking programs for these species were discontinued after fisheries managers determined that such programs were unnecessary and could have undesirable effects on the receiving populations (e.g., reduced growth due to increased competition for forage). Conservation officers recorded catch and effort data for anglers encountered on Long Lake during 1956-1964. These qualitative creel reports indicated that bluegill was the primary game species in this system, followed by yellow perch, black crappie, pumpkinseed, and largemouth bass. The first electrofishing survey on the lake was completed in May 1972. Bluegills and pumpkinseeds were abundant, but the populations were dominated by small fish. Few yellow perch were collected. Anglers reported poor fishing for yellow perch and bluegills. The largemouth bass population appeared to be strong, and anglers reported good fishing for this species. The next electrofishing survey was conducted in October 1981. Largemouth bass and bluegills were abundant. The size structures of the bass and bluegill populations were acceptable and angler reports were positive. Growth of bluegills was average, while growth of largemouth bass was slightly below average. The survey results and angler reports indicated that yellow perch were fairly abundant, but most of the perch were smaller than harvestable size. A variety of gear types were used to collect fish in Long Lake during October 1992. The bluegill, pumpkinseed, yellow perch, and largemouth bass populations were dominated by small fish. Growth was below average for largemouth bass and average for bluegills and yellow perch. Some private stocking of walleyes occurred during the late 1980s-early 1990s, and five walleyes were captured during the 1992 survey. Local anglers expressed strong interest in enhancing the walleye fishery in Long Lake. Beginning in 1993, the Michigan Department of Natural Resources (MDNR) stocked walleye fry into local rearing ponds. The Colon Area Anglers Association (CAAA) managed these ponds and harvested spring fingerling walleye for stocking in Long Lake and various other water bodies. Spring fingerling walleyes were stocked in Long Lake several times during 1993-2006 (Table 1). An electofishing survey conducted in October 1994 yielded population estimates of 0.33 young-of-year/acre and 0.16 yearlings acre, which suggested poor survival of stocked walleye (Serns 1982; Serns 1983; Ziegler and Schneider 2000). The mean length-at-age for young-of-year walleyes was well above average. In 2007, MDNR's statewide walleye stocking program was interrupted due to the discovery of viral hemorrhagic septicemia virus in the Great Lakes. Full production of spring fingerling walleyes did not resume until 2011.

Michigan Dept. of Natural Resources 2012-138 Status of the Fishery Resource Report Page 3 Two other fish species have been stocked in Long Lake to provide diverse fishing opportunities. Channel catfish were stocked in 1992. During 1999-2002, the CAAA stocked fall fingerling redear sunfish in Long Lake. Largemouth bass virus was detected in Long Lake in 2001. This virus has caused die-offs of largemouth bass in other systems, with most fish kills occurring during mid-July through mid-August. Large adult fish appear to be especially vulnerable to this pathogen. No major die-offs of largemouth bass have been reported on Long Lake.
Current Status A variety of methods were used to evaluate the fish community in Long Lake during May-June 2011. Fish were captured with trap nets, fyke nets, gill nets, seines, and nighttime electrofishing gear (Table 2). Total lengths were recorded for all fish captured during the survey. For game fish species, dorsal fin ray or scale samples were collected from 10 fish per inch group for age determination. Twenty-nine fish species were collected during the 2011 survey (Table 3). Bluegill (n = 1,001) was the most abundant species, composing 44% of the catch by number and 19% of the catch by weight. Fifty-nine percent of the bluegills were 6 inches or larger. Size structures of bluegill populations can be challenging to interpret because each gear type exhibits some degree of size selectivity (Figure 4). In an effort to minimize the subjectivity associated with analyses of bluegill catch data, Schneider (1990) developed a standardized scoring system for interpreting length-frequency distributions of bluegills collected with various types of sampling gear. The size scores for the Long Lake bluegill population were 4.2 (satisfactory-good) based on the trap net and fyke net samples and 3.4 (acceptable-satisfactory) based on the electrofishing sample (Schneider 1990). The mean growth index for bluegills was +0.1, which is average growth in Michigan (Figure 5). (Note: Schneider et al. [2000] calculated different state average lengths for January-May and June-July. During the 2011 survey, spine and scale samples were collected in May and June. The January-May lengths were used to calculate growth indices for fish captured during the spring netting effort, and the June-July average lengths were used to calculate growth indices for fish captured during the electrofishing and seining efforts. The individual growth indices were averaged to obtain the mean growth indices.) Eight year classes of bluegills were collected (Figure 6). Age 6 and older bluegills only composed about 2% of the catch. Annual total mortality was estimated to be 79% for adult bluegills (catch curve analysis, ages 4-8; Figure 7). Black crappie (n = 469) was the second most abundant species by number and the most abundant species in terms of biomass (Table 3). All of these fish were captured during May, and about 96% of the crappies were collected in trap nets and fyke nets. Ninety-nine percent of the fish collected were 7 inches or larger (Figure 8). The mean growth index for black crappies was +1.0, which is above average growth (Figure 9). Eleven year classes were collected (Figure 10). Age 4 fish were particularly abundant and made up 47% of the catch. Annual mortality was estimated to be 36% for adult black crappies (ages 4-11; Figure 11). Other panfish species were minor components of the catch. Cumulatively, yellow perch, pumpkinseeds, and redear sunfish composed 4% of the total catch by number and less than 1% of the

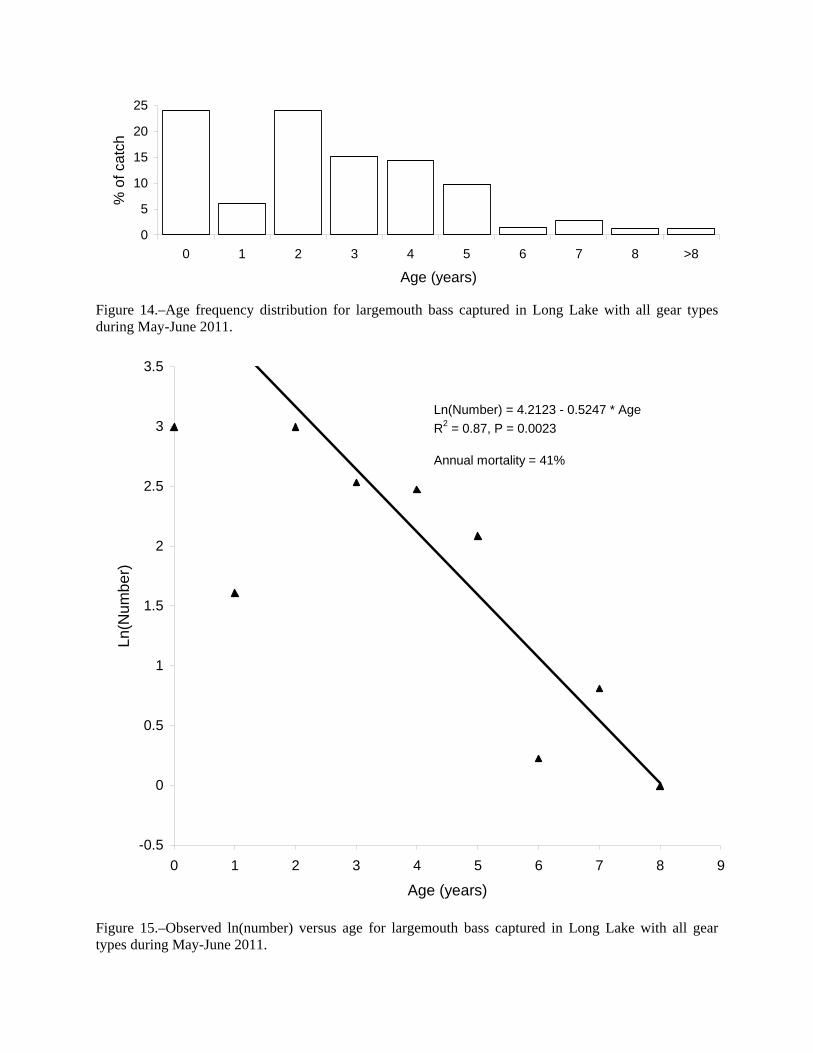
Michigan Dept. of Natural Resources 2012-138 Status of the Fishery Resource Report Page 4 catch by weight. Most of the yellow perch collected were young-of-year or yearling fish. Growth was average for yellow perch. Numerically, largemouth bass (N = 83) were the most abundant predators in the catch. Legal-size fish (14 inches and larger) made up 7% of the sample (Figure 12). Only one fish larger than 16 inches was collected during the survey. Mean lengths-at-age for largemouth bass were below state averages (Figure 13). Ten year classes were represented in the catch, and the 2009 and 2011 year classes each composed about 24% of the sample (Figure 14). Annual total mortality for largemouth bass ages 2-8 was estimated to be 41% (Figure 15). Channel catfish (n = 24) made up 9% of the total biomass. Twenty-three of these fish were larger than the minimum size limit of 12 inches (Figure 16). Fisheries Division awards Master Angler patches to anglers who catch fish that meet specified total length (catch-and-release entries) or weight (catch-and-keep entries) requirements. For channel catfish, the minimum entry length is 27 inches. Six of the channel catfish captured during the 2011 survey were 27 inches or larger. Nineteen northern pike were captured during the survey, including fish from four different year classes (Figure 17). Approximately 32% of the pike collected were larger than the minimum size limit of 24 inches (Figure 18). The mean growth index was +0.9, which suggests that growth is slightly above average. Only one walleye was captured. This fish was determined to be from the 2005 year class.
Analysis and Discussion Predators (largemouth bass, northern pike, channel catfish, walleye, bowfin, and spotted gar) composed 24% of the biomass during the 2011 survey. Schneider (2000) observed that predators typically make up 20-50% of the biomass in lakes with desirable fish communities. Based on this standard, the relative abundance of piscivorous (fish-eating) fish species in Long Lake is at the low end of the acceptable range. Bluegill is the primary game species in Long Lake. Catch-per-effort (CPE) with specific gear types provides an index of relative abundance of bluegills. During the 2011 survey, 73% of the bluegills were collected in large-mesh fyke nets, and the fyke net CPE was 81.0 fish/net night. For lakes surveyed as part of Fisheries Division's Status and Trends Program during 2002-2007, the statewide average was 22.6 bluegills/fyke net night (K. Wehrly, MDNR - Fisheries Division, unpublished). Thus, it appears that the population density for bluegills in Long Lake is high relative to most other populations in Michigan. Conversely, the bluegill CPE for Long Lake was lower than the fyke net CPEs observed for Palmer (181.3 fish/net night) and Sturgeon (146.8 fish/net night) in 2011. The bluegill CPE for the electrofishing effort in Long Lake was about average for Michigan lakes, but poor water clarity limited sampling efficiency in this system. Total annual mortality for adult bluegills was near the upper end of the range of mortality estimates reported by Schneider (2000). High fishing mortality could have produced the observed population age structure; however, no creel data are available to test this hypothesis. Another possible explanation is that bluegill reproductive success was higher in 2007 than in successive years. Such recruitment variability would lead to overestimation of annual total mortality.

Michigan Dept. of Natural Resources 2012-138 Status of the Fishery Resource Report Page 5 During the 2011 survey on Long Lake, black crappie CPE in trap nets and large-mesh fyke nets greatly exceeded the statewide average CPEs for this species (K. Wehrly, MDNR - Fisheries Division, unpublished). Although Long Lake obviously supports a strong black crappie population, the timing of the survey was partially responsible for the high catch rates. On Long Lake, netting was conducted during the pre-spawning period when black crappies were moving into shallow water and were highly vulnerable to entrapment gear. By contrast, the Palmer Lake survey and many other Status and Trends surveys were conducted during the spawning period when black crappies are less mobile and less likely to be captured in nets. The Sturgeon Lake survey was completed after the spawning period. At that time, most of the black crappies had moved to deeper water and were less vulnerable to sampling gear. Harvestable-size (7 inches or larger) crappies were abundant in Long Lake. The desirable size structure of this population is the result of rapid growth and high survival. The total annual mortality estimate for the Long Lake crappie population was similar to those reported for lightly exploited populations in Nebraska (Paukert et al. 2001) and substantially lower than those calculated for heavily exploited populations in Minnesota (Parsons and Reed 1998). Only two redear sunfish were captured during the 2011 survey on Long Lake. This is surprising given that more than 150 redear sunfish were collected in Palmer Lake three weeks after the Long Lake netting effort. As with crappies, survey timing may have been a factor in sampling efficiency. Nighttime electrofishing typically is the most effective method for capturing largemouth bass. The largemouth bass CPE for Long Lake was 1.6 fish/minute, which is average for lakes in southwest Michigan. As noted previously, water clarity limited sampling efficiency in this system. Thus, bass abundance may be higher than indicated by the CPE data. Based on the catch curve analysis (which assumes consistent recruitment from year-to-year), annual total mortality of bass in Long Lake is low relative to most other largemouth bass populations in North America (Allen et al. 2008). The Long Lake mortality estimates must be interpreted with caution as the sample size was small. The mean lengths-at-age for largemouth bass in Long Lake were below the statewide averages (Schneider et al. 2000). This is not uncommon for lakes in southwest Michigan, where mean growth indices for largemouth bass typically range from -0.5 to -1.5. There does not appear to be a shortage of suitable prey for largemouth bass in this system. As noted previously, predators only composed about 24% of the biomass in the catch. In addition, the ratio of bluegills to largemouth bass during the electrofishing survey was in the middle of the range reported for lakes sampled as part of the Status and Trends Program during 2002-2007 (K. Wehrly, MDNR - Fisheries Division, unpublished). Age data were not available for channel catfish, but the size structure of the population suggests that growth is above average. Some of the older catfish in the 2011 sample may have been survivors from the Matteson Lake stocking events (located upstream on Little Swan Creek). The lack of fish smaller than 17 inches (presumably age 4 and younger) indicates that a limited amount of natural reproduction is occurring in this system. Northern pike abundance in Long Lake is about average for lakes in this region. The gill net CPE for northern pike was 2.5 fish/net night in Long Lake, compared to the statewide average of 2.6 fish/net night and the average of 2.5 fish/net night for southwestern Michigan lakes (K. Wehrly, MDNR -

Michigan Dept. of Natural Resources 2012-138 Status of the Fishery Resource Report Page 6 Fisheries Division, unpublished). The wetlands adjacent to Long Lake and the channel between Long and Palmer lakes provide spawning habitat for northern pike and yellow perch. These wetlands also serve as nursery areas for juvenile fish of many different species. Because these wetlands are so important to the continued health of the fish, reptile, and amphibian communities, they should be protected from future draining, filling, or development. The results of the 2011 survey and anecdotal reports from anglers indicate poor survival of stocked walleyes in Long Lake. Spring fingerling and fry stocking programs have created popular fisheries in the St. Joseph and Grand rivers, but these stocking programs have been less effective in inland lakes across southwest Michigan. The abundance of panfish (especially bluegills, crappies, and yellow perch) appears to have a strong negative effect on walleye survival. These species are prey for adult walleyes, but they can consume spring fingerling walleyes. Stocking in rivers likely has been more effective because panfish are less common and more of the fish community biomass is composed of minnows and suckers. The recent decline in water clarity in Long and Palmer Lakes is perplexing. One possible explanation is that the algal blooms are the result of colonization of Long and Palmer lakes by gizzard shad (G. Pullman, Aquest Corporation, personal communication). These fish may have been accidentally introduced during channel catfish stocking in Long, Palmer, or Matteson lakes. The channel catfish were purchased from a hatchery in Ohio where gizzard shad were used as forage for catfish. Another possible explanation is that gizzard shad were introduced via anglers releasing unused baitfish into the lake. Gizzard shad feed on zooplankton and decaying organic matter (Yako et al. 1996). Samples collected during August-September 2011 indicated that total zooplankton abundance was about average in Palmer Lake and low in Long Lake. However, Daphnia density was low in both lakes. There are caveats to this conjecture on the role of gizzard shad in promoting algae growth. On each lake, zooplankton were collected at a few locations during a single day. Thus, the reported densities may not accurately represent zooplankton densities in the lakes throughout the year. Second, gizzard shad only made up 5-7% of the biomass during the 2011 surveys on Long and Palmer lakes. In other systems where the ecological effects of gizzard shad have been studied, gizzard shad composed much greater percentages of the total biomass (e.g., Kirk et al. 1986; Dettmers and Stein 1996). Third, the interactions between planktivorous fish, zooplankton, and algae are complex (DeMelo et al. 1992). For example, Dettmers and Stein (1996) found that increasing gizzard shad abundance only affected algal production if Daphnia densities initially were high. Finally, if gizzard shad were severely depressing zooplankton abundance in Long and Palmer lakes, we would expect reductions in the abundance and growth of other planktivorous fishes (e.g., bluegill; Dettmers and Stein 1992). As noted previously, bluegill CPE was above average in Long Lake and substantially above average in Palmer Lake. In both lakes, bluegill growth was average. A wide variety of factors likely have contributed to the recent decline in water clarity in Long and Palmer lakes. Big Swan Creek and Little Swan Creek flow through a landscape that has been heavily modified for row crop agriculture. Thus, these streams probably deliver large quantities of sediment and nutrients to Long and Palmer lakes. During the 1990s, this eutrophication was manifested in dense growth of aquatic plants. When herbicides were used to reduce the abundance of rooted vegetation, more nutrients became available for growth of algae. High-speed boating activity also reduces water clarity by stirring up sediment from the lake bottom. Seawalls exacerbate this problem. Natural

Michigan Dept. of Natural Resources 2012-138 Status of the Fishery Resource Report Page 7 shorelines absorb wave energy (e.g., from passing boats), but seawalls reflect this energy back into the lake.
Management Direction Five fisheries management goals have been developed for Long Lake. Goal 1: Protect and rehabilitate habitat for fish and other aquatic organisms. Goal 2: Enhance the walleye fishery in Long Lake. Goal 3: Enhance the channel catfish fishery in the lake. Goal 4: Reduce the abundance of gizzard shad. Goal 5: Maintain a healthy predator-prey ratio within the fish community. At least three different methods will be used to accomplish Goal 1. Fisheries Division personnel will continue to review Michigan Department of Environmental Quality permit applications for potential effects on aquatic resources. If a proposed project is likely to degrade the aquatic habitat, Fisheries Division staff will object to the proposal and suggest feasible alternatives. Fisheries Division will work with the lake association and other organizations to educate riparian landowners on the effects of various practices (e.g., chemical weed treatments and seawall construction) on aquatic ecosystems. As opportunities arise, Fisheries Division also will provide technical assistance to local units of government interested in establishing ordinances that protect aquatic habitats from pollution or unwise development. Stocking spring fingerling walleyes in Long Lake has yielded poor returns. In southwest Michigan lakes, survival typically has been much greater for walleyes stocked as fall fingerlings as opposed to spring fingerlings, and even low density stockings have created popular fisheries in some systems. A fish stocking request will be submitted to stock 2,220 fall fingerling walleyes (10/acre) in Long Lake on a biennial schedule. Only a small percentage of Fisheries Division's walleye ponds are suitable for producing fall fingerlings. Fisheries Division is exploring options for producing more fall fingerling walleyes; however, the supply of fall fingerlings is likely to remain sporadic for the next several years. Private fish stocking (with an approved fish stocking permit) could be used to augment the walleye population until the Division consistently can fill the stocking request for Long Lake. Channel catfish is a popular game fish species in southern Michigan. Channel catfish also are known to consume gizzard shad. Thus, stocking channel catfish would facilitate attainment of goals 3 and 4. Biennial stocking of 2,220 yearling channel catfish (10 fish/acre) is recommended. The preferred size at stocking is 8 inches or larger. New protocols have reduced the likelihood of gizzard shad being transported with channel catfish. Given that gizzard shad already are established in this system, the benefit of increased predation pressure from stocked catfish greatly outweighs any risks of inadvertently stocking a few gizzard shad in the lake. The relative abundance of predators in Long Lake currently is at the low end of the acceptable range. Thus, the walleye and channel catfish stocking programs are not expected to overtax the forage base. In addition, channel catfish are opportunistic feeders and can consume aquatic insects and mollusks if abundance of prey fish decreases.
References Allen, M. S., C. J. Walters, and R. Myers. 2008. Temporal trends in largemouth bass mortality, with fishery implications. North American Journal of Fisheries Management 28:418-427.

Michigan Dept. of Natural Resources 2012-138 Status of the Fishery Resource Report Page 8 Carlson, R. E., and J. Simpson. 1996. A coordinator's guide to volunteer lake monitoring methods. North American Lake Management Society, Madison, Wisconsin. DeMelo, R., R. France, and D. J. McQueen. 1992. Biomanipulation: hit or myth? Limnology and Oceanography 37:192-207. Dettmers, J. M., and R. A. Stein. 1992. Food consumption by larval gizzard shad: zooplankton effects and implications for reservoir communities. Transactions of the American Fisheries Society 121:494-507. Dettmers, J. M., and R. A. Stein. 1996. Quantifying linkages among gizzard shad, zooplankton, and phytoplankton in reservoirs. Transactions of the American Fisheries Society 125:27-41. Kirk, J. P., W. D. Davies, and K. Park. 1986. Response of some members of the fish community to gizzard shad removal from Chambers County Public Fishing Lake, Alabama. North American Journal of Fisheries Management 6:252-255. Parsons, B. G., and J. R. Reed. 1998. Angler exploitation of bluegill and black crappie in four west-central Minnesota lakes. Minnesota Department of Natural Resources, Fisheries Investigational Report 468, St. Paul. Paukert, C. P., D. W. Willis, and A. L. Glidden. 2001. Growth, condition, and mortality of black crappie, bluegill, and yellow perch in Nebraska Sand Hills lakes. Great Plains Research 11:261-274. Schneider, J. C. 1990. Classifying bluegill populations from lake survey data. Michigan Department of Natural Resources, Fisheries Technical Report 90-10, Ann Arbor. Schneider, J. C. 2000. Interpreting fish population and community indices. Chapter 21 in Schneider, J. C., editor. 2000. Manual of fisheries survey methods II: with periodic updates. Michigan Department of Natural Resources, Fisheries Special Report 25, Ann Arbor. Schneider, J. C., P. W. Laarman, and H. Gowing. 2000. Age and growth methods and state averages. Chapter 9 in Schneider, J. C., editor. 2000. Manual of fisheries survey methods II: with periodic updates. Michigan Department of Natural Resources, Fisheries Special Report 25, Ann Arbor. Serns, S. L. 1982. Relationship of walleye fingerling density and electrofishing catch per effort in northern Wisconsin lakes. North American Journal of Fisheries Management 2:38-44. Serns, S. L. 1983. Relationship between electrofishing catch per unit of effort and density of walleye yearlings. North American Journal of Fisheries Management 3:451-452. Shaw, B., C. Mechenich, and L. Klessig. 2004. Understanding lake data. University of Wisconsin - Extension, Publication G3582, Madison.

Michigan Dept. of Natural Resources 2012-138 Status of the Fishery Resource Report Page 9 Weed Patrol, Inc. 2008. Long Lake: three-year vegetation management plan. Prepared for Michigan Department of Environmental Quality and the Colon Township Lake Board by Weed Patrol, Inc., Elkhart, Indiana. Yako, L. A., J. M. Dettmers, and R. A. Stein. 1996. Feeding preferences of omnivorous gizzard shad as influenced by fish size and zooplankton density. Transactions of the American Fisheries Society 125:753-759. Ziegler, W., and J. C. Schneider. 2000. Guidelines for evaluating walleye and muskie recruitment. Chapter 23 in Schneider, J. C., editor. 2000. Manual of fisheries survey methods II: with periodic updates. Michigan Department of Natural Resources, Fisheries Special Report 25, Ann Arbor.

Table 1.–Fish stocking in Long Lake, 1935-2011.
Year Species Life stage Number Number/acre Average length
(inches) 1935 Bluegill Fall fingerling 20,000 90 ---
Yellow perch Fall fingerling 5,000 23 --- 1936 Bluegill Fall fingerling 24,000 108 ---
Largemouth bass Fall fingerling 1,000 5 --- 1937 Bluegill Fall fingerling 50,000 225 --- 1938 Bluegill Fall fingerling 80,000 360 ---
Largemouth bass Fall fingerling 1,500 7 --- Yellow perch Fall fingerling 15,000 68 ---
1939 Bluegill Fall fingerling 80,000 360 --- Largemouth bass Fall fingerling 2,500 11 --- Yellow perch Fall fingerling 10,000 45 ---
1940 Bluegill Fall fingerling 60,000 270 --- Yearling 1,000 5 --- Largemouth bass Fall fingerling 2,000 9 --- Yearling 1,000 5 ---
1941 Bluegill Fall fingerling 120,000 541 --- Largemouth bass Fall fingerling 500 2 ---
1942 Bluegill Fall fingerling 30,000 135 --- Largemouth bass Fall fingerling 500 2 ---
1943 Bluegill Yearling 3,500 16 --- Largemouth bass Fall fingerling 500 2 ---
1944 Bluegill Fall fingerling 20,000 90 2.00 Largemouth bass Fall fingerling 3,000 14 3.00
1945 Bluegill Fall fingerling 15,000 68 2.00 Largemouth bass Fall fingerling 2,000 9 3.00
1992 Channel catfish Adult 1,000 5 9.64 1993 Walleye Spring fingerling 11,744 53 2.20 1994 Walleye Spring fingerling 10,800 49 1.78 1995 Walleye Spring fingerling 8,950 40 1.87 1999 Redear sunfish Fall fingerling 22,638 102 1.56 2000 Redear sunfish Fall fingerling 27,482 124 1.68 2001 Redear sunfish Fall fingerling 18,711 84 1.92 2002 Redear sunfish Fall fingerling 9,021 41 1.73 2003 Walleye Spring fingerling 20,238 91 1.22 2006 Walleye Spring fingerling 11,349 51 1.19

Table 2.–Sampling effort during the fish community survey on Long Lake, May-June 2011. Each net night equals one overnight set of one net.
Sampling period Gear Effort May 2-5 Trap net 3 net nights May 2-5 Large-mesh fyke net 9 net nights May 2-4 Small-mesh fyke net 4 net nights May 2-5 Graded-mesh gill net 6 net nights June 22 Electrofishing 30 minutes June 22 Seine 4 hauls (25 ft each)

Table 3.–Numbers, weights, lengths, and growth indices for fish species collected during the fish community survey on Long Lake, May-June 2011. Fish were captured using trap nets, fyke nets, gill nets, seines, and nighttime electrofishing gear.
Species Number Percent by
number Weight
(lbs) Percent by
weight
Length range
(inches)
Percent legal or
harvestable1 Growth index2
Bluegill 1,001 44.3 166.5 19.5 1-10 59 +0.1 Black crappie 469 20.7 296.4 34.7 5-13 99 +1.0 Spotfin shiner 97 4.3 0.8 0.1 1-3 --- --- Largemouth bass 83 3.7 39.8 4.7 1-22 7 -1.0 Johnny darter 81 3.6 0.1 0.0 1-1 --- --- Yellow bullhead 76 3.4 42.9 5.0 8-12 --- --- Yellow perch 68 3.0 1.7 0.2 1-10 6 -0.7 Bluntnose minnow 61 2.7 0.3 0.0 1-3 --- --- Gizzard shad 50 2.2 41.5 4.9 7-14 --- --- Warmouth 34 1.5 12.0 1.4 5-9 91 --- Golden redhorse 30 1.3 37.1 4.3 9-18 --- --- White sucker 28 1.2 27.0 3.2 1-19 --- --- Striped shiner 26 1.1 0.1 0.0 1-3 --- --- Channel catfish 24 1.1 78.0 9.1 11-32 96 --- Hybrid sunfish 22 1.0 6.6 0.8 4-9 86 --- Logperch 22 1.0 0.2 0.0 1-4 --- --- Northern pike 19 0.8 42.7 5.0 13-27 32 +0.9 Common shiner 13 0.6 0.1 0.0 1-3 --- --- Brook silverside 13 0.6 0.0 0.0 2-3 --- --- Pumpkinseed 11 0.5 2.7 0.3 2-8 73 --- Bowfin 9 0.4 35.8 4.2 17-26 --- --- Golden shiner 7 0.3 0.2 0.0 2-7 --- --- Brown bullhead 6 0.3 5.5 0.6 11-13 --- --- Spotted gar 4 0.2 4.3 0.5 11-24 --- --- Redear sunfish 2 0.1 1.6 0.2 9-10 100 --- Lake chubsucker 2 0.1 0.4 0.0 3-8 --- --- Common carp 1 0.0 7.6 0.9 25 --- --- Walleye 1 0.0 2.8 0.3 20 100 --- Rock bass 1 0.0 0.1 0.0 5 0 --- Blacknose shiner 1 0.0 0.0 0.0 2 --- --- Total 2,262 854.8 1 Harvestable size is 6 inches for bluegill, pumpkinseed, rock bass, hybrid sunfish, redear sunfish, and warmouth, and 7 inches for black crappie and yellow perch. 2 Average deviation from the state average length at age. Mean growth indices <-1 indicate below average growth, indices between -1 and +1 indicate average growth, and indices >+1 indicate growth is faster than the state average.

Long Lake
Palmer Lake
Swan Creek
Lepley Lake
Stur
geon
Lak
e
St. Joseph River
Lamberson Dam
N
Little Swan Creek
1 mile
Long Lake
Palmer Lake
Swan Creek
Lepley Lake
Stur
geon
Lak
e
St. Joseph River
Lamberson Dam
N
Little Swan Creek
Long Lake
Palmer Lake
Swan Creek
Lepley Lake
Stur
geon
Lak
e
St. Joseph River
Lamberson Dam
N
Long Lake
Palmer Lake
Swan Creek
Lepley Lake
Stur
geon
Lak
e
St. Joseph River
Long Lake
Palmer Lake
Swan Creek
Lepley Lake
Stur
geon
Lak
e
St. Joseph River
Lamberson Dam
N
Little Swan Creek
1 mile
Figure 1.–Aerial view of Long Lake and the surrounding area. Image from www.bing.com/maps.

²0 0.1 0.2 0.3Miles
5
10
20
30
30
32
PublicAccessSite
²0 0.1 0.2 0.3Miles
5
10
20
30
30
32
PublicAccessSite
Figure 2.–Bathymetry of Long Lake. Depths are in feet.

0
5
10
15
20
25
30
3554 56 58 60 62 64 66 68 70 72
Temperature (F)
Dep
th (f
t)
0
5
10
15
20
25
30
350 2 4 6 8 10 12
Dissolved oxygen concentration (ppm)
Dep
th (f
t)
Figure 3.–Temperature and dissolved oxygen profiles for Long Lake on September 13, 2011.

Trap Nets and Large-Mesh Fyke Nets
0
100
200
300
400
500
1 2 3 4 5 6 7 8+Total length (inches)
Num
ber o
f fis
h
n = 816
Electrofishing
0
10
20
30
40
50
1 2 3 4 5 6 7 8+Total length (inches)
Num
ber o
f fis
h
n = 137
All Gear Types
0
100
200
300
400
500
1 2 3 4 5 6 7 8+Total length (inches)
Num
ber o
f fis
h
n = 1,001
Figure 4.–Length frequency distributions for bluegills captured in Long Lake using trap nets and large-mesh fyke nets, nighttime electrofishing gear, and all gear types, May-June 2011.

0
1
2
3
4
5
6
7
8
9
0 1 2 3 4 5 6 7 8
Age (years)
Tota
l len
gth
(inch
es)
Long Lake (mean observed lengths)
State Average
Figure 5.–Growth of bluegills in Long Lake, as determined from scale and dorsal spine samples collected during May-June 2011. State average lengths from Schneider et al. (2000). Most of the age 1-2 bluegills were collected during the electrofishing survey in June, so the state average lengths for June-July are depicted for those ages. Conversely, the state average lengths for January-May are shown for ages 3-7, as most of the age 3 and older bluegills were captured during the netting survey in May.

0
10
20
30
40
50
1 2 3 4 5 6 7 8
Age (years)
% o
f cat
ch
Figure 6.–Age frequency distribution for bluegills captured in Long Lake with all gear types during May-June 2011.
Ln(Number) = 12.299 - 1.5438 * AgeR2 = 0.99, P = 0.0005
Annual mortality = 79%
0
1
2
3
4
5
6
7
0 1 2 3 4 5 6 7 8 9
Age (years)
Ln (N
umbe
r)
Figure 7.–Observed ln(number) versus age for bluegills captured in Long Lake with all gear types during May-June 2011.

0
50
100
150
200
5 6 7 8 9 10 11 12 13
Total length (inches)
Num
ber o
f fis
h n = 469
Figure 8.–Length frequency distribution for black crappies captured in Long Lake with trap nets, fyke nets, and gill nets during May 2011.
4
5
6
7
8
9
10
11
12
13
0 2 4 6 8 10
Age (years)
Tota
l len
gth
(inch
es)
Long Lake (mean observedlengths)State Average
Figure 9.–Growth of black crappies in Long Lake, as determined from scale and dorsal spine samples collected during May 2011. State average lengths from Schneider et al. (2000).

0
10
20
30
40
50
2 3 4 5 6 7 8 9 10 11 12 13
Age (years)
% o
f cat
ch
Figure 10.–Age frequency distribution for black crappies captured in Long Lake with trap nets, fyke nets, and gill nets during May 2011.
Ln(Number) = 6.5792 - 0.4469 * AgeR2 = 0.75, P = 0.0056
Annual mortality = 36%
0
1
2
3
4
5
6
0 2 4 6 8 10 12 14
Age (years)
Ln(N
umbe
r)
Figure 11.–Observed ln(number) versus age for black crappies captured in Long Lake with trap nets, fyke nets, and gill nets during May 2011.

0
5
10
15
20
25
1 2 3 4 5 6 7 8 9 10 11 12 13 14 15 16+
Total length (inches)
Num
ber o
f fis
h n = 83
Figure 12.–Length frequency distribution for largemouth bass captured in Long Lake with all gear types during May-June 2011.
0
2
4
6
8
10
12
14
16
18
0 1 2 3 4 5 6 7 8
Age (years)
Tota
l len
gth
(inch
es)
Long Lake (mean observed lengths)
State Average
Minimum size limit
Figure 13.–Growth of largemouth bass in Long Lake, as determined from scale and dorsal spine samples collected during May-June 2011. State average lengths for June-July are depicted because most of the largemouth bass were collected in June. State average lengths from Schneider et al. (2000).
0
5
10
15
20
25
0 1 2 3 4 5 6 7 8 >8
Age (years)
% o
f cat
ch
Figure 14.–Age frequency distribution for largemouth bass captured in Long Lake with all gear types during May-June 2011.
Ln(Number) = 4.2123 - 0.5247 * AgeR2 = 0.87, P = 0.0023
Annual mortality = 41%
-0.5
0
0.5
1
1.5
2
2.5
3
3.5
0 1 2 3 4 5 6 7 8 9
Age (years)
Ln(N
umbe
r)
Figure 15.–Observed ln(number) versus age for largemouth bass captured in Long Lake with all gear types during May-June 2011.

0
1
2
3
4
5
6
7
8
9
9-11 12-14 15-17 18-20 21-23 24-26 27-29 30-32
Total length (inches)
Num
ber o
f fis
hn = 24
Figure 16.–Length frequency distribution for channel catfish captured in Long Lake with all gear types during May-June 2011.
0
5
10
15
20
25
30
35
40
1 2 3 4
Age (years)
% o
f cat
ch
Figure 17.–Age frequency distribution for northern pike captured in Long Lake with all gear types during May-June 2011.

0
1
2
3
4
5
6
7
8
12-14 15-17 18-20 21-23 24-26 27-29
Total length (inches)
Num
ber o
f fis
hn = 19
Figure 18.–Length frequency distribution for northern pike captured in Long Lake with all gear types during May-June 2011.