long island's opioid crisis the staggering cost...
TRANSCRIPT

The Staggering Cost of Long Island's Opioid Crisis
The Economics of Addiction

This report was made possible by grants from the Long Island Community Foundation and the Claire Friedlander Family Foundation.
2

Table of Contents
Type something
Summary............................................................................................................................... 4Introduction.......................................................................................................................... 6Opioid Deaths on Long Island and in New York State................................................. 7Economic Damage.............................................................................................................. 14Opioid Crisis Impact on Business.....................................................................................19Opioid Overdose Deaths by Type of Opioid.................................................................. 25Opioid Deaths by Age......................................................................................................... 29Opioid Deaths by Gender.................................................................................................. 33Opioid Deaths by Race....................................................................................................... 37Conclusion............................................................................................................................ 40References............................................................................................................................ 41
3

The opioid crisis has had a huge human cost on Long Island. This study, for the first time, evaluates the economic impact of the opioids problem. We estimate the opioid crisis caused Long Island $8.2 billion in economic damage in 2017, slightly down from $8.4 billion in 2016. The extent of the losses has been remarkably high: 4.5 percent of Long Island’s gross domestic product (GDP) of $182.5 billion in 2017.
Summary
Type something
The total daily damage that addiction to opioids and overdose deaths caused the Long Island economy was $22.4 million in 2017 and $22.7 million in 2016. In 2017 and 2016 the economy-wide economic losses of opioid overdose deaths on Long Island were estimated at around $6.9 billion in each year while the costs associated with nonfatal opioid addiction totaled $1.4 billion for each of the years discussed in this study. Everybody pays one way or another for the opioid crisis: as a taxpayer, consumer, or business. Long Island businesses faced increased health care costs along with lost productivity due to opioids. In 2017 Long Island’s total private sector healthcare costs associated with opioids amounted to $172 million while lost productivity stood at $200 million. That is $5,400 and $6,300 per employee with opioid use disorder, respectively.
4

Suffolk: private health care cost $117 million; lost productivity cost $136 million;
Nassau: private health care cost $55 million; lost productivity cost $64 million.
In 2017 and 2016 the economic cost of opioid overdose deaths on Long Island was estimated at around $6.9 billion in each year while the costs associated with nonfatal opioid addiction totaled $1.4 billion for each year.
Losses associated with overdose deaths accounted for 83 percent of the total economic damages caused by the opioid epidemic on Long Island.
In 2017 Nassau and Suffolk Counties experienced 617 overdose deaths caused by opioids, the highest on record.
The number of opioid overdose mortalities on Long Island increased by 77 percent from 348 deaths in 2013 to 617 deaths in 2017.
In 2013 the state registered 1,681 deaths caused by opioids. By 2017 this number grew to 3,224, a 92 percent increase after only four years.
The increase in opioid overdose deaths on Long Island and throughout the state during 2017 was overwhelmingly driven by the introduction of inexpensive yet highly potent synthetic opiates such as fentanyl.
On Long Island, the rate of deaths involving synthetic opiates grew from 3.7 per 100,000 in 2014 to 29.1 per 100,000 in 2017, a three-year increase of 686 percent.
In New York State, the rate of deaths involving synthetic opiates grew from 2.2 per 100,000 in 2014 to 11.9 per 100,000 in 2017, a three-year increase of 441 percent.
5

Introduction The misuse of both prescription and illicit opioids has led to dramatic recent increases in addiction and overdose deaths across Long Island, New York State, and the nation. Opioid addiction has become a growing problem for the communities of Suffolk and Nassau. The purpose of this study is to estimate the economic damage of the opioid crisis on Long Island. At the national level, the Centers for Disease Control and Prevention (CDC) has attributed the decline in life expectancy of Americans in 2017 to the surge in overdose deaths. The last time the United States experienced a comparable decline in the average life expectancy was during the AIDS epidemic.1 According to a recent survey, nearly one in four New Yorkers knows a family member, friend, or acquaintance that has died from an opioid overdose.2 Through the analysis of data from the CDC and the New York State Department of Health (DOH), this report examines the size and scope of the opioid crisis in New York State and more specifically in the two counties that comprise Long Island, Nassau County and Suffolk County.3 Using the latest available data, this report provides an estimation of the economic damage caused by the opioid addiction crisis on Long Island in 2016 and 2017.
Long Island Speaks: A Father's Story
Our journey into the world of addiction began in 2007 when our oldest son was arrested, convicted, and sentenced to state prison. As the oldest brother, he heavily influenced his two younger brothers, and by the time he went to prison, they were both using prescription painkillers and the cheaper alternative, heroin. Following minor surgery after his release, my oldest son’s prescription painkiller habit returned, and he also switched to heroin. It is now 2019, and although we’ve seen progress, the dark cloud of addiction still looms over us. Families bear the staggering costs of addiction alone - think of paying for penalties, restitution, lawyers, court fees, bail, bail forfeiture fees, PSI fees, traffic fines, and violations, and that’s just the judicial side of things. Add to that addiction treatment with multiple detoxes, multiple rehabs, doctors, co-pays, and out-of-pocket expenses. Add to these financial burdens the immeasurable physical, mental, emotional, and social consequences of addiction on families. Despite these painful burdens, I still consider myself fortunate as my children are alive.
6

Type something
Opioid Deaths on Long Island and in New York State In 2017, there were 3,224 deaths resulting from opioid overdoses in New York State, a 92 percent increase from 1,681 such deaths in 2013. Opioids were involved in 80 percent of all drug overdose deaths in 2017. In 2017, New York State experienced 16.2 deaths due to opioids per 100,000 residents, which is higher than the U.S. average of 15.7 deaths per 100,000 residents. In 2016, there were 19 deaths per 100,000 residents, while the U.S. average was at 14.9 deaths per 100,000 persons.4 When compared with the rest of the country, New York has the 20th highest rate of opioid overdose deaths both in 2016 and 2017 (see Figure 1). West Virginia leads the nation with the highest rate of opioid overdose deaths in the country.
Map 1: In 2017 New York Ranked 20th in the Nation for Highest Rates of Opioid Overdose Deaths, Per 100,000
Source: Centers for Disease Control and Prevention, National Center for Health Statistics. Multiple Cause of Death 1999-2017 on CDC WONDER Online Database, released December, 2018. Data are from the Multiple Cause of Death Files 1999-2017, as compiled from data provided by the 57 vital statistics jurisdictions through the Vital Statistics Cooperative Program. Accessed at http://wonder.cdc.gov/mcd-icd10.html.
1 NPR, December 2017, Life Expectancy Drops Again As Opioid Deaths Surge in the US. Available at: https://www.npr.org/sections/health-shots/2017/12/21/572080314/life-expectancy-drops-again-as-opioid-deaths-surge-in-u-s 2 Siena Research Institute, April 2018. Siena College Poll: New York State Opioid Epidemic. Available at: https://scri.siena.edu/wp-content/uploads/2018/08/PfP_Press_Release_1_-_Final.pdf 3 As of this writing, 2017 is most recent year with reliable data through the CDC's WONDER Database.4 Centers for Disease Control, Drug and Opioid-Involved Deaths-United States, 2013-2017. Morbidity Mortality Weekly Report, 67:1419-1427. Available at: https://www.cdc.gov/mmwr/volumes/67/wr/mm675152e1.htm#suggested citation
4.610 3.6 7.6
16468.3 16.220.48.16.53.1 19.9
5.6 13.7 10.314.7 4.9 15.626 14.7
9.9 196.315.913.2 14.99.7
8.95.2
15.513.8 3.7
18.3
31.6
26.621.9
26.9
27.9
17.2 36.817.6
6.2 8.7
18.914.9
45.9
32.8
3.7
26.1
26
7

Figure 1: In 2017 New York Ranked 20th in the Nation for Highest Rates of Opioid Overdose Deaths, per 100,000 Source: Centers for Disease Control and Prevention, National Center for Health Statistics. Multiple Cause of Death 1999-2017 on CDC WONDER Online Database, released December, 2018. Data are from the Multiple Cause of Death Files 1999-2017, as compiled from data provided by the 57 vital statistics jurisdictions through the Vital Statistics Cooperative Program. Accessed at http://wonder.cdc.gov/mcd-icd10.html.
West VirginiaOhio
District of ColumbiaMaryland
New HampshireMassachusetts
MaineConnecticut
Rhode IslandDelawareKentucky
New JerseyMichigan
PennsylvaniaNorth Carolina
TennesseeVermont
IndianaIllinois
New YorkWisconsin
New MexicoMissouri
FloridaSouth Carolina
US AverageUtah
VirginiaAlaska
NevadaArizona
ColoradoWashington
OklahomaGeorgia
LouisianaAlabama
OregonWyoming
MinnesotaIowa
ArkansasMississippi
IdahoCalifornia
TexasKansas
North DakotaSouth Dakota
HawaiiMontanaNebraska
45.936.8
35.232.8
31.627.9
26.926.6
26.12626
21.920.4
19.91918.9
18.317.6
17.216.21615.915.615.5
14.914.914.714.7
13.813.7
13.210.3109.99.7
8.98.7
8.38.1
7.66.56.36.26
5.65.24.94.6
43.73.6
3.1
In 2017 New York Ranked 20th in the Nation for Highest Rates of Opioid Overdose Deaths per 100,000 Population
8

The epidemic is fueled by both lawful and illicitly obtained opioids. Nearly nine million opioid prescriptions were dispensed in New York State in 2016.5 Despite the efforts by both the federal and state government to curb the opioid overdose crisis, the rate of all opioid deaths in New York State increased by 84 percent from 8.8 deaths per 100,000 in 2014 to 16.2 deaths per 100,000 in 2017 (see Figure 2). Since 1999 there has been a 391 percent increase in the rate of opioid overdose deaths in New York State. The most significant increase in opioid related deaths on record occurred between 2011 and 2017 when the death rate jumped by 131 percent from seven to 16.2 deaths per 100,000.
Figure 2: In 2017 the Highest Rate of Opioid Deaths per 100,000 was Recorded in New York State
Source: Centers for Disease Control and Prevention, National Center for Health Statistics. Multiple Cause of Death 1999-2017 on CDC WONDER Online Database, released December, 2018. Data are from the Multiple Cause of Death Files 1999-2017, as compiled from data provided by the 57 vital statistics jurisdictions through the Vital Statistics Cooperative Program. Accessed at http://wonder.cdc.gov/mcd-icd10.html.
0
2
4
6
8
10
12
14
16
18
1999 2000 2001 2002 2003 2004 2005 2006 2007 2008 2009 2010 2011 2012 2013 2014 2015 2016 2017
The Crude Rate of Opioid Overdose Deaths Per 100,000 is 5 Times Higher Than the Rate in 1999
9

Figure 3: The Rate of Opioid Overdose Death by County in New York State, per 100,000 in 20176
Source: Centers for Disease Control and Prevention, National Center for Health Statistics. Multiple Cause of Death 1999-2017 on CDC WONDER Online Database, released December, 2018. Data are from the Multiple Cause of Death Files 1999-2017, as compiled from data provided by the 57 vital statistics jurisdictions through the Vital Statistics Cooperative Program. Accessed at http://wonder.cdc.gov/mcd-icd10.html.
In 2017 out of twenty-four counties in New York State with reliable opioid death rates data, Suffolk County has the second-highest rate of opioid deaths per 100,000 and Nassau County has the 18th highest ranking in the state (see Figure 3). The highest rate is in Sullivan County (34). While Nassau County’s opioid death rate is 30 percent lower than the county average, Suffolk County’s opioid death rate is 41 percent higher than the state average. In 2016 Nassau County also had the 18th highest rate of opioid overdose deaths in New York State; Suffolk County was fifth in the state for the highest rate of opioid overdose deaths. The number of opioid overdose deaths in Suffolk County outpaces those in Nassau County (see Figure 4). While Nassau County has experienced a relatively stagnant rate of deaths caused by opioids, Suffolk County has continued to see the number of deaths rise. This sharp increase in opioid-related deaths began in 2015, and since then the number of deaths nearly doubled from 220 deaths to 424 deaths in 2017.
Sulliv
an
Su�olk
Dutchess Erie
Broome
Ulster
Monroe
Putnam
Chautauqua
Richmond
Oneida
Orange
Schenecta
dy
County Ave
r…Bro
nx
Niagara
Onondaga
Nassau
Albany
Westcheste
r
New YorkKings
Rockland
Queens
Rate of Opioid Deaths by County in New York State, Per 100,000 Persons in 2017
6 The "county average" is an average of all counties in New York State with reliable data; this makes it higher than the New York state average shown in Figure 1.
10
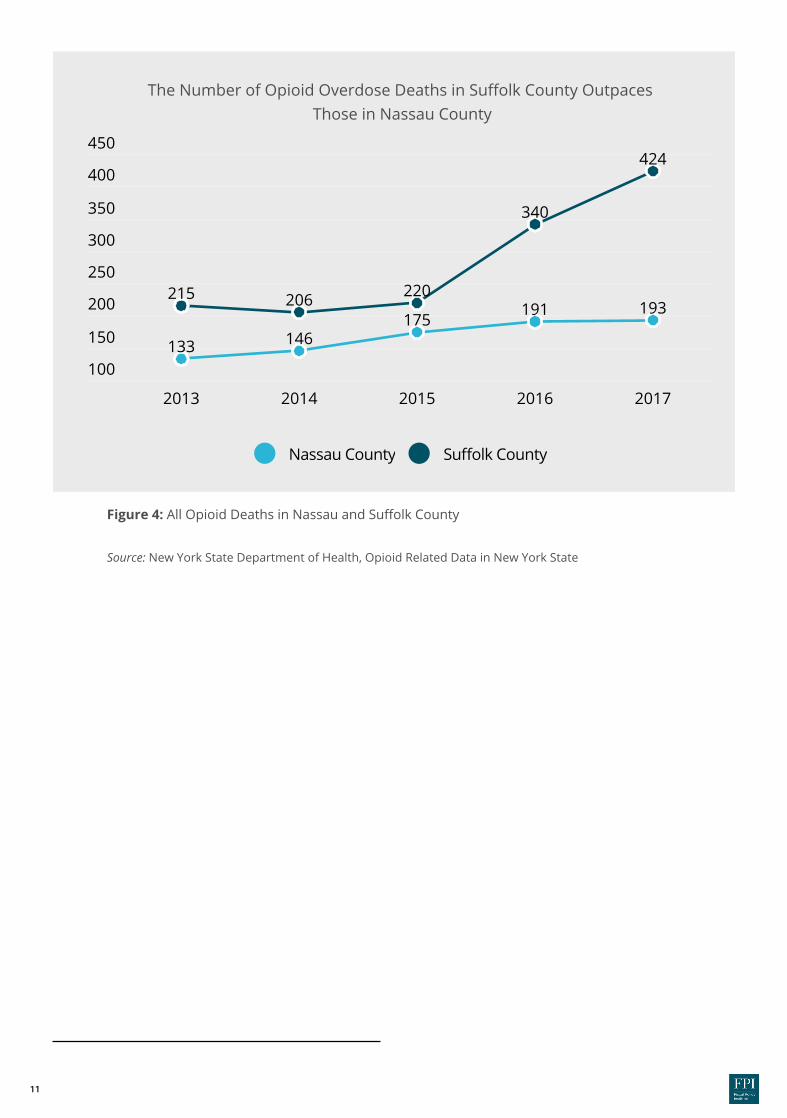
Figure 4: All Opioid Deaths in Nassau and Suffolk County Source: New York State Department of Health, Opioid Related Data in New York State
100
150
200
250
300
350
400
450
2013 2014 2015 2016 2017
133 146175
191 193215 206 220
340
424
Nassau County Su�olk County
The Number of Opioid Overdose Deaths in Suffolk County Outpaces Those in Nassau County
11

Of the 617 opioid-related deaths that occurred on Long Island in 2017, nearly 70 percent occurred in Suffolk County (see Figure 5). Suffolk has a larger population, but not enough to account for this level of difference. Figures 4 and 5 show the changes in opioid overdose deaths on Long Island.
Figure 5: Nearly 70 percent of all opioid overdose deaths on Long Island occurred in Suffolk County in 2017 Source: New York State Department of Health, Opioid Related Data in New York State
Figure 6: In 2017, Long Island accounted for 19 percent of all opioid overdose deaths in New York State Source: New York State Department of Health, Opioid Related Data in New York State
90%
60%
30%
0
2013 2014 2015 2016 2017
38%
62%
41%
59%
44%
56%
36%
64%
31%
69%
Share of LI Deaths in Nassau County Share of LI Deaths in Su�olk County
Long Island accounted for 19 percent of all opioid overdose deaths in New York in 2017 (see Figure 6). Suffolk County made up 13 percent of all opioid overdose deaths in New York State in 2017 and Nassau County represented six percent.
Nearly 70 Percent of All Opioid Overdose Deaths on Long Island Occurred in Suffolk County in 2017
In 2017 Long Island Accounted for 19 Percent of All Opioid Overdose Deaths in New York State
24%
18%
12%
6%
0
2013 2014 2015 2016 2017
8%
13%
8%
12%
8%
10%
6%
11%
6%
13%
Share of LI Deaths in Nassau County Share of LI Deaths in Su�olk County
12

Type something
Long Island Speaks: At Risk at Homeby Lavena Sipes
On November 24, 2009, I was crossing Main Street in Smithtown with Courtney, my11-year-old daughter, and my 14-year-old son, to go to a music lesson. As my daughter was crossing the street, a car came down Main Street driving in excess of 60 mph in a 30 mph zone and struck my daughter, who was thrown in the air and landed under a parked car. Courtney died shortly after from her injuries. The 20-year-old driver who later admitted to being high on heroin when she hit my daughter, left the scene and surrendered 26 hours later to the Suffolk County police. She was sentenced to 8 to 12 years and was released after 8 years under conditional parole. The choices she made that day to buy heroin, inject it and then drive down Main Street not only impacted her own life, but it irrevocably changed mine and my family’s lives forever. Courtney's death was a preventable tragedy and we must make every effort ensure no other family pays the ultimate price for someone's addiction.
13

Economic Damage
The methodology chosen in this study for the evaluation of the economic damage on Long Island due to opioids is widely used throughout the literature. Notably, the Council of Economic Advisors to the President of the United States used it in their 2017 analysis of the opioid epidemic in the US.7 Opioid use disorder (OUD) is associated with two types of costs: fatality and non-fatality costs. Fatality costs are those connected with premature death. Non-fatality costs are those incurred by individuals who are addicted to opiates. The total cost of the opioid epidemic is the sum of these fatal and nonfatal costs.
To calculate the permanent, irrecoverable damage of fatality costs the age-depended “Value of a Statistical Life” (VSL) is multiplied by the corresponding number of opioid overdose deaths for each age category obtainable in the Center for Disease Control WONDER database. When people die, their loss is also a loss to the economy in the form of work they might have done, for example, or purchases and investments they might have made. The VSL is a way to estimate in dollars and cents how much their absence costs the economy. Governments consistently base cost-benefit analyses on VSL measures that are designed to estimate the monetary value of the expected benefits of fatality risk-reduction associated with proposed policies. We apply an empirically estimated range of VSL of $3.4 million for individuals over age 55 and $9.7 million for individuals aged 35 to 44 (in 2000 dollars) as established in Aldy and Viscusi.8 The range is designed to realistically demonstrate how the VSL rises and then falls with age across the population and over the life cycle challenging conventional assumptions that VSL steadily declines with age.9 The VSL estimates used in this study are in current dollars. Based on this method, our estimate of the economic damages caused by opioid-related fatalities on Long Island totaled around $6.9 billion in 2016 and $6.9 billion in 2017.
7 The Council of Economic Advisers, 2017, The Underestimated Cost of the Opioid Crisis. Available at: https://www.whitehouse.gov/sites/whitehouse.gov/files/images/The%20Underestimated%20Cost%20of%20the%20OpioiType something
14

Figure 7 shows the age distribution of opioid overdose deaths on Long Island in 2017 as well as the inflation-adjusted VSL estimates used in this analysis. On Long Island, most opioid overdose deaths occurred among prime-aged individuals (aged 25-34) with higher estimated VSLs.
Figure 7: 25-34 Age Group Experienced the Highest Share of All Opioid Related Deaths on Long Island, 2017
Source: Centers for Disease Control and Prevention, National Center for Health Statistics. Multiple Cause of Death 1999-2017 on CDC WONDER Online Database, released December, 2018. Data are from the Multiple Cause of Death Files 1999-2017, as compiled from data provided by the 57 vital statistics jurisdictions through the Vital Statistics Cooperative Program. Accessed at http://wonder.cdc.gov/mcd-icd10.html.
35%
30%
25%
20%
15%
10%
5%
0
15-24 years 25-34 years 35-44 years 45-54 years 54-64 years
9%
24%
21%
14%
8 Aldy, J.,Viscusi, W., 2008. Adjusting the value of a statistical life for age and cohort effects. Review of Economics and Statistics 90(3): 573-581. Available at https://law.vanderbilt.edu/files/archive/279_Adjusting-VSL-for-Age-and-Cohort-Effects.pdf 9 The age dependent VSLs for 2016 used are as follows: 18-24 VSL of $5.3 million, 25-34 VSL of $13.5 million, 35-44 VSL of $13.8 million, 45-54 VSLof about $11.5 million, 55-64 VSL of $4.9 million. The age dependent VSLs for 2017 used are as follows: 18-24 VSL of $5.5 million, 25-34 VSL of about $13.8 million, 35-44 VSL of abut $14.1 million, 45-54 VSL of about $11.8 million, 55-62 VSL of $5 million
33%
VSL $5.5 M VSL $13.8 M VSL $14.1 M VSL $11.8 M VSL $5 M
25-34 Age Group Experienced the Highest Share of All Opioid Overdose Deaths on Long Island in 2017
15

Type something
The CEA methodology for estimating the non-fatality cost is to multiply the total number of individuals addicted to opioids in the U.S. by the average cost associated with individuals with a prescription opioid use disorder. Addiction to opiates reduces worker productivity and their ability to work while increasing their consumption of health care and social services. In the CEA study, the number of people with opioid dependency was taken from the national statistics provided by the US Substance Abuse and Mental Health Services Administration.10
While this estimation of people addicted to opioids works well on a national level, to accurately estimate this population on Long Island we used data from the New York State Department of Health, which details the number of people admitted to chemical dependence treatment programs for any opioid (including heroin) in the Office of Alcoholism and Substance Abuse Service (OASAS) certified programs in both Suffolk and Nassau Counties. All certified chemical dependence treatment programs in New York State are required to report admission and discharge data to OASAS which allows us to conservatively estimate the number of people who are addicted to opiates within New York State. A recent Johns Hopkins School of Public Health study found that only 20 percent of people addicted to opioids are receiving treatment.11 Under the assumption that one in five people with addictions is receiving treatment, we produce a realistic estimate of the number of people on Long Island who were addicted to opioids in 2017 and 2016 (see Table 1). The second component of our nonfatality cost estimate includes a computation of the average cost that individuals who are addicted to opioids incur in the form of increased consumption of health care, law enforcement, and social services. The CEA uses the estimate in Florence et al. that concludes these costs amount to $30,000 per person.12 Our estimated non-fatality costs totaled to over $1.4 billion in 2016 and just under $1.4 billion in 2017 (see Table 1).
16

Table 1: Estimate of Nonfatalitiy Cost on Long Island, 2016 & 2017 Source: New York State Department of Health, Opioid Related Data in New York State
Number of OUD patients receiving treatment 9,619 9,090
Estimated number of OUD patients not receiving treatment 38,476 36,360
Estimate of total number of OUD individuals 48,095 45,450
Average cost associated with individuals with OUD $30,000 $30,000
Total Non-fatality Damages $1,442,850,000 $1,363,500,000
2016 2017
The total economic damage caused by the opioid crisis on Long Island amounted to $8.2 billion in 2017. Overdose deaths caused by opioids account for $6.9 billion in economic damages, 83 percent of the total economic damages. The nonfatality cost of the opioid crisis amount to $1.4 billion in economic damages, 17 percent of the total economic damages. The total economic damage caused by the opioid crisis on Long Island amounted to $8.4 billion in 2016.
10 U.S. Substance Abuse and Mental Health Services Administration, 2016. Key Substance Use and Mental Health Indicators in the United States: Results from the 2015 National Survey on Drug Use and Health. Available at: https://www.samhsa.gov/data/sites/default/files/NSDUH-FFR1-2016/NSDUH-FFR1-2016.htm
11 Karthikeyan, S., Sloner, B., 2015. Change in Substance Abuse Treatment Use Among Individuals With Opioid Use Disorders in
the United State, 2004-2013. Journal of the American Medical Association. Available at: https://jamanetwork.com/journals/jama/fullarticle/2456156 12 Florence, C., Zhou, C., Luo, F. & Xu, L.,2016. The economic burden of prescription opioid overdose, abuse, and dependence in the United States, 2013. Medical Care, 54(10): 901-906. Available at: https://www.ncbi.nlm.nih.gov/pmc/articles/PMC5975355/
Table 1: Estimate of Non-fatality Cost on Long Island, 2016 and 2017
17

Long Island Speaks: Addiction is Stealing Our Futureby Teri Kroll
Addiction is a disease that robs families emotionally, physically and financially as well as stealing our community’s next generation. To protect others, Tim alerted the authorities about the doctor who was eventually caught selling prescriptions and got a plea deal where he received a six-month sentence in return for pleading guilty - a tiny price compared to the devastation caused by his illegal prescriptions. While nothing will bring Tim back or restore those lost years, we can all work to support and protect others locally with LICADD, PUSH, Thomas Hope Foundation, FIST, LIRA, Save the Michaels and more, as well as statewide and national groups including FED UP! While advocacy has resulted in real assistance in our state including the Community Overdose Prevention (COP) program, the 911 Good Samaritan Law and I-STOP law (Internet System for Tracking Over-Prescribing), and Nassau County's Tim's Law establishing a 24-hour substance abuse hotline, much more is needed to prevent anyone else from being prescribed into addiction.
My son Timothy was prescribed into addiction as a young man by a doctorhe believed would cure his severe migraines. Our family fought hard to save our son - there is nothing that families won't do to save their children including spending their life savings on treatment. Although milestones were reached - Tim had a 3.8 average and earned three college degrees in Liberal Arts, Computer Science and Math and was ready to start a career in computer science - the years of addiction took their toll and Tim died at age 23, denied the chance to live a productive life.
18

Opioid Crisis Impact on Business
The opioid epidemic results in a substantial burden for businesses in the form of workers’ tardiness, absenteeism, injuries, and health insurance costs. In fact, productivity losses and addiction-related health insurance costs amount to almost 40 percent of the non-fatality economic damage. For individual businesses, these costs may vary, but it is clear that there are substantial impacts on the bottom lines and operations of businesses across Long Island.
Often, an employer’s response is either to screen or to terminate addicted employees. This approach, however, can backfire: it may cause employees who suffer from substance abuse to avoid treatment. The losses to businesses in the form of healthcare use, unscheduled leave, and turnover, therefore, remain unaddressed. The number of addiction-related deaths was rising steadily until recently, despite federal and state efforts to address the opioid crisis. More observation is required before it is possible to either establish whether the reversal will become a new trend and to what policies it would be attributable. Recent positive national reports notwithstanding, the harm the opioid crisis has already done is likely to be long-term, and lasting through the period of improvement. The opioid abuse disorder affects not only the addicted individuals and their health but also their families, friends, communities, and their workplaces. The OECD recently reported that the opioid epidemic is responsible for recent declines in the labor force participation rate13; the research by Alan Krueger, a Princeton economist, documented that over 50 percent of prime-age white men who are out of the labor force report taking prescription opioids daily.14
13 Organisation for Economic Co-operation and Development (OECD), 2018. Economic Survey of the United States. Available at: http://www.oecd.org/eco/surveys/Overview-United-States-2018-OECD.pdf 14 Krueger, Alan, 2017. Where have all the workers gone? An inquiry into the decline of the U.S. labor force participation rate. Brookings Institute. Available at: https://www.brookings.edu/bpea-articles/where-have-all-the-workers-gone-an-inquiry-into-the-decline-of-the-u-s-labor-force-participation-rate/
19

Opioid dependence and misuse reduces the pool of available workers in a highly undesirable way and increases competition among employers for the remaining labor. This drives up both the cost of hiring and the resulting wage rates independent of productivity. However, despite the increased allocation of resources to drug screening, the majority of addicted individuals end up employed and, upon employment, start costing their employers substantial sums of money.
"The numbers suggest that many people taking opioids are actually employed: comprehensive prescription data reveals that nearly 85% of opioids prescribed for working age people are paid for by private health insurance, which is overwhelmingly employer provided…. While not everyone who uses opioids gets them directly from a physician—some prescriptions are illegally diverted to other users and an increasing number of addicts turn to heroin or illicit fentanyl—the fact remains that many people who take opioids either begin by using or continue to use legally prescribed medications that are paid for by employer-provided health insurance.”15
15 Currie, J., Schnell, M. August 2018. A Closer Look at How the Opioid Epidemic Affects Employment. Harvard Business Review, Available at: https://hbr.org/2018/08/a-closer-look-at-how-the-opioid-epidemic-affects-employment 16 See Table 1
In 2017 9,090 patients were treated for opioid dependence on Long Island, 2,915 in Nassauand 6,175 in Suffolk.16 As stated above, the research suggests that only 20 percent of peoplewith opioid addictions are receiving treatment for their addiction, and approximately 70percent of those who are dependent on opioids are employed. Therefore we are able toestimate that there are 45,450 people who are living with an addiction to opioids on Long Island.The costs of opioid abuse attributable to healthcare expenses and lost productivity are 18 and 21percent of the total non-fatality damage, respectively. That is, the addiction-related privatehealthcare cost is $5,400 per employed user (18 percent of $30,000). The lost productivity is $6,300 per worker with addiction (21 percent of $30,000). With some leakages plausibly present all or most of these costs are expected to be directly absorbed by employers. The total private sector damage is large. As a whole, Long Island suffered $172 million ofdrug-related private healthcare costs and $200 million of productivity losses in 2017. InSuffolk, the damage amounts to $117 and $136 million, while in Nassau the damage is $55 and $64 million respectively (see Tables 2 and 3). Broken up by industry employment (assuming an even distribution of people with addictions across industries), the computation presents a roughestimate of how much drug addiction-related damage each industry is likely to absorb presently.Education/Health, Professional services, and Retail are the top three sectors, which account forabout half of Long Island’s employment. In 2016, there were 9,619 patients: 6,463 in Suffolk and3,156 in Nassau. The 2016 drug-related private healthcare costs were $182 million, whileproductivity losses were $212 million on Long Island as a whole. In Suffolk, the harm was equal to$122 and $142 million, while in Nassau the damage was $60 and $70 million respectively in 2016.
20
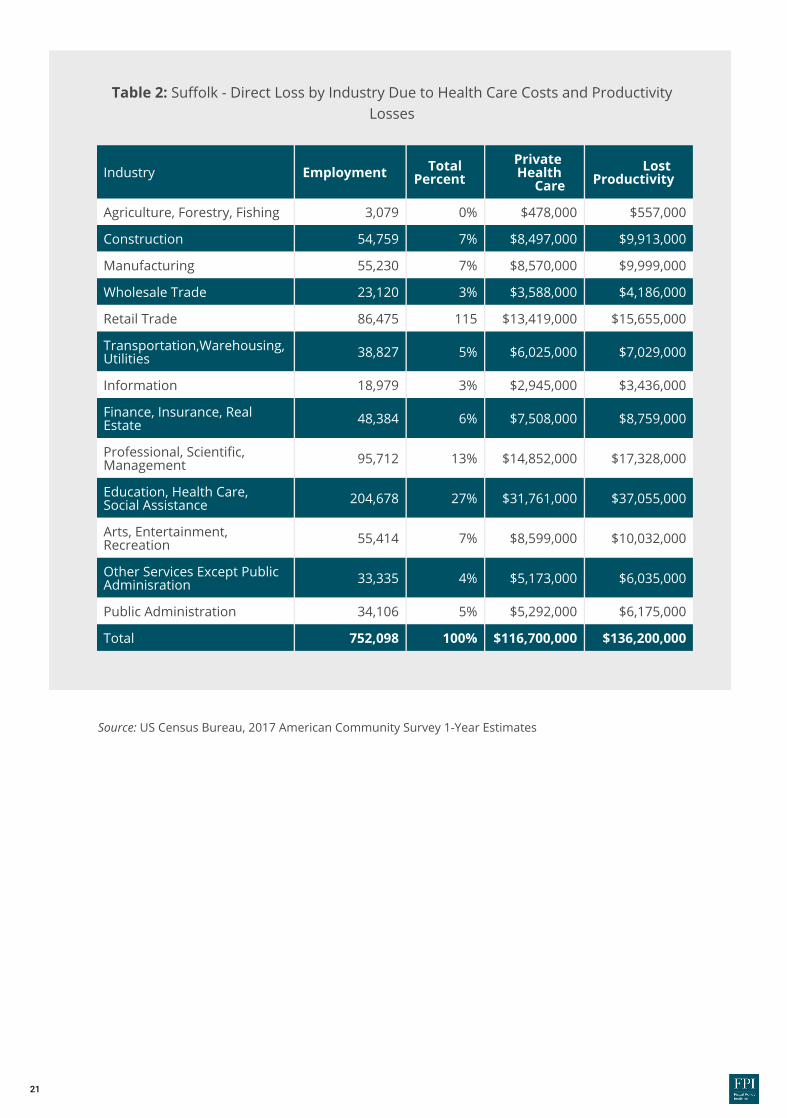
Source: US Census Bureau, 2017 American Community Survey 1-Year Estimates
Agriculture, Forestry, Fishing 3,079 0% $478,000 $557,000
Construction 54,759 7% $8,497,000 $9,913,000
Manufacturing 55,230 7% $8,570,000 $9,999,000
Wholesale Trade 23,120 3% $3,588,000 $4,186,000
Retail Trade 86,475 115 $13,419,000 $15,655,000
Transportation,Warehousing, Utilities 38,827 5% $6,025,000 $7,029,000
Information 18,979 3% $2,945,000 $3,436,000
Finance, Insurance, Real Estate 48,384 6% $7,508,000 $8,759,000
Professional, Scienti�c, Management 95,712 13% $14,852,000 $17,328,000
Education, Health Care, Social Assistance 204,678 27% $31,761,000 $37,055,000
Arts, Entertainment, Recreation 55,414 7% $8,599,000 $10,032,000
Other Services Except Public Adminisration 33,335 4% $5,173,000 $6,035,000
Public Administration 34,106 5% $5,292,000 $6,175,000
Total 752,098 100% $116,700,000 $136,200,000
Industry Employment Total Percent
Private Health
CareLost
Productivity
Table 2: Suffolk - Direct Loss by Industry Due to Health Care Costs and Productivity Losses
21

Source: US Census Bureau, 2017 American Community Survey 1-Year Estimates
Agriculture, Forestry, Fishing 423 0% $34,000 $39,000
Construction 39, 573 6% $3,145,000 $3,669,000
Manufacturing 31,365 5% $2,493,000 $2,908,000
Wholesale Trade 24,423 4% $1,941,000 $2,264,000
Retail Trade 69,353 10% $5,512,000 $6,430,000
Transportation,Warehousing, Utilities 35,980 5% $2,859,000 $3,336,000
Information 17,041 2% $1,354,000 $1,580,000
Finance, Insurance, Real Estate 71,527 10% $5,685,000 $6,632,000
Professional, Scienti�c, Management 88,862 13% $7,062,000 $8,239,000
Education, Health Care, Social Assistance 204,041 29% $16,216,000 $18,919,000
Arts, Entertainment, Recreation 49,963 7% $3,971,000 $4,633,000
Other Services Except Public Adminisration 28,478 4% $2,263,000 $2,640,000
Public Administration 32,197 5% $2,559,000 $2,985,000
Total 693,226 100% $55,100,000 $641,000,000
Industry Employment Total Percent
Private Health
CareLost
Productivity
Table 3: Nassau - Direct Loss by Industry Due to Health Care Costs and Productivity Losses
22

Source: Results from the 2017 National Survey on Drug Use and Health: Detailed Tables, Substance Abuse and Mental Health Services Administration Center for Behavioral Health Statistics and Quality.
Illicit drug use among the unemployed rose from just over 18 percent in 2013 to almost 21 percent in 2016 and 2017. Still, over a quarter of those employed either full-time or part-time are current illicit drug users, and a majority, around 70 percent, of all current users are employed. Illicit drug use among the employed has been on the rise since 2013 for both part-time and full-time workers (see Table 4).
Full-time 9.1 11.1 12.1
Part-time 13.7 14.4 14.8
Unemployed 18.3 20.8 20.7
Other 6.6 7.7 8.1
2013 2016 2017
As the labor market tightened with unemployment rates steadily declining since 2011 on Long Island, the share of current users of illicit drugs is estimated to have risen among the unemployed through 2016 and remained practically at the same level in 2017. Thus, finding workers unaffected by the addiction has become progressively more challenging for employers who are eager to hire workers as the post-Great Recession recovery continues. The increasing illicit drug use among the employed suggests that screening failures have likely also risen during this period which would, in turn, lead to more addiction-related costs internalized by employers. This predictably leads to two suboptimal strategies for businesses. The first strategy is to commit more resources and time to screening prospective employees thereby increasing hiring costs. The second—is to hire quickly and expose their businesses to potential costs knowing the percentage of Long Island workers are suffering from drug addiction. The alternative and, perhaps, better way—after realizing that everybody pays for the drug epidemic one way or another as business owners, taxpayers, and consumers—is to institute recovery, screening, and education policies that would support businesses and destigmatize their employees affected by substance abuse. Addressing the problem effectively would be good for business: thousands of dollars could be saved per employee who recovers from a substance abuse disorder.
Table 4: Current Illicit Drug Users by Employment Status (in percent)
23

Long Island Speaks: A Mother's Story
We must stop judging the people who struggle with addiction and blaming them for their choices because it is not a choice; it’s a disease that they struggle with every day. My son begged me to help him, and I did try everything humanly possible to help him break the grip of addiction, but we did not succeed.
Before you judge, take one step back and pray, you never walk in my shoes. I am now the one who struggles every day by not having my son with me. His son will never get to meet his dad as he was born after my son passed away.
Before you criticize someone on what you perceive to be their failings, remember today it was my son and tomorrow it could be yours.
24

Opioid Overdose Deaths by Type of OpioidIn 2017, opioids were involved in almost four out of five of all drug deaths in New York.17 The details of which opioids were responsible for the thousands of overdose deaths has the potential to enable policy-makers and healthcare providers to identify the most appropriate prevention and response tools and approaches. The rates of overdose deaths that involved opioids have increased between 2000 and 2017 in New York State. Figure 8 shows them by the specific type of opioid: heroin, commonly prescribed opioids, and synthetics. Heroin is a semi-synthetic, highly addictive opioid that is made from morphine, a substance taken from opium poppy plants, and is an illegal drug.18 Commonly prescribed opioids include methadone and drugs like oxycodone, hydrocodone, hydromorphone, and oxymorphone, which are all used to treat pain.19 Health care providers in New York wrote 37.8 opioid prescriptions for every 100 people - or nearly 1/3 of every 100 patients. This is low when compared to the US average rate of 58.7 prescriptions written per 100 people in 2017.20 Yet, New York's rate of opioid overdose deaths is above the national average. Synthetic opioids are a class of drugs that are designed to provide pain relief, mimicking naturally occurring opioids such as codeine and morphine.21 They include drugs like tramadol and fentanyl that tend to be highly potent. This means only a small amount of the drug is required to produce a given effect. Although synthetic opioids are manufactured by pharmaceutical companies, they are also manufactured illegally in clandestine labs and distributed through the illicit drug market.
17 FPI analysis of US Census Bureau, 2017 American Community Survey 1-Year Estimates 18 Centers for Disease Control and Prevention, 2018, Heroin Overdose Data. Available at: https://www.cdc.gov/drugoverdose/data/heroin.html 19 Centers for Disease Control and Prevention, 2018, Prescription Opioid Data. Available at: https://www.cdc.gov/drugoverdose/opioids/prescribed.html 20 National Institute on Drug Abuse, March, 209. New York Opioid Summary. https://www.drugabuse.gov/opioid-summaries-by-state/new-york-opioid-summary 20 Centers for Disease Control and Prevention, 2018, Synthetic Opioid Overdose Data. Available at: https://www.cdc.gov/drugoverdose/data/fentanyl.html21 National Institute on Drug Abuse, March, 2009. New York Opioid Summary.https://www.drugabuse.gov/opioid-summaries-by-state/new-york-opioid-summary
25

0
2
4
6
8
10
12
14
2000 2001 2002 2003 2004 2005 2006 2007 2008 2009 2010 2011 2012 2013 2014 2015 2016 2017
Heroin Commonly Prescribled Opioids Fentanyl /Synthetic Opioids
Figure 8: Death Rates Involving Opioids by Type, 2000-2017
Source: Centers for Disease Control and Prevention, National Center for Health Statistics. Multiple Cause of Death 1999-2017 on CDC WONDER Online Database, released December, 2018. Data are from the Multiple Cause of Death Files 1999-2017, as compiled from data provided by the 57 vital statistics jurisdictions through the Vital Statistics Cooperative Program. Accessed at http://wonder.cdc.gov/mcd-icd10.html.
From 2006 to 2013, commonly prescribed opioids accounted for the highest rates of overdose deaths of any opioid in New York (see Figure 8). However, 2010 marks the rise in overdose deaths caused by heroin. Between 2010 and 2017, there was a 580 percent increase in the rate of deaths caused by heroin in New York State from one death per 100,000 in 2010 to 6.8 deaths per 100,000 in 2017. The rise of overdoses caused by heroin is a part of a wider trend that has also been observed across the U.S.22 The new wave of opioids that has made a profound impact on death rates is synthetic opioids. Nationally, 2013 marks a rise in synthetic opioid overdose deaths. In 2013 the rate of overdose deaths caused by synthetic opioids was 2.2 per 100,000; by 2017 it increased by six times that amount to 12 deaths per 100,000 in 2017. This dramatic increase is thought to be fueled by fentanyl, a synthetic (made-in-a-lab) opioid that is 50 times more potent than heroin and 100 times more potent than morphine.23 Synthetic opioids saw an outsized increase in the rate of overdose deaths compared to the two other categories in the past two years. Between 2015 and 2017, the rate of overdose deaths increased in New York State (4.2 deaths per 100,000 population to 12 deaths per 100,000 population).
22 Centers for Disease Control and Prevention, October 2014. Increases in Heroin Overdose Deaths- 28 States, 2010 to 2012. Morbidity and Mortality Weekly Report 63(39);849-854. Available at: https://www.cdc.gov/mmwr/preview/mmwrhtml/mm6339a1.htm 23 Center for Disease Control and Prevention, 2018, What is Fentanyl. Available at: https://www.cdc.gov/drugoverdose/opioids/fentanyl.html
Since 2014 the Rate of Overdose Deaths Caused by Synthetic Opioids Has Sharply Increased While Overdose Deaths Caused by Commonly Prescribed Opioids and
Heroin Are Gradually Lowering
26

Figure 9: Death Rates Involving Opioids by Type of Opioid, 2013-2017 on Long Island Source: Centers for Disease Control and Prevention, National Center for Health Statistics. Multiple Cause of Death 1999-2017 on CDC WONDER Online Database, released December, 2018. Data are from the Multiple Cause of Death Files 1999-2017, as compiled from data provided by the 57 vital statistics jurisdictions through the Vital Statistics Cooperative Program. Accessed at http://wonder.cdc.gov/mcd-icd10.html.
Although the rate of all opioid deaths was still on the rise as of 2017, the New York State government has been taking proactive steps in addressing the severity of this crisis. Through legislation enacted in 2012 and 2014 which sought to have better oversight of prescription opioids through a real-time prescription drug monitoring system. The intent was to reduce the number of forged, stolen, or misused paper prescriptions and provide an extra layer of physician accountability.24 Perhaps the data is highlighting a substitution effect that is occurring as a result of more aggressive policy action from the state. As prescription opioids are more difficult to access and abuse, there are more people substituting prescription opioids with synthetic opioids such as fentanyl.25 Illicitly manufactured synthetic opioids are also much cheaper than prescription opioids, which may also contribute to the sudden increase.
0
12
23
35
2013 2014 2015 2016 2017
Heroin Commonly Prescribed Opioids Other Synthetic Opioids
24 New York State Health Foundation, 2017. Targeting an epidemic: Opioid Prescribing Patterns by County in New York State. Available at: https://nyshealthfoundation.org/wp-content/uploads/2017/12/targeting-opioid-epidemic-new-york-state-dec-2017.pdf 25 Drug Enforcement Administration, U.S. Department of Justice, 2017. Drugs of Abuse: A DEA Resource Guide. Availalbe at: https://www.dea.gov/sites/default/files/2018-06drug_of_abuse.pdf
Synthetic Opioids and Fentanyl Are The Leading Cause of Opioid Overdose Deaths on Long Island Outpacing Heroin and Commonly Prescribed Opioids in
2016 and 2017
27

These trends can also be observed on Long Island (see Figure 9). While the rate of deaths involving heroin and commonly prescribed opioids slightly increased in 2015, there was a very sharp increase in the rate of deaths involving synthetic opioids. In 2013 the rate of overdose deaths involving synthetic opioids was 2.9 per 100,000 however this rate increased 903 percent by 2017, rising to 29.1 deaths per 100,000, the highest increase on record for Nassau and Suffolk County (see Figure 9). In 2017 there was a total of 617 opioid overdose deaths on Long Island. Deaths involving synthetic opioids increased the most compared with other types of opioids, with 451 deaths reported in 2017, up from the 73 deaths in 2013 (see Table 5). Heroin involved deaths also rose during this four-year period from 153 deaths to 204 deaths. Deaths involving commonly prescribed opioids have shown a slower increase since 2013 and most recently began to decline slightly from 212 cases in 2016 to 205 cases in 2017.
26 Hedegaard H, Warner M, Miniño AM. 2017, Drug Overdose Deaths in the United States, 1999-2015. NCHS Data Brief, no 273. Available at:https://www.cdc.gov/nchs/data/databriefs/db294.pdf
Table 5: Opioid Overdose Deaths by Type on Long Island
2013 153 169 73 395
2014 169 157 77 403
2015 218 145 126 489
2016 192 212 307 711
2017 204 205 451 860
Year Heroin Commonly Prescribed Opioids
Other Synthetic Opioids Total
Note: Row totals do not add up to the total number of opioid overdose deaths supplied by the CDC. The counting is affected by multiple drugs being involved in some overdose deaths. This results in instances where a single dealth is included in multiple categories. 26
Source: Centers for Disease Control and Prevention, National Center for Health Statistics. Multiple Cause of Death 1999-2016 on CDC WONDER Online Database, released December, 2017. Data are from the Multiple Cause of Death Files 1999-2016, as compiled from data provided by the 57 vital statistics jurisdictions through the Vital Statistics Cooperative Program. Accessed at http://wonder.cdc.gov/mcd-icd10.html.
28

Figure 10: On Long Island, the 23-34 Age Group Accounted for 33 Percent of All Opioid-Related Deaths in 2017 Source: Centers for Disease Control and Prevention, National Center for Health Statistics. Multiple Cause of Death 1999-2016 on CDC WONDER Online Database, released December, 2017. Data are from the Multiple Cause of Death Files 1999-2016, as compiled from data provided by the 57 vital statistics jurisdictions through the Vital Statistics Cooperative Program. Accessed at http://wonder.cdc.gov/mcd-icd10.html.
On Long Island, the 25-34 Year Age Group Accounted for 33 Percent of All Opioid-Related Deaths in 2017
In 2017 there was a total of 617 deaths caused by opioids on Long Island. The 25-34 age category had the highest share of opioid-related deaths in 2017. This age group accounted for 33 percent of all opioid related deaths in 2017. In Nassau County, the opioid-related death rate for the 25-34 age category was 37 deaths per 100,000 people and in Suffolk County, this rate was 77 deaths per 100,000 people. Between 2010 and 2017, deaths among 25-34 year-olds on Long Island increased dramatically from 17 percent to 33 percent. In contrast, the 15-24 age group has seen the largest percentage decrease during this period going from 20 percent of all opioid deaths in 2010 to only nine percent by 2017.
Opioid Deaths by Age
0
5%
10%
15%
20%
25%
30%
35%
2010 2011 2012 2013 2014 2015 2016 2017
15-24 years 25-34 years 35-44 years 45-54 years 55-64 years
29

Figure 11: On Long Island, the 23-34 Age Group Accounted for 33 Percent of All Opioid-Related Deaths in 2017 Source: Centers for Disease Control and Prevention, National Center for Health Statistics. Multiple Cause of Death 1999-2016 on CDC WONDER Online Database, released December, 2017. Data are from the Multiple Cause of Death Files 1999-2016, as compiled from data provided by the 57 vital statistics jurisdictions through the Vital Statistics Cooperative Program. Accessed at http://wonder.cdc.gov/mcd-icd10.html.
On Long Island, the 25 - 34 Year Age Group Accounted for 33 Percent of All Opioid-Related Deaths in 2017
35%
30%
25%
20%
15%
10%
5%
0
15-24 years 25-34 years 35-44 years 45-54 years 55-64 years
9% 33% 24% 21% 14%
The share of 45- to 54-year-olds who died from opioid-related deaths declined from 27 percent in 2010 to 21 percent in 2017. On Long Island, less than half of all deaths related to opioids were people between the ages of 15 and 34 at 42 percent (see Figure 11). In 2017 people between the ages of 35 and 64 accounted for 58 percent of all deaths related to opioids on Long Island.
30

Figure 12: In New York State the 25-34 Age Group Category Experienced the Highest Share of All Opioid Deaths in 2017
Source: Centers for Disease Control and Prevention, National Center for Health Statistics. Multiple Cause of Death 1999-2016 on CDC WONDER Online Database, released December, 2017. Data are from the Multiple Cause of Death Files 1999-2016, as compiled from data provided by the 57 vital statistics jurisdictions through the Vital Statistics Cooperative Program. Accessed at http://wonder.cdc.gov/mcd-icd10.html.Type something
In New York State the 25-34 Age Group Category Experienced the Highest Share of All Opioid Deaths in 2017
0
5%
10%
15%
20%
25%
30%
35%
40%
45%
1999 2000 2001 2002 2003 2004 2005 2006 2007 2008 2009 2010 2011 2012 2013 2014 2015 2016 2017
15-24 years 25-34 years 35-44 years 45-54 years 55-64 years
31

In 2017, a total of 3,224 deaths were caused by opioids in New York State, eight percent of those who died from opioids were between the ages of 15 and 24, 28 percent were between the ages of 25 and 35, 22 percent were between the ages of 35 and 44, 23 percent were between the ages of 45 and 54 and 15 percent were between 55 and 64. Figure 12 suggests there is considerable convergence in the share of opioid deaths between age groups between 1999 and 2017. This can be seen as the share of opioid deaths is distributed more evenly across age groups in 2017 compared to 1999. Between 2008 and 2017, there has been an 11 percent increase in the share of opioid deaths within the 25-34 age category in New York State. Conversely, there has been an 11 percent decrease in the rate of opioid deaths in the 45-54 age cohort between 2008 and 2017. Although total opioid deaths in the 35-44 age category have increased from 253 deaths in 1999 to 702 deaths in 2017, the share of total deaths has decreased by 19 percentage points from 41 percent of all opioid deaths in 1999 to 22 percent of opioid deaths in 2017. These statistics are alarming as they highlight the dramatic level of increases in deaths across all age categories. More people are dying in each of the age group categories even though there are decreases in the overall share of all opioid deaths.
These statistics are
alarming as they highlight the
dramatic level of increases in deaths
across all age categories. More
people are dying in each of the age
group categories even though there
are decreases in the overall share of all opioid deaths.
32

Figure 13: In 2017, Men Accounted for 75 Percent of All Opioid-Related Deaths in 2017 Source: Centers for Disease Control and Prevention, National Center for Health Statistics. Multiple Cause of Death
1999-2016 on CDC WONDER Online Database, released December, 2017. Data are from the Multiple Cause of Death Files 1999-2016, as compiled from data provided by the 57 vital statistics jurisdictions through the Vital Statistics Cooperative Program. Accessed at http://wonder.cdc.gov/mcd-icd10.html.
In New York State, more men are dying from opioid addiction than women. Although women make up 51 percent of the population in New York State, Figure 13 below shows that women accounted for 25 percent of people who died from opioids in 2017 while men accounted for 75 percent of those deaths.
Opioid Deaths by Gender
In 2017, Men Accounted for 75 Percent of Opioid Related-Deaths in New York State
0
10%
20%
30%
40%
50%
60%
70%
80%
90%
1999 2000 2001 2002 2003 2004 2005 2006 2007 2008 2009 2010 2011 2012 2013 2014 2015 2016 2017
Female share of deaths Male share of deaths
The opioid crisis has had a disproportionate impact on men compared to women on Long Island (see Figure 14). Almost identical to the rest of the state, men accounted for 76 percent of all opioid deaths on Long Island in 2017. Women represented only 24 percent of opioid overdose deaths in 2017. The gender disparity highlights the need for targeted policy responses to this crisis.
25%
75%77%
23%
33

Men Accounted for 76 Percent of Opioid Related-Deaths on Long Island in 2017
010%20%30%40%50%60%70%80%90%
2006 2007 2008 2009 2010 2011 2012 2013 2014 2015 2016 2017
Female Share of Deaths Male Share of Deaths
75% 76%
24%25%
Figure 14: Men Accounted for 76 Percent of Opioid-Related Deaths on Long Island in 2017 Source: Centers for Disease Control and Prevention, National Center for Health Statistics. Multiple Cause of
Death 1999-2016 on CDC WONDER Online Database, released December, 2017. Data are from the Multiple Cause of Death Files 1999-2016, as compiled from data provided by the 57 vital statistics jurisdictions through the Vital Statistics Cooperative Program. Accessed at http://wonder.cdc.gov/mcd-icd10.html.
Between 2016 and 2017, there was a 31 percent increase in the rate of opioid overdose deaths among men in Suffolk County compared to only a 10 percent increase in those of women in that county (see Table 5). Nassau County experienced a 13 percent decrease in the number of women who died from opioid overdoses between 2016 and 2017 and a five percent increase in the number of men who died during this time period.
34

Source: Centers for Disease Control and Prevention, National Center for Health Statistics. Multiple Cause of Death 1999-2016 on CDC WONDER Online Database, released December, 2017. Data are from the Multiple Cause of Death Files 1999-2016, as compiled from data provided by the 57 vital statistics jurisdictions through the Vital Statistics Cooperative Program. Accessed at http://wonder.cdc.gov/mcd-icd10.html.
Nassau Su�olk Nassau Su�olk
2006-2007 13 46 5 16
2007-2008 26 -2 -4 10
2008-2009 -18 -17 -8 -10
2009-2010 -11 12 -17 14
2010-2011 34 60 71 43
2011-2012 21 -1 5 0
2012-2013 -10 -9 11 -3
2013-2014 -9 6 15 -9
2014-2015 47 -26 13 22
2015-2016 11 113 9 40
2016-2017 -13 10 5 31
Female Male
Table 6: Women in Suffolk County Led in Percentage Increase in Opioid Deaths in 2016. Opioid Deaths by Gender Year and Geography (in percent)
35

Long Island Speaks: Hope for Recovery
Samantha was raised by her grandparents from the age of 8, due to her parents' drug and alcohol use. At the age of 14, she began experimenting with cocaine and pills, but after the death of her closest brother from a heroin overdose in 2016, Samantha began to use opiates herself as a means to numb the emotional pain. By the age of 30, heroin had become nearly $200 dollar a day habit for Samantha. In 2018, she was arrested and charged with two misdemeanors for criminal possession of a controlled substance and neglect of her 2-year-old daughter. This was Samantha's "rock bottom" where she realized to regain custody of her daughter she needed to get out of an abusive relationship and get help for her addiction. Samantha completed detox and short-term inpatient treatment and it was clear that to continue her recovery she would benefit from women-specific treatment. Samantha entered of Outreach’s Women’s Day Rehabilitation in Bellport. Since admission, Samantha has maintained abstinence from opiates through the utilization of medication-assisted therapy, daily therapeutic services, and increased supports. In addition, Samantha has successfully found the courage to establish healthy boundaries with her child’s father, has gained employment and is in the process of obtaining full custody of her daughter. Clearly, Samantha’s story is one of many who are faced with the struggles of today’s opioid epidemic. Her journey is one of success through treatment and is an opportunity for others to see there is hope, even when all seems hopeless.
36

Opioid Overdose Deaths by Race
Recent research on the opioid crisis has focused on the white or total population between 1999 and the present. However, understanding racial differences in long term trends will contribute to improving interventions and providing targeted responses to help those impacted by this crisis.
Figure 15: Whites Accounted for 85 Percent of All Opioid Overdose Deaths in 2017 Source: Centers for Disease Control and Prevention, National Center for Health Statistics. Multiple Cause
of Death 1999-2016 on CDC WONDER Online Database, released December, 2017. Data are from the Multiple Cause of Death Files 1999-2016, as compiled from data provided by the 57 vital statistics jurisdictions through the Vital Statistics Cooperative Program. Accessed at http://wonder.cdc.gov/mcd-icd10.html
100%
90%
80%
70%
60%
50%
40%
30%
20%
10%
0
2013 2014 2015 2016 2017
9%90%
9%90%
9%90%
12%
87%
13%
86%
Share Asian or Paci�c Islander (1% each year) Share Black Share White
Whites Accounted for 85 Percent of All Opioid Deaths in 2017
37

According to the most recent census estimates, whites make up 67 percent of the population in New York State. The CDC data shows that this demographic accounted for the majority of all opioid overdose deaths.27 Whites represented 85 percent of all opioid overdose deaths in 2017 (see Figure 15). In 2017, blacks made up 16 percent of the population in New York State but a smaller share of all opioid overdose deaths (see Figure 15). Since 2013, blacks in New York State have experienced a 44-percentage point increase in the share of opioid overdose deaths while whites have experienced a six percentage point decrease in their share of opioid overdose deaths during the same period. Asians and Pacific Islanders accounted for only one percent of all opioid-related deaths between 2013 and 2017. Data on the number of American Indians and Alaskan Natives is only available for 2016 (21) and 2017 (14). Between 2004 and 2017, there was a more than threefold increase in the rate of opioid deaths among blacks in New York State - a jump from 2.5 to 11.3 deaths per 100,000 persons (see Figure 16). During the same time, there was a six-fold increase in the rate of opioid deaths among whites in New York State an increase from 2.7 to 19.6 deaths per 100,000 persons (see Figure 16).
Rates of Deaths caused by Opioids for Blacks and Whites in New York State
Figure 16: Rates of Deaths Caused by Opioids for Blacks and Whites in New York State Source: Centers for Disease Control and Prevention, National Center for Health Statistics. Multiple Cause of Death 1999-2016 on CDC WONDER Online Database, released December, 2017. Data are from the Multiple Cause of Death Files 1999-2016, as compiled from data provided by the 57 vital statistics jurisdictions through the Vital Statistics Cooperative Program. Accessed at http://wonder.cdc.gov/mcd-icd10.html
0
5.0
10.0
15.0
20.0
25.0
19992000
20012002
20032004
20052006
20072008
20092010
20112012
20132014
20152016
2017
Black White
27 CDC methodology uses bridged-race poplation estimates. These estimates result from "bridging" the 31 race categories used in Census 2000, as specified in the 1997 Office of Management and Budget (OMB) standards for the collection of data on race and ethnicity, to the four race categories specified under the 1977 standards (Asian or Pacific Islander, Blackor African American, American Indian or Alaska Native, White)
38

While the state offers reasonably complete information on opioid-related deaths by race, the data specific to Long Island is only available for a few recent years. In both 2016 and 2017, the number of deaths caused by opioid overdoses among whites outpaced that of blacks. Unfortunately, this was the only year available with rates that were not suppressed, however as data collection on this topic becomes more reliable, we will have access to more information which will allow for a more in-depth analysis of the racial composition of opioid overdose deaths on Long Island.
Figure 17: The Long Island Rate of Opioid Related Deaths among Whites Outpaces That among Blacks, 2016 Source: Centers for Disease Control and Prevention, National Center for Health Statistics. Multiple Cause of Death 1999-2017 on CDC WONDER Online Database, released March, 2019. Data are from the Multiple Cause of Death Files 1999-2017, as compiled from data provided by the 57 vital statistics jurisdictions through the Vital Statistics Cooperative Program. Accessed at http://wonder.cdc.gov/mcd-icd10.html.
In Suffolk County the Number of Opioid-Related Deaths Among Whites Outpaces that Among Blacks in Both 2016 and 2017.
Blac
kW
hite
0 50 100 150 200 250 300 350 400 450 500 550 600 650 700 750 800
40 40
319 400
2016 2017
s19 20
319 400
39

Concluding RemarksOn Long Island, the opioid-related health crisis resulted in $8.2 billion in economic damage in 2017. It is plausible to assume that there has been some plateauing or even a moderate decline in the intensity of the crisis. However, the problem remains serious and large. This transition becomes most apparent by 2012. Nearly one in four people in New York reports having a family member, friend or acquaintance who has died of an opioid overdose. The economic damage assessment quantifies the significance of losses to productivity, as well as costs to businesses, taxpayers, emergency services, libraries, etc. In truth, this crisis impacts everyone. The nature of the opioid problem is a complicated one. It does not have one simple solution. It is plausible to argue that the key factors that have led to this crisis include economic anxiety, housing constraints, cultural changes, and the proliferation of potent illicit drugs. New York State’s expansion of the prescription drug monitoring program has been an important policy aimed to address the surge in deaths related to opioid abuse, overdose. Still, the steadily increasing growth in overdose deaths during the period examined in this study may be attributable to users substituting one drug for another. The substitution effect is quite clear, now that prescription opioids are more regulated and harder to access people opt for cheaper and stronger black-market alternatives like fentanyl. In 2012 this transition becomes most apparent. Synthetic opioids are now the most prevalent type of drugs present in opioid overdose deaths in the state. Future research should facilitate the implementation of data-driven policy that would help avoid similar unintended consequences. Additionally, such policies would need to be subject to post implementation review to evaluate their efficacy. Without question, it will take new creative policy ideas to successfully reduce the social cost of the ongoing opioid crisis. Solutions that do not focus on both prevention and supply-side control are not likely to work. The real task for policymakers in their efforts to help those suffering from opioid dependence is to support education programs that raise awareness and destigmatize addiction, increase access to mental health programs that provide people with the tools that they need and expanded rehabilitation and treatment access across the state. As the report conclusively states, addiction is not just an individual problem, it affects every one of us. We must work together to solve this problem and we all have a role - at home, at work, in the community, and in the state. While funding is always a concern, we cannot afford the cost of inaction.
By: Jonas J.N. Shaende, Ph.D. and Shamier SettleJonas Shaende is Chief Economist of the Fiscal Policy Institute. Shamier Settle, FPI’s State Policy Fellow.
The Fiscal Policy Institute is an independent, nonpartisan, nonprofit research and education organization committed to improving public policies and private practices to better the economic and social conditions of all New Yorkers. FPI’s
Immigration Research Initiative looks at immigration issues in New York State, and aound the state.
40

References
1.
2.
3.
4.5.
6.
7.
8.9.
10.
11.
12.
13.
14.
15.16.
17.
18.
19.
20.
21.
22.
23.
24.
25.
26.
NPR, December 2017, Life Expectancy Drops Again As Opioid Deaths Surge in the US. Available at: https://www.npr.org/sections/health-shots/2017/12/21/572080314/life-expectancy-drops-again-as-opioid-deaths-surge-in-u-s Siena Research Institute, April 2018. Siena College Poll: New York State Opioid Epidemic. Available at: https://scri.siena.edu/wp-content/uploads/2018/08/PfP_Press_Release_1_-_Final.pdf New York State Health Foundation, 2018. Follow the Money: Pharmaceutical Manufacturer Payments and Opioid Prescribing Patterns in New York State. Available at: https://nyshealthfoundation.org/wp-content/uploads/2018/06/following-the-money-pharmaceutical-payments-opioid-prescribing-june-2018.pdf New York State Department of Health, Opioid Related Data in New York State, https://www.health.ny.gov/statistics/opioid/ The Council of Economic Advisers, 2017, The Underestimated Cost of the Opioid Crisis. Available at: https://www.whitehouse.gov/sites/whitehouse.gov/files/images/The%20Underestimated%20Cost%20of%20the%20Opioid%20Crisis.pdf Aldy, J.,Viscusi, W., 2008. Adjusting the value of a statistical life for age and cohort effects. Review of Economics and Statistics 90(3): 573-581. Available at https://law.vanderbilt.edu/files/archive/279_Adjusting-VSL-for-Age-and-Cohort-Effects.pdf U.S. Substance Abuse and Mental Health Services Administration, 2016. Key Substance Use and Mental Health Indicators in the United States: Results from the 2015 National Survey on Drug Use and Health. Available at: https://www.samhsa.gov/data/sites/default/files/NSDUH-FFR1-2016/NSDUH-FFR1-2016.htm New York State Department of Health, Opioid Related Data in New York State, https://www.health.ny.gov/statistics/opioid/ Karthikeyan, S., Sloner, B., 2015. Change in Substance Abuse Treatment Use Among Individuals With Opioid Use Disorders in the United State, 2004-2013. Journal of the American Medical Association. Available at: https://jamanetwork.com/journals/jama/fullarticle/2456156 Partnership for Drug-Free Kids, 2015. 80 Percent of Those with Opioid Use Disorders Don’t Receive Treatment. Available at: https://drugfree.org/learn/drug-and-alcohol-news/80-percent-opioid-use-disorders-dont-receive-treatment/ Florence, C., Zhou, C., Luo, F. & Xu, L.,2016. The economic burden of prescription opioid overdose, abuse, and dependence in the United States, 2013. Medical Care, 54(10): 901-906. Available at: https://www.ncbi.nlm.nih.gov/pmc/articles/PMC5975355/ Organisation for Economic Co-operation and Development (OECD), 2018. Economic Survey of the United States. Available at: http://www.oecd.org/eco/surveys/Overview-United-States-2018-OECD.pdf Krueger, Alan, 2017. Where have all the workers gone? An inquiry into the decline of the U.S. labor force participation rate. Brookings Institute. Available at: https://www.brookings.edu/bpea-articles/where-have-all-the-workers-gone-an-inquiry-into-the-decline-of-the-u-s-labor-force-participation-rate/ Currie, J., Schnell, M. August 2018. A Closer Look at How the Opioid Epidemic Affects Employment. Harvard Business Review, Available at: https://hbr.org/2018/08/a-closer-look-at-how-the-opioid-epidemic-affects-employment FPI analysis of US Census Bureau, 2017 American Community Survey 1-Year Estimates Substance Abuse and Mental Health Services Administration Center for Behavioral Health Statistics and Quality, Results from the 2017 National Survey on Drug Use and Health: Detailed Tables. September 2018. Available at: https://www.samhsa.gov/data/sites/default/files/cbhsq-reports/NSDUHDetailedTabs2017/NSDUHDetailedTabs2017.pdf FPI analysis of Centers for Disease Control and Prevention, National Center for Health Statistics, Multiple Cause of Death files 1999-2017 on CDC WONDER Online Database Centers for Disease Control and Prevention, 2018, Heroin Overdose Data. Available at: https://www.cdc.gov/drugoverdose/data/heroin.html Centers for Disease Control and Prevention, 2018, Prescription Opioid Data. Available at: https://www.cdc.gov/drugoverdose/opioids/prescribed.html Centers for Disease Control and Prevention, 2018, Synthetic Opioid Overdose Data. Available at: https://www.cdc.gov/drugoverdose/data/fentanyl.html National Institute on Drug Abuse, March, 209. New York Opioid Summary. https://www.drugabuse.gov/opioid-summaries-by-state/new-york-opioid-summary Centers for Disease Control and Prevention, October 2014. Increases in Heroin Overdose Deaths- 28 States, 2010 to 2012. Morbidity and Mortality Weekly Report 63(39);849-854. Available at: https://www.cdc.gov/mmwr/preview/mmwrhtml/mm6339a1.htm Center for Disease Control and Prevention, 2018, What is Fentanyl. Available at: https://www.cdc.gov/drugoverdose/opioids/fentanyl.html New York State Health Foundation, 2017. Targeting an epidemic: Opioid Prescribing Patterns by County in New York State. Available at: https://nyshealthfoundation.org/wp-content/uploads/2017/12/targeting-opioid-epidemic-new-york-state-dec-2017.pdf Drug Enforcement Administration, U.S. Department of Justice, 2017. Drugs of Abuse: A DEA Resource Guide. Available at: https://www.dea.gov/sites/default/files/2018-06/drug_of_abuse.pdf Hedegaard H, Warner M, Miniño AM. 2017, Drug Overdose Deaths in the United States, 1999-2015. NCHS Data Brief, no 273. Available
41