long-form drtv - script to screen€¦ · a national survey of 1,020 infomercial purchasers &...
TRANSCRIPT

Long-Form DRTV
Purchaser Attitudes & behavior StudyDecember 2013

Cannella Response Television, Script to Screen and M2 Marketing and Management commissioned a study in December of 2013 to learn more about purchasers of infomercial products (half-hour length TV advertisements).
The infomercial industry has evolved over the past 30 years, and this study sought to identify gaps that may exist between perceptions derived from the past and the reality of today. In addition, there is little research available about infomercial marketing, and the study provides more insight into this niche sales and advertising channel.
This study evaluates whether people who watch TV and buy infomercial products differ from TV viewers who do not purchase infomercial products across several key dimensions.
Key questions addressed in the study include:
• Among TV viewers, what is the demographic profile of the modern day infomercial purchaser and how do they compare to the non-purchasers?
• How does TV viewing behavior differ between purchasers and non-purchasers?
• How has mobile technology impacted the TV consumption between the two groups?
• How satisfied are infomercial customers with their purchase?
• How effective is infomercial advertising at engaging and persuading potential buyers?
THE STUDYRESEARCH OBJECTIVES & SCOPE
2
LONG-FORM DRTV• Purchaser Attitudes & Behavior Study• © Copyright 2014 •
A national survey of 1,020 Infomercial purchasers & non-purchasers
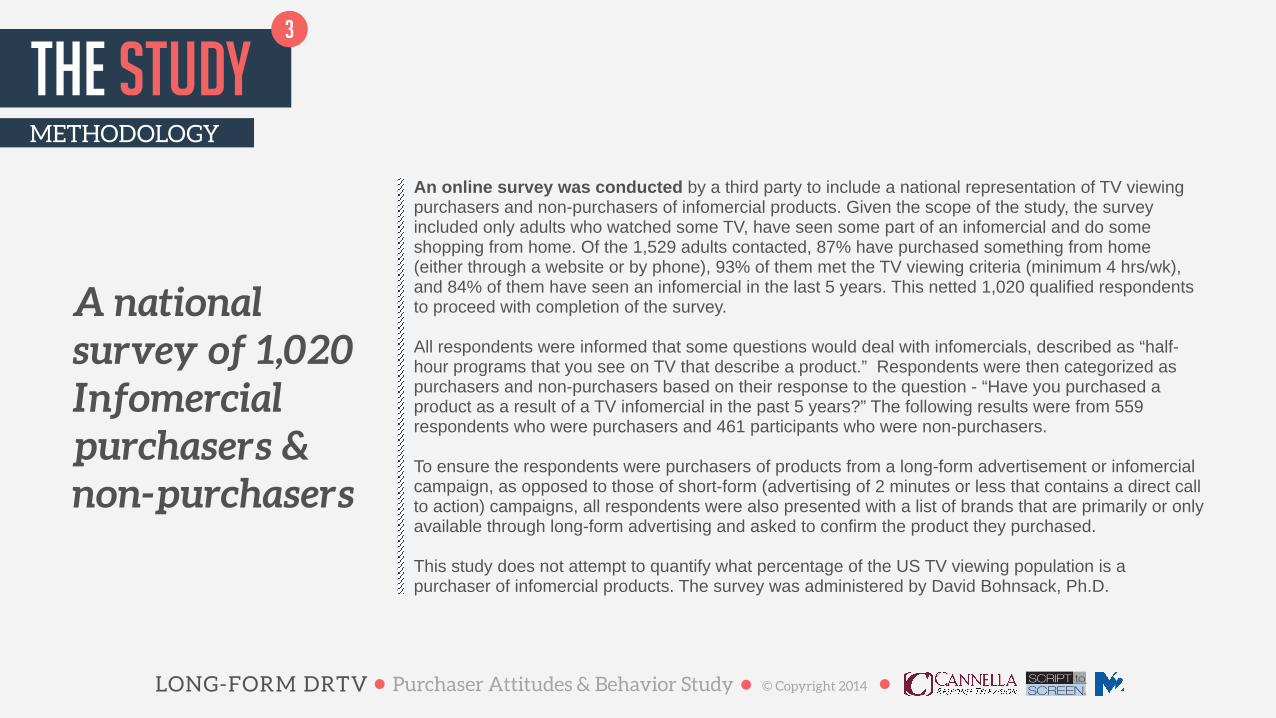
An online survey was conducted by a third party to include a national representation of TV viewing purchasers and non-purchasers of infomercial products. Given the scope of the study, the survey included only adults who watched some TV, have seen some part of an infomercial and do some shopping from home. Of the 1,529 adults contacted, 87% have purchased something from home (either through a website or by phone), 93% of them met the TV viewing criteria (minimum 4 hrs/wk), and 84% of them have seen an infomercial in the last 5 years. This netted 1,020 qualified respondents to proceed with completion of the survey. All respondents were informed that some questions would deal with infomercials, described as “half-hour programs that you see on TV that describe a product.” Respondents were then categorized as purchasers and non-purchasers based on their response to the question - “Have you purchased a product as a result of a TV infomercial in the past 5 years?” The following results were from 559 respondents who were purchasers and 461 participants who were non-purchasers. !To ensure the respondents were purchasers of products from a long-form advertisement or infomercial campaign, as opposed to those of short-form (advertising of 2 minutes or less that contains a direct call to action) campaigns, all respondents were also presented with a list of brands that are primarily or only available through long-form advertising and asked to confirm the product they purchased. !This study does not attempt to quantify what percentage of the US TV viewing population is a purchaser of infomercial products. The survey was administered by David Bohnsack, Ph.D.
METHODOLOGY
THE STUDY3
LONG-FORM DRTV• Purchaser Attitudes & Behavior Study• © Copyright 2014 •

EXECUTIVE SUMMARY
THE STUDY4
LONG-FORM DRTV• Purchaser Attitudes & Behavior Study• © Copyright 2014 •
1. There are distinct demographic differences between the infomercial purchaser and the non-purchaser.
• Skews younger than their TV viewing, non-buying counterparts
• Have higher household income than non-purchasers
• Have more people in his or her household and has more children under the age of 19 in the home
• Tends to be more ethnically diverse
• Is no more or less likely to be a female than a non-buyer who watches TV
2. Infomercial purchaser lifestyle interests skew higher across several dimensions.
• Purchasers of infomercial products spend more time exercising, watching movies, and following sports
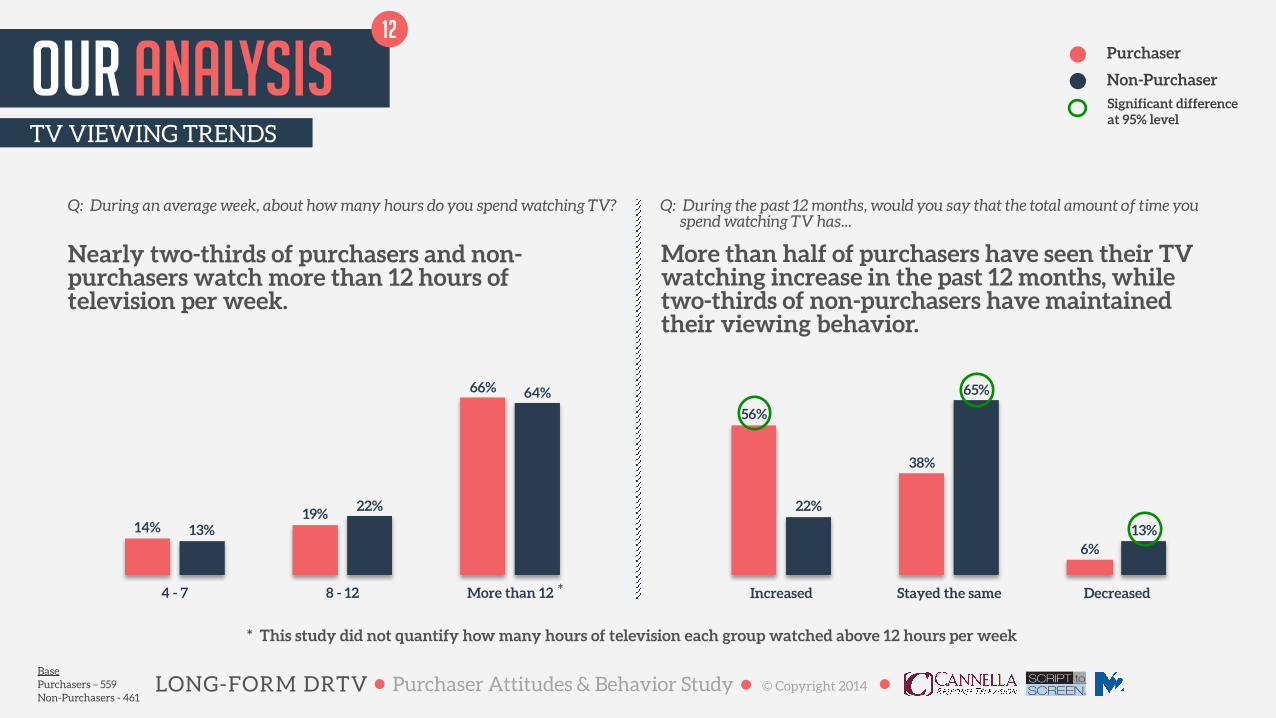
• Nearly two-thirds of purchasers (and non-purchasers) watch more than 12 hours of television per week.
• Purchasers are much more active in-home (online) shoppers. Both purchasers and non-purchasers are increasing their time spent shopping from home
3. Infomercial purchases embrace digital technology to a greater extent than non-purchasers and use a mobile device while watching television much more frequently than non-purchasers.
• Two-thirds of all infomercial purchasers own a tablet device and a quarter of them use their tablet while watching more than 50% of the time
!
62%Buyers of infomercial products with a household income greater than $50,000
40%Buyers of infomercial products that shop from home at least once per week
80%Buyers of infomercial products that own a smartphone

EXECUTIVE SUMMARY
THE STUDY5
LONG-FORM DRTV• Purchaser Attitudes & Behavior Study• © Copyright 2014 •
4. Infomercial purchasers have a favorable opinion of the products they buy through the TV.
• 81% of buyers of infomercial products have bought two or more products in the last 5 years.
5. Infomercial purchasers use word-of-mouth & social media to recommend products they buy more often than non-purchasers
6. Infomercials offer marketers an opportunity to develop 1:1 relationships with their customers.
7. Long-form infomercials have engaging and persuasive properties that drive sales transactions
• Three-quarters of infomercial customers made their purchase while the advertising was running or within a few hours after it aired
• Nearly one-third of all infomercial customers watch infomercials because they find them interesting or entertaining
• Almost half of infomercial purchasers say they are engaged for the entire length of the program
88%Buyers of infomercial products who were satisfied with their last purchase
74%Buyers of infomercial products who would recommend their last purchase
79%Buyers of infomercial products who buy directly from the manufacturer
90%Buyers of infomercial products who took action within the first 3 viewings of the program

InfomercialPurchaser
THE
A close up look at half-hour direct response television advertising from the customer’s point of view.
LONG-FORM DRTV• Purchaser Attitudes & Behavior Study• © Copyright 2014 •

our analysisPURCHASER/NON-PURCHASER DEMOGRAPHICS
7
58% Females
42% Males
54% Females
46% Males
Purchasers Non-Purchaser
LONG-FORM DRTV• Purchaser Attitudes & Behavior Study• © Copyright 2014 •Base Purchasers – 559 Non-Purchasers - 461
our analysisPURCHASER/NON-PURCHASER DEMOGRAPHICS
Age
Under 20
20 - 29 30 - 39 40 - 49 50 - 59 60 - 69 70
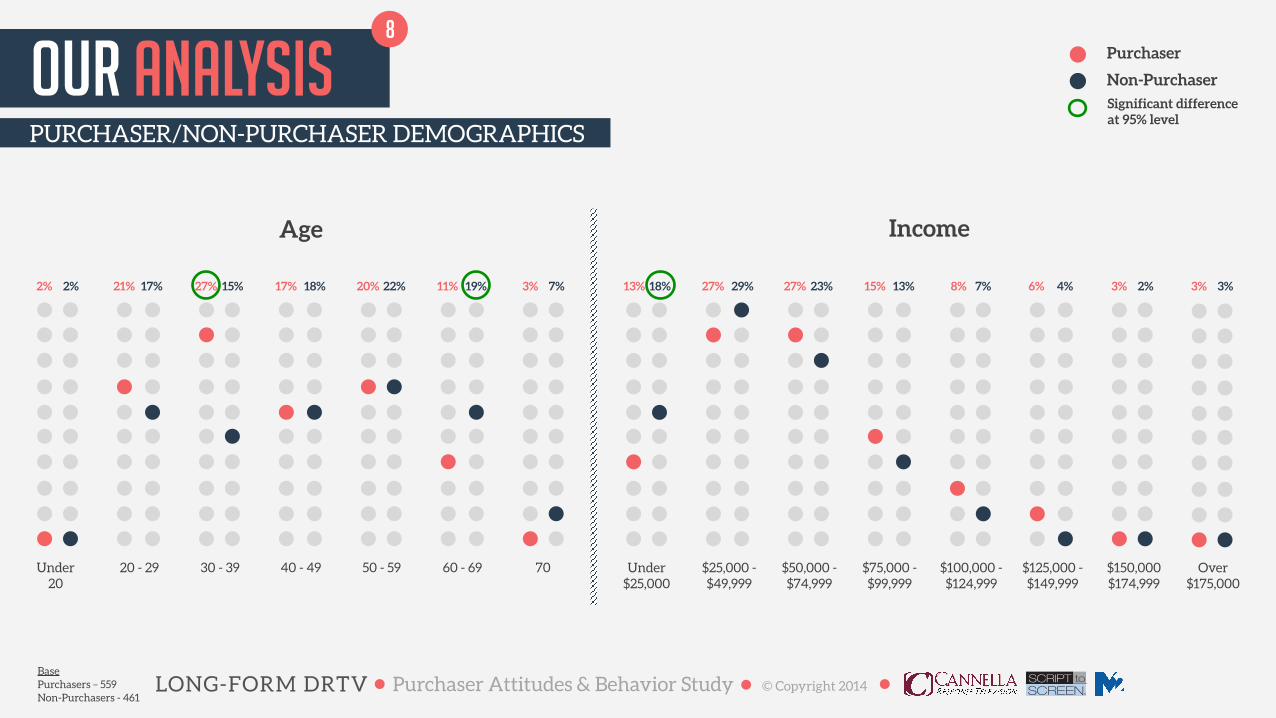
2% 2% 21% 17% 27% 15% 17% 18% 20% 22% 11% 19% 3% 7%
Income
Under $25,000
$25,000 - $49,999
$50,000 - $74,999
$75,000 - $99,999
$100,000 - $124,999
$125,000 - $149,999
$150,000 $174,999
Over $175,000
13% 18% 27% 29% 27% 23% 15% 13% 8% 7% 6% 4% 3% 2% 3% 3%
8Purchaser
Non-PurchaserSignificant difference at 95% level
LONG-FORM DRTV• Purchaser Attitudes & Behavior Study• © Copyright 2014 •Base Purchasers – 559 Non-Purchasers - 461

Multiple
Asian
Latino
African American
2%
5%
17%
13%
78%
2%
4%
4%
8%
82%
2%
7%
9%
13%
68%
our analysisPURCHASER/NON-PURCHASER DEMOGRAPHICS
Caucasian
9
LONG-FORM DRTV• Purchaser Attitudes & Behavior Study• © Copyright 2014 •
Purchaser
Non-Purchaser
U.S. Census Bureau - 2012Significant difference at 95% level
Base Purchasers – 559 Non-Purchasers - 461

our analysisPURCHASER/NON-PURCHASER HOUSEHOLD SIZE
1 2 3 4 5 6 7
14% 18% 25% 43% 24% 16% 21% 14% 10% 5% 3% 3% 1% 1%
0 1 2 3 4
45% 67% 25% 18% 21% 9% 6% 5% 2% 1%
10
Q: How many people live in your household? Q: How many children under the age of 19 are in your household?
Base Purchasers – 559 Non-Purchasers - 461
Purchaser
Non-PurchaserSignificant difference at 95% level
LONG-FORM DRTV• Purchaser Attitudes & Behavior Study• © Copyright 2014 •

our analysisOTHER ACTIVITIES
On Internet Movies
Less than 1 1 - 3 4 - 7 8 - 12 More than 12
4%8%
24%27%
37%
8%13%
25%
33%
21%
Exercise & Fitness
Less than 1 1 - 3 4 - 7 8 - 12 More than 12
8%9%
18%
25%
40%
11%12%
25%26%25%
Following Sports
Less than 1 1 - 3 4 - 7 8 - 12 More than 12
53%
23%17%
6%1%
55%
20%17%
7%1%
Less than 1 1 - 3 4 - 7 8 - 12 More than 12
6%
11%
29%
37%
16%12%
19%
38%
26%
5%
11
Q: During an average week, about how many hours do you spend on each of the following activities?
Purchasers are more likely to spend more than 8 hours per week exercising, and tend to watch movies more often. There is no difference between the groups in terms of Internet activity.
Base Purchasers – 559 Non-Purchasers - 461
Purchaser
Non-PurchaserSignificant difference at 95% level
LONG-FORM DRTV• Purchaser Attitudes & Behavior Study• © Copyright 2014 •
our analysisTV VIEWING TRENDS
4 - 7 8 - 12 More than 12
64%
22%
13%
66%
19%14%
Increased Stayed the same Decreased
13%
65%
22%
6%
38%
56%
12
Q: During an average week, about how many hours do you spend watching TV?
Nearly two-thirds of purchasers and non-purchasers watch more than 12 hours of television per week.
Q: During the past 12 months, would you say that the total amount of time you spend watching TV has...
More than half of purchasers have seen their TV watching increase in the past 12 months, while two-thirds of non-purchasers have maintained their viewing behavior.
Base Purchasers – 559 Non-Purchasers - 461
Purchaser
Non-PurchaserSignificant difference at 95% level
This study did not quantify how many hours of television each group watched above 12 hours per week
LONG-FORM DRTV• Purchaser Attitudes & Behavior Study• © Copyright 2014 •
*
*
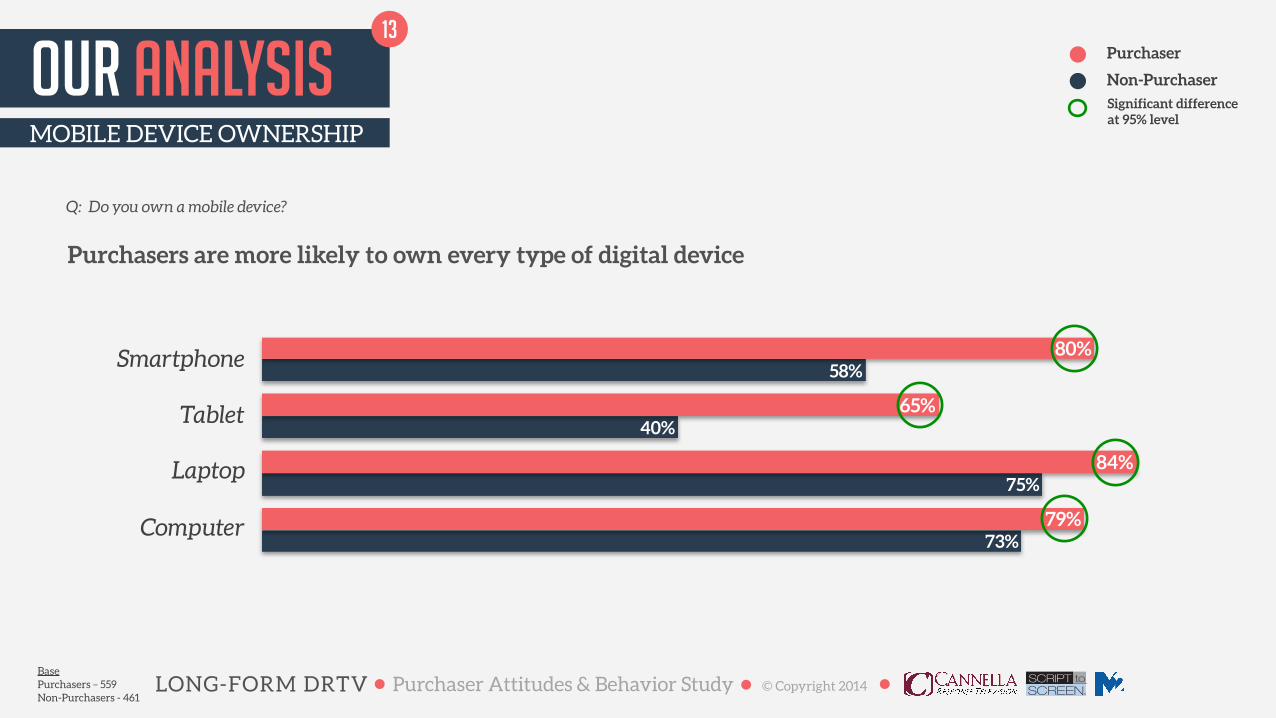
Computer
Laptop
Tablet
Smartphone
73%
75%
40%
58%
79%
84%
65%
80%
our analysisMOBILE DEVICE OWNERSHIP
13
Q: Do you own a mobile device?
Purchasers are more likely to own every type of digital device
Base Purchasers – 559 Non-Purchasers - 461
Purchaser
Non-Purchaser
LONG-FORM DRTV• Purchaser Attitudes & Behavior Study• © Copyright 2014 •
Significant difference at 95% level

5%
12%4%
6%
6%
12%
5%11%
12%
20%
23%25%
27%34%48%44%
11%
13%11%11%
10%
17%15%17%
16%23%
25%31%
27%32%37%32%
our analysisMOBILE DEVICE USAGE WHILE WATCHING TV: FREQUENCY
More than 75%
51% to 75%
25% to 50%
Less than 25%
14
Q: How often do you use your mobile device while watching TV? !Overall, smartphones are more likely to be used while watching TV than other devices. Computers see the least amount of simultaneous use. Purchasers are more likely to use mobile devices while watching television than non-purchasers. More than a quarter of all purchasers with devices use them at least 50% of the time while watching television.
Base Purchasers – 559 Non-Purchasers - 461
Smartphone Tablet Laptop Computer
Purchaser Non-Purchaser Purchaser Non-Purchaser Purchaser Non-Purchaser Purchaser Non-Purchaser
LONG-FORM DRTV• Purchaser Attitudes & Behavior Study• © Copyright 2014 •

12%9%5%
11%
70%66%
61%58%
18%25%34%30%
18%14%9%8%
38%39%36%36%
44%47%54%56%
our analysisMOBILE DEVICE USAGE WHILE WATCHING TV: TRENDS
15
Q: In the last 12 months, would you say that your mobile device usage while watching TV has… !Purchasers report increased usage of all devices while watching TV. The growth is largest for smartphones and tablets.
Decreased
Stayed the Same
Increased
Base Purchasers – 559 Non-Purchasers - 461
Smartphone Tablet Laptop Computer
Purchaser Non-Purchaser Purchaser Non-Purchaser Purchaser Non-Purchaser Purchaser Non-Purchaser
LONG-FORM DRTV• Purchaser Attitudes & Behavior Study• © Copyright 2014 •
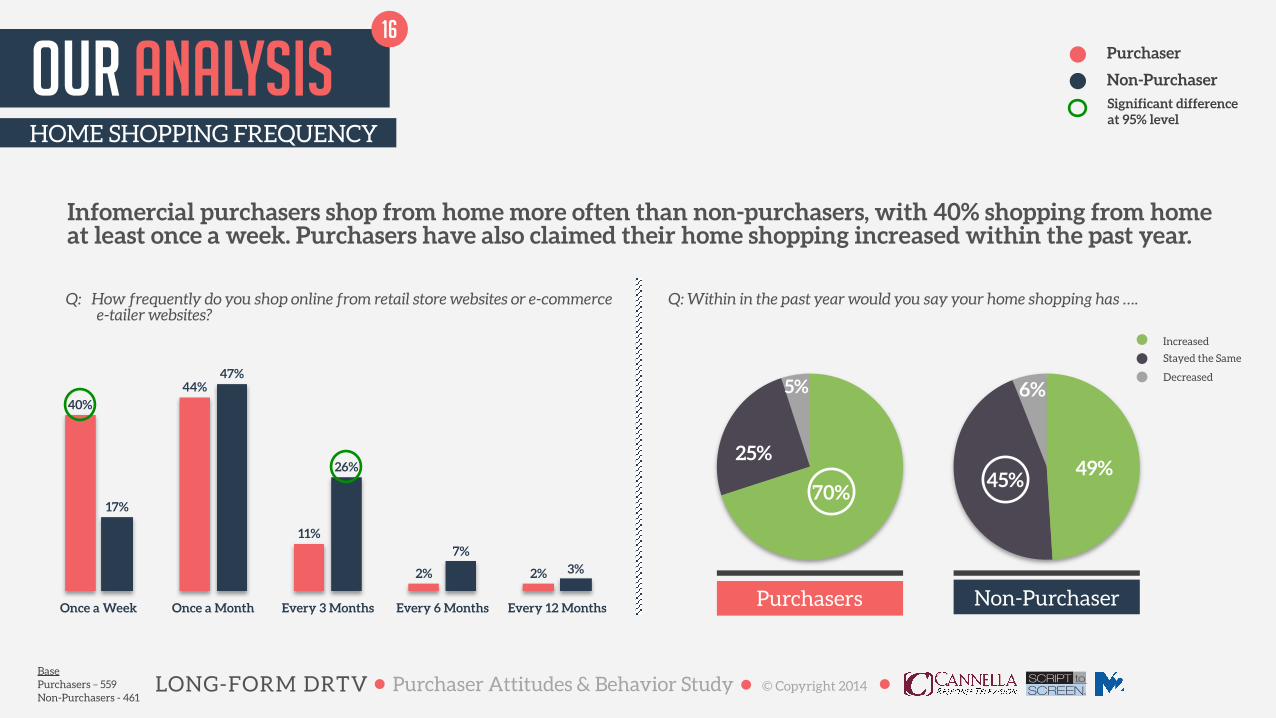
Infomercial purchasers shop from home more often than non-purchasers, with 40% shopping from home at least once a week. Purchasers have also claimed their home shopping increased within the past year.
our analysisHOME SHOPPING FREQUENCY
Q: How frequently do you shop online from retail store websites or e-commerce e-tailer websites?
Once a Week Once a Month Every 3 Months Every 6 Months Every 12 Months
3%7%
26%
47%
17%
2%2%
11%
44%40%
49%45%
6%
70%
25%
5%
Q: Within in the past year would you say your home shopping has ….
16
Base Purchasers – 559 Non-Purchasers - 461
Purchaser
Non-PurchaserSignificant difference at 95% level
Increased
Stayed the Same
Decreased
Purchasers Non-Purchaser
LONG-FORM DRTV• Purchaser Attitudes & Behavior Study• © Copyright 2014 •

Q: Again, thinking about your most recent infomercial purchase, how satisfied are you with the purchase process experience [the method by which you placed your order]?
1%3%
our analysisPURCHASER SATISFACTION
Very Satisfied
Somewhat Satisfied
Neutral (Neither Satisfied nor Unsatisfied)
Somewhat Unsatisfied
Very Unsatisfied
3%2%
54%34%
7%
57%
30%
9%
17
Q: Thinking about your most recent infomercial purchase, how satisfied have you been with the product you purchased?
Nearly 90% of purchasers are Very or Somewhat Satisfied with both the product and the purchase process.
LONG-FORM DRTV• Purchaser Attitudes & Behavior Study• © Copyright 2014 •Base Purchasers – 559 Non-Purchasers - 461
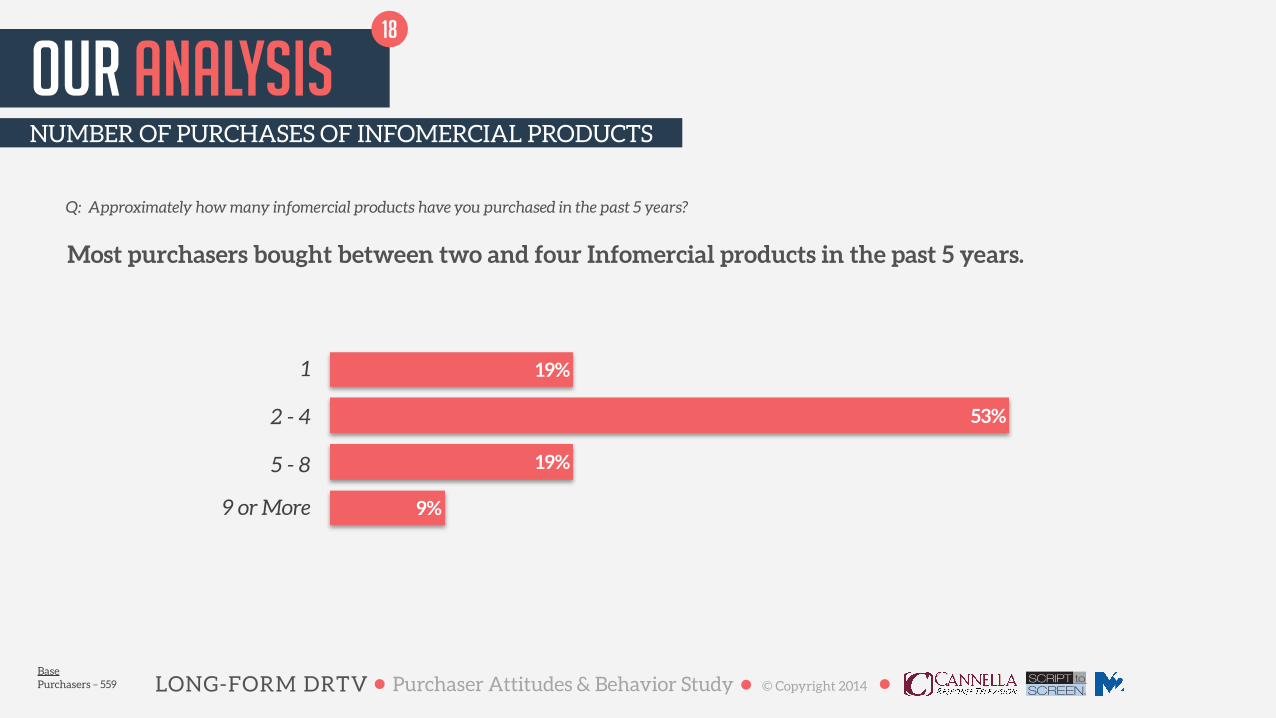
our analysisNUMBER OF PURCHASES OF INFOMERCIAL PRODUCTS
1
9 or More
5 - 8
2 - 4
Q: Approximately how many infomercial products have you purchased in the past 5 years?
18
Most purchasers bought between two and four Infomercial products in the past 5 years.
Base Purchasers – 559
9%
19%
53%
19%
LONG-FORM DRTV• Purchaser Attitudes & Behavior Study• © Copyright 2014 •

Nearly three-quarters of purchasers recommended their most recent infomercial product to others and most told 2-4 people.
our analysisRECOMMENDED PRODUCT
Yes74%
26%
Q: Have you recommended this product to anyone based on your experience?
1 2 - 4 5 - 7 8 or More
Q: How many people would you estimate you recommended this product to? !
8%
56%
22%
13%
19
No
LONG-FORM DRTV• Purchaser Attitudes & Behavior Study• © Copyright 2014 •Base Purchasers – 559 Non-Purchasers - 461
13%15%18%
70%
26%
12%
25%27%
75%
21%
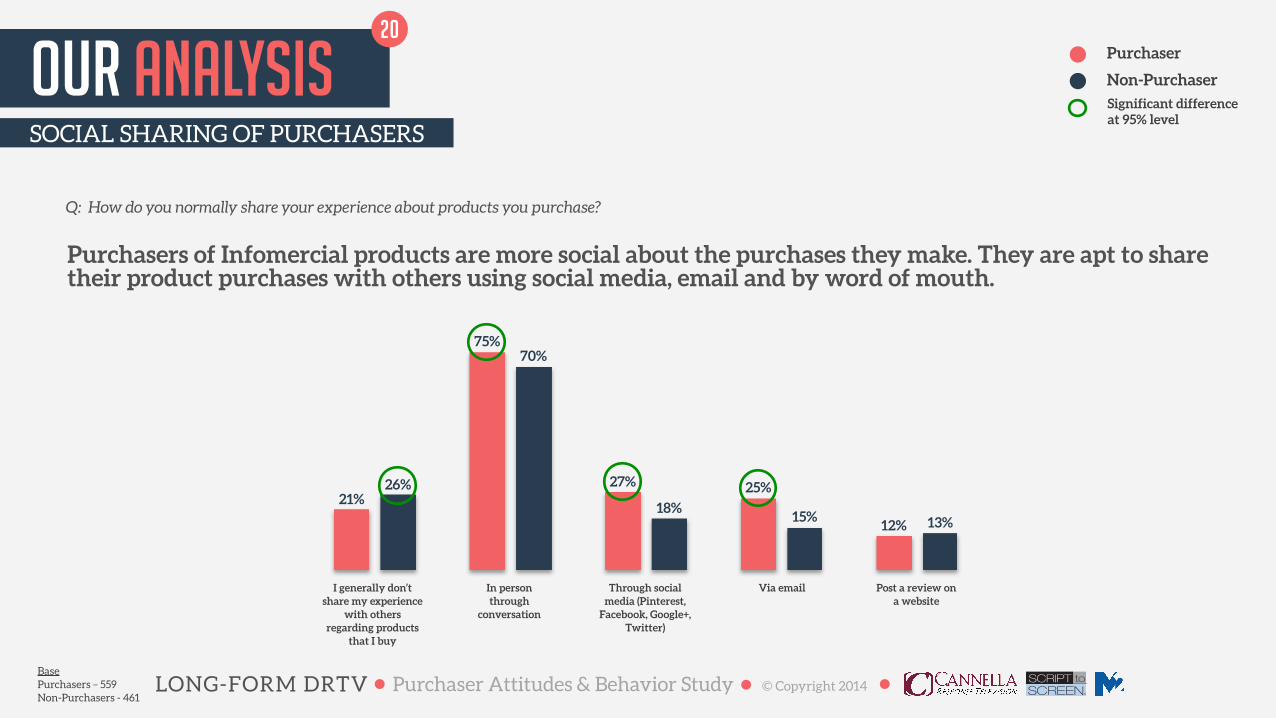
our analysisSOCIAL SHARING OF PURCHASERS
I generally don’t share my experience
with others regarding products
that I buy
In person through
conversation
Through social media (Pinterest,
Facebook, Google+, Twitter)
Via email Post a review on a website
20
Base Purchasers – 559 Non-Purchasers - 461
Purchaser
Non-PurchaserSignificant difference at 95% level
LONG-FORM DRTV• Purchaser Attitudes & Behavior Study• © Copyright 2014 •
Q: How do you normally share your experience about products you purchase?
Purchasers of Infomercial products are more social about the purchases they make. They are apt to share their product purchases with others using social media, email and by word of mouth.

our analysisPURCHASE TIMING
47%I made the purchase
after the first time I saw the program
21
Base Purchasers – 559
43%I made the purchase after seeing the program 2 or 3 times
10%I made the purchase after seeing the program several times (4 or more)
Q: Thinking about your most recent infomercial purchase, when you decided to make your purchase, how soon did you place your order for the product or service? Nearly 50% of purchasers
ordered the product after the first time they saw the infomercial and more than 90% of them bought the product after watching the program three or fewer times.
LONG-FORM DRTV• Purchaser Attitudes & Behavior Study• © Copyright 2014 •
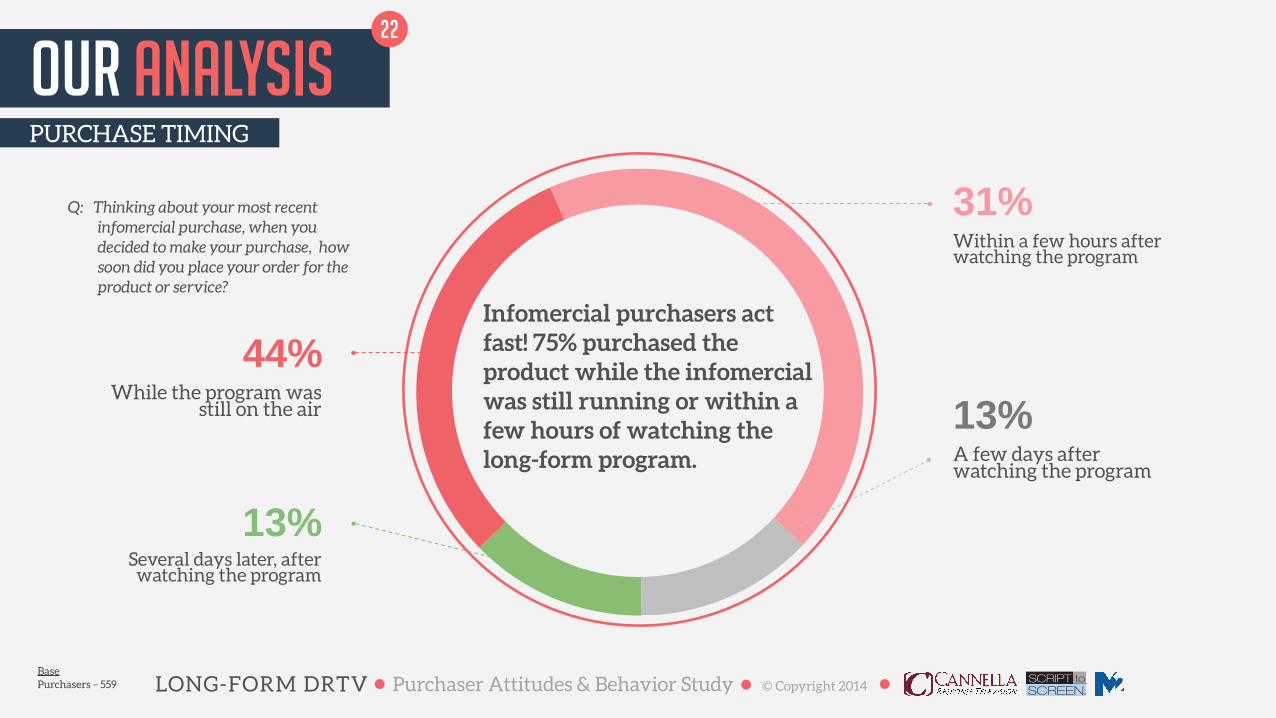
our analysisPURCHASE TIMING
31%Within a few hours after watching the program
22
Base Purchasers – 559
44%While the program was
still on the air
13%Several days later, after watching the program
Q: Thinking about your most recent infomercial purchase, when you decided to make your purchase, how soon did you place your order for the product or service?
13%A few days after watching the program
LONG-FORM DRTV• Purchaser Attitudes & Behavior Study• © Copyright 2014 •
Infomercial purchasers act fast! 75% purchased the product while the infomercial was still running or within a few hours of watching the long-form program.
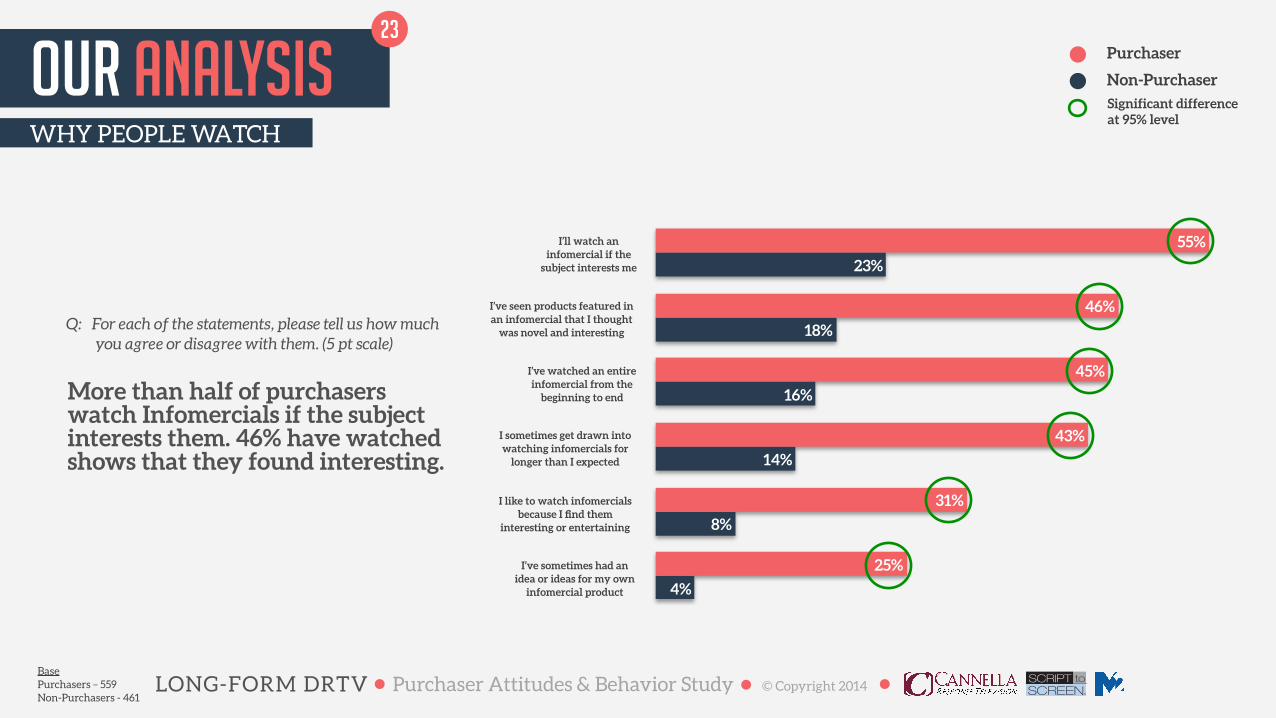
our analysisWHY PEOPLE WATCH
Q: For each of the statements, please tell us how much you agree or disagree with them. (5 pt scale)
4%
8%
14%
16%
18%
23%
25%
31%
43%
45%
46%
55%I’ll watch an infomercial if the
subject interests me
I’ve seen products featured in an infomercial that I thought
was novel and interesting
I’ve watched an entire infomercial from the
beginning to end
I sometimes get drawn into watching infomercials for
longer than I expected
I like to watch infomercials because I find them
interesting or entertaining
I’ve sometimes had an idea or ideas for my own
infomercial product
23
More than half of purchasers watch Infomercials if the subject interests them. 46% have watched shows that they found interesting.
Base Purchasers – 559 Non-Purchasers - 461
Purchaser
Non-Purchaser
LONG-FORM DRTV• Purchaser Attitudes & Behavior Study• © Copyright 2014 •
Significant difference at 95% level
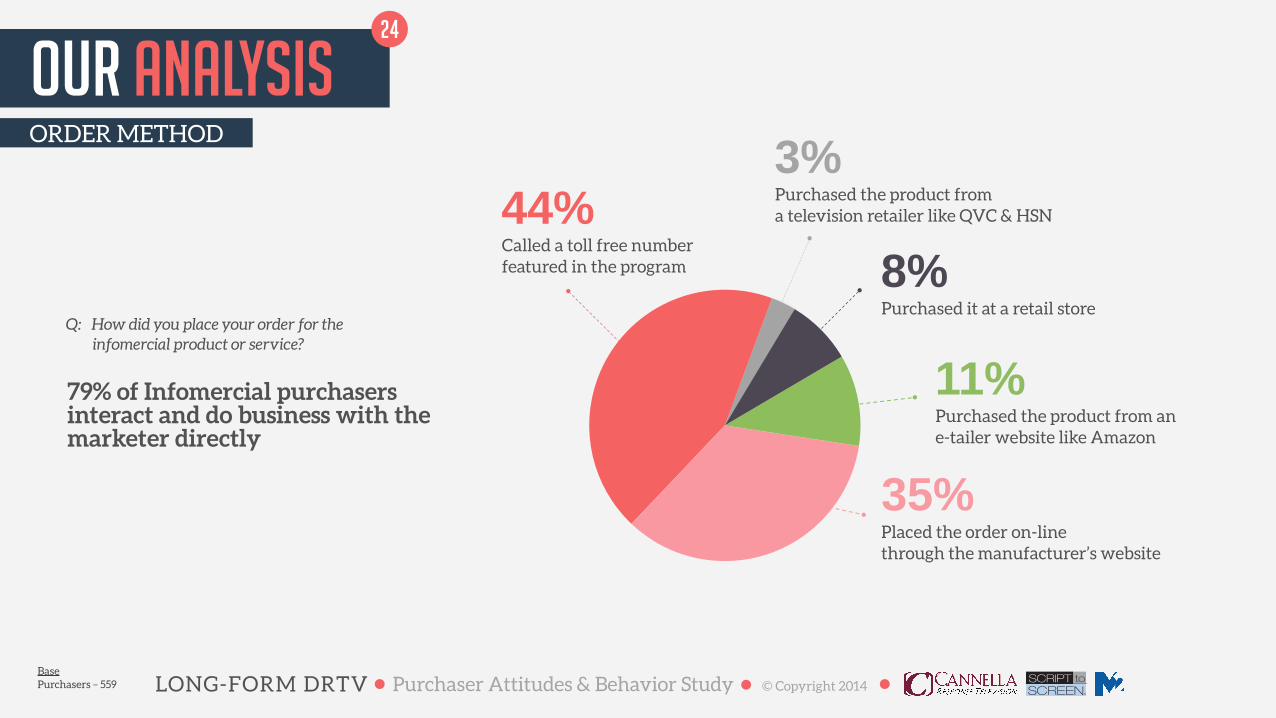
our analysisORDER METHOD
44%Called a toll free number featured in the program
3%Purchased the product from a television retailer like QVC & HSN
8%Purchased it at a retail store
11%Purchased the product from an e-tailer website like Amazon
35%Placed the order on-line through the manufacturer’s website
Q: How did you place your order for the infomercial product or service?
24
79% of Infomercial purchasers interact and do business with the marketer directly
Base Purchasers – 559 LONG-FORM DRTV• Purchaser Attitudes & Behavior Study• © Copyright 2014 •

InfomercialAttitudes
LONG-FORM DRTV• Purchaser Attitudes & Behavior Study• © Copyright 2014 •

INFOMERCIAL ATTITUDESINFOMERCIAL QUALITY
Q: Thinking about infomercials in general, which of these statements best describes how you feel about the overall quality of infomercials?
Infomercials have gotten better over the years
Infomercials haven’t changed much over the years
Infomercials have gotten worse over the years
32%
58%
10%
Purchasers
27%
8%
Non-Purchaser
65%Purchasers have significantly better opinions of how infomercials have changed over the years. Fewer are neutral.
Base Purchasers – 559 Non-Purchasers - 461
Significant difference at 95% level
LONG-FORM DRTV• Purchaser Attitudes & Behavior Study• © Copyright 2014 •
26

INFOMERCIAL ATTITUDESPRE-PURCHASE RESEARCH BEHAVIORS
Q: Before you made your purchase did you do any of the following?
(Check all that apply)
11%
18%
43%
45%
58%
Visited a retail store to see the
product in person
Called the toll free number to talk to a representative to get more information
Researched the product on-line for articles, ratings or
customer reviews
Visited the manufacturer’s website
for more information
Visited an online e-tailer’s website they prefer to do business with, to see if it offered the product for sale
More than half of purchasers researched the product at the marketer’s website before buying. Nearly half also looked online for reviews or called the toll-free number for more information.
Base Purchasers – 559 LONG-FORM DRTV• Purchaser Attitudes & Behavior Study• © Copyright 2014 •
27

INFOMERCIAL ATTITUDESPURCHASE INFLUENCERS
Q: When deciding whether to purchase a product, please tell us how important it is to see any type of advertising that includes the following: (5 point scale)
4%
24%
28%
40%
39%
18%
39%
40%
56%
62%
Hearing or reading testimonials from customers
who have the product
A side-by-side comparison of the product to other
similar products
Seeing the final results after the
product was used
A detailed demonstration of
the product
A celebrity (sports, TV, or public figure) personally
endorses the product
Purchasers are more influenced by all marketing tactics than non-purchasers, with demonstrations and before-after comparisons being particularly influential.
Base Purchasers – 559 Non-Purchasers - 461
Purchaser
Non-Purchaser
LONG-FORM DRTV• Purchaser Attitudes & Behavior Study• © Copyright 2014 •
Significant difference at 95% level
28
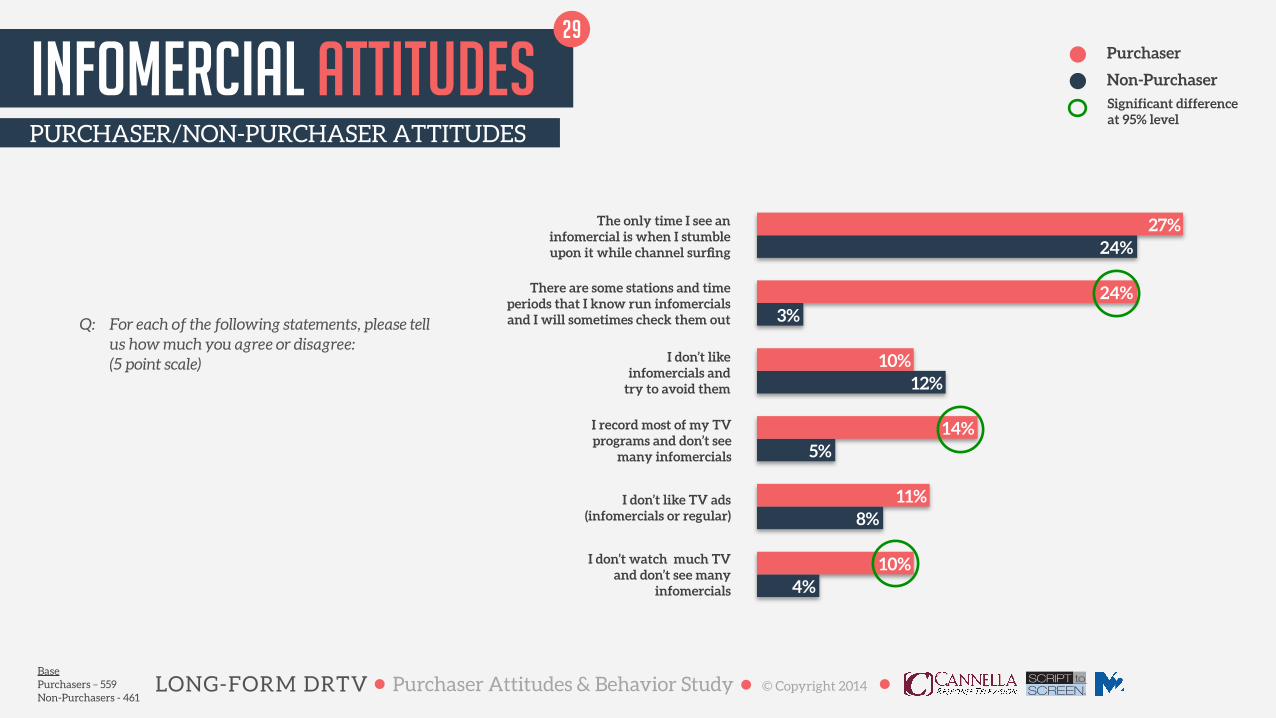
INFOMERCIAL ATTITUDESPURCHASER/NON-PURCHASER ATTITUDES
Q: For each of the following statements, please tell us how much you agree or disagree:
(5 point scale)
4%
8%
5%
12%
3%
24%
10%
11%
14%
10%
24%
27%
I record most of my TV programs and don’t see
many infomercials
I don’t like infomercials and
try to avoid them
There are some stations and time periods that I know run infomercials and I will sometimes check them out
The only time I see an infomercial is when I stumble upon it while channel surfing
I don’t like TV ads (infomercials or regular)
I don’t watch much TV and don’t see many
infomercials
Base Purchasers – 559 Non-Purchasers - 461
Purchaser
Non-PurchaserSignificant difference at 95% level
LONG-FORM DRTV• Purchaser Attitudes & Behavior Study• © Copyright 2014 •
29
Infomercial customers are decisive buyers. They are receptive to long-form advertising content, have money, make fast decisions, buy direct, share their experiences, and are satisfied with the products they buy from infomercials.
• Consumers make their mind up after just a few viewings.
• Consumers take action quickly after they’ve made a decision to buy.
• More than 88% of buyers are satisfied with their purchase and the process.
• 74% will refer the product to a friend.
Long-form advertising is an effective marketing and sales channel to develop a direct, customer relationship that generates a positive return on marketing investment.
• Long-form advertising leverages the scale and mass reach of television.
• Long-form advertising is branded video content that prompts interest, informs, engages, persuades and transacts.
• Long-form advertising enables marketers to develop a 1:1 relationship with the consumer.
point of viewTHE BUSINESS CASE FOR LONG-FORM INFOMERCIALS
LONG-FORM DRTV• Purchaser Attitudes & Behavior Study• © Copyright 2014 •
Could long-form advertising be the next killer app that delivers ROI opportunities for non-DRTV marketers? In a fragmenting media landscape consisting of snippets of branded intercepts at fleeting moments of opportunity, long-form advertising provides marketers a medium to engage consumers at a richer, longer and more engaging level. A level that ends in a transaction.
30

MeetSponsors
THE
LONG-FORM DRTV• Purchaser Attitudes & Behavior Study• © Copyright 2014 •

714-558-3971
The sponsorSCRIPT TO SCREEN, INC.
32
Barbara Kerry
!
Co-founder & CEO
"Script to Screen, Inc.
200 N. Tustin Avenue, Suite 200 Santa Ana, CA 92705
www.scripttoscreen.com
Script to Screen is a fully integrated direct response agency creating award winning, high-performance strategic creative and production, resulting in some of the most successful DRTV campaigns in history for top tier brands and emerging brands.
Since 1986, it has created hundreds of the most results-driven Long Form Shows and DRTV campaigns ever launched, including: Euro-Pro, Nescafe, Comcast, Bose, Pfizer, GM, P&G, AAA, Rosetta Stone, Oreck, Cuisinart, Soda Stream, Conair, Sears, Rubbermaid, Black & Decker, Braun, Kraft, Sharp, Taylor Made, Dremel, Bosley, Aero, bareMinerals, Philosophy, Nutrisystem, Jenny Craig, Tria Beauty and many more. !
It creates high-performance DRTV for direct sales, lead generation, customer acquisition, web traffic and retail lift, with deep experience and proven success in: Beauty, Fitness, Housewares, Weight Loss, Education, Business Opportunity, Financial Services, Insurance, Personal Health, Automotive, Pharma, Sports and Technology. !
LONG-FORM DRTV• Purchaser Attitudes & Behavior Study• © Copyright 2014 •

Dallas CeleciaPresident
714-953-5566
M2 Marketing and Management Services 200 N. Tustin Avenue, Suite 100
Santa Ana, CA 92705 www.m2-marketing.com
The sponsorM2 MARKETING AND MANAGEMENT SERVICES
33
M2 Marketing and Management Services is a well-respected provider of Direct Response strategy and management services with a 15-year track record of some of the most successful long-form and short-form DRTV campaigns in history, including many of the campaigns for Script to Screen. !M2’s extensive client list includes: Oreck, Rubbermaid, Conair, Cuisinart, Bare Escentuals, Tria Beauty, Soda Stream, P&G, Abbott Labs, Dremel, MET-Rx, Tracy Anderson, Lip Fusion, EyeQ, Contour, and many more. !M2 delivers highly effective Direct Response solutions by utilizing best-in-class systems that are tailored to the specific needs of each client, resulting in optimal campaign performance. !
Its services reflect a comprehensive approach to Direct Response including: competitive analysis, financial forecasting, strategic planning & campaign management, 360º performance analytics software, call-routing capabilities, inbound call center management, multi-channel media, online development, social media & online PR, fulfillment management, radio, print, home shopping, international and retail distribution.
!"
LONG-FORM DRTV• Purchaser Attitudes & Behavior Study• © Copyright 2014 •

The sponsorCANNELLA RESPONSE TELEVISION
34
Tony Besasie
President
262-763-4810
Cannella Response Television 848 Liberty Drive
Burlington, WI 53105 www.drtv.com
Cannella Response Television is the largest long-form DRTV media company in North America, serving the industry’s most respected and renowned DRTV advertisers. Cannella manages the largest inventory of paid programming time, providing the media needed to drive immediate direct to consumer sales and leads as well as higher levels of retail traffic, resulting in nearly a billion dollars’ worth of sales annually.
Cannella is a proven market leader known for its progressive and innovative approach to media management, where a forward looking strategy is needed in order to meet the needs of marketers in an increasingly complex advertising environment.
Maintaining the most diverse list of direct response clients in the television industry, Cannella’s breadth of experience across all categories allows the company to bring forth best practices for strategic response media management.
!"
LONG-FORM DRTV• Purchaser Attitudes & Behavior Study• © Copyright 2014 •