long and short the china dream - grant's interest rate … and short the china dream anne...
TRANSCRIPT

Long and Short the China Dream
Anne Stevenson-YangApril 13, 2016
Micro to Macro

China has been a Silicon Valley ca. December 1999—since 2006.
‣ China’s excess of capital leads to focus on volume growth over profitability.
‣ Continuing fragmentation from regulatory and financial sources.
‣ Executives are rewarded for raising capital and use that in turn to create their own growth.
‣ Cash is power: important to hold a lot of it ‣ But cash also makes companies a target for the
government.
4/13/16

China’s virtuous circle of capital
State fiscal resources
The banks and financial
institutions
Capital investment and investment-
driven consumption
Equity and bond markets
Corporate borrowing and
investment
• State fiscal resources are ported to the banks and re-invested in State companies, which use the capital to generate top-line growth.
• The growth story prompts foreign investors to bet more heavily on the 1 billion shirttails story.
4/13/16
Neither source of large capital flows, State or foreign, offers any real return.

The currency is the ultimate corrective.
4/13/16
Source: PBOC, Customs, MOC, SAFE, J Capital
Reported Capital Flight (bln USD)
-160.00
-140.00
-120.00
-100.00
-80.00
-60.00
-40.00
-20.00
0.00
20.00
40.00

Poster children
BABA short‣ Current price: USD 75.86‣ Target price: USD 36.58‣ Market cap: USD 188.83 bln‣ P/E: 18.43x‣ Av volume: 8.83 mln shares
Tingyi (0322 HK) long‣ Current price: HKD 7.77‣ Target Price: about HKD 15‣ Market cap: HKD 43.65 bln‣ P/E: 16x‣ Av volume: 15.85 mln shares
4/13/16

Four reasons to short Alibaba
‣ As an ecommerce platform, it’s maxed out‣ A terrible investor of shareholders’ money.‣ Likely using investor capital to generate its own
revenues.‣ The Chinese e-commerce story is exceedingly
unlikely.
4/13/16

Maxed out?
‣ Ebay, whose model is the same as BABA’s, reports 10.5%.‣ Baba’s calculated rate is 3% despite its monopoly status. This is
probably a function of overstated GMV.
4/13/16
Fashion ConsumerElectronics
Food
BABA 30% 15% 10%
JD 25% 13% 10%
VIPS 25% 13% N/A
Av take rate by category (as % of merchant turnover) based on J Cap interviews
Source: J Capital

Components of misleading GMV‣ Uncompleted and returned orders‣ Balance transfers‣ Fulfillment cost‣ Free-of-charge wholesale transactions‣ “Craig’s List”-style listings of industrial goods etc.
closed outside the platform but that count in GMV.‣ Reciprocal purchases to acquire volume, credit card
points, or to move product through tax-efficient localities
‣ Brushing or totally faked orders
4/13/16

Dubious assets‣ Alibaba has accumulated USD 25.8 bln in goodwill,
intangibles, and investment in associates (at end 2015 exchange rate).
‣ The acquisitions have virtually no accretive value.‣ Our research on companies like Wasu Media, Citic21,
Koubei etc. suggests that friends and family are probably being paid more than the companies are worth.
‣ Many of the acquisitions—Haier assets, Evergrande’s soccer team, Suning, Intime—look either like loans or like seeding own revenue.
4/13/16

A little help for BABA’s friends?
Source: Company reports.
4/13/16
(RMB mln) FY2012 FY2013 FY2014 FY2015 AsofDec.31,2015
Investmentinequityinvestees 1,642 1,555 17,666 33,877 79,235
Intangibleassets 355 334 1,906 6,575 5,980
Goodwill 11,436 11,294 11,793 41,933 81,645
Total 13,433 13,183 31,365 82,385 166,860
BABA’s Dubious Assets
The company carried $25,870 bln in such assets as of December 31.
Whom is the company being run for?
‣ Share-based compensation is about 16% of revenue and 35% of profit.
‣ Even as revenue rose 45% in FY2015, income from operations declined by 7% “due primarily to a significant increase in share-based compensation expense.”
4/13/16

Alibaba is the most profitable of all e-commerce companies. So why does it need so much capital?
4/13/16
Cumulative cash flows from operating versus financial activities 2012-2015 (in mln USD except for BABA)
Source: Company reports
Alibaba (mln RMB) FBOperating 91,347 Operating 19,890
Financing 95,930 Financing 8,769
Amazon NFLXOperating 28,417 Operating -613.54
Financing2,389
Financing 2663.84
eBay GOOGOperating 18,543 Operating 72,219
Financing -4,979 Financing -260

And it’s just really unlikely
4/13/16
Average annual spend per active user 2014
Alibaba $1,075 JD.com $502 eBay $597 Zulily $246 Amazon $330 VIPS $159
Source: Company reports
• Using 2013 numbers, the Chinese retail industry was measured at USD 3.71 trn. The US retail was about USD 4.5 trn that year. Therefore, Chinese retail was reportedly 83% of U.S. retail. But the U.S. economy is 40% larger than China’s, and US consumption is more than double Chinese as a proportion of GDP.
• Alibaba continues to accelerate as the rest of the economy declines. Category sales on Alibaba are greater than all such category sales recorded by the NBS.
About one-third of annual disposable income in
China.

When to short Alibaba: Watch the capital flows
‣ BABA has already issued equity and two tranches of debt. It also borrows from its merchants.
‣ For BABA, incoming capital makes it possible to create GMV and revenue. The group will try to IPO Ant Financial and eventually China Smart Logistics. BABA may also issue new equity and debt. If it cannot get these fundraises out, the coast will be clear to short.
‣ It seems significant that no Chinese banks are involved in the IPOs, bonds, and credit facilities.
4/13/16

Long: Tingyi‣ Tingyi is the largest maker of instant noodles and beverages in China, with
annual sales of ~USD 10Bn
‣ Tingyi is a play on instant noodles– Noodles comprised ~97% of Tingyi’s earnings in 2015
– Tingyi’s beverages business comprises ~60% of sales, but a small fraction of earnings due to the listco’s 47% ownership of the beverage business and lower OP margins in beverages
‣ Tingyi has a long runway for growth in noodles in China– Noodle consumption per capita in China is half that of Taiwan and HK
‣ There is an upgrade path to bowl noodles from packet noodles– In Taiwan, cup and bowl noodles make up 47% of the noodles market. In China, this figure is a
scant 17% of the market. Cup and bowl noodles cost 3-4x the price of packet noodles
‣ Tingyi dominates the bowl noodles market in China– Tingyi’s market share in bowl noodles is especially strong at 67% of the market, vs.
its overall market share in noodles of 44%
4/13/16
Tingyi enjoys economies of scale
‣ Tingyi and Uni-President China (UPC) both began operations in the 90s, UPC has traditionally emphasized product development while Tingyi has focused on scale and aggressive pricing.
‣ In mass-market food and beverage, brand awareness and access to consumers are key advantages
‣ Today, Tingyi is undeniably the market leader in the instant noodles category in China, with noodle sales 3-4x that of UPC
4/13/16
Tingyi enjoys economies of scale
4/13/16
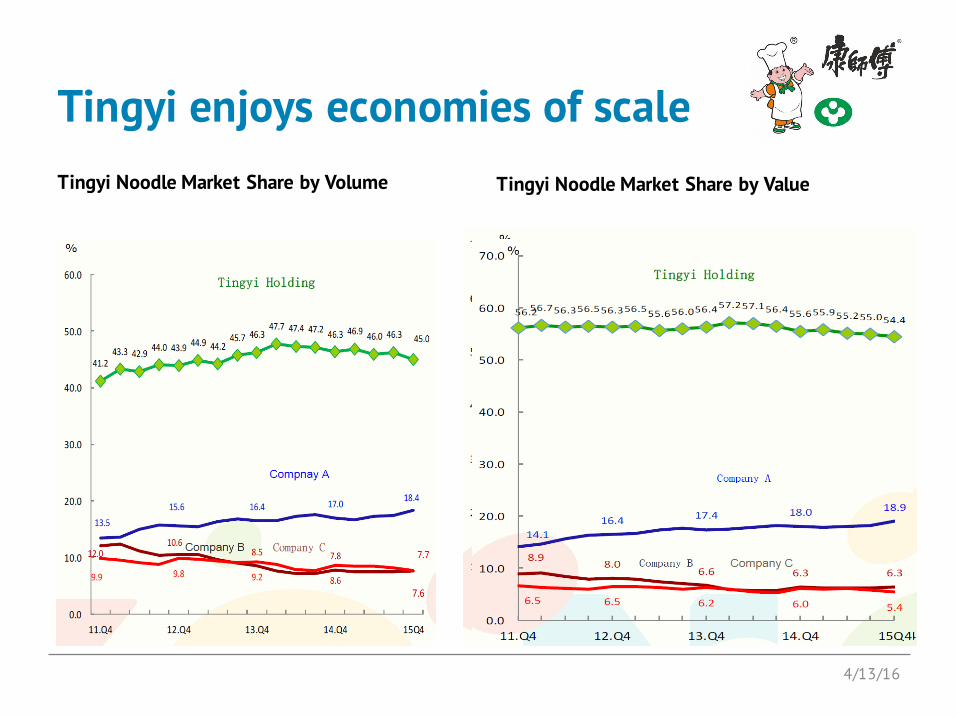
Tingyi Noodle Market Share by Volume Tingyi Noodle Market Share by Value
Tingyi and UPC have been locked in a battle for share
‣ Tingyi’s main competitor, UPC, has proven more innovative than Tingyi in developing “hero” products
‣ However, Tingyi mimics hit flavors that UPC develops, and then rolls them out with greater scale, marketing budget, and at a very competitive price point
‣ Tingyi and UPC have both spent heavily on promotions like free sausage, two-for-one deals on drinks, etc.
4/13/16

Tingyi and UPC have been locked in a battle for share
4/13/16
‣ Throughout this battle, Tingyi has consistently retained the lion’s share of industry profit
‣ With low profits, UPC funded its expansion using debt
0
1,000
2,000
3,000
4,000
5,000
2007 2008 2009 2010 2011 2012 2013 2014 2015
UPCvsTingyi:NoodleSales(USD)
UPC Tingyi -5.0%
0.0%
5.0%
10.0%
15.0%
20.0%
25.0%
-100
0
100
200
300
400
500
2007 2008 2009 2010 2011 2012 2013 2014 2015
UPCvsTingyi:NoodleOperatingProfit(USD)
UPCEBIT TingyiEBIT UPCOPMargin TingyiOPMargin
Source: Company Filings

Competition is thinning
‣ Strapped for cash, UPC issued a rights offering in June 2014 to repay some of its short-term bank borrowings– HKD 3.3Bn was raised at a price of HKD 4.56 per share, diluting
shareholders by ~17%
‣ Post equity raise, UPC is seeking to transform its noodles strategy, increasingly focusing on niche categories where it competes less directly with Tingyi
‣ Less direct competition should result in better profits for both competitors
4/13/16

Anticipating easing competition, Tingyi implemented a mistimed product upgrade in Q4 2015
4/13/16
-20-100102030
0
1,000
2,000
3,000
4,000
Q4 2013
Q1 2014
Q2 2014
Q3 2014
Q4 2014
Q1 2015
Q2 2015
Q3 2015
Q4 2015
Q1 2016 Est
Q2 2016 Est
Revenue, Comparable Growth %, YoY
• Tingyi’s price hike turned out to be premature, as Tingyi’s main competitor, UPC, has not followed suit
• Tingyi profit dived last quarter, as distributors have been cautious to re-stock on Tingyi’s upgraded products
• Investors worry Tingyi is losing share in the noodles segment
Source: Bloomberg
Tingyi Revenue by Quarter YoY
The long term story for Tingyiremains intact‣ Tingyi enjoys scale advantages over its closest competitor, UPC
– Tingyi is over 3x the scale of UPC, providing 3x the marketing budget of its closest competitor, and a lower cost basis for distribution
– Tingyi will continue to accumulate the lions share of profits in the noodles business, year after year
‣ Tingyi’s distribution network is highly coveted by international brands seeking access to the China consumer– Tingyi’s TAB subsidiary (Tingyi’s beverage sub) is now Pepsi’s exclusive
franchise bottler and distributor in China for Pepsi’s carbonated soft drinks and Gatorade brands• Pepsi and Tingyi are also co-branding their juice drink brands using the
Tropicana brand name under License from Pepsi
– Starbucks partnered with Tingyi in 2015, where Tingyi will manufacture and distribute Starbucks’ RTD products
4/13/16

A shift is on the horizon‣ UPC is expected to push new noodles products and
hike prices by Q2 2016, concentrating on niche markets where it will have less direct competition with Tingyi
‣ Current channel inventory for Tingyi remains light, as distributors have been reticent to stock up on higher priced inventory
4/13/16

Icing on the Cake – Beverage Recovery?‣ Tingyi’s primary earnings driver is the noodle business, but
Tingyi is likely under-earning on beverages‣ In 2008, Tingyi’s OP margins were ~13%
– By 2015, beverage EBIT margins compressed to 2.8%
‣ Over the past 2 years, Tingyi has been digesting the Pepsi acquisition
– Termination benefits of USD 43Mn were expensed in 2015, and another 31Mn is expected to be expensed in 2016. For context, EBIT was ~USD 150Mn for the segment in 2015; termination expenses were meaningful for the year
– If OP margins return to their historical norm of ~10% (in line with many global mass market beverage peers), Tingyi’s beverage earnings would increase by a factor of 3-4x
‣ We believe Tingyi’s integration of Pepsi is nearing completion, and increased profitability in beverages should begin to materialize by EOY 2016
4/13/16

And finally, the biggest short of all: the Renminbi‣ China, with help from the Fed, has persuaded
markets that it has achieved a soft landing. Shorts in the currency have been smoked, and equities in cyclical industries like mining and construction equipment are rallying.
‣ Don’t fall for it. Nothing has changed except for the degree of desperation at the political level. Investors are being played.
4/13/16

Managing the unholy trinity: exchange rates, capital flight, and interest rates
‣ China has had a long run of expanding its domestic money supply with an appreciating rate due to incoming flows of capital from the U.S. quantitative easing program.
‣ In 2014, the stream of capital began to reverse.
4/13/16

Without constant injections of cash, the financial system would not be able to transact.
4/13/16
Source: PBOC, J Capital
Liquidity needs are on the order to RMB 70 trn per year:
Net Injections to the Financial System by Type of Institution
-30,000
-20,000
-10,000
0
10,000
20,000
30,000
Net Special Clearing Member Net Fund Net Insurance CompanyNet Securities Company Net Non-bank Financial Institution Net Credit CooperativeNet Village Banks Net Rural Commercial Banks Net Urban Commercial Banks (UCBs)Net Foreign-funded Banks (FFBs) Net National Commercial Banks

The PBOC is using forwards and other techniques to hide outflows.
4/13/16
-140.0-120.0-100.0
-80.0-60.0-40.0-20.0
0.020.040.060.080.0
Jan-
10
Apr-
10
Jul-
10
Oct
-10
Jan-
11
Apr-
11
Jul-
11
Oct
-11
Jan-
12
Apr-
12
Jul-
12
Oct
-12
Jan-
13
Apr-
13
Jul-
13
Oct
-13
Jan-
14
Apr-
14
Jul-
14
Oct
-14
Jan-
15
Apr-
15
Jul-
15
Oct
-15
Jan-
16
Change in cumulative unexpired balanceSource: PBOC
The volume of swaps, forwards, and options now totals USD 4.4 tln since October. Deposits against those swaps could be as high as USD 800 bln. Some of that money may be obscuring the decline in Forex reserves.

In all, China probably has around 9 months before the reserves are run down to a perilous point.
4/13/16
China’s Forex Reserve Composition: Estimates
Government agencies, press reports, J Capital
Asset Currency Approx value counted in reserves, (in bln USD)
U.S. Treasuries USD 1,237.9
Euro bonds EUR 600
Japanese government bonds
JPY 79.17
Korean government bonds
KW 13
CIC (and its subsidiary funds, including Central Huijin and China Jianyin)
USD 267
China DevelopmentBank
USD 320
Eximbank USD 350
European Financial Stability Facility bonds
EUR 50
National Social Security Fund
HKD 20
TOTAL 2,937.07

Emerging markets will not be the only victims of Chinese depreciation.
4/13/16
Aswent luxury,sowillgothelovedconsumernamesofyesteryear.
Decliningcorporaterevenue
Weakequitymarkets
Bonddefaults

DisclaimerThis publication is prepared by J Capital Research Limited (“J Capital”), a Hong Kong registered company. J Capital is regulated as a company advising on securities by the Hong Kong Securities and Futures Commission (CE# AYS956) and is registered as an investment adviser with the U.S. SEC (CRD# 165324). This publication is distributed solely to authorized recipients and clients of J Capital for their general use in accordance with the terms and conditions of a Services Agreement and the J Capital Authorized User Content Agreement available . Unauthorized copying or distribution is prohibited. If you are reading this publication without having entered into a Services Agreement with J Capital, or having received written authorization to do so, you hereby agree to be bound by the J Capital Non-Authorized User Content Agreement that can be viewed . J Capital does not do business with companies covered in its publications, and nothing in this publication should be construed as a solicitation to buy or sell any security or product. In preparing this document, J Capital did not take into account the investment objectives, financial situation and particular needs of the reader. This publication is intended by J Capital only to be used by investment professionals. Before making an investment decision, the reader needs to consider, with or without the assistance of an adviser, whether the contents are appropriate in light of their particular investment needs, objectives and financial circumstances. J Capital accepts no liability whatsoever for any direct, indirect, consequential or other loss arising from any use of this publication and/or further communication in relation to this document.
4/13/16
Anne Stevenson-Yang [email protected]