london schooling - · pdf filelondon schooling: lessons from the capital november 2011 gill...
TRANSCRIPT

London schooling:lessons from the capital
November 2011
Gill Wyness

London schooling
�
About the author
Gill Wyness joined CentreForum in April 2011, from the Institute for Fiscal Studies, where her main focus was on evaluating higher education funding reforms. Her background is in quantitative research and as well as researching higher education finance reforms her work has focused on university participation in the UK and youth unemployment. Gill recently advised the Browne Review on higher education finance.
Copyright 2011 CentreForum
All rights reserved
No part of this publication may be reproduced, stored in a retrieval system, or transmitted in any form or by any means, electronic, mechanical, photocopying, recording or otherwise, without the prior permission of CentreForum, except for your own personal and non-commercial use. The moral rights of the author are asserted.

London schooling
�
Contents
Executive summary 4
1. Introduction 6
2. Data 8
3. How does London compare to the rest of England? 10
4. Explaining London 12
5. How does London compare with the rest of the country, once pupil and school characteristics are controlled for? 31
6. Regional disparities within London 34
7. How did London get ahead? 36
8. Getting the UK reading 43
9. Conclusions and discussion 46
Appendix 49
:

London schooling
�
Executive summary
It is well-known that there are large inequalities in the academic outcomes of pupils, depending on whether they are from wealthy or poor backgrounds. That the gap in achievement is also heavily dependent on where they live in the country is a lesser known fact. In this report we analyse the academic attainment of pupils across the country, focusing in particular on pupils in London.
On first inspection, pupils in London perform no better (or worse) than those in other major regions of England. However, deeper analysis reveals that pupils in London are very different to those in the rest of the country. In particular, London contains a disproportionate number of poor pupils, as well as a greater mix of pupils from different ethnic backgrounds and pupils who do not speak English as their first language. London also contains a different mix of school types, including greater numbers of foundation schools and academy schools.
Once these important differences are taken into account, pupils in London appear to perform significantly better than one might expect. Indeed, pupils of all types – including the poorest pupils and those from typically under-performing ethnic groups – perform better in London than in all other regions of the UK.
Our analysis also reveals that the London advantage appears to increase the older the child. Pupils at Key Stage 1 – tested when they are aged 7, fare no better in London compared with the rest of England. However, once they reach Key Stage 2 – at age 11, an attainment gap between pupils in London and the rest of the country emerges. This gap is sustained up to the minimum school leaving age, and is significant for a variety of measures including overall GCSE points score, proportion of pupils achieving five or more good GCSE’s including English and maths and the English Baccalaureate. That the gap in attainment between pupils from
:

London schooling
�
London and the rest of the country emerges over time suggests that it is schools, rather than parents that are responsible for the relative advantage of pupils in London.
Whilst there may be many other factors affecting London schools in different ways to the rest of the country (for which this study does not account), we believe that the inclusion of several major explanatory factors such as family income background, ethnicity, mother tongue and gender makes our analysis robust.
The results imply that there are important lessons that schools in the rest of the country can learn from those in London, and that policy makers and practitioners should study London’s schools carefully. The results also imply that further research is needed to identify the reasons behind London’s apparent advantage.
London schooling
�
1. Introduction
Of the 200 academy schools opened under the Labour Government with the purpose of turning around failing schools, 39 were established in London. In 2011 the first free school in the country opened in the capital in response to the “mediocrity” of local authority education and criticisms of London’s inner city schools.1
This evidence seems to suggest that there is real cause for alarm with regards to schooling in London.
One way to test the hypothesis of whether education in London is poor compared with the rest of the country is to examine the various measures of pupil attainment across schools. However, simply examining average attainment levels around the country, and then ascribing the differences to school quality can be very misleading, because there are large gaps in the performance of pupils with certain characteristics. For example, pupils from high income backgrounds tend significantly to out-perform those living in poverty, while pupils from certain ethnic backgrounds – particularly Chinese and Asian – tend to do better than white pupils. Thus, an area with a high proportion of poor pupils will appear to perform relatively badly in test scores, regardless of the quality of schools in the area. In Newham, Tower Hamlets and Hackney, for example, the proportion of pupils achieving five or more GCSEs including English and maths is below the national average. But Newham, Tower Hamlets and Hackney are two of the poorest Local Authorities in London, with very high proportions of their pupils among the poorest fifth nationwide, so it is hardly surprising that their achievement is relatively poor. It is only by comparing pupils with equivalent characteristics that we can understand the quality of schooling in these boroughs. In this paper, we do just that.
1 P Wilby, ‘Can Toby Young’s free school succeed?’, The Guardian, 5 April 2011.
:

London schooling
�
First, we examine the educational attainment of public sector schools in London compared to the other major regions of the UK, for pupils at GCSE level. We take account of key pupil characteristics such as poverty, ethnicity, language and gender. We also examine the results according to the age of pupils. Our analysis is highly revealing. It shows that while pupils in London perform no better than those in the rest of the country on average, once equivalent pupils – of the same income background, ethnicity, language and gender are selected – London’s pupils perform better than those in all other regions of the UK. We then go on to examine the prior performance of these pupils – at Key Stages 1-3. This analysis shows that the gap in performance of pupils emerges early on, and is sustained throughout their school careers.
This analysis is unique in that it looks exclusively at how well schools educate those from the poorest backgrounds. The Department for Education went some way towards that goal with the now discontinued contextual value added scores, but these suffered two drawbacks. First, they measured the performance of the school as a whole, rather than the extent to which the school was successful at educating those from relatively poor families. Second, the results were expressed as a score, which had no obvious intuitive meaning. In contrast this analysis looks at the proportion of students who receive 5 GCSEs, including English and maths at grade C or better. This is a widely understood measure that is meaningful to both parents, teachers and policy makers

London schooling
�
2. Data
For the purposes of this analysis, we use data from the National Pupil Database.
The National Pupil Database (NPD) is a pupil level database which matches pupil and school characteristic data to pupil level attainment.
The NPD has a number of key features. First, the fact that it is a census dataset containing the population of all pupils in state schools is very helpful for a number of different analyses compared to a dataset based on a sample of schools. For example, pupils can be tracked across schools. Second, it is longitudinal, and pupils can now be followed throughout their school careers. Third, as it is a census, it provides a very rich set of data on school and pupil characteristics. The dataset includes information on pupil ethnicity (a low-income marker), special education needs (SEN), attendance, exclusions and a history of schools attended. Pupils’ Key Stage attainment records can also be accessed.
Whilst parental income is not available in the NPD, we can measure poverty using the Income Deprivation Affecting Children Index or IDACI rank, which is contained in the database. The IDACI measure shows the percentage of children in each area2 that live in families that are income deprived (i.e. in receipt of Income Support, income based Jobseeker’s Allowance, Working Families’ Tax Credit or Disabled Person’s Tax Credit below a given threshold). A rank of 1 is assigned to the most deprived area and a rank of 32,482 is assigned to the least deprived area.
The School Census covers nursery, primary, middle, secondary and special schools in the state sector. Secondary schools
2 Areas are defined as Super Output Areas or SOAs, which are geographical areas designed for the collection and publication of small area statistics.
:

London schooling
�
include middle schools, City Technology Colleges (CTCs) and academies, as well as maintained and non-maintained special schools and hospital special schools. The School Census provides information on all pupils in state schools in England as they progress through primary and secondary school. It also provides some information on independent schools – but only for those who choose to submit their information. It is therefore not representative of independent schools. For this reason, and because little information on the characteristics of pupils at independent schools is available, we have chosen to drop independent schools from our sample.
The data on state schools is highly accurate - the census includes all pupils who are registered at the school and who should have a current record on the school’s Management Information System (MIS) at the school on the census day. There are also particular cases where records are required for pupils no longer on roll (e.g. where they have been excluded and subsequently left the school prior to census day). The NPD is an extremely comprehensive and powerful source of information on state-sector pupils in England.
Our dataset contains pupils who were studying for Key Stage 4 (GCSE) level in 2009/10 (the most recent academic year for which information is available), and also combines this with previous attainment at KS1, KS2 and KS3, and spring census data from the 2009/10 academic year, undertaken by schools.
Once those pupils in independent schools are excluded, our census database comprises 603,810 pupils.

London schooling
10
3. How does London compare to the rest of England?
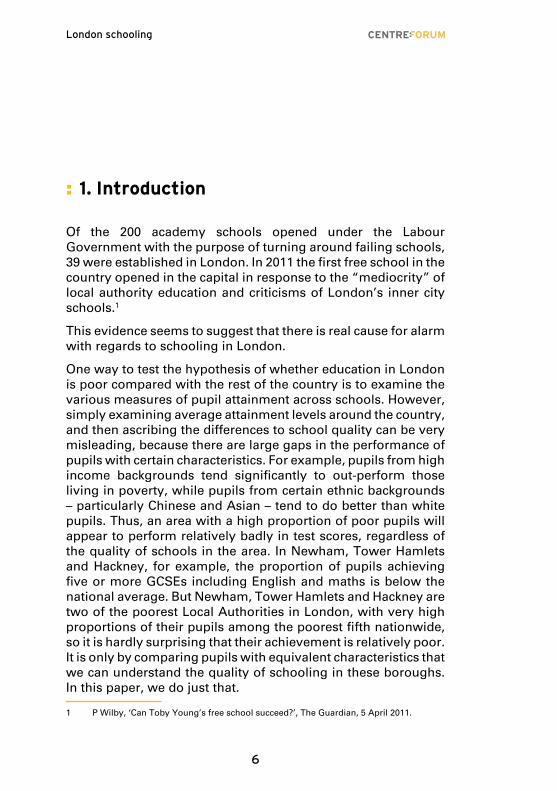
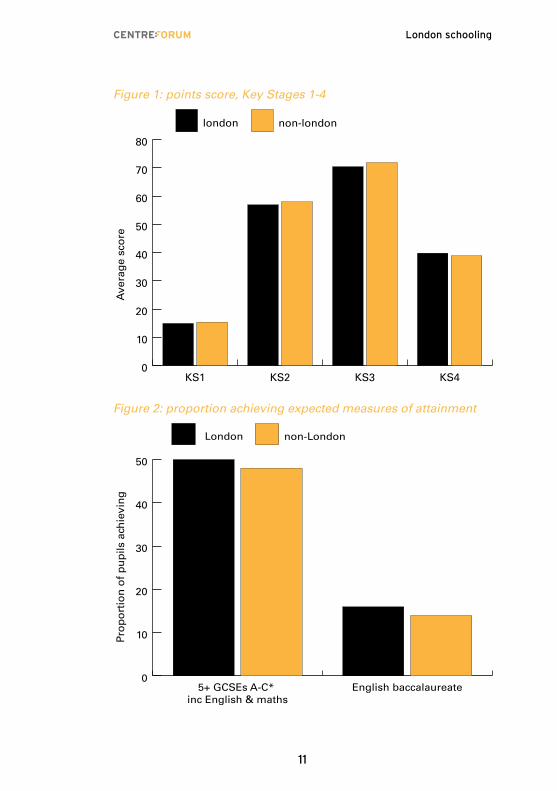
On first inspection, the quality of education in London appears to be no better (or worse) than in the rest of the country for children of compulsory schooling age. Figure 1 shows points scores for those at Key Stages 1, 2, 3 and 4 (taken at age 7, 11, 14 and 16 respectively). In each case, pupils in London achieve very similar scores to those in the rest of the country. Similarly, figure 2 shows the proportion of pupils achieving the respective long-standing Labour and Coalition targets for GCSE attainment; five or more GCSE’s at grades A*-C including English and maths, and the English baccalaureate (defined as GCSE grades A*-C in English, maths, at least two sciences, a modern foreign language and either history or geography – also known as the “ebacc”). 50 per cent of pupils in London achieve five plus GCSEs including English and maths, while 48 per cent of pupils outside London achieve this. For the rather more ambitious target of the English baccalaureate, only 16 per cent of pupils in London manage this. However, again the rest of the country fares no better – with 14 per cent of pupils outside London achieving the English baccalaureate.
:
London schooling
11
Figure 1: points score, Key Stages 1-4
0
10
20
30
40
50
60
70
80
non-londonlondon
KS4KS3KS2KS1
Ave
rag
e sc
ore
Figure 2: proportion achieving expected measures of attainment
0
10
20
30
40
50
non-LondonLondon
English baccalaureate5+ GCSEs A-C* inc English & maths
Pro
po
rtio
n o
f p
up
ils a
chie
vin
g

London schooling
1�
4. Explaining London
As we have seen, the accepted measures of educational achievement for compulsory schooling reveal London to be distinctly average. Pupils in the capital perform no better or worse to those in the rest of the country at each Key Stage level, and attain similar rates of the accepted measures of GCSE attainment. Thus, we might conclude that there is nothing particularly interesting about London.
But these averages mask important differences in the pupil population in London, as compared to the rest of the country. In other words, the inputs for London are very different to the inputs for the rest of the country. Until we examine these inputs, we cannot draw conclusions about the quality of schools and teaching in London.
As explained, our dataset includes census data on pupil characteristics and some information on school characteristics. The set of characteristics here are available for almost all the pupils in our database, and are highly correlated with pupils’ academic attainment, as this section will illustrate.
The characteristics we will look at are in turn: extent of poverty, ethnic diversity, English as a second language and gender. In each case we will consider how these characteristics differ in London as compared to the rest of the country, and how far this obscures average pupil performance.
Extent of povertyOne of the most important differences between London and the rest of the country is related to the distribution of income of the parents of its pupils. In particular, pupils in London are from disproportionately poorer backgrounds than those in the rest of the country.
:

London schooling
1�
Figure 3 shows the distribution of pupils by quintile of poverty, measured by IDACI rank (as explained in Section 2) for the whole of England.
As figure 3 illustrates, there are more pupils in London defined as being in the poorest fifth of households nationwide. Over 40 per cent of pupils of compulsory schooling age in London are in the poorest fifth of pupils nationwide – compared to just over seven per cent in the South East. At the other end of the scale, around seven per cent of pupils in London are in the richest quintile, compared with 27 per cent in the South East.
Figure 3: proportion of pupils by income group and region
0 20 40 60 80 100
richestQ4Q3Q2poorest
East of England
East Midlands
Yorkshire
West midlands
North West
North East
South West
South East
London
This puts London at a distinct disadvantage to the rest of the country in terms of academic attainment, since pupils from poor backgrounds tend to perform poorly at exams compared with those from better-off backgrounds (though of course this may be as a result of factors related to poverty – such as parental ambition – rather than poverty itself). Figure 4 shows the gap between rich and poor pupils – this time for England as a whole, and expressed in poverty percentiles rather than quintiles – in terms of achieving five or more GCSE’s at A*-C, including English and maths. As the figure shows, 70-75 per cent of pupils from the richest ten percentiles of English pupils achieved five

London schooling
1�
or more good GCSEs including English and maths, compared to only around a third of pupils from the poorest ten percentiles of England.
So, in order to compare London pupils with the rest of the country, it is important to take into account the relative poverty of the London population. One way of doing this is to calculate the average scores of pupils within poverty percentile, thus comparing pupils from the same income backgrounds in London with the rest of the UK.
Figures 5-7 illustrate this for different measures of GCSE attainment. These charts clearly illustrate that for each measure, once poverty is accounted for, pupils in London perform significantly better than those outside London.3
3 For ease of comparison, we have grouped together all regions of England outside London. However, when plotted separately, the performance of pupils in London exceeds those of all regions outside London for all percentiles of poverty. The average proportion of pupils attaining five or more good GCSE’s including English and maths in London in the poorest percentile is 45% - in the next highest region, Yorkshire, the average is 20%.
Figure 4: Pupil GCSE attainment by quintile of income
0
10
20
30
40
50
60
70
80
90
Percentage achieving 5 GCSEs A-C including English and maths
99806040200
Pro
po
rtio
n o
f p
up
ils

London schooling
1�
Figure 5: Pupil GCSE points score, by percentile of income deprivation
0
10
20
30
40
50
60
70
80
90
99806040200
Pro
po
rtio
n o
f p
up
ils
non-LondonLondon
Figure 6: proportion of pupils achieving five or more good GCSE’s including English and maths, by percentile of income deprivation
0
10
20
30
40
50
60
70
80
90
99806040200
Pro
po
rtio
n o
f p
up
ils
non-LondonLondon

London schooling
1�
Figure 7: proportion of pupils achieving English baccalaureate, by percentile of income deprivation
0
10
20
30
40
50
60
70
80
90
99806040200
Pro
po
rtio
n o
f p
up
ils
non-LondonLondon
As figures 5-7 show, for all three measures of GCSE performance and at all percentiles of poverty, pupils in London do better than those outside London. However, the gap between London and non-London pupils does differ according to the measure used. For both GCSE points score and proportion with five GCSEs including English and maths, the poorest pupils in London do particularly well compared to those from outside London. The gap in terms of achieving five GCSE’s including English and maths is around 19 percentage points within the poorest percentile of pupils, compared with a gap of only five percentage points within the richest percentile. But, for the English baccalaureate, the trend is reversed – the poorest pupils are four percentage points more likely to achieve the English baccalaureate in London, but the richest pupils are 12 percentage points more likely. This implies that while London poor pupils seem to do particularly well, they are not achieving the same advantage for the tougher measure of the English baccalaureate.
Another way of looking at the performance of pupils in London according to their level of income is to examine their results using the governments’ preferred measure of poverty: free

London schooling
1�
school meal (FSM) status. This is a useful measure of poverty, since only pupils from poor backgrounds receive free school meals in the UK, and again this information is captured in our database.
A recent Financial Times article showed that there were many regions of the UK in which those pupils eligible for free school meals tended to perform particularly badly in terms of attainment, while conversely there were regions of the UK where such pupils performed better.4 In particular, this article highlighted the fact that FSM pupils in London did particularly well compared with FSM pupils in the UK as a whole.
Figure 8 confirms this analysis, and that described above, by showing that FSM pupils in London are significantly less likely to be in the bottom quintile of GCSE points scores than children in other regions of the country. In London, 28 per cent of children eligible for free school meals are in the bottom quintile of results – compared with 44 per cent of children from outside London.
Figure 8: proportion of pupils in the bottom quintile of GCSE scores nationwide, by FSM
Pro
po
rtio
n o
f p
up
ils
0
10
20
30
40
50
60
70
80
90
non-LondonLondon
non-fsmfsm
4 C Cook, ‘Map: poverty and achievement in UK schools’, The Financial Times, 1st October 2011.

London schooling
1�
Figure 9: proportion of FSM pupils failing to achieve expected measures at key stage 4
Pro
po
rtio
n o
f p
up
ils
0
10
20
30
40
50
60
70
80
90
100
non-LondonLondon
English baccalaureate5+ GCSEs A-C* inc English & maths
Figure 9, meanwhile, shows the proportion of FSM pupils that fail to achieve the expected Labour and Coalition measures of GCSE attainment. While London’s poor pupils perform better than those outside the capital, the differences are less severe. However, it is notable that only around 15 per cent of children from all backgrounds actually achieved the English baccalaureate in 2008.
As well as there being important differences in terms of income background between London and other regions of the UK, there are many other differences in the characteristics of pupils in London that may explain why pupils in London perform more strongly.

London schooling
1�
Ethnicity It is well-known, for example, that pupils in London come from a wide range of ethnic backgrounds. Figure 10 shows the proportion of white, Chinese, Asian and black pupils in London and in the rest of the UK. Not surprisingly, London contains disproportionately more Chinese, Asian, Black and mixed-race pupils, and disproportionately fewer white pupils – in fact under half of those of compulsory schooling age in London are white, compared with 82 per cent across the country as a whole.
Figure 10: proportion of pupils in each ethnic group, by region
0 20 40 60 80 100
East Midlands
East of England
Yorkshire
West Midlands
North West
North East
South West
South East
London
NotgivenOtherMixedChineseBlackAsianWhite
Looking at the performance of pupils from these ethnic groups reveals large differences. Concentrating on those achieving five or more good GCSEs including English and maths, startling differences appear in the performance of pupils. For example, over 70 per cent of Chinese pupils, and almost the same proportion of Asian pupils achieve five or more good GCSEs. But only half of white pupils, and 43 per cent of black pupils do so5.
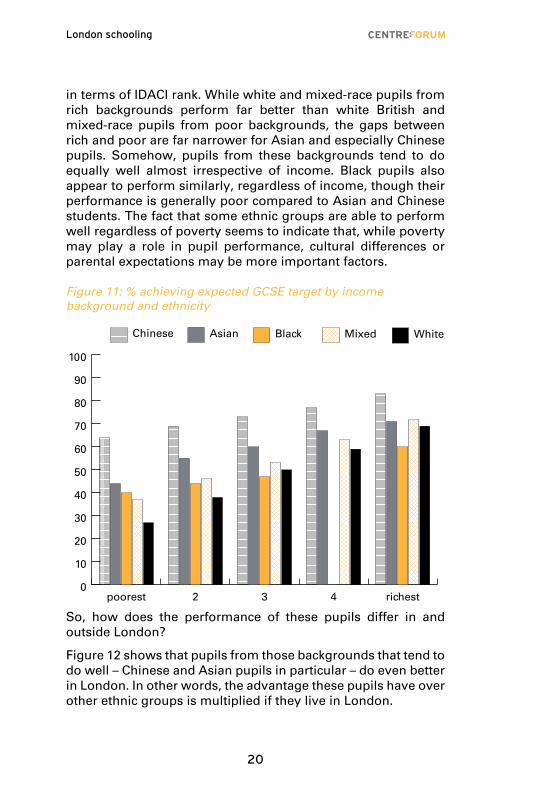
As well as performing very differently in exams, the gap between rich and poor for pupils from these ethnic backgrounds is also very different. Figure 11 shows the breakdown of Labour’s GCSE measure by ethnic group and income background, again
5 Note that sample sizes for Chinese pupils are limited, with only 2,251 appearing in the National Pupil Database – or around 0.4% of the total sample size of pupils
London schooling
�0
in terms of IDACI rank. While white and mixed-race pupils from rich backgrounds perform far better than white British and mixed-race pupils from poor backgrounds, the gaps between rich and poor are far narrower for Asian and especially Chinese pupils. Somehow, pupils from these backgrounds tend to do equally well almost irrespective of income. Black pupils also appear to perform similarly, regardless of income, though their performance is generally poor compared to Asian and Chinese students. The fact that some ethnic groups are able to perform well regardless of poverty seems to indicate that, while poverty may play a role in pupil performance, cultural differences or parental expectations may be more important factors.
Figure 11: % achieving expected GCSE target by income background and ethnicity
0
10
20
30
40
50
60
70
80
90
100
WhiteMixedBlackAsianChinese
richest432poorest
So, how does the performance of these pupils differ in and outside London?
Figure 12 shows that pupils from those backgrounds that tend to do well – Chinese and Asian pupils in particular – do even better in London. In other words, the advantage these pupils have over other ethnic groups is multiplied if they live in London.

London schooling
�1
Figure 12: % achieving expected GCSE target by ethnicity
0
10
20
30
40
50
60
70
80
90
100
London non-London
WhiteMixedBlack ChineseAsian
For example, 71 per cent of Chinese pupils achieve five or more good GCSE’s including English and maths – but the figure for London is 77 per cent. White pupils, of whom only 50 per cent achieve this GCSE measure, only do marginally better in London, meanwhile.
English as a second languageAnother unique feature of London is its proportion of pupils that speak English as a second language. Unsurprisingly, London stands out in this respect, with 30 per cent of its pupils having a first language other than English, compared with only 10% in the country as a whole. Breaking down attainment at Key Stage 4 by English as a first and second language reveals that those for whom English is the native tongue perform, on average, slightly less well than those who speak English as a second language, although it should be noted that the difference is only slight.
Again, looking at how those in London perform compared with those in the rest of the country reveals a significant improvement in the equality of outcomes of these pupils (see figure 13) at Key Stage 4.

London schooling
��
Figure 13: % achieving five or more GCSEs including English and maths
0
10
20
30
40
50
60
non-LondonLondon
English is second language
English is first language
But perhaps those with English as a second language perform less well at reading and writing, given English is not their native tongue. Figure 14 shows some evidence of this – those with English as a first language score on average 1.6 points higher in reading assessment at Key Stage 1 than those with English as a second language. Similarly reading, maths and science scores for those whose first language is English are between one and two points higher than those with English as a second language. However, the gap between performance of those with and without English as a second language is narrower in London than outside, as figure 14 shows.

London schooling
��
Figure 14: additional points scored by pupils with English as a first language at key stage 1
0.5
1.0
1.5
2.0totalnon-LondonLondon
MathsWritingReadingScience
Diff
eren
ce in
po
ints
GenderAs is well-known there are important differences in school attainment by gender. In particular, girls tend to score more highly than boys in school tests, particularly as they get older. At Key Stage 4, regardless of measure examined, girls perform better than boys.
One reason London may do better overall than outside London is that, for whatever reason, London provides a better schooling environment for either boys or girls. Figure 15 shows little evidence of this – the gap between males and females is similar whether in or outside London. However, whilst differences are very slight, females are (statistically significantly) more likely to obtain an English baccalaureate in London than outside it (by roughly two percentage points). The academic performance of males, on the other hand, is no better in London than outside.
We can further split these results by ethnic group and extent of poverty, with a view to understanding whether there are particular differences by gender, ethnicity and poverty in or

London schooling
��
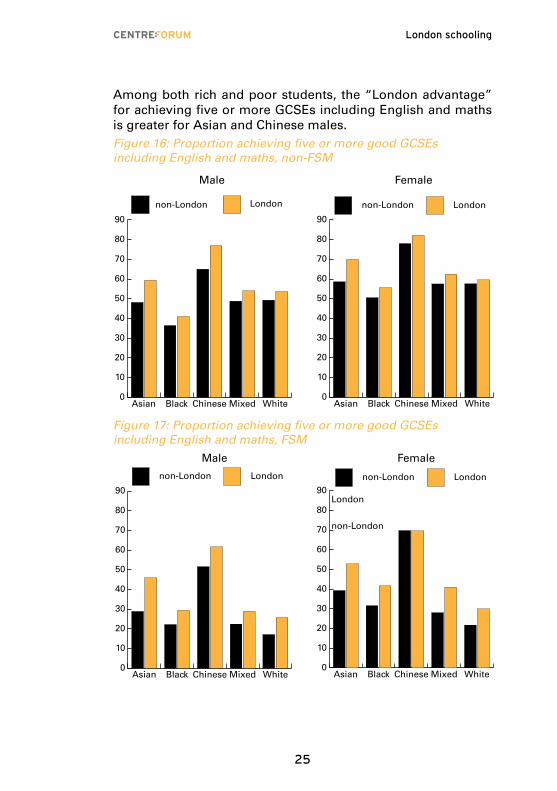
outside London. Figures 16-17 show this for our GCSE measure. We can see that females of all ethnicities do better than males of the same FSM status both in and outside London, and that pupils of both genders and all ethnic groups perform better in London than outside.
We can also see that performance of white students is far more highly correlated with their FSM status. Poor white males and females perform worst, while Chinese males and females perform best, largely regardless of their FSM status. Indeed, poor Chinese males and females actually out-perform white male and female pupils from better off, non-FSM backgrounds.
These results support recent comments by the schools commissioner, Liz Sidwell, that “White working-class” communities pose one of the greatest challenges to Michael Gove’s education reforms.6
6 J Vasagar, ‘Education chief identifies white working-class pupils as big challenge’, The Guardian, 23rd September 2011.
Figure 15: Proportion achieving 5 or more good GCSEs including English and maths, and English baccalaureate, by gender
Pro
po
rtio
n o
f p
up
ils
0
10
20
30
40
50
60
FemaleMale
Londonnon-LondonLondonnon-London
5+ GCSEs A-C* inc English & maths
English baccalaureate
London schooling
��
Among both rich and poor students, the “London advantage” for achieving five or more GCSEs including English and maths is greater for Asian and Chinese males.Figure 16: Proportion achieving five or more good GCSEs including English and maths, non-FSM
0
10
20
30
40
50
60
70
80
90
Londonnon-London
WhiteMixedChineseBlackAsian0
10
20
30
40
50
60
70
80
90London
non-London
WhiteMixedChineseBlackAsian
0
10
20
30
40
50
60
70
80
90London
non-London
WhiteMixedChineseBlackAsian0
10
20
30
40
50
60
70
80
90London
non-London
WhiteMixedChineseBlackAsian
Londonnon-London
Male Female
Male Female
Londonnon-London
Londonnon-London
Figure 17: Proportion achieving five or more good GCSEs including English and maths, FSM
0
10
20
30
40
50
60
70
80
90
Londonnon-London
WhiteMixedChineseBlackAsian0
10
20
30
40
50
60
70
80
90London
non-London
WhiteMixedChineseBlackAsian
0
10
20
30
40
50
60
70
80
90London
non-London
WhiteMixedChineseBlackAsian0
10
20
30
40
50
60
70
80
90London
non-London
WhiteMixedChineseBlackAsian
Londonnon-London
Male Female
Male Female
Londonnon-London
Londonnon-London

London schooling
��
School typeAside from pupil characteristics, there are many school characteristics that may set London apart from other regions. Perhaps the most important is school-type. Looking at the breakdown of school-types in the NPD (figure 18), London has a disproportionately high number of pupils at academies (eight per cent, compared to five per cent in the rest of the UK), and a disproportionately low number of pupils studying in community schools (37 per cent, compared to 47 per cent in the rest of the UK) while both London and non-London regions have similar proportions of other school types including foundation schools, independent schools, voluntary aided schools and special schools – see figure 18.
Figure 18: Proportion of pupils by schooltype
0 20 40 60 80 100
otherspecialschool/PRU
voluntary aided/controlled
foundationschoolacademies
communityschools
London
non-London
Proportion of pupils
So, how does the mix of schools affect London’s overall performance? Figures 19 and 20 show that there are significant differences in the academic outcomes of pupils at Key Stage 4 depending on which school type they attend, and which measure we examine. For the measure of five GCSE’s including English and maths, the best performing schools are voluntary aided, foundation schools and community schools – which tend to do well both in and outside London. But there are some differences in the performance of other school types. Most notably, academies in London perform better than those outside London.
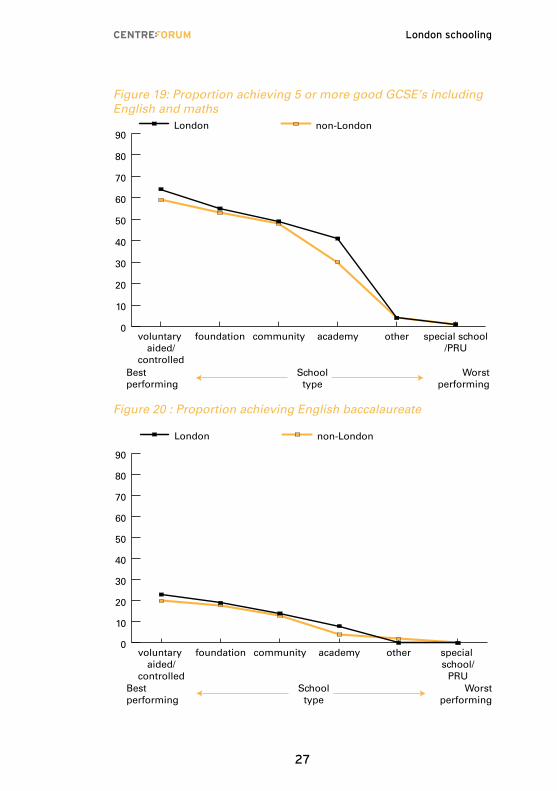
London schooling
��
Figure 19: Proportion achieving 5 or more good GCSE’s including English and maths
0
10
20
30
40
50
60
70
80
90non-LondonLondon
special school/PRU
otheracademycommunityfoundationvoluntary aided/
controlledSchool
typeBestperforming
Worstperforming
Figure 20 : Proportion achieving English baccalaureate
0
10
20
30
40
50
60
70
80
90
specialschool/
PRU
otheracademycommunityfoundationvoluntary aided/
controlledSchool
typeBestperforming
Worstperforming
non-LondonLondon

London schooling
��
These results, however, must be treated with caution. In particular, the results of pupils at academy schools may be biased downwards on average, since (historically) academies were created to take-over failing schools.
School fundingFinally, we consider the role of funding. Under the current system, local authorities are responsible for allocating funds to schools in the state sector. Information on the amount of funding given to schools, plus any funding that schools themselves raise (for example, through donations) is available from the Department of Education.7 Since local authorities are able to decide on funding themselves through their own formulae, there is currently no centralised formula – though the government is currently consulting on the possibility of introducing such a formula.8
Figure 22 shows per-head funding allocated to schools by local authority, and self-generated funds (the latter making up only a very small percentage of total funding, typically) in 2009, averaged by region for simplicity. The figure clearly shows that London schools have access to a greater volume of funding per pupil than other regions. However it is wrong to conclude from this that schools in London are ‘better off’ than those in the rest of the country. Schools in the capital have to pay higher teacher salaries and many of their other costs are higher than for schools elsewhere in the country. It is very difficult to compare what schools in London receive and spend with what schools outside London spend.
7 See www.education.gov.uk/schools/adminandfinance/financialmanagement/b0072409/background
8 ‘National formula ‘to fund England’s state schools’, BBC News Online, 13th November 2010.

London schooling
��
Figure 22 : Per pupil funding by region, England, 2009
0 1,000 2,000 3,000 4,000 5,000 6,000 7,000 8,000
Yorkshire
South West
East Midlands
West Midlands
South East
West Midlands
North West
East of England
North East
London
per pupil funding (£)
Source: Department for Education
Notes: Figures include primary, secondary and special schoolsThere have been many academic studies, however, which have examined the relationship between school resources and pupil performance. A review of some 400 studies finds little evidence of a strong or consistent link between pupil performance and school resources, after pupil background characteristics are taken into account.9
Figure 23 attempts to show this - plotting pupil performance (in the form of five good GCSEs with English and maths) against funding, this time by local authority.
As is evident, there appears to be no obvious relationship between per pupil funding and attainment.
9 A Hanusheck, ‘Assessing the effects of school resources on pupil performance: an update’, Educational evaluation and policy analysis, June 20, 1997 vol. 19 no. 2 141-164.

London schooling
�0
Figure 23 : Per pupil funding by pupil performance at Key Stage 4
4000 6000 8000 10000 120000
10
20
30
40
50
60
70
% o
f p
up
ils g
ain
ing
5 +
go
od
GC
SE
s
per pupil funding
So, whilst it is important to treat school funding data with caution, it is also important to consider the impact of this variable alongside the other inputs described. In the next section, we estimate a model of pupil performance, controlling for school funding (in this case, at Local Authority, rather than school level), as well as the other inputs mentioned in Section 4.

London schooling
�1
5. How does London compare with the rest of the country, once pupil and school characteristics are controlled for?
How do important differences in pupil and school characteristics impact London’s overall attainment, compared to the rest of the UK? As we are now considering many more explanatory factors, it is necessary to use a regression format to take account of the differences between London and the UK. In Table 1, we present some regression output, in each case with the variable of interest being the proportion of pupils obtaining five or more good GCSEs including English and maths and proportion of pupils obtaining the English baccalaureate, and the explanatory variable of interest being performance in London (versus the rest of the UK). In these regressions we control for pupil income background (using quintile of IDACI rank and FSM status), pupil ethnicity, pupil speaking English as a foreign language, pupil gender and per-pupil funding at local authority level.
So for example, for the Key Stage 4 measure of five or more GCSEs including English and maths, the regression output shows that being in London is associated with a 11 percentage point increase in the probability of obtaining five or more GCSEs, holding constant all other explanatory variables. Similarly, being in London is associated with a seven percentage point increase in the probability of gaining the English baccalaureate.
This means, for example, that in a class of 30 pupils with average attainment of around 50 per cent achieving five good GCSEs, ‘being in London’ is associated with a 11 percentage point increase in the proportion of the class achieving this goal – which equates to three extra pupils.
:

London schooling
��
The other explanatory variables can be interpreted in a similar way, and are highly statistically significant.
Looking first at poverty, we can see that being in the poorest fifth has a dramatic effect on GCSE attainment, reducing a pupil’s probability of obtaining five GCSEs by 35 percentage points – compared to those in the richest fifth of pupils. The reduction in probability of obtaining five GCSEs falls by less and less as pupils become richer.
In terms of ethnic group, the omitted category is white pupils, meaning all results are as compared to white pupils. The results show that all ethnic groups do better than white pupils, holding equal other explanatory factors, with the probability of obtaining five good GCSEs particularly high for Chinese and Asian pupils. Pupils with English as a second language are less likely to do well, while females are more likely to obtain five good GCSEs than males to the tune of eight percentage points.
Table 1: Regression output, London versus rest of England at key stage 4
(5) (6)
VARIABLESKS4 (5 GCSEs inc Eng, mat)
KS4 (English baccalaureate)
London 0.11*** 0.07***
(0.00) (0.00)
fsm -0.19*** -0.07***
(0.00) (0.00)
Poverty quintile (omitted category: richest)
first quintile (poorest) -0.35*** -0.21***
(0.00) (0.00)
second quintile -0.28*** -0.17***
(0.00) (0.00)
third quintile -0.18*** -0.12***
(0.00) (0.00)
fourth quintile -0.09*** -0.06***
(0.00) (0.00)

London schooling
��
ethnic group (omitted category: white)
Other 0.08*** 0.03***
(0.01) (0.00)
Asian 0.15*** 0.06***
(0.00) (0.00)
Black 0.04*** -0.02***
(0.00) (0.00)
Chinese 0.24*** 0.19***
(0.01) (0.01)
Mixed 0.05*** 0.02***
(0.00) (0.00)
Female 0.08*** 0.05***
(0.00) (0.00)
English is second language -0.03*** -0.01***
(0.00) (0.00)
Funding per head 0.00*** 0.00
(0.00) (0.00)
Constant 0.62*** 0.23***
(0.00) (0.00)
Observations 603,810 603,810
R-squared 0.13 0.06
Standard errors in parentheses
*** p<0.01, ** p<0.05, * p<0.1
The results are reassuringly similar for the English baccalaureate measure of performance. It is interesting that per-pupil funding, however, has only a very small positive impact on pupil performance (there are not sufficient decimal places to show this), indicating that it is particularly difficult to measure the impact of school funding.
It is important to note that these results still hold when pupils’ attainment at key stage 1 is controlled for - suggesting that it is not the case that students in London are more intelligent or better academically prepared than pupils in other regions (see Appendix 1).

London schooling
��
6. Regional disparities within London
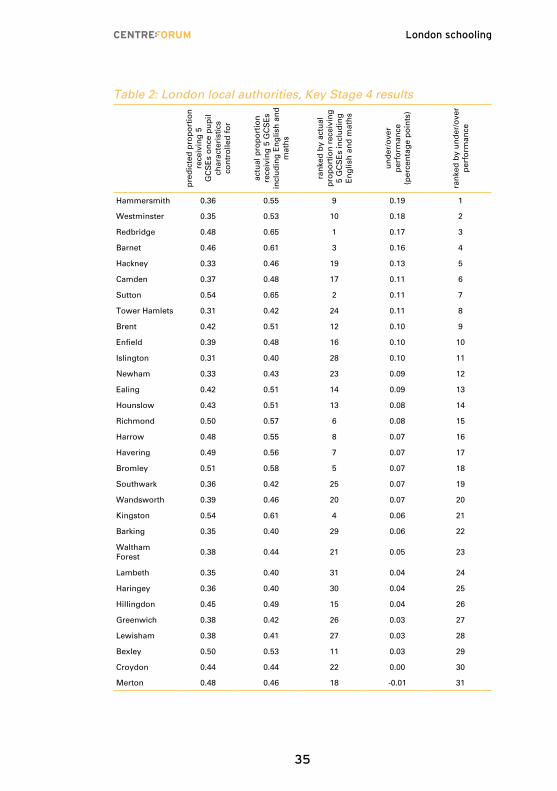
As mentioned, a recent article in the Financial Times showed that certain Local Authorities in the UK perform better than others in terms of GCSE attainment. In particular, poor pupils (defined in the article as being of FSM status) were found to perform particularly well at GCSE level in boroughs such as Newham, Redbridge, Westminster and Camden, whilst boroughs in the North West of England, such as Knowsley, did badly.
In Table 2, we investigate this further, ranking Local Authorities in London in terms of raw pupil attainment of five or more GCSE’s including English and maths.
In the highest performing boroughs of Redbridge, Barnet, Sutton and Kingston, around 60 per cent or more of pupils attain five or more GCSEs including English and maths. We can predict how these boroughs should perform, accounting for their pupil and characteristics (in other words, how each borough would do if it performed just as well as the average student of that type, for the whole of London). We can then estimate how well or badly boroughs perform given the mix of pupils and schools in the area.10
So for example, Newham is one of the lowest performing boroughs for this measure of Key Stage 4, ranked 23rd in London, out of 31. But Newham has an above-average proportion of poor pupils compared to the rest of London (as well as differences in many other explanatory factors). Once this is taken into account, we can see that Newham over-performs compared to how it should, and in fact it moves up to 12th in the rankings once this is accounted for. Conversely, we can see that Merton is one of the more underperforming boroughs in London – although in fact it performs only slightly less well than it should do.
10 Note, for the purposes of this exercise, we exclude local authorities with fewer than five state schools
:
London schooling
��
Table 2: London local authorities, Key Stage 4 results
pre
dic
ted
pro
po
rtio
n
rece
ivin
g 5
G
CS
Es
on
ce p
up
il
char
acte
rist
ics
con
tro
lled
fo
r
actu
al p
rop
ort
ion
re
ceiv
ing
5 G
CS
Es
incl
ud
ing
En
glis
h a
nd
m
ath
s
ran
ked
by
actu
al
pro
po
rtio
n r
ecei
vin
g
5 G
CS
Es
incl
ud
ing
E
ng
lish
an
d m
ath
s
un
der
/ove
r p
erfo
rman
ce
(per
cen
tag
e p
oin
ts)
ran
ked
by
un
der
/ove
r p
erfo
rman
ce
Hammersmith 0.36 0.55 9 0.19 1
Westminster 0.35 0.53 10 0.18 2
Redbridge 0.48 0.65 1 0.17 3
Barnet 0.46 0.61 3 0.16 4
Hackney 0.33 0.46 19 0.13 5
Camden 0.37 0.48 17 0.11 6
Sutton 0.54 0.65 2 0.11 7
Tower Hamlets 0.31 0.42 24 0.11 8
Brent 0.42 0.51 12 0.10 9
Enfield 0.39 0.48 16 0.10 10
Islington 0.31 0.40 28 0.10 11
Newham 0.33 0.43 23 0.09 12
Ealing 0.42 0.51 14 0.09 13
Hounslow 0.43 0.51 13 0.08 14
Richmond 0.50 0.57 6 0.08 15
Harrow 0.48 0.55 8 0.07 16
Havering 0.49 0.56 7 0.07 17
Bromley 0.51 0.58 5 0.07 18
Southwark 0.36 0.42 25 0.07 19
Wandsworth 0.39 0.46 20 0.07 20
Kingston 0.54 0.61 4 0.06 21
Barking 0.35 0.40 29 0.06 22
Waltham Forest
0.38 0.44 21 0.05 23
Lambeth 0.35 0.40 31 0.04 24
Haringey 0.36 0.40 30 0.04 25
Hillingdon 0.45 0.49 15 0.04 26
Greenwich 0.38 0.42 26 0.03 27
Lewisham 0.38 0.41 27 0.03 28
Bexley 0.50 0.53 11 0.03 29
Croydon 0.44 0.44 22 0.00 30
Merton 0.48 0.46 18 -0.01 31

London schooling
��
7. How did London get ahead?
We have seen that pupils in London perform better at Key Stage 4 – the end of the compulsory schooling period – than pupils outside London, after taking into account individual and school characteristics.
The next question is at which age in a pupil’s academic career does the London advantage emerge? If pupils in London begin their school careers at a similar stage to the rest of England, but then gradually begin to outperform those outside London, then this could be taken as evidence that London schools are responsible for the gap in performance. On the other hand, if pupils in London are always academically more able than those outside London, this could be taken as evidence that it is the pupils themselves (or their parents) that are responsible for the London advantage.
In Section 3 we saw that, after taking into account the relative poverty of the London population, and calculating the average scores of pupils within poverty percentile, London pupils performed better than those outside London at Key Stage 4. Figure 21 now replicates this analysis for Key Stages 1-3.
Figures 24-26 show that, at the early stages of education, pupils in London appear to perform similarly to those in the rest of the UK for all income groups – there appears to be no gap in performance at all. But by Key Stage 2 (age 11), a small gap begins to appear between London and outside. By Key Stage 3, this gap has stabilised and London is clearly ahead. It is interesting to note that pupils from all income groups appear to do better in London, with a parallel increase in attainment for both richer and poorer pupils London versus the rest of the UK. In each case, these results are statistically significant at the five per cent level (see Appendix 1), with each region of the UK scoring significantly less than London (regardless of measure) after controlling for income.
:

London schooling
��
This, then, appears to support the hypothesis that London schools are responsible for the superior academic performance of pupils in London, since they appear to enter the schooling system on an equal basis.
Figure 24: pupil key stage 1 score, by percentile of income deprivation
-0.6
-0.5
-0.4
-0.3
-0.2
-0.1
0.0
0.1
0.2
0.3
0.4
0.5
0.6non-London
London
99806040200
Pro
po
rtio
n o
f p
up
ils
non-LondonLondon
Figure 25: pupil key stage 2 score, by percentile of income deprivation
-0.6
-0.5
-0.4
-0.3
-0.2
-0.1
0.0
0.1
0.2
0.3
0.4
0.5
0.6 non-London
London
99806040200
Pro
po
rtio
n o
f p
up
ils
non-LondonLondon
London schooling
��
Figure 26: pupil key stage 3 score, by percentile of income deprivation
-0.6
-0.5
-0.4
-0.3
-0.2
-0.1
0.0
0.1
0.2
0.3
0.4
0.5
0.6 non-London
London
99806040200
Pro
po
rtio
n o
f p
up
ils
non-LondonLondon
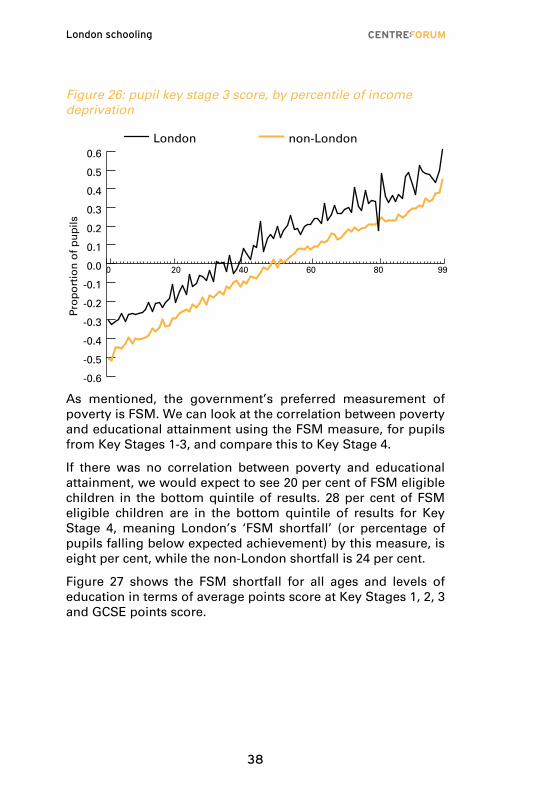
As mentioned, the government’s preferred measurement of poverty is FSM. We can look at the correlation between poverty and educational attainment using the FSM measure, for pupils from Key Stages 1-3, and compare this to Key Stage 4.
If there was no correlation between poverty and educational attainment, we would expect to see 20 per cent of FSM eligible children in the bottom quintile of results. 28 per cent of FSM eligible children are in the bottom quintile of results for Key Stage 4, meaning London’s ‘FSM shortfall’ (or percentage of pupils falling below expected achievement) by this measure, is eight per cent, while the non-London shortfall is 24 per cent.
Figure 27 shows the FSM shortfall for all ages and levels of education in terms of average points score at Key Stages 1, 2, 3 and GCSE points score.
London schooling
��
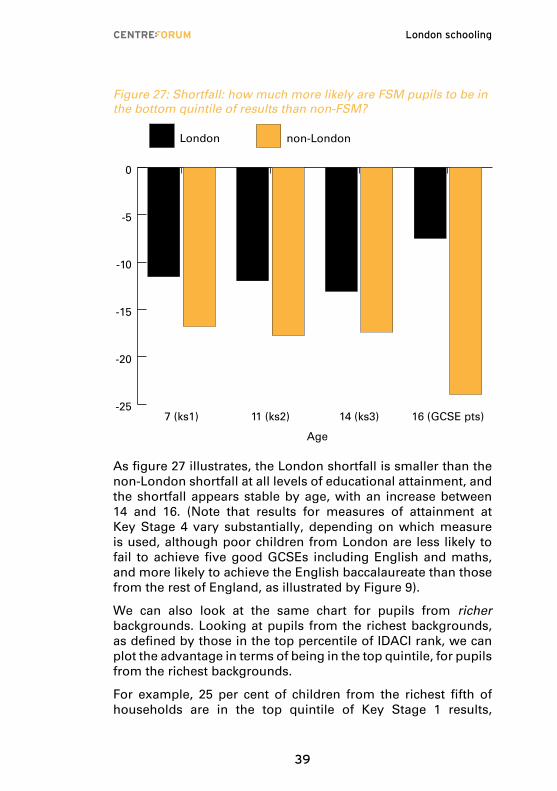
Figure 27: Shortfall: how much more likely are FSM pupils to be in the bottom quintile of results than non-FSM?
-25
-20
-15
-10
-5
0
non-LondonLondon
16 (GCSE pts)14 (ks3)11 (ks2)7 (ks1)
Age
As figure 27 illustrates, the London shortfall is smaller than the non-London shortfall at all levels of educational attainment, and the shortfall appears stable by age, with an increase between 14 and 16. (Note that results for measures of attainment at Key Stage 4 vary substantially, depending on which measure is used, although poor children from London are less likely to fail to achieve five good GCSEs including English and maths, and more likely to achieve the English baccalaureate than those from the rest of England, as illustrated by Figure 9).
We can also look at the same chart for pupils from richer backgrounds. Looking at pupils from the richest backgrounds, as defined by those in the top percentile of IDACI rank, we can plot the advantage in terms of being in the top quintile, for pupils from the richest backgrounds.
For example, 25 per cent of children from the richest fifth of households are in the top quintile of Key Stage 1 results,

London schooling
�0
meaning London’s advantage for well-off pupils (or percentage of pupils achieving more than expected) by this measure, is five per cent, while the non-London advantage is four per cent.
It is apparent that pupils from rich backgrounds do better in London, and also that the advantage gained from being in London appears to increase with age. This, combined with the evidence presented in figures 24-26 is plausible evidence that London pupils increase their advantage over pupils outside London over time.
Figure 28: Outperformance: how much more likely are pupils from the top fifth of income to be in the top quintile of results than other pupils?
0
5
10
15
20
25
30
non-LondonLondon
16 (gcse pts)14 (ks3)11 (ks2)7 (ks1)
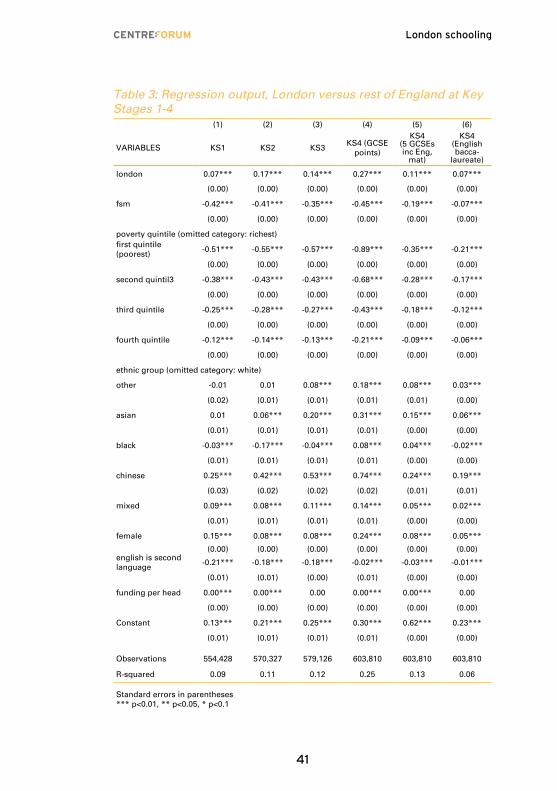
Finally, in this section, we repeat the regression analysis carried out in Section 5, for Key Stages 1-3. The results are presented in Table 3.
London schooling
�1
Table 3: Regression output, London versus rest of England at Key Stages 1-4 (1) (2) (3) (4) (5) (6)
VARIABLES KS1 KS2 KS3KS4 (GCSE
points)
KS4 (5 GCSEs inc Eng,
mat)
KS4 (English bacca-
laureate)
london 0.07*** 0.17*** 0.14*** 0.27*** 0.11*** 0.07***
(0.00) (0.00) (0.00) (0.00) (0.00) (0.00)
fsm -0.42*** -0.41*** -0.35*** -0.45*** -0.19*** -0.07***
(0.00) (0.00) (0.00) (0.00) (0.00) (0.00)
poverty quintile (omitted category: richest)first quintile (poorest)
-0.51*** -0.55*** -0.57*** -0.89*** -0.35*** -0.21***
(0.00) (0.00) (0.00) (0.00) (0.00) (0.00)
second quintil3 -0.38*** -0.43*** -0.43*** -0.68*** -0.28*** -0.17***
(0.00) (0.00) (0.00) (0.00) (0.00) (0.00)
third quintile -0.25*** -0.28*** -0.27*** -0.43*** -0.18*** -0.12***
(0.00) (0.00) (0.00) (0.00) (0.00) (0.00)
fourth quintile -0.12*** -0.14*** -0.13*** -0.21*** -0.09*** -0.06***
(0.00) (0.00) (0.00) (0.00) (0.00) (0.00)
ethnic group (omitted category: white)
other -0.01 0.01 0.08*** 0.18*** 0.08*** 0.03***
(0.02) (0.01) (0.01) (0.01) (0.01) (0.00)
asian 0.01 0.06*** 0.20*** 0.31*** 0.15*** 0.06***
(0.01) (0.01) (0.01) (0.01) (0.00) (0.00)
black -0.03*** -0.17*** -0.04*** 0.08*** 0.04*** -0.02***
(0.01) (0.01) (0.01) (0.01) (0.00) (0.00)
chinese 0.25*** 0.42*** 0.53*** 0.74*** 0.24*** 0.19***
(0.03) (0.02) (0.02) (0.02) (0.01) (0.01)
mixed 0.09*** 0.08*** 0.11*** 0.14*** 0.05*** 0.02***
(0.01) (0.01) (0.01) (0.01) (0.00) (0.00)
female 0.15*** 0.08*** 0.08*** 0.24*** 0.08*** 0.05***
(0.00) (0.00) (0.00) (0.00) (0.00) (0.00)english is second language
-0.21*** -0.18*** -0.18*** -0.02*** -0.03*** -0.01***
(0.01) (0.01) (0.00) (0.01) (0.00) (0.00)
funding per head 0.00*** 0.00*** 0.00 0.00*** 0.00*** 0.00
(0.00) (0.00) (0.00) (0.00) (0.00) (0.00)
Constant 0.13*** 0.21*** 0.25*** 0.30*** 0.62*** 0.23***
(0.01) (0.01) (0.01) (0.01) (0.00) (0.00)
Observations 554,428 570,327 579,126 603,810 603,810 603,810
R-squared 0.09 0.11 0.12 0.25 0.13 0.06
Standard errors in parentheses*** p<0.01, ** p<0.05, * p<0.1

London schooling
��
In this case, for Key Stages 1-3, and for GCSE points at Key Stage 4, points scores are standardized so that they are in comparable units.
So for example, for Key Stage 1, Table 3 shows that being in London (versus being outside London) is positively associated with 0.07 standard deviations increase in test scores. Since the standard deviation of Key Stage 1 results is 3.43, this means that living in London is associated with 0.24 extra points at Key Stage 1. The results for Key Stages 2-4 are 2.83, 2.68 and 6.04. Again this seems to indicate that pupils are relatively equal at Key Stage 1 in and outside London, but that the gap emerges at Key Stage 2 and continues through Key Stage 4. While this analysis should not be interpreted as causal (i.e. we cannot say that simply being in London causes pupils to perform better academically) this evidence nevertheless shows that there is a significant correlation between being in London and pupil attainment at all ages, which exists regardless of poverty, ethnicity, first language, gender and school type, and that the advantage increases with age, giving some evidence that schools are driving this result.
As previously discussed, we also run this model with the inclusion of pupil test score results at Key Stage 1. This is to control for underlying ability of pupils (although, of course, this control is not ideal since pupils are aged seven when they take this test) to test the hypothesis that students in London are of higher innate ability than those in the rest of the country, and this is driving the results. In fact we find the coefficient on London to be positive and significant, and of a similar magnitude, suggesting this is not the case. See Appendix 1 for details.

London schooling
��
8. Getting the UK reading
In testing the hypothesis of whether education in London schools is poor, we have discovered that being in London is actually associated with better outcomes than being outside of London. However, it is important to examine whether there may be particular areas in which pupils in London – or indeed the rest of the country – perform poorly.
In 2011 the London Evening Standard launched its “Get London Reading” campaign in response to the worrying statistic that one in four children in London’s primary schools leave without being able to read.11 Therefore, it is of interest to examine the reading attainment of London pupils.
Reading scores are available at Key Stage 1, when pupils are aged seven. The average reading point score for pupils in England and Wales is 15.7, while pupils in London score, on average, 15.21, suggesting London pupils are not particularly disadvantaged compared to other regions in terms of their reading ability at age seven.
Again, after controlling for the variables described above, Table 5 shows that London performs well in terms of reading. Here, the control variables are not shown for reasons of simplicity, and reading points score are in their raw, unstandardized form.
11 G Greig, ‘Get London reading’, Evening Standard campaign, details at getlondonreading.vrh.org.uk/
:
London schooling
��
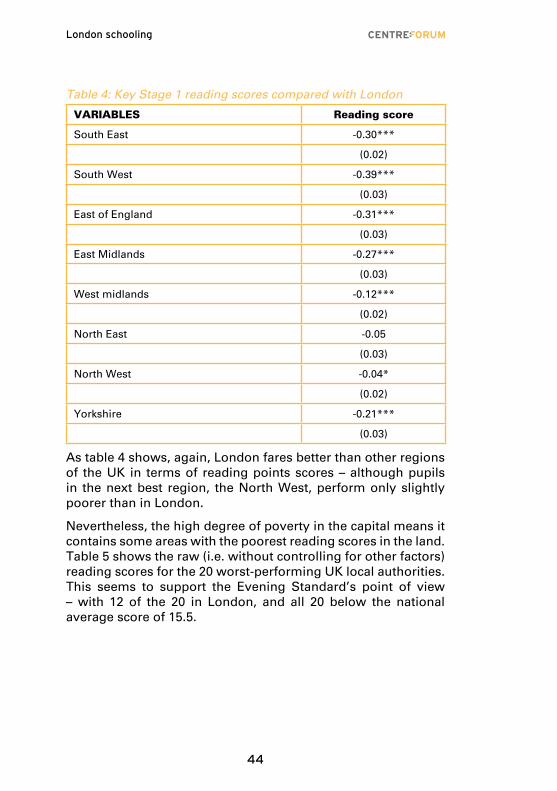
Table 4: Key Stage 1 reading scores compared with London
VARIABLES Reading score
South East -0.30***
(0.02)
South West -0.39***
(0.03)
East of England -0.31***
(0.03)
East Midlands -0.27***
(0.03)
West midlands -0.12***
(0.02)
North East -0.05
(0.03)
North West -0.04*
(0.02)
Yorkshire -0.21***
(0.03)
As table 4 shows, again, London fares better than other regions of the UK in terms of reading points scores – although pupils in the next best region, the North West, perform only slightly poorer than in London.
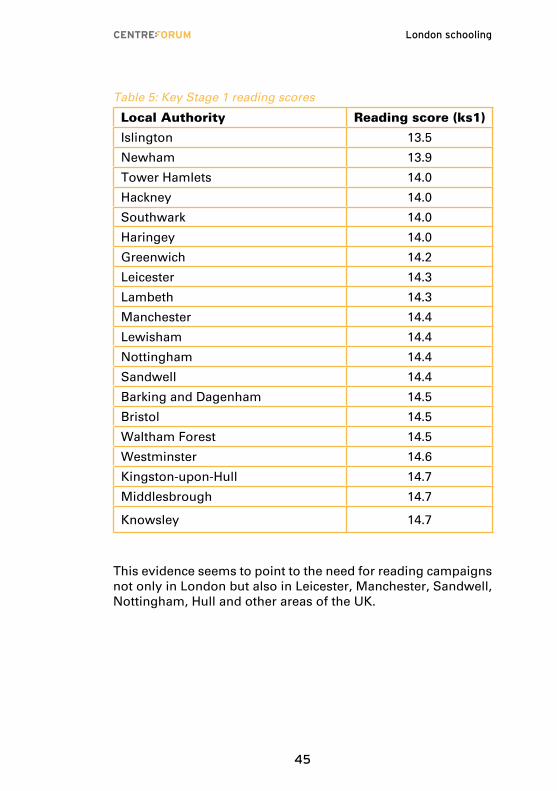
Nevertheless, the high degree of poverty in the capital means it contains some areas with the poorest reading scores in the land. Table 5 shows the raw (i.e. without controlling for other factors) reading scores for the 20 worst-performing UK local authorities. This seems to support the Evening Standard’s point of view – with 12 of the 20 in London, and all 20 below the national average score of 15.5.
London schooling
��
Table 5: Key Stage 1 reading scores
Local Authority Reading score (ks1)
Islington 13.5
Newham 13.9
Tower Hamlets 14.0
Hackney 14.0
Southwark 14.0
Haringey 14.0
Greenwich 14.2
Leicester 14.3
Lambeth 14.3
Manchester 14.4
Lewisham 14.4
Nottingham 14.4
Sandwell 14.4
Barking and Dagenham 14.5
Bristol 14.5
Waltham Forest 14.5
Westminster 14.6
Kingston-upon-Hull 14.7
Middlesbrough 14.7
Knowsley 14.7
This evidence seems to point to the need for reading campaigns not only in London but also in Leicester, Manchester, Sandwell, Nottingham, Hull and other areas of the UK.
London schooling
��
9 Conclusions and discussion
This paper highlights the gaps in the educational performance of pupils in the UK by region, ethnic group and other characteristics. It reveals in particular that pupils in London appear to perform particularly well compared to those in other regions of the country.
1. There are striking differences in the academic attainment of pupils, depending on their individual circumstances. For example, pupils from the most deprived areas nationwide are significantly less likely to achieve the expected outcome measures at school than those from richer households. Similarly there are striking gaps in performance between pupils from different ethnic backgrounds, with Chinese and Asian pupils tending to out perform black and white British pupils. It is therefore very important to take account of the differences in pupil and school characteristics (where possible) when comparing the performance of pupils across regions. Furthermore, this evidence underlies the case for a pupil premium, directing money towards pupils from the poorest areas.
2. Pupils in London are more likely to be among the poorest in England and Wales, and are also more likely to be from non white ethnic backgrounds and less likely to speak English as their first language.
3. Taking these measures into account we predict that London outcomes would be much worse. They are not. This means that pupils from London perform better than those from the rest of the country, at most ages and levels of attainment.
4. Pupils in London appear to perform similarly well at Key Stage 1, the first year of compulsory schooling, and then
:

London schooling
��
pull away from their non-London counterparts at Key Stage 2, with the gap remaining constant, or increasing at Key Stage 4. This may be evidence that London’s schools are responsible for the relatively good performance of the city’s pupils.
It is important to note, however, that while the dataset used in this analysis provides extensive coverage of pupil performance, there may be many other observable or unobservable characteristics that could affect pupils or schools in London differently to those in the rest of the UK.
What could be responsible for the relatively good performance of schools in London?
There are many potential explanations that centre on teachers, schools and pupils themselves. For example, given the large pool of graduates in London compared to the rest of the UK, teacher quality may be driven upwards by strong competition for teaching jobs in London. Teacher quality may also be driven up if teachers’ wages in London are higher than in the rest of the country, thus attracting better quality teachers to London (see Dolton and Marcenaro-Gutierrez for an analysis of the link between teacher pay and pupil performance).12 The latter seems like an unlikely explanation however – since teacher pay is set at a national level meaning teachers in London are paid relatively poorly compared with the rest of the UK. Alternatively, given that schools in London are, on average, better funded than the rest of the UK, this may enable them to equip themselves with better facilities and smaller class sizes (see Angrist and Lavy for an analysis of the relationship between class size and pupil performance).13 But, as previously stated, the higher cost of equipment and teachers in London casts doubt on this explanation. Or perhaps the explanation lies not with teacher quality or schools, but with pupils themselves. For example, pupils in London may have higher expectations than those of pupils in the rest of the UK – perhaps due to the greater mix of pupils of different ethnicities or income groups in London schools (see Gibbons, Silvo and Weinhardt for an analysis of
12 P Dolton & O Marcenaro-Gutierrez, ‘Teachers’ pay and pupil performance’, Centre for Economic Performance, CentrePiece Autumn 2011
13 J Angrist & D Lavy ‘Using Maimonides’ rule to estimate the effect of class size on scholastic achievement’, The Quarterly Journal of Economics (1999) 114 (2): 533-57.

London schooling
��
neighbours’ characteristics and prior achievements on teenage pupils’ educational and behavioural outcomes).14
Finally, it may be the case that Government initiatives directed at London, have been responsible for London’s apparent advantage. One such initiative is the ‘London Challege’, a school improvement programme that was established in 2003 to boost outcomes in low-performing secondary schools in the capital. The programme offered these schools support from education experts, including mentoring by current head teachers and extended coaching at ‘teaching schools’. Whilst establishing a link between the London Challenge and the results found in this analysis is not attempted in this paper, work by Ofsted found that since the introduction of the London Challenge, secondary schools in London have performed better than schools in the rest of England.15 (This confirms the findings of the present paper.) The results of the programme seem to indicate that policies aimed at creating good teachers and good leaders are very important for success in education.
What lessons can be learnt from the capital?
Whilst further research is clearly needed to fully explore the reasons behind the educational success of schools in London, it is clear that there is much to be proud of in London – particularly in boroughs such as Hackney, Tower Hamlets and Newham which are responsible for educating some of the poorest children in the country, and in which pupils over-perform relative to their backgrounds – and much that other areas could take lessons from.
In some boroughs of the UK, the proportion of poor pupils achieving the GCSE target is as little as half of that for equivalently poor pupils in London. With lessons to be learnt and young lives to be improved, these boroughs would do well to study the education system in London.
14 S Gibbons, O Silvo & F Weindhart, ‘Everybody needs good neighbours? Evidence from students’ outcomes in England’, IZA Discussion Paper No. 5980.
15 Ofsted, ‘London Challenge’, No 100192, December 2010.

London schooling
��
Appendix – regressions controlling for prior attainment of students (at Key Stage 1)
(1) (2) (3) (4) (5) (6)
VARIABLES KS1 KS2 KS3KS4 (GCSE
points)
KS4 (5 GCSEs inc Eng & maths)
KS4 (English bacc)
London 0.07*** 0.13*** 0.11*** 0.24*** 0.10*** 0.07***
(0.00) (0.00) (0.00) (0.00) (0.00) (0.00)
Observations 554,428 547,444 542,464 554,428 554,428 554,428
R-squared 0.09 0.60 0.44 0.49 0.31 0.14
Standard errors in parentheses
*** p<0.01, ** p<0.05, * p<0.1
Note: models include all controls as described in Table 3 with the addition of pupil key stage 1 score, with the exception of column 1.
: