london market target operating model (tom)
TRANSCRIPT

London Market Target Operating Model (TOM)LMA presentation
August 2015

LONDON MARKET TARGET OPERATING MODEL (TOM)02
Executive Summary
● The London Market seeks to move from a model with many inefficiencies and frictional costs to one that enables an efficient and accessible market comprising one touch data capture and enhanced central services
● To manage this transition, a multi-year TOM programme has been established and the programme is currently halfway through a Discovery Phase
● Work completed to date includes: articulation of the vision for the future operating model, identification of 15 TOM initiatives (comprising in-flight and new programmes) and development of high-level business requirements, a proposed governance model and a Stakeholder Engagement Plan
● Services will deliver £350m of benefits over 5 years - these benefits, are driven by cost savings from straight-through processing for underwriting, claims and delegated authority
● Quantified benefits do not include other expected benefits, including new business generated due to increased ease of doing business, international services, improved customer experience, broker benefits due to faster claims processing and greater ability to track claims, savings through better risk management and better fund management to delegated authority
● Implementation costs are expected to be around £250m, equating to c.0.1% of London Market annual premiums. A cost / benefit tool is being developed to help individual organisations understand what TOM means to them
● A proposed centralised governance structure will oversee infrastructure projects and ongoing services, including managing the prioritisation and phasing of projects. Programmes will be subject to formal stage gates to review progress, gain approval to proceed and receive additional funding
● This governance model will draw upon the expertise, best practices and knowledge of market practitioners and existing Market bodies
● Discovery Phase stage 2 activities include completing project documentation for prioritised initiatives, starting to establish the governance structure and continuing to engage with the market to refine the plans and approach as further detail becomes available
TOM overview
Costs and benefits
Governance and next steps
CEOs / COOs of London Market organisations will play a key role in making Market modernisation a success. This document is intended to provide you with the latest information on the TOM programme so that you can update your stakeholders. Further details will be shared after stage 2 of the Discovery Phase.
Purpose

TOM Overview02

LONDON MARKET TARGET OPERATING MODEL (TOM)04
‘London Matters’ highlighted the threat to London’s position as the undisputed global centre for commercial (re)insurance
The London Market is the largest global centre for commercial and specialty risk and is in a great position of strength
These challenges are recognised by the Market and there is acceptance of the need to change
An inflexible business servicing model that is inefficient and slow to change, reducing
London’s competitiveness
LONDONContinued investment in making the Market more
accessible and efficient
Increasing retention of risk in high growth developing markets
Financial strength ratings reaffirmed, outlook revised to positive
Higher acquisition costs make London a more expensive market to deal with than
its competitors
Continued focus on our collective vision and goals
However, the world is changing which is challenging London’s position

LONDON MARKET TARGET OPERATING MODEL (TOM)05
The London Market seeks to move from a model with many inefficiencies and frictional costs to one that enables an efficient and accessible market of choice
Inefficient and paper based
Inflexible
Fragmented
One touch data capture
Enhanced central services
Highly effective and accessible
Economies of scale for common activities
Enhanced data sets
Design Principle
Service HubMessage HubCustomer
InteractionsCarrier
Interactions
Coverholder/Service
Company/TPA
Policyholder
Local Broker &
A
pproved Broker
CarrierRegulators &Tax Authoritie
s
Customer
Services
e-PlacingServices
DataServices
CarrierServices
BrokerServices
DocumentRepository
ClaimsServices
BureauServices
Target Operating ModelCurrent Operating Model

LONDON MARKET TARGET OPERATING MODEL (TOM)06
The new model will deliver benefits for Managing Agents, brokers and their customers
Increased confidence in consistency of standards
and service
Access to integrated shared services in London reducing
duplication, unnecessary costs & barriers to entry for new territories
Enhanced customer services through a faster and simplified
claims process
Ability to send and receive data using global standards enabling straight-through-processing and
improved efficiency
Direct access to Central Services to provide far more clarity around
the status of the claims and access to placement documentation
(with broker approval)
Central MI and analytics providing Managing Agents with rich data
to enhance decision making capabilities and minimising
reporting burden
Contract certainty at the point of bind with any queries raised far
earlier in the process
Reduced turnaround times and complexity for Coverholder approvals making the market
more attractive
Rather than expending so much time and expense on administration, the new TOM will make it easier to access the London market as well as provide Managing Agents with improved data and enhanced Central Services.
Policyholders
Managing Agents
Benefits

LONDON MARKET TARGET OPERATING MODEL (TOM)07
The future operating model will be delivered through 15 TOM initiatives - each TOM initiative has a project brief and indicative timeline
Key messages
Fifteen TOM initiatives
● 15 TOM initiatives have been identified to deliver the enhanced central services and realise the benefits of straight-through processing. For each initiative, project briefs and indicative timelines have been developed
● Of these initiatives, 5 are in-flight – CSRP1, PPL2, IMR Re-Platform3, New MAT environment4 and Electronic Claims File enhancement
● An additional 9 initiatives have been identified to deliver the TOM objectives. These include claims, data, and delegated authority. In addition, a governance and delivery initiative will establish programme oversight and management
● To deliver the TOM, 7 of these new initiatives have been prioritised and stage 2 of the Discovery Phase will involve further developing project documentation for these initiatives
In flight Prioritised Wave 2 Re-assigned into other initiatives
TOM initiatives
IMR3 replacement
Local Shared Services
Electronic Claims File
enhancement
Claims – Core Services
& systems
CSRP1
New MAT4 environment
Complaints management
PPL2
Settlement
Data & Reporting
Governance & Delivery
Data Integration
Delegated Authority
Additional CSRP
Customer Portal
1 CSRP = Central Services Refresh Programme2 PPL = Placing Platform Limited3 IMR = Insurers’ Market Repository4 MAT = Market Acceptance Testing

LONDON MARKET TARGET OPERATING MODEL (TOM)08
To quantify benefits, a top-down assessment of the costs and benefits of market modernisation has been completed
Total implementation costs
Total net benefits (2017 – 2020)
Note ● Costs reflect central activities
only and include £44m from existing initiatives
● All costs have been split between Managing Agents (67%) and Company Carriers (33%) with the exception of: - PPL, where 25% is being paid by brokers
- Lloyd’s-only projects, which have been allocated 100% to Managing Agents
● The benefits assume 30% savings on costs for underwriting operations and central services with an incremental increase from 2017 (excludes broker benefits and any year-on-year GWP increase)
Note ● Work on costs and benefits is ongoing. As a result, these numbers may change and the split of benefits will be identified. ● The £350m net benefit is the total benefit over 5 years after deducting additional annual run costs. Implementation costs
are excluded and have been calculated separately.
* Represents upfront payment contribution to PPL. In addition, brokers will contribute 25% to PPL run costs. As with carriers, brokers are expected to incur further direct costs due to back-office system and process upgrades.
Costs split by market participants
Managing Agents Company Carriers Brokers
£190m £59m £1m*
Around
£250m(c.0.1% of 5yr annual premiums)
Estimated
£350m

LONDON MARKET TARGET OPERATING MODEL (TOM)09
The mitigating actions
● All of the London Market Associations are contributing to TOM development and a stakeholder engagement plan has been developed
● Each initiative is being developed by ‘Communities’ comprising subject matter experts from across the market
● Robust and transparent governance process to direct and monitor funding into value-adding initiatives
● A dedicated governance structure will drive transparency, ensure appropriate programme resourcing and establish accountability to maximise chances of success
● The programme will be staffed with full-time experts with appropriate experience to ensure it is professionally run
● There is a strong case for change. A market-wide engagement strategy, governance structures and industry best practice approaches to project management will be used
● The use of certain, non-competitive services will be mandated (Lloyd’s only)
● Enhanced customer services is a key objective and this can be tracked through the governance structure
● Benefits are delivered across the market and implementation and run costs are borne by all participants based on the nature of initiatives and premiums
Potential challenges
Market engagement
Communities
Funding
Governance
Dedicated experts
Professional management
Mandating of services
Value to customer
Shared costs and benefits
Lack of engagement, buy in and support across the Market
Programme lacks capabilities to deliver large scale change
Lack of formal processes and channels to reject initiatives that do not add value to the Market
Low take up of services due to perceived threat to individual competitive advantages
TOM fails to build on previous work or involve market experts
Limited historic success drives change fatigue
Projects are poorly governed, miss key milestones, often deliver late and over budget
Programmes focus on back office processes rather than on adding value to customers
Not all London Market players contribute to the programme
Moving to this model poses a number of potential challenges, we plan to address these with the proposed mitigating actions

● Organisations will need to invest in their own IT and processes to ensure they are able to access the benefits of the new TOM
● The requirements and level of spend have not been estimated centrally due to the variance in business models, technology platforms, degree of offshoring, etc., that severely limits the ability to do such an exercise with any degree of accuracy. However, we are providing a tool for market participants to calculate their own costs and benefits
● We have completed a high level design and impact assessment and will be moving into a more detailed design phase shortly. This will provide market participants with further detail on expected local changes required
● The Associations will be reaching out to market participants to support working groups to develop business requirements as part of stage 2 and beyond
● Whilst specific resource requirements have not been agreed, each market participant may require a TOM Lead that will be the direct liaison to the TOM
● Further resources may be required for change management and IT. The number of resources will depend on the size of the organisation and the size and complexity of any local change required
● For TOM to succeed it needs to be embraced by the London Market. The CEO / COO community are key change agents that can help to raise awareness across the market, develop buy-in and momentum to ensure that the programme succeeds
● We are employing a broad communications strategy to ensure we communicate to all stakeholders across the London Market through the most suitable channel to maximise awareness
● We also ask that you feed back any comments you have on this pack to ensure we are delivering what the market wants
To maximise the benefits of TOM, engagement and some local investment and resources from market participants will be required
Local investment
Resource allocation
Awareness

LONDON MARKET TARGET OPERATING MODEL (TOM)11
iAppendix
TOM costs and benefits

LONDON MARKET TARGET OPERATING MODEL (TOM)12
The contribution to TOM implementation costs has been estimated based on the nature of initiatives and the relative size of London Market businesses
This estimated cost split is based on the nature of initiatives and the relative size of London Market businesses:
● £190m – Managing Agents - Implementation cost of Lloyd’s-only initiatives - 41% of implementation and run cost of PPL - 67% of the implementation cost for remaining initiatives
● £59m – Company Carriers - 34% of PPL implementation and run cost - 33% of the implementation cost for non Lloyd’s-only initiatives
● £1m – Brokers - Brokers are currently contributing to the costs of PPL (25% of implementation and annual run costs) as they will primarily obtain benefits from this initiative.
- Brokers are expected to incur further direct costs due to back-office system and process upgrades
Total implementation costs (£m) Key messages
Note: Work on costs and benefits is ongoing. As a result, these numbers may change and the split of benefits will be identified and is subject to Board approvals.
74
74
Lloyd’s only
1
1
Brokers
IUA
Lloyd’s
In flight New Initiatives Total
28
15
44
88
132
44
190
250
59
LONDON MARKET TARGET OPERATING MODEL (TOM)13
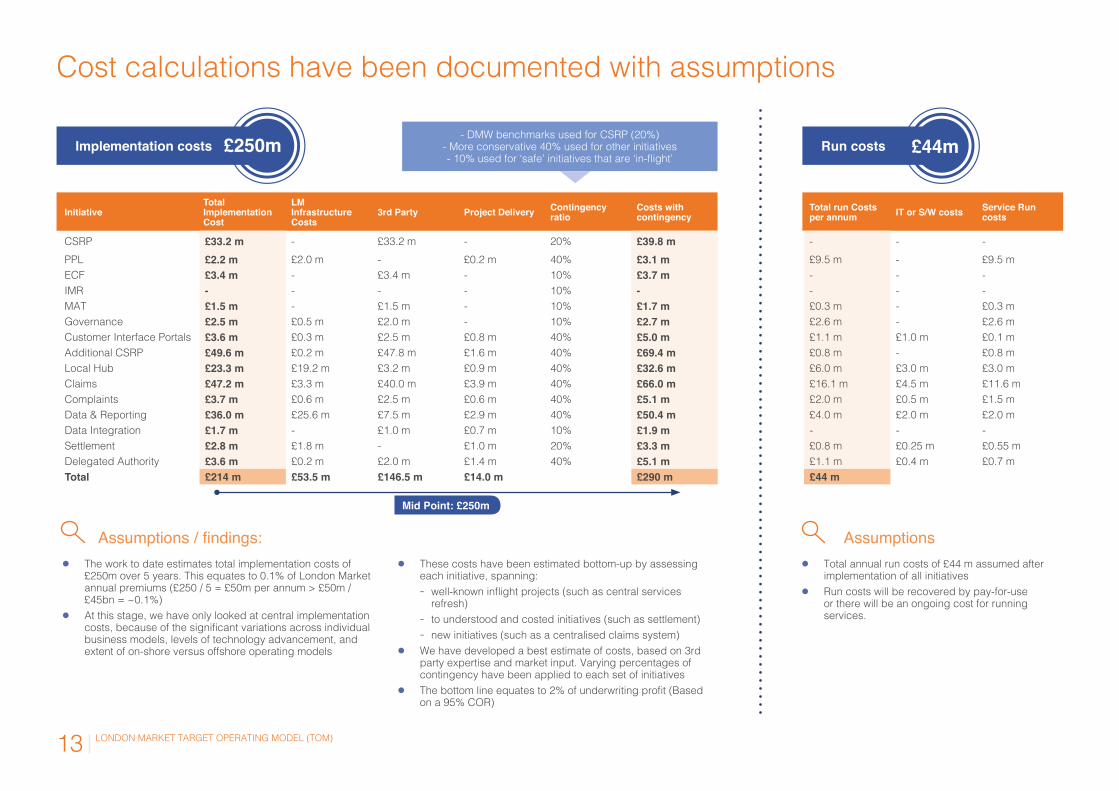
Cost calculations have been documented with assumptions
Mid Point: £250m
- DMW benchmarks used for CSRP (20%)- More conservative 40% used for other initiatives - 10% used for ‘safe’ initiatives that are ‘in-flight’
Implementation costs Run costs £44m£250m
InitiativeTotal Implementation Cost
LM Infrastructure Costs
3rd Party Project Delivery Contingency ratio
Costs with contingency
Total run Costs per annum IT or S/W costs Service Run
costs
CSRP £33.2 m - £33.2 m - 20% £39.8 m - - -PPL £2.2 m £2.0 m - £0.2 m 40% £3.1 m £9.5 m - £9.5 mECF £3.4 m - £3.4 m - 10% £3.7 m - - -IMR - - - - 10% - - - -MAT £1.5 m - £1.5 m - 10% £1.7 m £0.3 m - £0.3 mGovernance £2.5 m £0.5 m £2.0 m - 10% £2.7 m £2.6 m - £2.6 mCustomer Interface Portals £3.6 m £0.3 m £2.5 m £0.8 m 40% £5.0 m £1.1 m £1.0 m £0.1 mAdditional CSRP £49.6 m £0.2 m £47.8 m £1.6 m 40% £69.4 m £0.8 m - £0.8 mLocal Hub £23.3 m £19.2 m £3.2 m £0.9 m 40% £32.6 m £6.0 m £3.0 m £3.0 mClaims £47.2 m £3.3 m £40.0 m £3.9 m 40% £66.0 m £16.1 m £4.5 m £11.6 mComplaints £3.7 m £0.6 m £2.5 m £0.6 m 40% £5.1 m £2.0 m £0.5 m £1.5 mData & Reporting £36.0 m £25.6 m £7.5 m £2.9 m 40% £50.4 m £4.0 m £2.0 m £2.0 mData Integration £1.7 m - £1.0 m £0.7 m 10% £1.9 m - - -Settlement £2.8 m £1.8 m - £1.0 m 20% £3.3 m £0.8 m £0.25 m £0.55 mDelegated Authority £3.6 m £0.2 m £2.0 m £1.4 m 40% £5.1 m £1.1 m £0.4 m £0.7 mTotal £214 m £53.5 m £146.5 m £14.0 m £290 m £44 m
● The work to date estimates total implementation costs of £250m over 5 years. This equates to 0.1% of London Market annual premiums (£250 / 5 = £50m per annum > £50m / £45bn = ~0.1%)
● At this stage, we have only looked at central implementation costs, because of the significant variations across individual business models, levels of technology advancement, and extent of on-shore versus offshore operating models
● These costs have been estimated bottom-up by assessing each initiative, spanning: - well-known inflight projects (such as central services
refresh) - to understood and costed initiatives (such as settlement) - new initiatives (such as a centralised claims system)
● We have developed a best estimate of costs, based on 3rd party expertise and market input. Varying percentages of contingency have been applied to each set of initiatives
● The bottom line equates to 2% of underwriting profit (Based on a 95% COR)
● Total annual run costs of £44 m assumed after implementation of all initiatives
● Run costs will be recovered by pay-for-use or there will be an ongoing cost for running services.
Assumptions / findings: Assumptions

LONDON MARKET TARGET OPERATING MODEL (TOM)14
● The benefits of £227m are driven from savings on cost of straight through processing of c.30% for Underwriting Operations, c.13% for Claims and c.20% for management of Delegated Authority
● The benefits do not include: - Savings through better risk management and better fund management to delegated authority - New business generated due to ease of doing business for brokers and international expansion - Improved customer experience due to faster processing of claims and ability to track claims
● Expected to realise the savings from Year 3 onwards due to varied uptake rate and project completion ● In year 3: 30%; In year 4: 75%; and year 5: 100% of the net savings of £183 will be realised ● The NPV of the current benefits is calculated by discounting them at the current 5 year UK Gilt rate of 1.6% ● The payback using the net annual benefits will be Year 5
Annual Benefits from Year 5
Total Benefit over 5 years
Benefits Details
Key Details
- =Gross Annual Savings Annual Run Cost Net Annual Savings £227m £44m £183m
TOM services are estimated to deliver net annual savings of £183m
Year 1 2 3 4 5 Total
Benefits Realised 0% 0% 30% 75% 100% Benefits £0m £0m £55m £137m £183m Discounted Benefits £0m £0m £52m £129m £169m £350m
Annual Benefits 183 1.6%Discount Rate

LONDON MARKET TARGET OPERATING MODEL (TOM)15
● There is an £24m straight through processing benefit for the central services in the total net benefits of £183m
● The calculation assumes the running cost of all the initiatives will be through the TOM Central Services ● The new initiatives are expected to increase the annual cost by £44m ● There are savings of £24m expected from the efficiency improvements to central services ● This leads to a increase of £20m towards the TOM Central services cost with the new total cost of £110m
Cost of Operations
Impact on total cost of Central Services
Benefits to Central Services
*Savings are for Brokers and Underwriters
TOM cost of Central Services
Net Annual Savings £183m
Current Central Service Cost £90m Efficiency Savings
central services £24mIncrease in cost due to new initiatives £44m TOM Central
Services Cost £110m
Central Services Savings £24m
Market Players Savings* £159m
The cost of Central Services increases by £20m reflecting additional services less efficiencies in Central Services
-+ =