london borough of barnet: community infrastructure levy
TRANSCRIPT

London Borough of Barnet: Community Infrastructure Levy Viability Review
Prepared for
London Borough of Barnet
December 2019

2
Contents 1 Summary 3 2 Introduction 6 3 Methodology and appraisal approach 15 4 Appraisal assumptions 19 5 Appraisal outputs 31 6 Assessment of appraisal results 32 7 Conclusions and recommendations 64
Appendices Appendix 1 - Policy review Appendix 2 - Residential sales values Appendix 3 - Commercial lettings Appendix 4 - Appraisal results with growth Appendix 5 - Sites details Appendix 6 - Sample appraisal Appendix 7 - Development appraisals
Anthony Lee MRTPI MRICS Senior Director – Development Consulting BNP Paribas Real Estate 5 Aldermanbury Square London EC2V 7BP 020 7338 4061 [email protected] realestate.bnpparibas.com

3
1 Summary 1.1 This report tests the ability of developments to accommodate alternative amounts of Community
Infrastructure Levy (‘CIL’) to the rates contained in the Council’s adopted Charging Schedule alongside policies in the London Borough of Barnet’s Local Plan and other emerging planning policy documents.
1.2 The study takes account of the cumulative impact of the Council’s planning requirements, in line with the requirements of the National Planning Policy Framework (‘NPPF’), the Planning Practice Guidance (‘PPG’) and the Local Housing Delivery Group guidance ‘Viability Testing Local Plans: Advice for planning practitioners’.
Methodology
1.3 The study methodology compares the residual land values of a range of development typologies reflecting the types of developments expected to come forward in the borough over the plan period. The appraisals compare the residual land values generated by those developments (with varying levels of affordable housing and CIL contributions) to a benchmark land value to reflect the existing value of land prior to redevelopment. If a development incorporating the Council’s policy requirements generates a higher residual land value than the benchmark land value, then it can be judged that the site is viable. Following the adoption of policies, developers will need to reflect policy requirements in their bids for sites, in line with requirements set out in the PPG1.
1.4 The study utilises the residual land value method of calculating the value of each development. This method is used by developers when determining how much to bid for land and involves calculating the value of the completed scheme and deducting development costs (construction, fees, finance, sustainability requirements and CIL) and developer’s profit. The residual amount is the sum left after these costs have been deducted from the value of the development, and guides a developer in determining an appropriate offer price for the site.
1.5 The housing and commercial property markets are inherently cyclical and the Council is testing the viability of potential development sites at a time when the market has experienced a period of sustained growth. Forecasts for future house price growth point to continuing growth in mainstream housing markets, although there is a degree of short term uncertainty following the referendum on the UK’s membership of the European Union. We have allowed for this medium term growth over the plan period by running a sensitivity analysis which applies growth to sales values and inflation on costs to provide an indication of the extent of improvement to viability that might result. The assumed growth rates for this sensitivity analysis are outlined in Section 4. It is important to note, however, that our assessment of suggested CIL rates relies on current and not grown appraisal inputs.
1.6 This sensitivity analysis is indicative only, but is intended to assist the Council in understanding the viability of potential development sites on a high level basis, both in today’s terms but also in the future. Some sites may require more detailed viability analysis when they come forward through the development management process due to specific site circumstances that cannot be reflected in an area wide assessment2.
1 Paragraph 018 of the PPG notes that “the cost of fully complying with policy requirements should be accounted for in benchmark land value. Under no circumstances will the price paid for land be relevant justification for failing to accord with relevant policies in the plan’. 2 The Local Housing Delivery Group Guidance ‘Viability Testing Local Plans: Advice for Planning Practitioners’ notes that “the role of the test is not to provide a precise answer as to the viability of every development likely to take place during the plan period. No assessment could realistically provide this level of detail. Some site-specific tests are still likely to be required at the development management stage”.

4
Key findings
1.7 The key findings of the study are as follows:
■ The Council's adopted CIL rates have been in place since 1 May 2013 and there has been no demonstrable adverse impact on the supply of housing land or upon the viability of developments coming forward across the Borough. Since the evidence base for the adopted CIL was prepared, there have been increases to sales values and build costs. Our testing of alternative CIL rates indicates that relatively significant changes could be accommodated without adversely impacting on viability to a sufficient degree to impact on land supply.
■ As a result of indexation, the CIL rates are now circa 50% higher than they were adopted3. The £135 per square CIL rate is now £202 per square metre. The Mayoral CIL also increased from £35 per square metre to £60 per square metre on 1 April 2019 and this is reflected in our appraisals.
Residential rates
■ The proposed CIL rates are summarised in Table 1.7.1. Sales values have increased at a faster rate than build costs since the adopted CIL rates were tested and as a consequence, residential schemes can absorb higher levels of CIL. Sales values in the Golders Green/Hampstead areas are significantly higher than the range in the rest of the borough. Consequently, there is an option to adopt two CIL zones for residential; Zone A – the bulk of the borough and Zone B – Golders Green and Hampstead. The extent to which this two zone approach will yield significant additional income will depend largely on the location of potential development sites; if these are located in Zone A with very few in Zone B, a two zone approach may not be appropriate. Notwithstanding this observation, our testing indicates that developments could absorb an increase from £202 per square metre to £300 per square metre in Zone A and to £350 per square metre in Zone B.
Hotels and student housing
■ Developments of hotels and student housing can viably absorb an increase from the indexed rate of £202 per square metre to a higher charge of £300 per square metre, bringing the rate in line with other residential developments.
Retail
■ Although our appraisals indicate that retail developments could, in principle, viably absorb a higher CIL charge, this sector is seeing significant structural change which could result in surplus space over the medium term. We therefore recommend no changes to the rates, other than to reflect indexation from £135 to £202 per square metre.
B class uses
■ The borough is still seeing losses of B use class floorspace and our testing confirms that new office and industrial development is unlikely to be able to make a significant contribution towards infrastructure. The viability testing shows that a modest contribution of circa £20 per square metre could in principle be applied to B use class developments without significant impact on the likelihood of developments coming forward. However, given continuing losses of B use class floorspace, it is very unlikely that applying CIL to any developments that might come forward would generate any significant contributions to infrastructure.
Other uses
■ Other uses covered by the existing “all other uses” rate in the adopted CIL Charging Schedule (e.g. education, health and related facilities) should continue to attract a nil rate in line with the
3 BCIS All-In Tender Price Index Quarter 4 2012: 224; Quarter 4 2019: 335; change = 49.55%

5
approach adopted by the Mayor for Mayoral CIL.
Proposed rates
■ Our proposed CIL rates are summarised in Table 1.7.1.
Table 1.7.1: Proposed changes to CIL rates
Development type Zone Adopted rate Indexed rate Proposed rate
Residential C3 use class Zone A £135 £202 £300
Zone B4 £135 £202 £350
Hotels, student housing Whole borough £135 £202 £300
Retail Whole borough £135 £202 £202
B use classes Whole borough £0 £0 £20
All other uses Whole Borough £0 £0 £0
■ Our testing indicates that the increase in CIL rates will have a relatively modest impact on
residual land values in most cases. In almost all cases, increases in sales values (in excess of cost increases) will have enhanced the capacity of developments to absorb increased CIL rates. In the isolated cases where a scheme is on the margins of viability where it is not possible to pass the cost of increased CIL rates back to the landowner through a reduction in land value (for example, due to high existing use values), the increase in CIL will have a modest impact on affordable housing levels that can be delivered.
■ The proposed CIL typically amounts to 3.5% to 3.75% of development costs and is therefore not a critical determinant in the viability of developments.
■ Some scenarios (e.g. certain affordable housing percentages) are unviable prior to the application of CIL in the appraisal. There is clearly an important distinction to be drawn between these schemes and those that are viable. Where schemes are viable, the proposed CIL rates are sufficiently modest to ensure that schemes remain viable.
■ There is clearly a need to balance the need to deliver affordable housing with the need to secure contributions to fund community infrastructure that will support development and growth. The Council cannot seek to prioritise securing affordable housing and other Local Plan policies (as summarised in Section 2) to the exclusion of securing funding for infrastructure and vice versa. In our view, the proposed rates strike this balance appropriately.
■ The Council needs to strike a balance between achieving its aim of meeting needs for affordable housing with raising funds for infrastructure, and ensuring that developments generate acceptable returns to willing landowners and willing developers. This study demonstrates that the Council's approach to applying its affordable housing requirements5 ensures that these objectives are balanced appropriately.
4 Golders Green and Hampstead 5 The Council’s strategic 40% affordable housing target is subject to individual scheme viability which in practice means that a range of percentages is delivered up to this target level.

6
2 Introduction 2.1 The Council has commissioned this study to consider the ability of developments in the Borough of
Barnet to accommodate alternative amounts of Community Infrastructure Levy (‘CIL’) to the rates contained in the Council’s adopted Charging Schedule alongside policies in the adopted Core Strategy and other emerging planning policy documents, including the draft New London Plan. The aim of the study is to assess at high level the viability of development typologies representing the types of sites that are expected to come forward to test alternative CIL rates to those in the adopted Charging Schedule.
2.2 In terms of methodology, we adopted standard residual valuation approaches to test the viability of development typologies, including the impact on viability of the Council’s existing planning policies alongside adopted and alternative levels of CIL. However, due to the extent and range of financial variables involved in residual valuations, they can only ever serve as a guide. Individual site characteristics (which are unique), mean that conclusions must always be tempered by a level of flexibility in application of policy requirements on a site by site basis.
2.3 We would highlight that the purpose of this viability study is to assist the Council in understanding changes to the capacity of schemes to absorb CIL and to support any proposed changes to the Charging Schedule through Examination in Public. The Study therefore provides an evidence base to show that the requirements set out within the NPPF, CIL regulations and Planning Practice Guidance are satisfied. The key underlying principle is that charging authorities should use evidence to strike an appropriate balance between the desirability of funding infrastructure from the levy and the potential impact upon the economic viability of development across their area.
2.4 As an area wide study this assessment makes overall judgements as to viability of development within the London Borough of Barnet and does not account for individual site circumstances, which typically only become apparent when an application is submitted. The assessment should not be relied upon for individual site applications. However, an element of judgement has been applied within this study with regard to the individual characteristics of the sites tested. The development typologies tested are based on assessments of likely development capacity and clearly this may differ from the quantum of development in actual planning applications that will come forward. Scheme specific testing may still be required at the point where they come forward.
2.5 This position is recognised within Section 2 of the Local Housing Delivery Group guidance, which identifies the purpose and role of viability assessments within plan-making. This identifies that: “The role of the test is not to give a precise answer as to the viability of every development likely to take place during the plan period. No assessment could realistically provide this level of detail. Some site-specific tests are still likely to be required at the development management stage. Rather, it is to provide high level assurance that the policies within the plan are set in a way that is compatible with the likely economic viability of development needed to deliver the plan”.
Economic and housing market context
2.6 The housing and commercial property markets are inherently cyclical. The downwards adjustment in house prices in 2008/9 was followed by a prolonged period of real house price growth. By 2010 improved consumer confidence fed through into more positive interest from potential house purchasers. However, this brief resurgence abated with figures falling and then fluctuating in 2011 and 2012. The improvement in the housing market towards the end of 2012 continued through into 2013 at which point the growth in sales values improved significantly through to the last quarter of 2014, where the pace of the improvement was seen to moderate and continued to do so in 2015. The UK economy sustained momentum following the result of the UK’s referendum on its membership of the European Union (EU), and as a result the UK housing market surprised many in 2016. The average house price rose 4.5%, which was 0.2% lower than our forecast and ahead of the level recorded in 2015. While first time buyer numbers continued to recover in 2016, overall transaction levels slowed as some home movers and investors withdrew from the market.

7
2.7 The referendum held on 23 June 2016 on the UK’s membership of the EU resulted in a small majority in favour of exit. The immediate aftermath of the result of the vote was a fall in the Pound Sterling to a 31 year low and stocks overselling due to the earnings of the FTSE being largely in US Dollars. As the Pound dropped significantly this supported the stock market, which has since recouped all of the losses seen and is near the all-time highs. We are now in a period of uncertainty in relation to many factors that impact the property investment and letting markets. However in other areas there are tentative signs of improvement and resilience in the market. For example, the International Monetary Fund revised its forecast for UK growth in 2016 on 4 October 2016 from 1.7% to 1.8%, thereby partly reversing the cut it made to the forecast shortly after the referendum (1.9% to 1.7%). However it further trimmed its 2017 forecast from 1.3% to 1.1%, which stood at 2.2% prior to the Referendum.
2.8 Initial expectations were that the better than expected GDP figures would deter the Bank of England Monetary Policy Committee from going ahead with any further or planned interest rate cuts. The Economy slowed slightly from the Q2 figure of 0.7% and the pattern was a slightly unbalanced one with services being the only sector continuing to grow, achieving a rate of 0.8%. The Chancellor, Phillip Hammond, noted at the time that "the fundamentals of the UK economy are strong and today's data show that the economy is resilient". Production increased by 1.6% in the 3 months to February 2017 and manufacturing increased by 2.2% over the same period.
2.9 It was further expected that manufacturing would be bolstered by the fall in the value of the pound; however this failed to materialise. Despite this, the ONS Head of GDP Darren Morgan observed that “the economy grew slightly more in the last three months of 2016 than previously thought, mainly due to a stronger performance from manufacturing”.
2.10 The Office of Budgetary Responsibility’s ‘Economic and fiscal outlook’ report (March 2019) indicates that UK GDP slowed to an annualised rate of 1.2% over the first two quarters of 2019, caused largely by the impact of the fall in sterling feeding through into consumer facing services. In addition, the construction sector saw output fall in the second and third quarters of the year. Growth is forecast to remain at relatively low levels of 1.4% in 2020 and 1.6% in 2021, 2022 and 2023.
2.11 The May 2019 Halifax House Price Index Report identifies that overall prices in the three months to April were 4.2% higher than in the preceding three months. The annual rate of growth was 5%, marginally higher than the 4.3% annual average since 2009. Russell Galley, Halifax Managing Director observed that “the index has seen a weaker pace of growth over the last three years, which is consistent with the easing of transaction volumes and housing market activity reflected in RICS, Bank of England and HMRC figures”.
2.12 This view is shared by the Nationwide Building Society, whose June 2019 release notes a model 0.1% price increase during the previous month and an annual change of 0.5%. Robert Garner, Nationwide’s Chief Economist, comments that the survey “suggests that new buyer inquiries and consumer confidence have remained subdued in recent months. Nevertheless, indicators of housing market activity, such as the number of mortgages approved for house purchase, have remained broadly stable”. However, he balances this by highlighting that, “while healthy labour market conditions and low borrowing costs will provide underlying support, uncertainty is likely to continue to act as a drag on sentiment and activity, with price growth and transaction levels remaining close to current levels over the coming months”. Local Housing Market Context
Local housing market context
2.13 House prices in the London Borough of Barnet have followed recent national trends, with values falling in 2008 to 2009 and recovering over the intervening years, as shown in Figure 2.13.1. Sales volumes fell below historic levels between 2009 and 2011, but have since recovered (see Figure 2.13.2). By March 2017, sales values had increased by 91.7% in comparison to the lowest point in the cycle in April 2009, or 59% higher than the previous peak in November 2007. However, since April 2017, values have fallen back by 5%.

8
Figure 2.13.1: Average sales value in Barnet
Source: Land Registry Figure 2.15.2: Sales volumes in Barnet (sales per month)
Source: Land Registry
2.14 The future trajectory of house prices is currently uncertain, although Savills’ Housing Market Update September 2019 prediction is that is that values are expected to increase over the next five years. Medium term predictions are that properties in mainstream London markets will grow over the period between 2019 and 2023. Savills predict that values in mainstream London markets (i.e. non-prime) will fall by 2% in 2019, remain unchanged in 2020 but will increase by 2.5% in 2021, 1.5% in 2022 and 2.5% in 2023. This equates to cumulative growth of 4.5% between 2019 and 2023 inclusive.
2.15 In common with other Boroughs in London, there are variations in sales values between different parts of Barnet, as shown in Figure 2.15.16. However, the variations in Barnet are far narrower than in some other boroughs in London. Highest sales values are achieved in the Golders Green and Hampstead Garden Suburb areas, while values elsewhere are slightly lower but relatively uniform.
6 Some of the price points in Figure 2.17.1 are for schemes in neighbouring boroughs close to the border with Barnet
280,000
330,000
380,000
430,000
480,000
530,000
580,000
2007‐01
2007‐06
2007‐11
2008‐04
2008‐09
2009‐02
2009‐07
2009‐12
2010‐05
2010‐10
2011‐03
2011‐08
2012‐01
2012‐06
2012‐11
2013‐04
2013‐09
2014‐02
2014‐07
2014‐12
2015‐05
2015‐10
2016‐03
2016‐08
2017‐01
2017‐06
2017‐11
2018‐04
2018‐09
2019‐02
2019‐07
Achieved value
Month
0
100
200
300
400
500
600
700
800
900
1,000
2007‐01
2007‐06
2007‐11
2008‐04
2008‐09
2009‐02
2009‐07
2009‐12
2010‐05
2010‐10
2011‐03
2011‐08
2012‐01
2012‐06
2012‐11
2013‐04
2013‐09
2014‐02
2014‐07
2014‐12
2015‐05
2015‐10
2016‐03
2016‐08
2017‐01
2017‐06
2017‐11
2018‐04
2018‐09
2019‐02
2019‐07
Units sold in
month
Month

9
Figure 2.15.1: Sales values in Barnet (approx. £s per square metre)
Sources: Map – Google; Values – Molior
Private rented sector market context
2.16 The proportion of households privately renting is forecast to increase from under 10% in 1991 to circa 25% by 2021, largely as a result of affordability issues for households who would have preferred to owner occupy7. Over the same period, the proportion of households owner occupying is forecast to fall from 69% to under 60%. These trends are set to continue in the context of a significant disparity between average household incomes and the amounts required to purchase a residential property in the capital.
2.17 Perceived softening of the housing for sale market has prompted developers to seek bulk sales to PRS operators, with significant flows of investment capital into the sector. Investment yields have remained stable in the zones 2 to 4 London market at 3.5% to 4%. PRS housing as an asset class is still emerging and valuation portfolios and development opportunities is difficult in the context of lack of data. As the market matures, more information will become available, facilitating more sophisticated approaches to valuing and appraising PRS developments.
7 Knight Frank PRS Update August 2017
£11,500
£7,300
£6,500
£8,000
£7,000
£6,500
£6,500
10
2.18 The PRS market is still immature and as a consequence there is little data available on management costs and returns that would assist potential entrants into the market. However, viability assessments of schemes brought forward to date confirm that profit margins are lower than build for sale on the basis that a developer will sell all the PRS units in a single transaction to an investor/operator. The income stream is therefore akin to a commercial investment where a 15% profit on GDV is typically sought.
2.19 A reduced profit margin helps to compensate (to some degree) for the discount to market value that investors will seek. PRS units typically transact at discounts of circa 20% of market value on the basis of build to sell.
2.20 On larger developments, PRS can help to diversify the scheme so that the Developer is less reliant on build to sell units. Building a range of tenures will enable developers to continue to develop schemes through the economic cycle, with varying proportions of units being provided for sale and rent, depending on levels of demand from individual purchasers. However, demand for build for rent product will also be affected by the health of the economy generally, with starting and future rent levels more acutely linked to changes in incomes of potential tenants.
National Policy Context
The National Planning Policy Framework
2.21 In March 2012, the old suite of planning policy statements and planning policy guidance was replaced by a single document – the National Planning Policy Framework (‘NPPF’). The NPPF has subsequently been supplemented by the National Planning Practice Guidance (‘NPPG’). In February 2019, the government issued a revised NPPF and amendments to the NPPG were issued in May 2019 and September 2019.
2.22 The 2012 NPPF provided more in-depth guidance on viability of development than Planning Policy Statement 3, which limited its attention to requiring local planning authorities to test the viability of their affordable housing targets. The 2012 NPPF required that local planning authorities have regard to the impact on viability of the cumulative effect of all their planning requirements on viability. Paragraph 173 of the 2012 NPPF required that local planning authorities give careful attention “to viability and costs in plan-making and decision-taking”. The 2012 NPPF required that “the sites and the scale of development identified in the plan should not be subject to such a scale of obligations and policy burdens that their ability to be developed viably is threatened”. After taking account of policy requirements, land values should be sufficient to “provide competitive returns to a willing landowner and willing developer”. The 2019 NPPF places less emphasis on viability and states that “plans should set out the contributions expected from development. This should include setting out the levels and types of affordable housing provision required, along with other infrastructure (such as that for education, health, transport, flood and water management, green and digital infrastructure). Such policies should not undermine the deliverability of the plan” (para 34, emphasis added).
2.23 The meaning of benchmark land value for the purpose of establishing viability in accordance with the NPPF and NPPG has been the subject of considerable debate since the publication of the 2012 NPPF. For the purposes of testing the viability of a Local Plan, the Local Housing Delivery Group8 has concluded that the current use value of a site (or a credible alternative use value) plus an appropriate uplift, represents a competitive return to a landowner. Some members of the RICS consider that a competitive return is determined by market value9, although there is no consensus around this view. The government’s 2019 NPPF removes the requirement for “competitive returns” in the 2012 NPPF and is silent on how landowner returns should be assessed. The September 2019 PPG indicates that viability testing of plans should be based on existing use value plus a landowner premium.
8 Viability Testing Local Plans: Advice for planning practitioners, June 2012 9 RICS Guidance Note: Financial Viability in Planning, August 2012

11
CIL Policy Context
2.24 As of April 2015 (or the adoption of a CIL Charging Schedule by a charging authority, whichever was the sooner), the S106/planning obligations system’ i.e. the use of ‘pooled’ S106 obligations, was limited to a maximum of five S106 agreements. However, changes in the CIL regulations in September 2019 have removed the pooling restrictions, giving charging authorities a degree of flexibility in how they use Section 106 and CIL. The adoption of a CIL charging schedule is discretionary for a charging authority.
2.25 It is worth noting that some site specific S106 obligations remain available for negotiation, however these are restricted to site specific mitigation that meet the three tests set out at Regulation 122 of the CIL Regulations (as amended) and at paragraph 56 of the NPPF, and to the provision of affordable housing.
2.26 The CIL regulations state that in setting a charge, local authorities must strike “an appropriate balance” between revenue maximisation on the one hand and the potentially adverse impact upon the viability of development on the other. The regulations also state that local authorities should take account of other sources of available funding for infrastructure when setting CIL rates. This report deals with viability only and does not consider other sources of funding (this is considered elsewhere within the Council’s evidence base).
2.27 From September 2019, the previous two stage consultation has been amended to require a single consultation with stakeholders. Following consultation, a charging schedule must be submitted for independent examination.
2.28 The payment of CIL becomes mandatory on all new buildings and extensions to buildings with a gross internal floorspace over 100 square metres once a charging schedule has been adopted. The CIL regulations allow a number of reliefs and exemptions from CIL. Firstly, affordable housing and buildings with other charitable uses (if a material interest in the land is owned by the charity and the development is to be used wholly or mainly for its charitable purpose) are subject to relief. Secondly, local authorities may, if they choose, elect to offer an exemption on proven viability grounds. A local authority wishing to offer exceptional circumstances relief in its area must first give notice publicly of its intention to do so. The local authority can then consider claims for relief on chargeable developments from landowners on a case by case basis. In each case, an independent expert with suitable qualifications and experience must be appointed by the claimant with the agreement of the local authority to assess whether paying the full CIL charge would have an unacceptable impact on the development’s economic viability.
2.29 The exemption would be available for 12 months, after which time viability of the scheme concerned would need to be reviewed if the scheme has not commenced. To be eligible for exemption, regulation 55 states that the Applicant must enter into a Section 106 agreement; and that the Authority must be satisfied that granting relief would not constitute state aid. It should be noted however that CIL cannot simply be negotiated away or the local authority decide not to charge CIL.
2.30 CIL Regulation 40 includes a vacancy period test for calculating CIL liability so that vacant floorspace can be offset in certain circumstances. That is where a building that contains a part which has not been in lawful use for a continuous period of at least six months within the last three years, ending on the day planning permission first permits the chargeable development, the floorspace may not be offset.
2.31 The CIL regulations enable local authorities to set differential rates (including zero rates) for different zones within which development would take place and also for different types of development. The CIL Guidance set out in the NPPG (paragraph 022 Reference ID: 25-022-20190901) clarifies that CIL Regulation 13 permits charging authorities to “apply differential rates in a flexible way [including] in relation to geographical zones within the charging authority’s boundary; types of development; and/or scales of development”. Charging Authorities taking this approach need to ensure that such different rates are justified by a comparative assessment of the economic viability of those categories of development. Further the NPPG clarifies that the definition of “use” for this purpose is not tied to the classes of development in the Town and Country Planning Act (Use Classes) Order 1987,

12
although that Order does provide a useful reference point. The NPPG also sets out (paragraph 024 Reference ID: 25-024-20190901) that charging authorities may also set differential rates in relation to, scale of development i.e. by reference to either floor area or the number of units or dwellings.
2.32 The 2010 CIL regulations set out clear timescales for payment of CIL, which are varied according to the size of the payment, which by implication is linked to the size of the scheme. The 2011 amendments to the regulations allowed charging authorities to set their own timescales for the payment of CIL under regulation 69B if they choose to do so. This is an important issue that the Council will need to consider, as the timing of payment of CIL can have an impact on an Applicant’s cashflow (the earlier the payment of CIL, the more interest the Applicant will bear before the development is completed and sold).
2.33 The Government published the findings of the independent CIL review alongside the Housing White Paper in February 2017. The White Paper identified at paragraph 2.28 that the Government “continue to support the existing principle that developers are required to mitigate the impacts of development in their area, in order to make it acceptable to the local community and pay for the cumulative impacts of development on the infrastructure of their area.” The White Paper summarised the main finding of the CIL review to be that “the current system is not as fast, simple, certain or transparent as originally intended.”
2.34 As a result the Government committed to “examine the options for reforming the system of developer contributions including ensuring direct benefit for communities, and will respond to the independent review and make an announcement at Autumn Budget 2017.” Revised regulations came into effect on 1 September 2019 which introduced the following changes:
■ Consultation requirements to be amended to remove the current two stage consultation process and replace this with a single consultation.
■ Removal of the pooling restrictions contained within Regulation 123.
■ Charging authorities will no longer be required to publish a Regulation 123 list.
■ Changes to calculations of chargeable amounts in different cases, including where granting of amended scheme under Section 73 leads to an increased or decreased CIL liability.
■ Removal of provisions which resulted in reliefs being lost if a commencement notice was not served before a developer starts a development. A surcharge will apply in future but the relief will not be lost.
■ Introduction of ‘carry-over’ provisions for a development which is amended by a Section 73 permission, providing the amount of relief does not change.
■ Charging authorities are to be required to publish an annual infrastructure funding statement, setting out how much CIL has been collected and what it was spent on. Similar provisions to be introduced for Section 106 funds.
■ Charging authorities to publish annual CIL rate summaries showing the rates after indexation.
Mayoral CIL
2.35 The Borough is located within Mayoral CIL Zone 2, which attracts a rate of £60 per square metre before indexation10 which will be used for strategic transport infrastructure projects, including Crossrail 2 (a north-east to south-west line) to relieve pressure on existing transport networks.
10 The impact of indexation is discussed in section 6.

13
Borough CIL
2.36 The Council approved its CIL Charging Schedule on 16 April 2013 and it came into effect on 1 May 2013. Table 2.36.1 below summarises the prevailing rates of CIL. The Charging Schedule applies a single rate of £135 per square metre across all residential uses (C1 – C4 and Sui Generis HMOs) and retail floorspace (A1 – A5). A nil rate is applied to all other uses. After applying indexation, the £135 per square metre borough-wide rate has increased to £201.89 per square metre.
Table 2.36.1: CIL rates per net additional square metre in the Charging Schedule
Development type Zone Adopted rate Indexed rate
Residential (C1 – C4, Sui Generis HMOs)
Whole borough £135 £201.89
Retail (A1 – A5) Whole borough £135 £201.89
All other uses Whole Borough £0 £0
Neighbouring borough CIL rates
2.37 Table 2.37.1 summarises the CIL rates adopted by Barnet’s neighbouring charging authorities. All these rates are shown as at the date of implementation and will be subject to indexation over the intervening period (indexed rates shown in italics).
Table 2.37.1: CIL rates in neighbouring charging authorities
Charging authority
Date CS came into effect
Residential rates per square metre Other rates per square metre
Harrow 1/10/2013 £110 (Indexed: £164)
C1, C2 - £55 A1-A5 - £100 Others – Nil
Enfield 1/4/2016 4 zones: £120, £60 and £40. Nil in Meridian Water (Indexed: £148; £74; £49)
A1- A5 £60 Others – Nil
Haringey 1/11/2014 Western zone - £265 (Central £165; Eastern £15) (Indexed: £371; £231; £21)
Supermarkets £95 Retail warehousing £25 Others Nil
Camden 1/4/2015 Highgate/Hampstead £500; central area £150; rest of borough £250 (Indexed: £647; £194; £323)
Office £25 - £45 Student £175 - £400 Hotels £30 - £40
Brent 1/7/2013 Residential (incl student) £200 (Indexed: £299)
Hotels £100 (£150) Retail, offices £40 (£60) Retail warehouse £14 (£21) D2 £5 (£7.50) Others Nil
Hertsmere 1/12/2014 Three zones: £120; £180, nil (Indexed: £155; £233)
Hotel £120 (£155) Older persons hsg £120 (£155) Retail A1 £80 (£103)
Local Policy context
2.38 There are numerous policy requirements that are now embedded in base build costs for schemes in London addressing London Plan requirements, which are mirrored in borough Local Plans (i.e. secure by design, lifetime homes, landscaping, amenity space, internal space standards, car parking, waste storage, tree preservation and protection etc). Therefore it is unnecessary to establish the cost of all these pre-existing policy requirements. Appendix 1 summarises our analysis

14
of the potential impacts of the current Local Plan policies which must be reflected in viability testing undertaken to test the impact of alternative CIL rates.
2.39 In order to assess the ability of schemes to absorb higher CIL rates than those in the adopted Charing Schedule, it is also necessary to factor in the pre-existing requirements in the adopted policies. The affordable housing policy is tested at various percentages, as it has a significant bearing on the viability of developments, even though it has been in place for a considerable period.
2.40 We set out a summary of the policies identified as having cost implications for developments below:
■ Policy CS4 and polices DM08/DM10 which require 40% affordable housing sites providing 10 or more units, or 0.4 hectares or more. The tenure split required is 60% rent and 40% intermediate.
■ For build to rent schemes, we have tested the impact of draft London Plan policy H13 (C) which requires 35% affordable housing, comprising at least 30% of units as London Living Rent with the balance at a range of discounts below market rent and policy H13 (D) which requires the maximum reasonable level of affordable housing on PRS schemes having regard to site-specific viability.
■ For purpose built student housing, we have tested the impact of London Plan policy H17 (A) 4 which requires 35% of units to be provided at affordable rent levels (defined by reference to maximum maintenance loans available to students).
■ For specialist housing for older people (C3 use class), we have tested the impact of London Plan policy H15 B (1) which applies the affordable housing policy approach for general needs housing to this sector.
■ Accessibility standards set out in Policy DM02 and the more recent Policy D5 of the draft New London Plan (at least 10% of dwellings to meet Building Regulations Part M(3) ‘wheelchair accessible dwellings’ and all other dwellings to meet Part M4(2) requirements).
■ Low carbon requirements in Policy DM02 and the more recent draft New London Plan policy SI2 (C) for developments to achieve a 35% reduction on carbon emissions beyond Building Regulations requirements.
Development context
2.41 Barnet is an outer-London borough located in north London. It is the fourth largest borough in London by area (86.7 square kilometres), 28% of which is designated green belt and 8% is metropolitan open land. The borough is bordered by the London boroughs of Haringey, Brent, Harrow, Camden and Enfield and by Hertsmere Borough Council. The borough has numerous transport routes, including both branches of the London Underground Northern Line and mainline trains from central London (Moorgate and St Pancras) providing north-south services. Public Transport Accessibility Levels (‘PTAL’) are highest in Edgware, Brent Cross, Golders Green and Chipping Barnet where PTALs reach levels 5 to 6A, meaning good/excellent, but are as low as 1 (meaning the lowest levels of accessibility) throughout much of the borough.
2.42 The London Plan designates Cricklewood/Brent Cross and Colindale/Burnt Oak as opportunity areas with potential for significant housing provision and new employment. In addition, the borough accommodates and Area of Intensification at Mill Hill East. These areas are expected to deliver over 16,000 new homes by 2026.
2.43 Developments in Barnet range from small in-fill sites to major regeneration schemes. The bulk of development (in terms of volume of units) is expected to come forward on sites in Town Centres and highly accessible locations such as Mill Hill East and around other transport nodes. TfL has recently submitted applications for high density developments around its stations, including Colindale.
2.44 The borough has significant opportunities for development through the recycling of previously developed sites, including vacant and under-utilised buildings, housing estates, office buildings, car parks and surplus public sector land.

15
3 Methodology and appraisal approach 3.1 Our methodology follows standard development appraisal conventions, using locally-based sites and
assumptions that reflect local market and planning policy circumstances. The study is therefore specific to Barnet and reflects the Council’s existing planning policy requirements.
Approach to testing development viability
3.2 Appraisal models can be summarised via the following diagram. The total scheme value is calculated, as represented by the left hand bar. This includes the sales receipts from the private housing (the hatched portion) and the payment from a Registered Provider (‘RP’) (the chequered portion) for the completed affordable housing units. For a commercial scheme, scheme value equates to the capital value of the rental income after allowing for rent free periods and purchaser’s costs. The model then deducts the build costs, fees, interest, planning obligations, CIL and developer’s profit. A ‘residual’ amount is left after all these costs are deducted – this is the land value that the Developer would pay to the landowner. The residual land value is represented by the brown portion of the right hand bar in the diagram.
3.3 The Residual Land Value is normally a key variable in determining whether a scheme will proceed. If a proposal generates sufficient positive land value (in excess of existing use value, discussed later), it will be implemented. If not, the proposal will not go ahead, unless there are alternative funding sources to bridge the ‘gap’.
3.4 Issues with establishing key appraisal variables are summarised as follows:
■ Development costs are subject to national and local monitoring and can be reasonably accurately assessed in ‘normal’ circumstances. In Boroughs like Barnet, many sites will be previously developed. These sites can sometimes encounter ‘exceptional’ costs such as
16
decontamination. Such costs can be very difficult to anticipate before detailed site surveys are undertaken;
■ Assumptions about development phasing, phasing of Section 106 contributions and infrastructure required to facilitate each phase of the development will affect residual values. Where the delivery of the obligations is deferred, the less the real cost to the applicant (and the greater the scope for increased affordable housing and other planning obligations). This is because the interest cost is reduced if the costs are incurred later in the development cashflow; and
■ While Developer’s Profit has to be assumed in any appraisal, its level is closely correlated with risk. The greater the risk, the higher the profit level required by lenders. While profit levels were typically up to around 15% of completed development value at the peak of the market in 2007, banks currently require schemes to show a higher profit to reflect the current risk. Typically developers and banks are targeting around 17-20% profit on value of the private housing element.
3.5 Ultimately, the landowner will make a decision on implementing a project on the basis of return and the potential for market change, and whether alternative developments might yield a higher value. The landowner’s ‘bottom line’ will be achieving a residual land value that sufficiently exceeds ‘existing use value11’ or another appropriate benchmark to make development worthwhile. The margin above existing use value may be considerably different on individual sites, where there might be particular reasons why the premium to the landowner should be lower or higher than other sites.
3.6 Clearly, however, landowners have expectations of the value of their land which often exceed the value of the current use. Ultimately, if landowners’ reasonable expectations are not met, they will not voluntarily sell their land and (unless a Local Authority is prepared to use its compulsory purchase powers) some may simply hold on to their sites, in the hope that policy may change at some future point with reduced requirements. However, the communities in which development takes place also have reasonable expectations that development will mitigate its impact, in terms of provision of community infrastructure, which will reduce land values. It is within the scope of those expectations that developers have to formulate their offers for sites. The task of formulating an offer for a site is complicated further still during buoyant land markets, where developers have to compete with other developers to secure a site, often speculating on increases in value.
Viability benchmark
3.7 The NPPF is not prescriptive on the type of methodology local planning authorities should use when assessing viability. The National Planning Practice Guidance indicates that benchmark land value should be based on existing use value plus a premium to incentivise landowners to release land for development. The premium should provide a “reasonable incentive, in comparison with other options available” (para 014).
3.8 In 2019, the government published a revised NPPF, which indicates at paragraph 34 that “Plans should set out the contributions expected in association with particular sites and types of development. This should include setting out the levels and types of affordable housing provision required, along with other infrastructure (such as that needed for education, health, transport, green and digital infrastructure). Such policies should not make development unviable, and should be supported by evidence to demonstrate this”. The PPG indicates that for the purposes of testing viability, local authorities should have regard to existing use value of land plus a premium to incentivise release for redevelopment.
3.9 The Mayor’s Affordable Housing and Viability SPG focuses on decision making in development management, rather than plan making, but indicates that benchmark land values should be based on existing use value plus a premium which should be “fully justified based on the income generating capacity of the existing use with reference to comparable evidence on rents, which excludes hope value associated with development on the site or alternative uses”.
11 For the purposes of this report, existing use value is defined as the value of the site in its existing use, assuming that it remains in that use. We are not referring to the RICS Valuation Standards definition of ‘Existing Use Value’.

17
3.10 The Local Housing Delivery Group published guidance12 in June 2012 which provides guidance on testing viability of Local Plan policies. The guidance notes that “consideration of an appropriate Threshold Land Value [or viability benchmark] needs to take account of the fact that future plan policy requirements will have an impact on land values and landowner expectations. Therefore, using a market value approach as the starting point carries the risk of building-in assumptions of current policy costs rather than helping to inform the potential for future policy”.
3.11 In light of the weaknesses in the market value approach, the Local Housing Delivery Group guidance recommends that benchmark land value “is based on a premium over current use values” with the “precise figure that should be used as an appropriate premium above current use value [being] determined locally”.
3.12 The examination on the Mayor of London’s first CIL charging schedule considered the issue of an appropriate land value benchmark. The Mayor had adopted existing use value, while certain objectors suggested that ‘Market Value’ was a more appropriate benchmark. The Examiner concluded that:
“The market value approach…. while offering certainty on the price paid for a development site, suffers from being based on prices agreed in an historic policy context.” (paragraph 8) and that “I don’t believe that the EUV approach can be accurately described as fundamentally flawed or that this examination should be adjourned to allow work based on the market approach to be done” (paragraph 9).
3.13 In his concluding remark, the Examiner points out that “the price paid for development land may be reduced [so that CIL may be accommodated]. As with profit levels there may be cries that this is unrealistic, but a reduction in development land value is an inherent part of the CIL concept. It may be argued that such a reduction may be all very well in the medium to long term but it is impossible in the short term because of the price already paid/agreed for development land. The difficulty with that argument is that if accepted the prospect of raising funds for infrastructure would be forever receding into the future. In any event in some instances it may be possible for contracts and options to be re-negotiated in the light of the changed circumstances arising from the imposition of CIL charges. (paragraph 32 – emphasis added).
3.14 It is important to stress, therefore, that there is no single threshold land value at which land will come forward for development. The decision to bring land forward will depend on the type of owner and, in particular, whether the owner occupies the site or holds it as an asset; the strength of demand for the site’s current use in comparison to others; how offers received compare to the owner’s perception of the value of the site, which in turn is influenced by prices achieved by other sites. Given the lack of a single threshold land value, it is difficult for policy makers to determine the minimum land value that sites should achieve. This will ultimately be a matter of judgement for each planning authority.
3.15 Respondents to consultations on planning policy documents in other authorities in London have made various references to the RICS Guidance on ‘Viability in Planning’ (2012) and have suggested that councils should run their analysis on market values. This would be an extremely misleading measure against which to test viability, as market values should reflect existing policies already in place, and would consequently tell us nothing as to how future (as yet un-adopted) policies might impact on viability. It has been widely accepted elsewhere that market values are inappropriate for testing planning policy requirements. The 2019 PPG cautions that prices paid for sites may be misleading measures of site value “due to different assumptions and methodologies used by individual developers, site promoters and landowners” when deciding how much to bid (para 014).
3.16 Relying upon historic transactions is a fundamentally flawed approach, as offers for these sites will have been framed in the context of current planning policy requirements, so an exercise using these transactions as a benchmark would tell the Council nothing about the potential for sites to absorb as
12 Viability Testing Local Plans: Advice for planning practitioners, Local Housing Delivery Group, Chaired by Sir John Harman, June 2012. Although this guidance was published well before the 2019 PPG the approach it advocates for establishing benchmark land value is entirely consistent with the PPG.

18
yet unadopted policies. Various Local Plan inspectors and CIL examiners have accepted the key point that Local Plan policies and CIL will ultimately result in a reduction in land values, so benchmarks must consider a reasonable minimum threshold which landowners will accept. For local authority areas such as Barnet, where the vast majority of sites are previously developed, the ‘bottom line’ in terms of land value will be the value of the site in its existing use. This fundamental point is recognised by the RICS at paragraph 3.4.4. of their Guidance Note on ‘Financial Viability in Planning”:
“For a development to be financially viable, any uplift from current use value to residual land value that arises when planning permission is granted should be able to meet the cost of planning obligations while ensuring an appropriate Site Value for the landowner and a market risk adjusted return to the developer in delivering that project (the NPPF refers to this as ‘competitive returns’ respectively). The return to the landowner will be in the form of a land value in excess of current use value”.
3.17 The Guidance goes on to state that “it would be inappropriate to assume an uplift based on set percentages … given the diversity of individual development sites”. The guidance does not recognise, however, that it is possible to determine an uplift based on site-specific circumstances.
3.18 Commentators also make reference to ‘market testing’ of benchmark land values. This is another variant of the benchmarking advocated by respondents outlined at paragraph 3.15. These respondents advocate using benchmarks that are based on the prices that sites have been bought and sold for. There are significant weaknesses in this approach which none of the respondents who advocate this have addressed. In brief, prices paid for sites are a highly unreliable indicator of their actual value, due to the following reasons:
■ Transactions are often based on bids that ‘take a view’ on squeezing planning policy requirements below target levels. This results in prices paid being too high to allow for policy targets to be met. If these transactions are used to ‘market test’ CIL rates, the outcome would be unreliable and potentially highly misleading.
■ Historic transactions of housing sites are often based on the receipt of grant funding, which is no longer available in most cases.
■ There would be a need to determine whether the developer who built out the comparator sites actually achieved a profit at the equivalent level to the profit adopted in the viability testing. If the developer achieved a sub-optimal level of profit, then any benchmarking using these transactions would produce unreliable and misleading results.
■ Developers often build assumptions of growth in sales values into their appraisals, which provides a higher gross development value than would actually be achieved today. Given that our appraisals are based on current values, using prices paid would result in an inconsistent comparison (i.e. current values against the developer’s assumed future values). Using these transactions would produce unreliable and misleading results.
3.19 These issues are evident from a recent BNP Paribas Real Estate review of evidence submitted in viability assessments where the differences between the value ascribed to developments by applicants and the amounts the sites were purchased for by the same parties. The prices paid exceeded the value of the consented schemes by between 52% and 1,300%.
3.20 For the reasons set out above, the approach of using current use values is a more reliable indicator of viability than using market values or prices paid for sites, as advocated by certain observers. Our assessment follows this approach, as set out in Section 4.
19
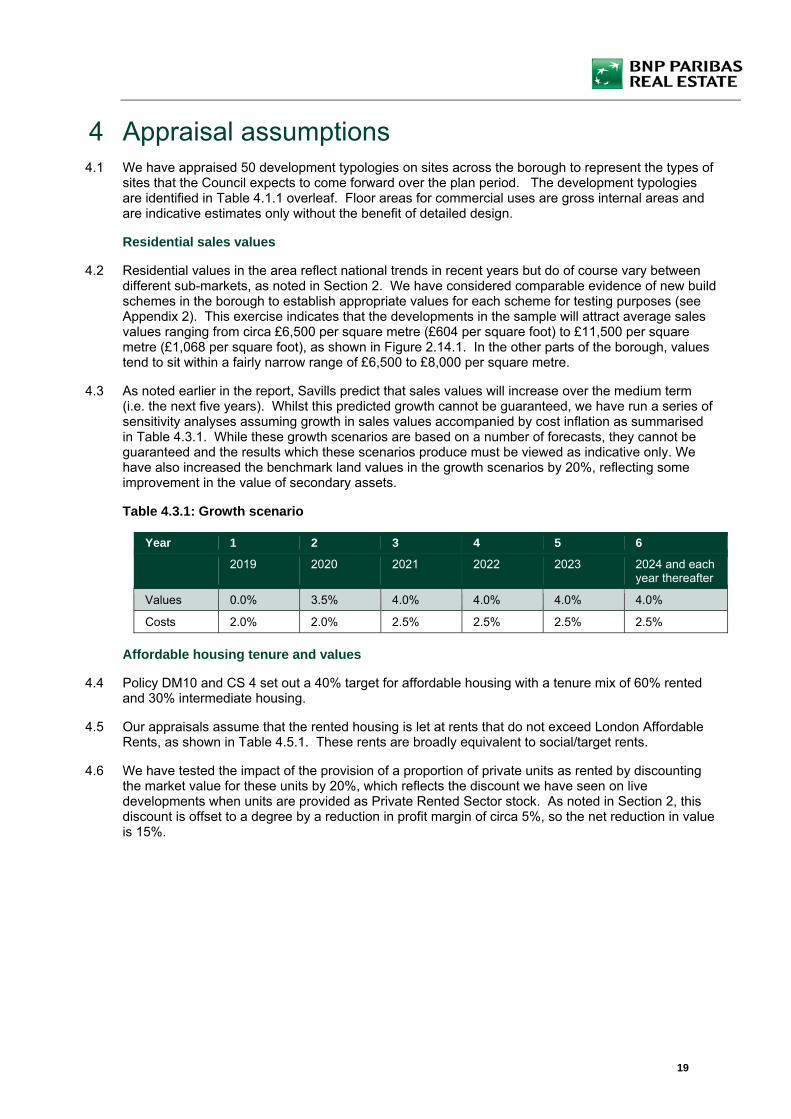
4 Appraisal assumptions 4.1 We have appraised 50 development typologies on sites across the borough to represent the types of
sites that the Council expects to come forward over the plan period. The development typologies are identified in Table 4.1.1 overleaf. Floor areas for commercial uses are gross internal areas and are indicative estimates only without the benefit of detailed design.
Residential sales values
4.2 Residential values in the area reflect national trends in recent years but do of course vary between different sub-markets, as noted in Section 2. We have considered comparable evidence of new build schemes in the borough to establish appropriate values for each scheme for testing purposes (see Appendix 2). This exercise indicates that the developments in the sample will attract average sales values ranging from circa £6,500 per square metre (£604 per square foot) to £11,500 per square metre (£1,068 per square foot), as shown in Figure 2.14.1. In the other parts of the borough, values tend to sit within a fairly narrow range of £6,500 to £8,000 per square metre.
4.3 As noted earlier in the report, Savills predict that sales values will increase over the medium term (i.e. the next five years). Whilst this predicted growth cannot be guaranteed, we have run a series of sensitivity analyses assuming growth in sales values accompanied by cost inflation as summarised in Table 4.3.1. While these growth scenarios are based on a number of forecasts, they cannot be guaranteed and the results which these scenarios produce must be viewed as indicative only. We have also increased the benchmark land values in the growth scenarios by 20%, reflecting some improvement in the value of secondary assets.
Table 4.3.1: Growth scenario
Year 1 2 3 4 5 6
2019 2020 2021 2022 2023 2024 and each year thereafter
Values 0.0% 3.5% 4.0% 4.0% 4.0% 4.0%
Costs 2.0% 2.0% 2.5% 2.5% 2.5% 2.5%
Affordable housing tenure and values
4.4 Policy DM10 and CS 4 set out a 40% target for affordable housing with a tenure mix of 60% rented and 30% intermediate housing.
4.5 Our appraisals assume that the rented housing is let at rents that do not exceed London Affordable Rents, as shown in Table 4.5.1. These rents are broadly equivalent to social/target rents.
4.6 We have tested the impact of the provision of a proportion of private units as rented by discounting the market value for these units by 20%, which reflects the discount we have seen on live developments when units are provided as Private Rented Sector stock. As noted in Section 2, this discount is offset to a degree by a reduction in profit margin of circa 5%, so the net reduction in value is 15%.

20
Table 4.1.1: Development typologies tested in the study (all areas are square metre gross internal areas)
Site Description Site area HA
Sqm Site cover
Units Ave GIA sqm per unit
Residential floorspace
A use Super-market
B1 B2 B8 C1 Hotel
C2 D1/D2 Gross floor-space
No of floors
1
Very small residential (house) 1 unit 0.05
107 50% 1 108
108
- - - -
-
-
-
-
108
2
2
Very small residential (houses) 5 units 0.04
398 60% 5 96
478
- - - -
-
-
-
-
478
2
3
Very small residential (houses) 6 units 0.05
487 60% 6 98
585
- - - -
-
-
-
-
585
2
4
Very small residential (flats) 6 units 0.03
250 60% 6 75
450
- - - -
-
-
-
-
450
3
5
Small residential development (flats) 10 units 0.05
453 60% 10 82
815
- - - -
-
-
-
-
815
3
6
Small residential development (houses) 10 units 0.07
696 70% 10 98
975
- - - -
-
-
-
-
975
2
7
Small residential development (flats) 15 units 0.05
523 80% 15 112
1,675
- - - -
-
-
-
-
1,675
4
8
Small residential development (houses) 15 units 0.07
673 70% 15 94
1,413
- - - -
-
-
-
-
1,413
3
9
Medium residential dev (flats and houses) 50 units 0.10
1,035 80% 50 83
4,140
- - - -
-
-
-
-
4,140
5

21
Site Description Site area HA
Sqm Site cover
Units Ave GIA sqm per unit
Residential floorspace
A use Super-market
B1 B2 B8 C1 Hotel
C2 D1/D2 Gross floor-space
No of floors
10
Medium residential development (flats) 50 units 0.12
1,153 80% 50 83
4,150
- - - -
-
-
-
-
4,150
4.5
11
Large residential (flats and houses) 100 units 0.17
1,750 80% 100 84
8,400
- - - -
-
-
-
-
8,400
6
12
Large residential (flats) 100 units 0.13
1,313 80% 100 84
8,400
- - - -
-
-
-
-
8,400
8
13
Large resdential (flats and houses) 150 units 0.32
3,181 80% 150 85
12,725
- - - -
-
-
-
-
12,725
5
14
Large residential (flats) 150 units 0.14
1,364 90% 150 82
12,275
- - - -
-
-
-
-
12,275
10
15
Large resdential (flats and houses) 250 units 0.43
4,349 80% 250 84
20,875
- - - -
-
-
-
-
20,875
6
16
Large residential (flats) 250 units 0.11
1,104 90% 250 79
19,865
- - - -
-
-
-
-
19,865
20
17
Large residential (flats) 500 units 0.65
6,484 80% 500 83
41,500
- - - -
-
-
-
-
41,500
8
18
Large residential (flats) 750 units 0.33
3,314 80% 750 83
62,375
- - - -
-
-
-
-
62,375
23.5
19
Large residential (flats) 1,000 units 0.93
9,333 75%
1,000 84
84,000
- - - -
-
-
-
-
84,000
12

22
Site Description Site area HA
Sqm Site cover
Units Ave GIA sqm per unit
Residential floorspace
A use Super-market
B1 B2 B8 C1 Hotel
C2 D1/D2 Gross floor-space
No of floors
20
Large residential (flats) 1,500 units 1.40
14,000 90%
1,500 84
126,000
- - - -
-
-
-
-
126,000
10
21
Large residential (flats) 2,000 units 1.38
13,792 80% 2000 83
165,500
- - - -
-
-
-
-
165,500
15
22
Large residential (flats) 2,500 units 1.51
15,092 75% 2500 82
203,750
- - - -
-
-
-
-
203,750
18
23
Estate regeneration (small) 50 houses 0.26
2,551 65% 50 100
4,975
- - - -
-
-
-
-
4,975
3
24
Estate regeneration (large) 250 flats 0.44
4,360 70% 250 73
18,315
- - - -
-
-
-
-
18,315
6
25
Older person's housing scheme (50 flats) 0.08
833 90% 50 75
3,750
- - - -
-
-
-
-
3,750
5
26
Older person's housing schme (25 houses, 25 flats) 0.18
1,786 70% 50 75
3,750
- - - -
-
-
-
-
3,750
3
27
Older person's housing scheme (75 flats) 0.10
995 90% 75 72
5,375
- - - -
-
-
-
-
5,375
6
28 Offices 0.10
1,000 80% 0
-
- -
4,000 - - - - -
4,000
5
29 Offices 0.12
1,250 80% 0
-
- -
8,000 - - - - -
8,000
8
30 Industrial 1.00
10,000 50% 0
-
- - -
5,000 - - - -
5,000
1

23
Site Description Site area HA
Sqm Site cover
Units Ave GIA sqm per unit
Residential floorspace
A use Super-market
B1 B2 B8 C1 Hotel
C2 D1/D2 Gross floor-space
No of floors
31 Industrial 1.00
10,000 50% 0
-
- - -
5,000 - - - -
5,000
1
32 Storage 1.00
10,000 50% 0
-
- - - -
5,000 - - -
5,000
1
33 Storage 1.00
10,000 50% 0
-
- - - -
5,000 - - -
5,000
1
34 Leisure 0.29
2,857 70% 0
-
- - - - - - -
4,000
4,000
2
35 Leisure 0.29
2,857 70% 0
-
- - - - - - -
6,000
6,000
3
36
Retail (smalll scale comparison) 0.01
105 95% 0
-
100 - - - - - - -
100
1
37
Retail (smalll scale comparison) 0.02
210 95% 0
-
200 - - - - - - -
200
1
38
Retail (medium scale comparison) 0.09
937 80% 0
-
750 - - - - - - -
750
1
39
Retail (medium scale comparison) 0.06
625 80% 0
-
750 - - - - - - -
750
1.5
40
Retail (large scale comparison) 0.07
714 70% 0
-
1,000 - - - - - - -
1,000
2
41
Retail (large scale comparison) 0.18
1,786 70% 0
-
2,500 - - - - - - -
2,500
2
42
Retail (large scale comparison) 0.31
3,076 65% 0
-
4,000 - - - - - - -
4,000
2
43 Retail (convenience) 0.43
4,289 70% 0
-
-
3,000 - - - - - -
3,000
1
44 Retail (convenience) 0.20
2,001 75% 0
-
-
1,500 - - - - - -
1,500
1

24
Site Description Site area HA
Sqm Site cover
Units Ave GIA sqm per unit
Residential floorspace
A use Super-market
B1 B2 B8 C1 Hotel
C2 D1/D2 Gross floor-space
No of floors
45 Retail (convenience) 0.03
263 95% 0
-
-
250 - - - - - -
250
1
46 Hotel 0.11
1,071 70% 100
-
- - - - -
3,000 - -
3,000
4
47 Hotel 0.16
1,555 75% 200
-
- - - - -
7,000 - -
7,000
6
48 Hotel -budget 0.08
789 95% 150
-
- - - - -
3,750 - -
3,750
5
49 Student 0.12
1,250 80% 200
-
- - - - - -
5,000 -
5,000
5
50 Student 0.18
1,823 80% 350
-
- - - - - -
8,750 -
8,750
6
25
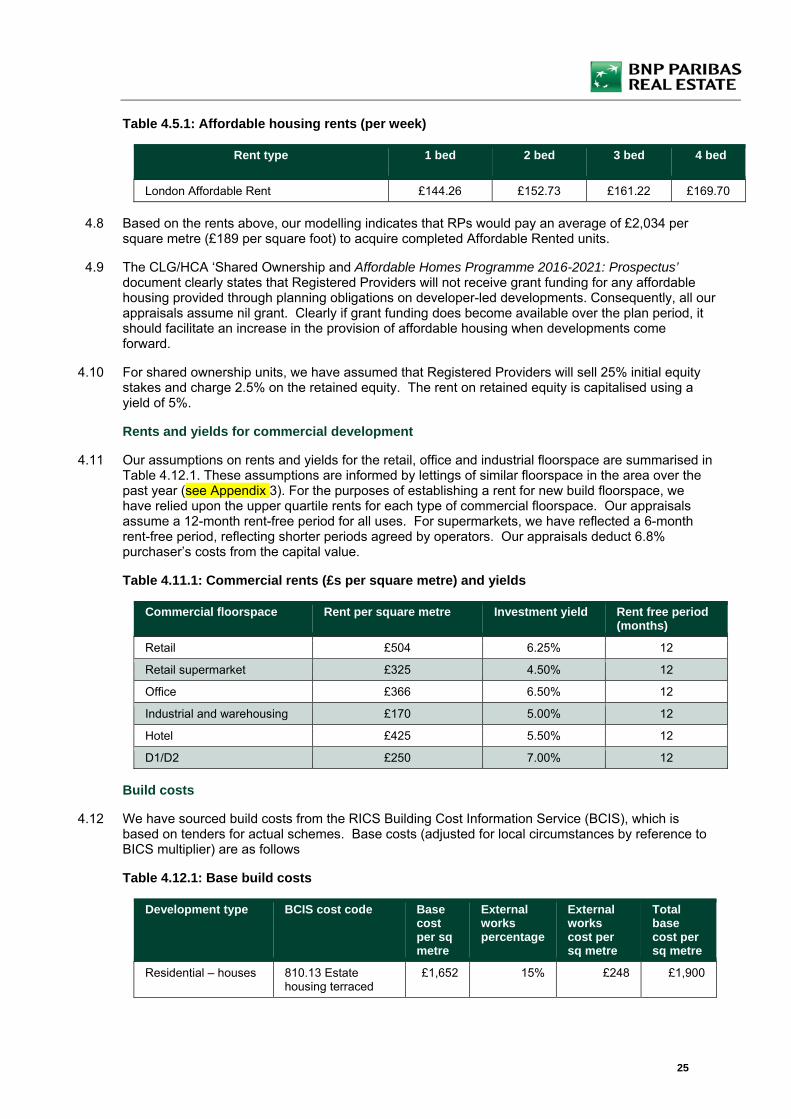
Table 4.5.1: Affordable housing rents (per week)
Rent type
1 bed 2 bed 3 bed 4 bed
London Affordable Rent £144.26 £152.73 £161.22 £169.70
4.8 Based on the rents above, our modelling indicates that RPs would pay an average of £2,034 per square metre (£189 per square foot) to acquire completed Affordable Rented units.
4.9 The CLG/HCA ‘Shared Ownership and Affordable Homes Programme 2016-2021: Prospectus’ document clearly states that Registered Providers will not receive grant funding for any affordable housing provided through planning obligations on developer-led developments. Consequently, all our appraisals assume nil grant. Clearly if grant funding does become available over the plan period, it should facilitate an increase in the provision of affordable housing when developments come forward.
4.10 For shared ownership units, we have assumed that Registered Providers will sell 25% initial equity stakes and charge 2.5% on the retained equity. The rent on retained equity is capitalised using a yield of 5%.
Rents and yields for commercial development
4.11 Our assumptions on rents and yields for the retail, office and industrial floorspace are summarised in Table 4.12.1. These assumptions are informed by lettings of similar floorspace in the area over the past year (see Appendix 3). For the purposes of establishing a rent for new build floorspace, we have relied upon the upper quartile rents for each type of commercial floorspace. Our appraisals assume a 12-month rent-free period for all uses. For supermarkets, we have reflected a 6-month rent-free period, reflecting shorter periods agreed by operators. Our appraisals deduct 6.8% purchaser’s costs from the capital value.
Table 4.11.1: Commercial rents (£s per square metre) and yields
Commercial floorspace Rent per square metre Investment yield Rent free period (months)
Retail £504 6.25% 12
Retail supermarket £325 4.50% 12
Office £366 6.50% 12
Industrial and warehousing £170 5.00% 12
Hotel £425 5.50% 12
D1/D2 £250 7.00% 12
Build costs
4.12 We have sourced build costs from the RICS Building Cost Information Service (BCIS), which is based on tenders for actual schemes. Base costs (adjusted for local circumstances by reference to BICS multiplier) are as follows
Table 4.12.1: Base build costs
Development type BCIS cost code Base cost per sq metre
External works percentage
External works cost per sq metre
Total base cost per sq metre
Residential – houses 810.13 Estate housing terraced
£1,652 15% £248 £1,900

26
Development type BCIS cost code Base cost per sq metre
External works percentage
External works cost per sq metre
Total base cost per sq metre
Residential – flats (5 or fewer storeys)
816. Flats – generally
£1,883 15% £282 £2,165
Residential (6 or more storeys)
816. Flats – 6 storey or above
£2,314 15% £347 £2,661
Offices 320. Offices – generally
£2,344 10% £234 £2,578
Industrial 282. Factories – Generally
£1,327 10% £133 £1,460
Warehousing 284.2 Purpose built warehouses /stores
£1,255 10% £126 £1,381
Hotels 852. Hotels £2,585 10% £259 £2,844
Student housing 856.2 Students’ residences
£2,382 10% £238 £2,620
Retail 345. Shops – Generally
£1,863 10% £186 £2,049
Retail supermarkets 344. Hypermarkets, supermarkets
£2,003 10% £200 £2,203
D1/D2 leisure 562.2 Gyms, fitness centres
£1,737 10% £174 £1,911
4.13 In addition, the base costs above are increased by 15% to account for external works (including car parking spaces), 10% for external works on commercial development, and 6% for the costs of meeting the energy requirements now embedded into Part L of the Building Regulations.
Zero carbon and BREEAM
4.14 The ‘Greater London Authority Housing Standards Review: Viability Assessment’ estimates that the cost of achieving zero carbon standards is 1.4% of base build costs. We have applied this uplift in costs to the base build costs outlined above.
4.15 For commercial developments, we have increased base build costs by 2% to allow for the extra-over costs of achieving BREEAM ‘excellent’ standard13. This is assumed to also address the ‘excellent;’ standard in relation to water efficiency, for which no clear data is available.
Accessibility standards
4.16 Our appraisals assume that all units are constructed to meet wheelchair accessibility standards (Category 2) apply to all dwellings at an average cost of £521 per house and £924 per unit for flats. In addition, we have assumed that Category 3 standard applies to 5% of dwellings at a cost of £22,694 per house and £7,908 per flat14. These costs address both parts A and B of the requirements (i.e. that the communal areas are designed and fitted out to allow wheelchair access and also that the dwellings themselves are designed and fitted out to facilitate occupation by wheelchair users).
Professional fees
4.17 In addition to base build costs, schemes will incur professional fees, covering design and valuation, 13 Based on ‘Delivering Sustainable Buildings: savings and payback’, BREEAM and Sweett Group Research 2014, which identified an increase of between 0.87% to 1.71% of build costs 14 Based on DCLH ‘Housing Standards Review: Cost Impacts’ September 2014

27
highways consultants and so on. Our appraisals incorporate a 10% allowance, which is at the middle to higher end of the range for most schemes.
Development finance
4.18 Our appraisals assume that development finance can be secured at a rate of 6%, inclusive of arrangement and exit fees, reflective of current funding conditions. Marketing costs
4.19 Our appraisals incorporate an allowance of 3% for marketing costs, which includes show homes and agents’ fees, plus 0.25% for sales legal fees. Mayoral CIL
4.20 Mayoral CIL is payable on most developments that receive planning consent from 1 April 2012 onwards. Barnet falls within Zone 2, where from 1 April 2019 a CIL of £60 per square metre is levied. The Mayoral CIL takes precedence over Borough requirements, including affordable housing. Our appraisals take into account Mayoral CIL.
Barnet CIL
4.21 As previously noted, the Council approved its CIL Charging Schedule on 16 April 2013 and it came into effect on 1 May 2013. Table 4.22.1 below summarises the prevailing rates of CIL and the rates after indexation. For residential developments, there is a single rate of £135 per square metre for all ‘C’ use classes. The same single rate of £135 per square metre is applied to all ‘A’ use classes. After indexation is applied, the £135 per square metre rate has increased to £201.89 per square metre. Other uses are nil rated.
Table 4.22.1: CIL rates per net additional square metre in the adopted Charging Schedule
Development type Zone Adopted rate Indexed rate
Residential (C1 – C4, Sui Generis HMOs)
Whole borough £135 £201.89
Retail (A1 – A5) Whole borough £135 £201.89
All other uses Whole Borough £0 £0
4.22 The amended CIL Regulations specify that if any part of an existing building is in lawful use for 6
months within the 36 months prior to the time at which planning permission first permits development, all of the existing floorspace will be deducted when determining the amount of chargeable floorspace. This is likely to be the case for many development sites in Barnet but not all existing floorspace will qualify. Therefore, for the purposes of our appraisals, we have assumed that there is no deduction for existing floorspace to ensure that the proposed CIL rate is viable for developments where there is no qualifying existing floorspace to net off.
Section 106 costs
4.23 To account for residual Section 106 requirements, we have included an allowance of up to £20 per square metre for non-residential development and up to £1,500 per unit for residential development. The actual amounts will of course be subject to site-specific negotiations when schemes are brought forward through the development management process.
Development and sales periods
4.24 Development and sales periods vary between type of scheme. However, our sales periods are based on an assumption of a sales rate of 6 units per month, with an element of off-plan sales reflected in the timing of receipts. This is reflective of current market conditions, whereas in improved markets, a sales rate of up to 8 units per month might be expected. We also note that many schemes in London have sold entirely off-plan, in some cases well in advance of completion of
28
construction. Clearly markets are cyclical and sales periods will vary over the economic cycle and the extent to which units are sold off-plan will vary over time. Our programme assumptions assume that units are sold over varying periods after completion, which is a conservative approach that ensures that the proposed CIL rates are viable for most developments.
Developer’s profit
4.25 Developer’s profit is closely correlated with the perceived risk of residential development. The greater the risk, the greater the required profit level, which helps to mitigate against the risk, but also to ensure that the potential rewards are sufficiently attractive for a bank and other equity providers to fund a scheme. In 2007, profit levels were at around 13-15% of GDV. However, following the impact of the credit crunch and the collapse in interbank lending and the various government bailouts of the banking sector, profit margins have increased. It is important to emphasise that the level of minimum profit is not necessarily determined by developers (although they will have their own view and the Boards of the major housebuilders will set targets for minimum profit).
4.26 The views of the banks which fund development are more important; if the banks decline an application by a developer to borrow to fund a development, it is very unlikely to proceed, as developers rarely carry sufficient cash to fund it themselves. Consequently, future movements in profit levels will largely be determined by the attitudes of the banks towards development proposals.
4.27 The near collapse of the global banking system in the final quarter of 2008 is resulting in a much tighter regulatory system, with UK banks having to take a much more cautious approach to all lending. In this context, and against the backdrop of the current sovereign debt crisis in the Eurozone, the banks were for a time reluctant to allow profit levels to decrease. However, perceived risk in the in the UK housing market is receding, albeit there is a degree of caution in prime central London markets as a consequence of the outcome of the referendum on the UK’s membership of the EU. We have therefore adopted a profit margin of 18% of private GDV for testing purposes, although individual schemes may require lower or higher profits, depending on site specific circumstances. The assumed profit margin is reflective of the range of sales values in the borough, which are affordable to owner-occupiers and therefore less vulnerable to changing levels of demand from international investors. Furthermore, there has been less development in the borough in comparison to other boroughs and subsequently lower levels of supply and less sales risk.
4.28 Our assumed return on the affordable housing GDV is 6%. A lower return on the affordable housing is appropriate as there is very limited sales risk on these units for the developer; there is often a pre-sale of the units to an RP prior to commencement. Any risk associated with take up of intermediate housing is borne by the acquiring RP, not by the developer. A reduced profit level on the affordable housing reflects the GLA ‘Development Control Toolkit’ guidance (February 2014) and Homes and Communities Agency’s guidelines in its Development Appraisal Tool (August 2013).
Exceptional costs
4.29 Exceptional costs can be an issue for development viability on previously developed land. These costs relate to works that are ‘atypical’, such as remediation of sites in former industrial use and that are over and above standard build costs. However, in the absence of details site investigations, it is not possible to provide a reliable estimate of what exceptional costs might be. Our analysis therefore excludes exceptional costs, as to apply a blanket allowance would generate misleading results. An ‘average’ level of costs for abnormal ground conditions and some other ‘abnormal’ costs is already reflected in BCIS data, as such costs are frequently encountered on sites that form the basis of the BCIS data sample.
Benchmark land value
4.30 Benchmark land value, based on the existing use value of sites is a key consideration in the assessment of development economics for testing planning policies and tariffs. Clearly, there is a point where the Residual Land Value (what the landowner receives from a developer) that results from a scheme may be less than the land’s existing use value. Existing use values can vary significantly, depending on the demand for the type of building relative to other areas. Similarly,

29
subject to planning permission, the potential development site may be capable of being used in different ways – as a hotel rather than residential for example; or at least a different mix of uses. Existing use value is effectively the ‘bottom line’ in a financial sense and therefore a key factor in this study.
4.31 We have arrived at a broad judgement on the likely range of benchmark land values. On previously developed sites, the calculations assume that the landowner has made a judgement that the current use does not yield an optimum use of the site; for example, it has fewer storeys than neighbouring buildings; or there is a general lack of demand for the type of space, resulting in low rentals, high yields and high vacancies (or in some cases no occupation at all over a lengthy period). We would not expect a building which makes optimum use of a site and that is attracting a reasonable rent to come forward for development, as residual value may not exceed current use value in these circumstances.
4.32 Redevelopment proposals that generate residual land values below current use values are unlikely to be delivered. While any such thresholds are only a guide in ‘normal’ development circumstances, it does not imply that individual landowners, in particular financial circumstances, will not bring sites forward at a lower return or indeed require a higher return. If proven current use value justifies a higher benchmark than those assumed, then appropriate adjustments may be necessary. As such, current use values should be regarded as benchmarks rather than definitive fixed variables on a site by site basis.
4.33 Sites will be in various existing uses and for the purposes of the study, we have adopted a range of benchmark land values from £1 million to £10.25 million per gross hectare, inclusive of any premium deemed to be required to incentivise release of land for development. This range is informed by our analysis of lettings of industrial floorspace and secondary offices in the borough, as set out below.
4.34 Lettings of office space in the borough between November 2016 and November 2019 have achieved rents ranging from £7 per square foot to £50 per square foot, with lettings in the bottom 20% averaging £13.50 per square foot, which is reflective of the sites likely to come forward for development. We have established the capital value of a site extending to one hectare by adopting the following assumptions:
■ 40% site coverage ■ 2 storeys ■ Yield 7.0% ■ 1 years rent free ■ £70 per square foot light refurbishment cost plus fees at 7% of costs ■ Purchaser’s costs deducted at 6.8% ■ 20% premium.
4.35 The capital value assumed is £10.25 million, including premium.
4.36 We have adopted the same approach for industrial buildings. We have applied a rent of £7 per square foot reflecting the lower end of the range of lettings of industrial space between November 2016 and November 2019. We have established the capital value of a site extending to one hectare by adopting the following assumptions:
■ 40% site coverage ■ 1 storey ■ Yield 7% ■ 1 year rent free ■ Purchaser’s costs deducted at 6.8% ■ 20% premium.
4.37 The capital value assumed is £4.55 million across the borough.
4.38 In addition, we have tested a lower value reflecting previously undeveloped land, including infill sites and amenity land, and publicly owned land.

30

31
5 Appraisal outputs 5.1 The full inputs to and outputs from our appraisals of the various developments are set out in Section
6 and appendices 2 to 5. We have appraised 50 development typologies, reflecting different densities and types of development across the Borough.
5.2 Each appraisal incorporates (where relevant) the following levels of affordable housing in line with the requirements of Policy CS4:
■ 40% affordable housing; ■ 35% affordable housing; ■ 30% affordable housing; ■ 25% affordable housing; and ■ 20% private housing.
5.3 In all cases, the affordable housing is assumed to be provided as 60% London Affordable Rent and 40% intermediate housing.
5.4 For small sites that fall below the 10 unit threshold, we have assumed that the schemes are delivered as 100% private housing and as a consequence, these schemes are significantly more viable than schemes which are required to contribute towards affordable housing requirements.
5.5 For each development typology, we have tested a range of sales values, reflecting the spread identified in the previous section. Where the residual land value of a typology exceeds the benchmark land value, we have converted the surplus into a rate per square metre, which is equivalent to the maximum CIL that could, in theory, be charged for that particular development.
5.6 We have also tested the developments with CIL as an inputted amount (rather than an output) with the starting point being the adopted charging schedule rates after indexation. The purpose is to approach the potential CIL rates through the ‘other end of the telescope’, that is, to test the impact on the residual land value that each scheme generates with the existing CIL rates in place. This can assist the Council in forming a judgement as to the potential impact on changes to CIL rates on land values and, consequently, potential land supply for certain uses. The indexed and alternative rates are summarised in Table 5.6.1.
Table 5.6.1: Alternative CIL rates
Development type
Zone Adopted rate
Indexed rate
Alternative rate 1
Alternative rate 2
Alternative rate 3
Residential Zone A £135 £202 £225 £250 £300
Potential Zone B £135 £202 £225 £300 £350
Offices Whole borough £0 £0 £10 £20 £30
Retail Whole borough £135 £202 £225 £250 £300
Hotel Whole borough £135 £202 £225 £250 £300
Student Housing Whole Borough £135 £202 £225 £250 £300
Industrial and warehousing
Whole Borough £0 £0 £10 £20 £30
All other uses, incl emergency services buildings
Whole Borough £0 £0 £0 £0 £0
5.7 Finally, all the scenarios are tested with the growth and inflation rates summarised in Table 4.3.1.

32
6 Assessment of appraisal results 6.1 This section sets out the results of our appraisals with the residual land values calculated for scenarios
with sales values and capital values reflective of market conditions across the Borough. The Residual Land Values are assessed in two ways. Firstly, the surplus residual above the benchmark land value is calculated and converted into a rate per square metre, which is a proxy for potential CIL rates. This results in a significant number of results, depending on other factors tested, most notably the level of affordable housing and the benchmark land value selected.
6.2 Development value is finite and – in Boroughs such as Barnet where many sites are previously developed - is rarely enhanced through the adoption of new policy requirements. This is because existing use values are sometimes relatively high prior to development. In contrast, areas which have previously undeveloped land clearly have greater scope to secure an uplift in land value through the planning process.
6.3 In assessing the results, it is important to clearly distinguish between two scenarios; namely, schemes that are unviable regardless of the Council’s policy requirements, including the level of CIL (including a nil rate) and schemes that are viable prior to the imposition of policy requirements. If a scheme is unviable before policy requirements and CIL are levied, it is unlikely to come forward and policy requirements and CIL would not be a factor that comes into play in the developer’s/landowner’s decision making. The unviable schemes will only become viable following an increase in values and sites would remain in their existing use.
6.4 The CIL regulations state that in setting a charge, local authorities must “strike an appropriate balance” between revenue maximisation on the one hand and the potentially adverse impact of CIL upon the viability of development across the whole area on the other. When considering this balance, the following factors are important:
■ Firstly, councils should take a strategic view of viability. There will always be variations in viability between individual sites, but viability testing should establish the most typical viability position; not the exceptional situations.
■ Secondly, councils should take a balanced view of viability – residual valuations are just one factor influencing a developer’s decision making – the same applies to local authorities.
■ Thirdly, while a single charge is attractive, it may not be appropriate for all authorities, particularly in areas where sales values vary between areas.
■ Fourthly, markets are cyclical and subject to change over short periods of time. Sensitivity testing to sensitivity test levels of CIL to ensure they are robust in the event that market conditions improve over the life of a Charging Schedule is essential.
■ Fifthly, local authorities should not set their rates of CIL at the limits of viability. They should leave a margin or contingency to allow for change and site specific viability issues.
6.5 There is clearly a balance that has to be struck between the aims of Policy CS4 on the delivery of affordable housing (which sets a strategic target of 40%, subject to individual scheme viability) and securing adequate contributions towards infrastructure from the developments that contribute towards the need for new infrastructure. The CIL rate cannot therefore be set on the basis that every single development typology right across the borough will deliver 40%, as this is not always viable. The Council’s latest Annual Monitoring Report for the financial year 2016/17 indicates that there were 459 net new affordable housing completions, which amounts to 28% of all net dwellings that were completed. Over the four years 2013/14 to 2017/17, 23% of units completed were affordable.
6.6 We have therefore focused on the results of testing where we have included between 25% and 30% affordable housing, as the Council will need to secure adequate amounts of funding to support new development. Affordable housing cannot be maximised to the total exclusion of securing infrastructure funding and vice versa.
6.7 The appraisals generate a very wide spread of potential CIL rates, depending on the benchmark land

33
value, residential sales values and the mix of uses within each development typology. The results are summarised in tables 6.7.1 to 6.7.15. As one would expect, the capacity for schemes to absorb CIL is greater where the benchmark land value is lowest. Furthermore, it is very clear that the capacity to absorb CIL contributions declines as the percentage of affordable housing increases.
6.8 The second approach to testing potential revised CIL rates is to consider viability from the other perspective; rather than the potential CIL rates being determined by the ‘surplus’ residual land value over the benchmark land value, the second approach inputs CIL as a cost to determine the scale of impact on the residual land value. This approach helps form a judgement on the impact of CIL on land values, which – if sufficiently modest – is unlikely to prevent a scheme from coming forward. These results are summarised in tables 6.8.1 to 6.8.4.
6.9 The results of this analysis indicate that increases from the adopted CIL rates would not – in the main - have a significant impact on the residual land values generated. This is illustrated in figures 6.9.1 to 6.9.3, which set the percentage changes in residual land values resulting from the application of the three alternative CIL rates. Other than in a small number of cases, the charts show very modest movements in percentage changes in residual land values, indicating that increases to the Council’s currently adopted CIL rates are unlikely to prevent development coming forward.
6.10 At any of the alternative CIL rates the burden on development would remain at an acceptably low level in most cases. The change in residual land value resulting from increases in CIL rates would generally be less than 10%. This indicates that developments could absorb the higher rates without any significant adverse impact upon land supply.

34
Table 6.7.1: Maximum CIL rates (before buffer), using £10.25 million per hectare benchmark land value - 40% affordable housing

35
Table 6.7.2: Maximum CIL rates (before buffer), using £4.55 million per hectare benchmark land value - 40% affordable housing

36
Table 6.7.3: Maximum CIL rates (before buffer), using £1.00 million per hectare benchmark land value – 40% affordable housing

37
Table 6.7.4: Maximum CIL rates (before buffer), using £10.25 million per hectare benchmark land value – 35% affordable housing

38
Table 6.7.5: Maximum CIL rates (before buffer), using £4.55 million per hectare benchmark land value – 35% affordable housing

39
Table 6.7.6: Maximum CIL rates (before buffer), using £1.00 million per hectare benchmark land value – 35% affordable housing

40
Table 6.7.7: Maximum CIL rates (before buffer), using £10.25 million per hectare benchmark land value – 30% affordable housing

41
Table 6.7.8: Maximum CIL rates (before buffer), using £4.55 million per hectare benchmark land value – 30% affordable housing

42
Table 6.7.9: Maximum CIL rates (before buffer), using £1.00 million per hectare benchmark land value – 30% affordable housing

43
Table 6.7.10: Maximum CIL rates (before buffer), using £10.25 million per hectare benchmark land value – 25% affordable housing

44
Table 6.7.11: Maximum CIL rates (before buffer), using £4.55 million per hectare benchmark land value – 25% affordable housing

45
Table 6.7.12: Maximum CIL rates (before buffer), using £1.00 million per hectare benchmark land value – 25% affordable housing

46
Table 6.7.13: Maximum CIL rates (before buffer), using £10.25 million per hectare benchmark land value – 20% affordable housing

47
Table 6.7.14: Maximum CIL rates (before buffer), using £4.55 million per hectare benchmark land value – 20% affordable housing

48
Table 6.7.15: Maximum CIL rates (before buffer), using £1.00 million per hectare benchmark land value – 20% affordable housing

49
Table 6.7.16: Maximum CIL rates (before buffer), commercial development

50
Table 6.8.1: Alternative CIL rates – Sales values £8,000 per sqm – change in residual land value (appraisals assume 30% affordable housing)
LP Ref Site Units Adopted Alternative 1 Alternative 2 Alternative 3
1 Very small residential (house) 1 unit 1 318,360 316,120 313,696 308,850
2 Very small residential (houses) 5 units 5 1,412,582 1,402,633 1,391,868 1,370,341
3 Very small residential (houses) 6 units 6 1,730,962 1,718,773 1,705,586 1,679,211
4 Very small residential (flats) 6 units 6 804,343 794,983 784,856 764,602
5 Small residential development (flats) 10 units 10 890,286 878,418 865,579 839,902
6 Small residential development (houses) 10 units 10 2,047,917 2,033,697 2,018,312 1,987,541
7 Small residential development (flats) 15 units 15 1,865,528 1,841,138 1,814,751 1,761,978
8 Small residential development (houses) 15 units 15 2,996,495 2,975,894 2,953,605 2,909,027
9 Medium residential dev (flats and houses) 50 units 50 5,293,300 5,233,909 5,169,654 5,041,145
10 Medium residential development (flats) 50 units 50 4,422,282 4,362,798 4,298,442 4,169,730
11 Large residential (flats and houses) 100 units 100 5,665,318 5,545,217 5,415,282 5,155,410
12 Large residential (flats) 100 units 100 3,169,282 3,049,182 2,919,246 2,659,373
13 Large residential (flats and houses) 150 units 150 7,034,549 6,855,451 6,661,684 6,274,152
14 Large residential (flats) 150 units 150 5,481,329 5,306,119 5,116,560 4,737,442
15 Large residential (flats and houses) 250 units 250 11,444,391 11,151,566 10,834,761 10,201,149
16 Large residential (flats) 250 units 250 1,572,315 1,289,716 983,972 372,484
17 Large residential (flats) 500 units 500 12,541,416 11,977,300 11,366,982 10,132,631
18 Large residential (flats) 750 units 750 7,899,527 7,041,093 6,112,353 4,254,874
19 Large residential (flats) 1,000 units 1000 25,068,424 23,963,801 22,753,797 20,329,791
20 Large residential (flats) 1,500 units 1500 36,564,735 34,936,380 33,174,663 29,632,262
21 Large residential (flats) 2,000 units 2000 47,330,078 45,257,468 43,015,112 38,483,784
22 Large residential (flats) 2,500 units 2500 41,299,264 38,798,821 36,085,833 30,593,259
23 Estate regeneration (small) 50 houses 50 5,261,469 5,190,160 5,113,010 4,958,712
24 Estate regeneration (large) 250 flats 250 9,082,200 8,828,447 8,553,912 8,004,842
25 Older person's housing scheme (50 flats) 50 1,550,718 1,497,013 1,438,908 1,322,700
26 Older person's housing schme (25 houses, 25 flats) 50 1,486,597 1,432,891 1,374,787 1,258,578

51
LP Ref Site Units Adopted Alternative 1 Alternative 2 Alternative 3
27 Older person's housing scheme (75 flats) 75 -690,504 -769,610 -855,195 -1,026,365
28 Offices 0 441,739 401,577 361,416 321,254
29 Offices 0 625,078 545,990 466,900 387,812
30 Industrial 0 878,642 827,652 776,663 725,673
31 Industrial 0 878,642 827,652 776,663 725,673
32 Storage 0 1,952,759 1,901,769 1,850,781 1,799,791
33 Storage 0 1,290,556 1,239,566 1,188,578 1,137,588
34 Leisure 0 -1,230,553 -1,230,553 -1,230,553 -1,230,553
35 Leisure 0 -1,713,592 -1,713,592 -1,713,592 -1,713,592
36 Retail (smalll scale comparison) 0 159,557 157,238 154,727 149,707
37 Retail (smalll scale comparison) 0 319,136 314,496 309,476 299,436
38 Retail (medium scale comparison) 0 1,196,770 1,179,370 1,160,543 1,122,892
39 Retail (medium scale comparison) 0 1,229,328 1,211,927 1,193,101 1,155,450
40 Retail (large scale comparison) 0 1,660,854 1,637,653 1,612,552 1,562,350
41 Retail (large scale comparison) 0 4,315,131 4,257,129 4,194,377 4,068,871
42 Retail (large scale comparison) 0 6,904,210 6,811,406 6,711,002 6,510,192
43 Retail (convenience) 0 4,215,006 4,145,403 4,070,100 3,919,492
44 Retail (convenience) 0 2,107,503 2,072,702 2,035,050 1,959,746
45 Retail (convenience) 0 351,250 345,450 339,175 326,624
46 Hotel 0 2,226,733 2,157,130 2,081,826 1,931,220
47 Hotel 0 5,226,139 5,063,731 4,888,023 4,536,607
48 Hotel -budget 0 2,760,594 2,673,591 2,579,461 2,391,203
49 Student 0 2,365,707 2,249,702 2,124,196 1,873,184
50 Student 0 4,139,986 3,936,978 3,717,343 3,278,072
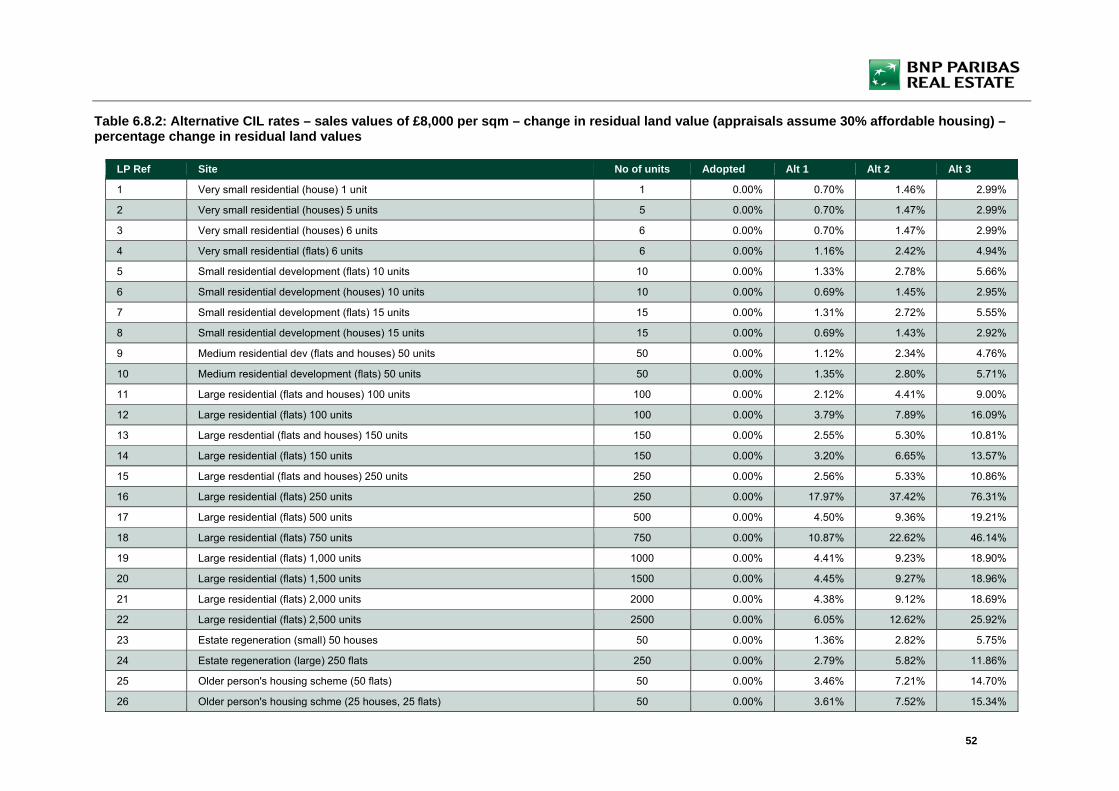
52
Table 6.8.2: Alternative CIL rates – sales values of £8,000 per sqm – change in residual land value (appraisals assume 30% affordable housing) – percentage change in residual land values
LP Ref Site No of units Adopted Alt 1 Alt 2 Alt 3
1 Very small residential (house) 1 unit 1 0.00% 0.70% 1.46% 2.99%
2 Very small residential (houses) 5 units 5 0.00% 0.70% 1.47% 2.99%
3 Very small residential (houses) 6 units 6 0.00% 0.70% 1.47% 2.99%
4 Very small residential (flats) 6 units 6 0.00% 1.16% 2.42% 4.94%
5 Small residential development (flats) 10 units 10 0.00% 1.33% 2.78% 5.66%
6 Small residential development (houses) 10 units 10 0.00% 0.69% 1.45% 2.95%
7 Small residential development (flats) 15 units 15 0.00% 1.31% 2.72% 5.55%
8 Small residential development (houses) 15 units 15 0.00% 0.69% 1.43% 2.92%
9 Medium residential dev (flats and houses) 50 units 50 0.00% 1.12% 2.34% 4.76%
10 Medium residential development (flats) 50 units 50 0.00% 1.35% 2.80% 5.71%
11 Large residential (flats and houses) 100 units 100 0.00% 2.12% 4.41% 9.00%
12 Large residential (flats) 100 units 100 0.00% 3.79% 7.89% 16.09%
13 Large resdential (flats and houses) 150 units 150 0.00% 2.55% 5.30% 10.81%
14 Large residential (flats) 150 units 150 0.00% 3.20% 6.65% 13.57%
15 Large resdential (flats and houses) 250 units 250 0.00% 2.56% 5.33% 10.86%
16 Large residential (flats) 250 units 250 0.00% 17.97% 37.42% 76.31%
17 Large residential (flats) 500 units 500 0.00% 4.50% 9.36% 19.21%
18 Large residential (flats) 750 units 750 0.00% 10.87% 22.62% 46.14%
19 Large residential (flats) 1,000 units 1000 0.00% 4.41% 9.23% 18.90%
20 Large residential (flats) 1,500 units 1500 0.00% 4.45% 9.27% 18.96%
21 Large residential (flats) 2,000 units 2000 0.00% 4.38% 9.12% 18.69%
22 Large residential (flats) 2,500 units 2500 0.00% 6.05% 12.62% 25.92%
23 Estate regeneration (small) 50 houses 50 0.00% 1.36% 2.82% 5.75%
24 Estate regeneration (large) 250 flats 250 0.00% 2.79% 5.82% 11.86%
25 Older person's housing scheme (50 flats) 50 0.00% 3.46% 7.21% 14.70%
26 Older person's housing schme (25 houses, 25 flats) 50 0.00% 3.61% 7.52% 15.34%

53
LP Ref Site No of units Adopted Alt 1 Alt 2 Alt 3
27 Older person's housing scheme (75 flats) 75 0.00% -11.46% -23.85% -48.64%
28 Offices 0 0.00% 9.09% 18.18% 27.28%
29 Offices 0 0.00% 12.65% 25.31% 37.96%
30 Industrial 0 0.00% 5.80% 11.61% 17.41%
31 Industrial 0 0.00% 5.80% 11.61% 17.41%
32 Storage 0 0.00% 2.61% 5.22% 7.83%
33 Storage 0 0.00% 3.95% 7.90% 11.85%
34 Leisure 0 0.00% 0.00% 0.00% 0.00%
35 Leisure 0 0.00% 0.00% 0.00% 0.00%
36 Retail (smalll scale comparison) 0 0.00% 1.45% 3.03% 6.17%
37 Retail (smalll scale comparison) 0 0.00% 1.45% 3.03% 6.17%
38 Retail (medium scale comparison) 0 0.00% 1.45% 3.03% 6.17%
39 Retail (medium scale comparison) 0 0.00% 1.42% 2.95% 6.01%
40 Retail (large scale comparison) 0 0.00% 1.40% 2.91% 5.93%
41 Retail (large scale comparison) 0 0.00% 1.34% 2.80% 5.71%
42 Retail (large scale comparison) 0 0.00% 1.34% 2.80% 5.71%
43 Retail (convenience) 0 0.00% 1.65% 3.44% 7.01%
44 Retail (convenience) 0 0.00% 1.65% 3.44% 7.01%
45 Retail (convenience) 0 0.00% 1.65% 3.44% 7.01%
46 Hotel 0 0.00% 3.13% 6.51% 13.27%
47 Hotel 0 0.00% 3.11% 6.47% 13.19%
48 Hotel -budget 0 0.00% 3.15% 6.56% 13.38%
49 Student 0 0.00% 4.90% 10.21% 20.82%
50 Student 0 0.00% 4.90% 10.21% 20.82%

54
Table 6.8.3: Alternative CIL rates – Sales values £12,000 per sqm – change in residual land value (appraisals assume 30% affordable housing)
LP Ref Site No of units Adopted Alternative 1 Alternative 2 Alternative 3
1 Very small residential (house) 1 unit 1 606,988 604,748 597,478 592,632
2 Very small residential (houses) 5 units 5 2,694,628 2,684,679 2,652,387 2,630,859
3 Very small residential (houses) 6 units 6 3,301,636 3,289,447 3,249,885 3,223,510
4 Very small residential (flats) 6 units 6 1,801,192 1,791,832 1,761,451 1,741,197
5 Small residential development (flats) 10 units 10 2,154,069 2,142,202 2,103,685 2,078,008
6 Small residential development (houses) 10 units 10 3,880,371 3,866,150 3,819,995 3,789,224
7 Small residential development (flats) 15 units 15 4,462,874 4,438,484 4,359,325 4,306,551
8 Small residential development (houses) 15 units 15 5,651,202 5,630,602 5,563,735 5,519,158
9 Medium residential dev (flats and houses) 50 units 50 11,841,367 11,781,976 11,589,212 11,460,703
10 Medium residential development (flats) 50 units 50 10,704,900 10,645,416 10,452,348 10,323,636
11 Large residential (flats and houses) 100 units 100 18,000,596 17,882,172 17,497,803 17,241,557
12 Large residential (flats) 100 units 100 15,034,153 14,915,730 14,531,361 14,275,116
13 Large resdential (flats and houses) 150 units 150 24,843,444 24,666,845 24,093,658 23,711,532
14 Large residential (flats) 150 units 150 22,888,978 22,718,624 22,165,707 21,797,094
15 Large resdential (flats and houses) 250 units 250 39,756,016 39,471,306 38,547,227 37,931,174
16 Large residential (flats) 250 units 250 26,088,441 25,813,673 24,921,860 24,327,318
17 Large residential (flats) 500 units 500 64,502,113 63,961,283 62,205,910 61,035,662
18 Large residential (flats) 750 units 750 80,047,129 79,246,937 76,634,990 74,879,034
19 Large residential (flats) 1,000 units 1000 122,093,789 121,078,480 117,783,090 115,586,163
20 Large residential (flats) 1,500 units 1500 173,586,306 172,151,392 167,494,095 164,374,291
21 Large residential (flats) 2,000 units 2000 216,313,117 214,537,338 208,742,240 204,845,437
22 Large residential (flats) 2,500 units 2500 232,442,917 230,353,972 223,554,064 218,970,042
23 Estate regeneration (small) 50 houses 50 12,793,041 12,721,732 12,490,283 12,335,984
24 Estate regeneration (large) 250 flats 250 34,228,595 33,981,874 33,181,092 32,647,238
25 Older person's housing scheme (50 flats) 50 6,176,447 6,123,491 5,951,609 5,837,023
26 Older person's housing schme (25 houses, 25 flats) 50 6,113,220 6,060,264 5,888,383 5,773,796

55
LP Ref Site No of units Adopted Alternative 1 Alternative 2 Alternative 3
27 Older person's housing scheme (75 flats) 75 5,919,337 5,843,496 5,597,340 5,433,237
28 Offices 0 441,739 401,577 361,416 321,254
29 Offices 0 625,078 545,990 466,900 387,812
30 Industrial 0 878,642 827,652 776,663 725,673
31 Industrial 0 878,642 827,652 776,663 725,673
32 Storage 0 1,952,759 1,901,769 1,850,781 1,799,791
33 Storage 0 1,290,556 1,239,566 1,188,578 1,137,588
34 Leisure 0 -1,230,553 -1,230,553 -1,230,553 -1,230,553
35 Leisure 0 -1,713,592 -1,713,592 -1,713,592 -1,713,592
36 Retail (smalll scale comparison) 0 159,557 157,238 154,727 149,707
37 Retail (smalll scale comparison) 0 319,136 314,496 309,476 299,436
38 Retail (medium scale comparison) 0 1,196,770 1,179,370 1,160,543 1,122,892
39 Retail (medium scale comparison) 0 1,229,328 1,211,927 1,193,101 1,155,450
40 Retail (large scale comparison) 0 1,660,854 1,637,653 1,612,552 1,562,350
41 Retail (large scale comparison) 0 4,315,131 4,257,129 4,194,377 4,068,871
42 Retail (large scale comparison) 0 6,904,210 6,811,406 6,711,002 6,510,192
43 Retail (convenience) 0 4,215,006 4,145,403 4,070,100 3,919,492
44 Retail (convenience) 0 2,107,503 2,072,702 2,035,050 1,959,746
45 Retail (convenience) 0 351,250 345,450 339,175 326,624
46 Hotel 0 2,226,733 2,157,130 2,081,826 1,931,220
47 Hotel 0 5,226,139 5,063,731 4,888,023 4,536,607
48 Hotel -budget 0 2,760,594 2,673,591 2,579,461 2,391,203
49 Student 0 2,365,707 2,249,702 1,873,184 1,622,172
50 Student 0 4,139,986 3,936,978 3,278,072 2,838,802

56
Table 6.8.4: Alternative CIL rates – sales values of £12,000 per sqm – change in residual land value (appraisals assume 30% affordable housing) – percentage change in residual land values
LP Ref Site No of units Adopted Alt 1 Alt 2 Alt 3
1 Very small residential (house) 1 unit 1 0.00% 0.37% 1.57% 2.37%
2 Very small residential (houses) 5 units 5 0.00% 0.37% 1.57% 2.37%
3 Very small residential (houses) 6 units 6 0.00% 0.37% 1.57% 2.37%
4 Very small residential (flats) 6 units 6 0.00% 0.52% 2.21% 3.33%
5 Small residential development (flats) 10 units 10 0.00% 0.55% 2.34% 3.53%
6 Small residential development (houses) 10 units 10 0.00% 0.37% 1.56% 2.35%
7 Small residential development (flats) 15 units 15 0.00% 0.55% 2.32% 3.50%
8 Small residential development (houses) 15 units 15 0.00% 0.36% 1.55% 2.34%
9 Medium residential dev (flats and houses) 50 units 50 0.00% 0.50% 2.13% 3.21%
10 Medium residential development (flats) 50 units 50 0.00% 0.56% 2.36% 3.56%
11 Large residential (flats and houses) 100 units 100 0.00% 0.66% 2.79% 4.22%
12 Large residential (flats) 100 units 100 0.00% 0.79% 3.34% 5.05%
13 Large resdential (flats and houses) 150 units 150 0.00% 0.71% 3.02% 4.56%
14 Large residential (flats) 150 units 150 0.00% 0.74% 3.16% 4.77%
15 Large resdential (flats and houses) 250 units 250 0.00% 0.72% 3.04% 4.59%
16 Large residential (flats) 250 units 250 0.00% 1.05% 4.47% 6.75%
17 Large residential (flats) 500 units 500 0.00% 0.84% 3.56% 5.37%
18 Large residential (flats) 750 units 750 0.00% 1.00% 4.26% 6.46%
19 Large residential (flats) 1,000 units 1000 0.00% 0.83% 3.53% 5.33%
20 Large residential (flats) 1,500 units 1500 0.00% 0.83% 3.51% 5.31%
21 Large residential (flats) 2,000 units 2000 0.00% 0.82% 3.50% 5.30%
22 Large residential (flats) 2,500 units 2500 0.00% 0.90% 3.82% 5.80%
23 Estate regeneration (small) 50 houses 50 0.00% 0.56% 2.37% 3.57%
24 Estate regeneration (large) 250 flats 250 0.00% 0.72% 3.06% 4.62%

57
LP Ref Site No of units Adopted Alt 1 Alt 2 Alt 3
25 Older person's housing scheme (50 flats) 50 0.00% 0.86% 3.64% 5.50%
26 Older person's housing schme (25 houses, 25 flats) 50 0.00% 0.87% 3.68% 5.55%
27 Older person's housing scheme (75 flats) 75 0.00% 1.28% 5.44% 8.21%
28 Offices 0 0.00% 9.09% 18.18% 27.28%
29 Offices 0 0.00% 12.65% 25.31% 37.96%
30 Industrial 0 0.00% 5.80% 11.61% 17.41%
31 Industrial 0 0.00% 5.80% 11.61% 17.41%
32 Storage 0 0.00% 2.61% 5.22% 7.83%
33 Storage 0 0.00% 3.95% 7.90% 11.85%
34 Leisure 0 0.00% 0.00% 0.00% 0.00%
35 Leisure 0 0.00% 0.00% 0.00% 0.00%
36 Retail (smalll scale comparison) 0 0.00% 1.45% 3.03% 6.17%
37 Retail (smalll scale comparison) 0 0.00% 1.45% 3.03% 6.17%
38 Retail (medium scale comparison) 0 0.00% 1.45% 3.03% 6.17%
39 Retail (medium scale comparison) 0 0.00% 1.42% 2.95% 6.01%
40 Retail (large scale comparison) 0 0.00% 1.40% 2.91% 5.93%
41 Retail (large scale comparison) 0 0.00% 1.34% 2.80% 5.71%
42 Retail (large scale comparison) 0 0.00% 1.34% 2.80% 5.71%
43 Retail (convenience) 0 0.00% 1.65% 3.44% 7.01%
44 Retail (convenience) 0 0.00% 1.65% 3.44% 7.01%
45 Retail (convenience) 0 0.00% 1.65% 3.44% 7.01%
46 Hotel 0 0.00% 3.13% 6.51% 13.27%
47 Hotel 0 0.00% 3.11% 6.47% 13.19%
48 Hotel -budget 0 0.00% 3.15% 6.56% 13.38%
49 Student 0 0.00% 4.90% 20.82% 31.43%
50 Student 0 0.00% 4.90% 20.82% 31.43%

58
Figure 6.9.1: Percentage impact on residual land values of three alternative CIL rates (residential; sales values of £8,000 per square metre, 30% affordable housing)
0.00%
10.00%
20.00%
30.00%
40.00%
50.00%
60.00%
70.00%
80.00%
90.00%
1 2 3 4 5 6 7 8 9 10 11 12 13 14 15 16 17 18 19 20 21 22 23 24 25 26
Alt 1 Alt 2 Alt 3

59
Figure 6.9.2: Percentage impact on residual land values of three alternative CIL rates (residential; sales values of £12,000 per square metre, 30% affordable housing)
0.00%
1.00%
2.00%
3.00%
4.00%
5.00%
6.00%
7.00%
8.00%
9.00%
1 2 3 4 5 6 7 8 9 10 11 12 13 14 15 16 17 18 19 20 21 22 23 24 25 26 27
Alt 1 Alt 2 Alt 3

60
Figure 6.9.3: Percentage impact on residual land values of three alternative CIL rates (commercial)
0.00%
5.00%
10.00%
15.00%
20.00%
25.00%
30.00%
35.00%
40.00%
28 29 30 31 32 33 34 35 36 37 38 39 40 41 42 43 44 45 46 47 48 49 50
Alt 1 Alt 2 Alt 3

61
Residential rates
6.11 As noted earlier in this report, Golders Green and Hampstead areas within the south of the borough achieve significantly higher sales values than other parts, which attract values in a relatively narrow band of £6,500 to £8,000 per square metre. In light of this significant difference, the Council may wish to consider adopting a two zone CIL charging structure, with one zone covering Golders Green and Hampstead and a zone covering the remaining parts of the borough. The extent to which this may be an attractive option depends in part on the likely quantum of development expected to come forward in Golders Green and Hampstead; if there are limited opportunities for significant numbers of new residential or commercial developments, then CIL income will be limited. In this context, setting a dual rate is unlikely to achieve a significant increase in CIL income. Nevertheless, the results of the appraisals indicate that an increase from the currently adopted rate to Alternative CIL rate 3 (£350 in Golders Green and Hampstead) is unlikely to have a significant impact on residual land values.
6.12 In the rest of the borough, the evidence indicates that an increase from the current rate of £135 per square metre (£202 per square metre with indexation) to £300 per square metre will be viable in most situations and readily absorbed through modest reductions in residual land values
6.13 We attach as Appendix 4 the results of our sensitivity analysis which builds in the growth rates on sales values and inflation on costs identified in Table 4.3.1. In this analysis, we have also increased the benchmark land values by 20% to reflect the possibility that existing use values may also increase over time. The results indicate that schemes will become more viable and the ‘buffer’ or ‘margin’ between the theoretical maximum CIL rates and the proposed rates will widen. This will increase the capacity of schemes to provide higher levels of affordable housing (towards or at the strategic target level of 40%) or generate higher returns to landowners. As noted previously, these results should be treated with a degree of caution as forecasts are based on assumptions on a range of factors that may change.
6.14 A key consideration for the Council is the interaction between CIL contributions and affordable housing, noting of course our earlier comments that securing both CIL and affordable housing are essential objectives. Like other planning authorities, the Council cannot seek to secure affordable housing to the total exclusion of financial contributions towards essential community infrastructure, and vice-versa. Increased rates should, in most circumstances, be passed on to the landowner through modest reductions in residual land values, but where this cannot happen (due to a high existing use value, for example), there may be a reduction in affordable housing in comparison to a ‘no CIL’ scenario.
6.15 We have therefore run a theoretical exercise to test the impact of the proposed CIL rates on the level of affordable housing to establish the change in affordable housing required if it is not possible to pass the increased CIL liability to the land owner through a reduction in land value15. Table 6.15.1 summarises this analysis; for each scheme, we show the residual land value with the adopted CIL rate and the reduction arising from the increase in the CIL rate. We then reduce the affordable housing in order to restore the residual land value back to its previous level. As can be noted, the increase in CIL can be fully mitigated by a reduction in affordable housing of circa 3%.
Table 6.15.1: Theoretical reduction in affordable housing required to offset increase in CIL rates (private sales values of £8,000 per square metre)
Site ref
Site type Number of units
RLV –adopted CIL
RLV –proposed CIL
Change in affordable housing required to
offset increase in CIL
5 Small residential development (flats) 10 units
10 £890,286 £839,902 2.80%
6 Small residential development (houses) 10 units
10 £2,047,917 £1,987,541 2.20%
15 The draft Planning Practice Guidance notes that land values should reflect planning policy requirements, including CIL. Developers should take account of policy requirements when formulating bids for sites.

62
Site ref
Site type Number of units
RLV –adopted CIL
RLV –proposed CIL
Change in affordable housing required to
offset increase in CIL
7 Small residential development (flats) 15 units
15 £1,865,528 £1,761,978 2.80%
8 Small residential development (houses) 15 units
15 £2,996,495 £2,909,027 2.20%
9 Medium residential dev (flats and houses) 50 units
50 £5,293,300 £5,041,145 2.70%
10 Medium residential development (flats) 50 units
50 £4,422,282 £4,169,730 2.90%
11 Large residential (flats and houses) 100 units
100 £5,665,318 £5,155,410 3.00%
12 Large residential (flats) 100 units 100 £3,169,282 £2,659,373 3.10%
13 Large resdential (flats and houses) 150 units
150 £7,034,549 £6,274,152 3.15%
14 Large residential (flats) 150 units 150 £5,481,329 £4,737,442 3.12%
15 Large resdential (flats and houses) 250 units
250 £11,444,391 £10,201,149 3.30%
16 Large residential (flats) 250 units 250 £1,572,315 £372,484 3.75%
17 Large residential (flats) 500 units 500 £12,541,416 £10,132,631 3.41%
18 Large residential (flats) 750 units 750 £7,899,527 £4,254,874 3.74%
19 Large residential (flats) 1,000 units 1,000 £25,068,424 £20,329,791 3.52%
20 Large residential (flats) 1,500 units 1,500 £36,564,735 £29,632,262 3.60%
21 Large residential (flats) 2,000 units 2,000 £47,330,078 £38,483,784 3.66%
22 Large residential (flats) 2,500 units 2,500 £41,299,264 £30,593,259 3.89%
23 Estate regeneration (small) 50 houses
50 £5,261,469 £4,958,712 2.86%
24 Estate regeneration (large) 250 flats
250 £9,082,200 £8,004,842 3.03%
25 Older person's housing scheme (50 flats)
50 £1,550,718 £1,322,700 3.64%
26 Older person's housing scheme (25 houses, 25 flats)
50 £1,486,597 £1,258,578 3.64%
Commercial rates
6.16 The borough is still seeing losses of B use class floorspace and our testing confirms that new office and industrial development is unlikely to be able to make a significant contribution towards infrastructure. However, the viability testing shows that a modest ‘nominal’ contribution of circa £20 per square metre could be achieved, although the extent to which any income will be generated depends upon the extent to which additional floor area is created. The Council’s 2016/17 Annual Monitoring Report notes that new B use class floorspace is not yet exceeding existing space, so in these circumstances little new B use class development would generate a CIL contribution
6.17 Our appraisals indicate that the other use classes which currently attract a CIL charge (retail, retail supermarkets, hotels and student housing) remain viable with the adopted rate and with alternative rates. However, the retail market is experiencing structural change which may result in surplus space over the life of a new charging schedule. We would therefore recommend that CL rates on new retail floorspace are held at their current (indexed) rate of £202 per square metre and increases in CIL applied only to hotels and student housing.

63
Other uses
6.18 Other uses covered by the existing “all other uses” rate in the adopted CIL Charging Schedule (education and health) should remain at their current CIL rate of nil.

64
7 Conclusions and recommendations 7.1 The NPPF states that the cumulative impact of local planning authority standards and policies “should
not put implementation of the plan at serious risk, and should facilitate development throughout the economic cycle”. The draft NPPF echoes this requirement, stating that “Plans should set out the contributions expected in association with particular sites and types of development. This should include setting out the levels and types of affordable housing provision required, along with other infrastructure (such as that needed for education, health, transport, green and digital infrastructure). Such policies should not make development unviable, and should be supported by evidence to demonstrate this”. This report and its supporting appendices test the ability of development typologies in Barnet to support local plan policies while making contributions to infrastructure that will support growth through CIL.
7.2 The Council's adopted CIL rates have been in place since 1 May 2013 and there has been no demonstrable adverse impact on the supply of housing land or upon the viability of developments coming forward across the Borough. Since the evidence base for the adopted CIL was prepared, there have been changes to sales values and build costs. Our testing of alternative CIL rates indicates that relatively significant changes could be accommodated without adversely impacting on viability to a sufficient degree to impact on land supply.
7.3 As a result of indexation, the CIL rates are now circa 49.6% higher than they were adopted. The proposed Mayoral CIL also increased from £35 per square metre to £60 per square metre on 1 April 2019 and these increased rates are reflected in our assessment.
7.4 The proposed CIL rates for the borough are summarised in Table 7.4.1. We suggest that the Charging Authority could consider dividing the borough into two zones for setting residential rates, with Zone A covering the bulk of the area, with Zone B covering Golders Green and Hampstead. CIL rates for residential development in Zone A could increase to £300 per square metre, while a slightly higher increase of £350 per square metre is suggested for Zone B. These increased rates would bring Barnet’s CIL Charges more in line with those in the neighbouring boroughs (as noted in Table 2.37.1, Brent’s indexed rate is £299 per square metre and Haringey’s highest rate adjacent to Barnet is £371 per square metre).
Table 7.4.1: Proposed changes to CIL rates
Development type Zone Adopted rate Indexed rate Proposed rate
Residential C3 use class Zone A £135 £202 £300
Zone B16 £135 £202 £350
Hotels, student housing Whole borough £135 £202 £300
Retail Whole borough £135 £202 £202
B use classes Whole borough £0 £0 £20
All other uses Whole Borough £0 £0 £0
7.5 The borough is still seeing losses of B use class floorspace and our testing confirms that new office and industrial development is unlikely to be able to make a significant contribution towards infrastructure. The viability testing shows that a modest contribution of circa £20 per square metre could in principle be applied to B use class developments, although the extent to which any income will be generated depends upon the extent to which additional floor area is created. The Council's 2016/17 Annual Monitoring Report notes that new B use class floorspace is not yet exceeding existing space, so in these circumstances little or new B use class development would generate a CIL contribution. If these trends change in the future, the Council could revisit their approach to CIL charges on B use class developments in a future CIL review.
7.6 Retail development in Barnet currently attracts the same CIL rate as other uses. In light of the
16 Golders Green and Hampstead
65
structural changes occurring in retailing, we propose no change to the current rates, beyond indexation up to prevailing rates of £202 per square metre.
7.7 Other uses covered by the existing "all other uses" rate in the adopted CIL Charging Schedule (education, health and related facilities) should continue to be nil rated.
7.8 Our testing indicates that the increase in CIL rates will have a relatively modest impact on residual land values in most cases. Where it is not possible to pass the cost of increased CIL rates back to the landowner through a reduction in land value (for example, due to high existing use values), the increase will have a modest impact on affordable housing levels that can be delivered. However, increases in sales values since the last Charging Schedule was formulated have outstripped increases in costs, which has resulted in improvements in viability and enhanced capacity for absorbing CIL requirements. The sensitivity analysis at Appendix 4 indicates that if forecast growth and cost inflation reflect outturn values, there will be a further enhancement in viability and an increased margin between the proposed rates and the theoretical maximum rates.
7.9 There is clearly a need to balance the need to deliver affordable housing with the need to secure contributions to fund community infrastructure that will support development and growth. The Council cannot seek to prioritise securing affordable housing to the exclusion of securing funding for infrastructure and vice versa. In our view, the proposed rates strike this balance appropriately.
7.10 The Council needs to strike a balance between achieving its aim of meeting needs for affordable housing with raising funds for infrastructure, and ensuring that developments generate acceptable returns to willing landowners and willing developers. This study demonstrates that the Council's flexible approach to applying its affordable housing requirements ensures that these objectives are balanced appropriately.
Additional observations
7.11 Viability measured in present value terms is only one of several factors that determine whether a site is developed. Developers need to maintain a throughput of sites to ensure their staff are utilised and they can continue to generate returns for their shareholders. Consequently, small adjustments to residual land values resulting from changes to CIL rates can be absorbed in almost all circumstances by developers taking a commercial view on the impact. However, in most cases the impact on land value is sufficiently modest that this can be passed onto the land owner at the bid stage without adversely impacting on the supply of land for development.
7.12 In most cases, the changes in residual land values required to accommodate the increased CIL rates is very modest and the CIL itself accounts for a very small proportion of overall development costs (typically well below 5%). The imposition of CIL is therefore not the critical factor in determining whether or not a scheme will come forward.
7.13 In considering the outputs of the appraisals, it is important to recognise that some developments will be unviable regardless of the Council's requirements. In these cases, the value of the existing building will be higher than a redevelopment opportunity over the medium term. However, this situation should not be taken as an indication of the viability (or otherwise) of the Council's policies and requirements.
7.14 It is critical that developers do not over-pay for sites such that the value generated by developments is paid to the landowner, rather than being used to provide affordable housing. The Council should work closely with developers to ensure that landowners' expectations of land value are appropriately framed by the local policy context and adjusted for the proposed CIL rates. There may be instances when viability issues emerge on individual developments, even when the land has been purchased at an appropriate price (e.g. due to extensive decontamination requirements). In these cases, some flexibility in relation to other planning requirements may be required subject to submission of a robust site-specific viability assessment.
7.15 This study demonstrates that the proposed increase to the CIL charges and the Council’s flexible approach to applying policy requirements will ensure an appropriate balance between delivering affordable housing, sustainability objectives, necessary infrastructure and the need for landlords and developers to achieve a return in line with the NPPF.

66
Appendix 1 - Policy review

67
Policy Number Summary of Requirement Cost implications
CS1 Barnet’s place shaping strategy – three strands approach
Barnet’s place shaping strategy is to concentrate and consolidate housing and economic growth in well located areas that provide opportunities for development, creating a quality environment that will have positive economic impacts on the deprived neighbourhoods that surround them. The key diagram sets out the areas where we expect housing and economic growth. The council, along with its partners, will focus major housing and economic growth in the most suitable locations and manage it to ensure that we deliver sustainable development, while continuing to conserve and enhance the distinctiveness of Barnet as a place to live work and visit. An appropriate level of transport provision will be provided as the regeneration schemes roll out. We will seek the highest standards of urban design in order to generate development proposals of landmark quality and create an accessible safe and attractive environment for people who live in, work in or visit Barnet’s areas of housing and economic growth. We will only support proposals for tall buildings in the strategic locations we have identified in Core Strategy Policy CS5 subject to them not having an unacceptably harmful impact on their surroundings. We will work with partners and other relevant organisations to secure ‘critical’, ‘necessary’ and ‘preferred’ infrastructure as set out in Barnet’s Infrastructure Delivery Plan and ensure that new development funds infrastructure through S106 and other funding mechanisms. As our focus of housing and employment growth we will promote opportunities on the west side of the borough in the strategically identified North West London – Luton Coordination Corridor. We will promote the following regeneration and development areas in the west of the borough: ■ Brent Cross – Cricklewood regeneration area - 5,510 new
homes by 2026 ■ Colindale regeneration area - 8,100 new homes by 202615 ■ Mill Hill East development area – 2,100 new homes by 2026 Core Strategy Policy CS 3 sets out the areas where we expect : In the range of 22,000 new homes to be delivered between 2011/12 and 2021/22 to meet the ten-year housing target in the London Plan In the range of 28,000 new homes to be delivered between 2011/12 and 2025/26 as Barnet’s 15 year housing target Core Strategy Policy CS 4 sets out our aim to create successful communities by providing quality homes and housing choice Consolidated growth will be complemented by: Protection of ■ Green Belt and Metropolitan Open Land that covers over one
third of Barnet ■ Core Strategy Policy CS 5 sets out how we will ensure that
development helps to protect and enhance Barnet’s heritage and character
■ Core Strategy Policy CS 7 sets out how in order to create a greener Barnet we will enhance and protect our open spaces
Enhancement of ■ priority town centres (Chipping Barnet, Edgware, Finchley
Church End and North Finchley) where we will promote mixed use development in accordance with the place making policies set out within the Core Strategy;
■ the historic suburban environment comprising 16 conservation areas, over 2,200 listed buildings and registered historic parks and gardens
■ Core Strategy Policy CS5 sets out how we will, through Residential Design Guidance SPD, develop a framework to protect and enhance those high quality suburbs not protected by conservation area designation.
■ Core Strategy Policy CS 6 sets out how we will realise development opportunities in town centres in order to promote them as successful and vibrant places
■ Core Strategy Policy CS 8 sets out how in order to provide opportunity for economic advancement we will ensure a strong and prosperous Barnet
No direct costs for development. Mainly deals with land use issues.
CS2 Brent Cross Cricklewood
Brent Cross – Cricklewood is identified as an Opportunity Area in the London Plan and on Map 5. It will be a major focus for the creation of new jobs and homes, building upon the area’s strategic location and
Facilitates high density development in the opportunity areas which

68
Policy Number Summary of Requirement Cost implications
its key rail facilities. We will seek comprehensive redevelopment of Brent Cross – Cricklewood in accordance with the London Plan, the saved UDP policies (Chapter 12) and the adopted Development Framework. This will provide the key elements of the local planning policy framework for deciding future planning applications unless and until replaced by new DPD or SPD as a result of the Local Plan Monitoring and review process. It is considered likely that comprehensive regeneration will be achieved in accordance with the planning permission. If this proves unlikely then we will consider whether in the circumstances the Local Plan needs to be reviewed. Specific monitoring indicators for Brent Cross – Cricklewood are set out in Appendix B and we will have regard to them in monitoring the progress made in the implementation and delivery of regeneration, including the achievement of important milestones (as set out in Appendix B) towards the initiation of development described in the information box on Brent Cross – Cricklewood. It is anticipated that the BXC Development Partners are committed to progressing the project as quickly as reasonably practicable towards commencement of the development subject to securing the necessary planning approvals, highways orders and site assembly. On the basis of these indicators we expect that comprehensive re-development will commence in relation to Phase 1 at some time between 2015 and 2017. If in the light of progress made in securing pre-commencement approvals and other related procedures as well as actual delivery of the development these milestones are not achieved (or are not likely to be capable of being delivered) we will consider the possible need for a review of the Core Strategy policy on Brent Cross – Cricklewood in the light of progress that is being made in delivering this important strategic project. The key milestone for the regeneration of Brent Cross – Cricklewood is likely to be the Phase 1 Compulsory Purchase Order (CPO). If by the end of 2014 any CPO that is required to deliver Phase 1 and commence the development has not been made and submitted for confirmation we will instigate a review of the policy framework for Brent Cross – Cricklewood. The form of the review will be set out in a revision to the Local Development Scheme. This may involve the review of the Core Strategy and may if necessary or appropriate lead to introduction of new DPD or SPD to further guide and control the comprehensive regeneration of the Brent Cross – Cricklewood area.
will drive higher residual land values.
CS3 Distribution of growth in meeting housing aspirations
On the basis of our Three Strands Approach we expect that in the range of 28,000 new homes will be provided within the lifetime of this Core Strategy 2011/12 to 2025/26. As our focus of growth we will promote opportunities on the west side of the borough in the strategically identified North West London – Luton Coordination Corridor. We will promote the following regeneration and development areas in the Corridor: ■ Brent Cross - Cricklewood ■ Colindale ■ Mill Hill East These areas are expected to provide in the range of 16,000 new homes between 2011/12 to 2025/26. An appropriate level of transport provision will be provided as the regeneration schemes roll out. We will, in order to meet the Decent Homes standard, and deliver a greater range and variety of accommodation, also promote the regeneration of priority housing estates at: ■ Dollis Valley ■ Stonegrove and Spur Road ■ West Hendon ■ Grahame Park19 ■ Granville Road These areas are expected to provide in the range of 2,200 new homes between 2011/12 to 2025/26. We will also promote the development area of the North London Business Park and Oakleigh Road South in order to develop in the range of 400 new homes by 2020/21 as part of a mixed use development in accordance with the adopted Planning Brief of June 2006. Through the regeneration and development areas, regeneration estates and town centres housing
Land use issue only – directs growth and housing delivery to certain areas. No cost implications for developments.

69
Policy Number Summary of Requirement Cost implications
will be provided in the following 5 year phases as set out in Table 3. Figures are net additions. 2011/12 to 2015/16 ■ Brent Cross – Cricklewood 410 new homes ■ Colindale 4,500 new homes ■ Mill Hill East 930 new homes ■ North London Business Park 150 new homes ■ Priority Estates of ■ Dollis Valley 150 new homes ■ Granville Road 140 new homes ■ Stonegrove and Spur Road; 100 new homes ■ West Hendon 450 new homes TOTAL 6,830 new homes 2016/17 to 2020/21 ■ Brent Cross - Cricklewood 1,800 new homes ■ Colindale 3,320 new homes ■ Mill Hill East 1,000 new homes ■ North London Business Park 250 new homes ■ Priority Estates of ■ Dollis Valley 30 new homes ■ Stonegrove and Spur Road; 190 new homes ■ West Hendon 450 new homes TOTAL 7,040 new homes 2021/22 to 2025/26 ■ Brent Cross - Cricklewood 3,300 new homes ■ Colindale 300 new homes ■ Mill Hill East 200 new homes ■ Priority Estates of ■ West Hendon 640 new homes TOTAL 4,400 new homes Through a programme of town centre strategies we will develop frameworks for the town centres of Chipping Barnet, Edgware, Finchley Church End and North Finchley. These locations will provide the main focus for enhancement and infill housing development: and will provide for residential uses above ground floor level Our strategic approach on further development opportunity sites will be set within the context of the density matrix in the London Plan. We will seek to optimise rather than simply maximise housing density to reflect local context, public transport accessibility and provision of social infrastructure.
CS4 Providing quality homes and housing choice in Barnet
We will aim to create successful communities in Barnet by: ■ seeking to ensure a mix of housing products in the affordable
and market sectors to provide choice for all households and enable Barnet residents to progress on a housing journey that can meet the aspirations of home ownership
■ seeking to ensure that all new homes are built to Lifetime Homes Standards and that through extending the inclusive design principles embedded in Lifetime Homes we can create Lifetime Neighbourhoods that are welcoming, accessible, and inviting for everyone, regardless of age, or health, or disability.
■ seeking a range of dwelling sizes and types of housing including family and lifetime homes that meets our identified housing priorities and does not undermine suburban character or local distinctiveness. Policy CS 5 on Protecting and Enhancing Barnet’s Character to Create High Quality Places sets out how we will secure high quality design.
■ seeking a variety of housing related support options that maximise the independence of vulnerable residents including young people, people with disabilities, older people, homeless people and other vulnerable adults
■ delivering a minimum affordable housing target of 5,500 new affordable homes by 2025/26 and seeking a boroughwide target of 40% affordable homes on sites capable of accommodating ten or more dwellings
■ seeking an appropriate mix of affordable housing of 60% social rented and 40% intermediate for Barnet that will support our
Affordable housing requirement reflected in appraisals.

70
Policy Number Summary of Requirement Cost implications
objectives of widening home ownership and providing family homes
■ on sites which are suitable for the provision of an element of affordable housing, we may exceptionally accept the provision of off-site housing, or a commuted payment instead of such provision
■ Proposals for sites for Gypsies and Travellers and Travelling Showpeople must have regard to the following criteria:
■ close proximity to a main road and safe access to the site with adequate space on site to allow for the manoeuvring of vehicles
■ reasonable access to local shops and other community facilities in particular, schools and health care
■ the scale of the site is in keeping with local context and character
■ appropriate landscaping and planting to address impact on amenity and enable integration of the site with the surrounding environment
■ any use on the site does not have any unacceptable adverse impacts on neighbouring residents
■ appropriate facilities must be provided on-site including water and waste disposal
Within the Site Allocations DPD we will seek to identify land to meet the long term needs of Gypsies and Travellers and Travelling Showpeople based on an evidence base of the range of pitches/plots required in Barnet. We will monitor the delivery of additional housing against our target of 28,000 new homes by 2025/26 and will seek to maintain supply at the rate necessary to meet or exceed the target. In seeking to maintain the housing supply we will adjust the type and mix of housing sought, having regard to the financial viability of development, the housing market and the needs of different groups.
CS5 Protecting and enhancing Barnet’s character to create high quality places
We will ensure that development in Barnet respects local context and distinctive local character creating places and buildings of high quality design. Developments should: ■ address the principles, aims and objectives set out in the
following national design guidance: ■ By Design, Secured by Design, Safer Places, Inclusive Design,
Lifetime Homes and Building for Life: ■ be safe, attractive and fully accessible ■ provide vibrant, attractive and accessible public spaces ■ respect and enhance the distinctive natural landscapes of
Barnet ■ protect and enhance the gardens of residential properties ■ protect important local views from places within Barnet (as set
out in Map 8) ■ enhance the borough’s high quality suburbs and historic areas
through the provision of buildings of the highest quality that are sustainable and adaptable
All development should maximise the opportunity for community diversity, inclusion and cohesion and should contribute to people’s sense of place, safety and security. Heritage and Character We will work with partners to proactively protect and enhance Barnet’s heritage including conservation areas, listed buildings, locally listed buildings, registered parks and gardens; scheduled monuments, areas of archaeological significance and London’s only battlefield site. We will require proposals within or affecting the setting of heritage assets to provide a site assessment which demonstrates how the proposal will respect and enhance the asset. Policy CS 13 addresses the adaptation of heritage assets to reduce carbon emissions and ensure efficient use of natural resources. We will ensure through our programme of Conservation Area Character Appraisals that these areas are protected and enhanced. We will ensure through our Green Infrastructure SPD that the key characteristics of Barnet’s landscape (Barnet Plateau and Finchley Ridge) are protected and enhanced We will encourage community involvement in the review of the Local List of important local buildings The Barnet Characterisation Study forms the baseline for the identification of places with a consistent and coherent architectural
Standard design requirements reflected in London Plan. Restrictions on height reflected in development typologies.

71
Policy Number Summary of Requirement Cost implications
character. Within the typologies identified in the Characterisation Study we will through our Development Management Policies DPD and Residential Design Guidance SPD develop a framework to protect and enhance those high quality suburbs in Barnet not protected by Conservation Area designations. Tall Buildings Tall buildings (8 storeys (or 26 metres) or more) may be appropriate in the following strategic locations: Brent Cross – Cricklewood Regeneration Area Colindale – Colindale Avenue Corridor of Change, Edgware Road Corridor of Change (in accordance with Policy 5.3 Building Heights in the Colindale Area Action Plan, 2010) Grahame Park Estate Stonegrove and Spur Road Estate West Hendon Estate And the Priority Town Centres of Edgware Finchley Church End and North Finchley ■ Proposals for tall buildings will be considered in accordance with
DM 05 – Tall Buildings, London Plan Policy 7.7 – Location and Design of Tall and Large Buildings and Guidance on Tall Buildings (2007) by English Heritage and CABE
■ Outside of these specific locations, proposals for tall buildings will not be supported
CS6 Promoting Barnet’s Town Centres
In order to promote competitive town centre environments and provide consumer choice, we will realise development opportunities for the town centres of Edgware, North Finchley, Finchley Church End, and Chipping Barnet. We will pursue the individual planning objectives for each centre as set out in their Town Centre Frameworks and ensure the delivery of environmental, design, transport, car parking and community safety measures. Development in these town centres will reflect the preferred sequential approach in the National Planning Policy Framework (para 24). ■ we will promote successful and vibrant centres throughout
Barnet to serve the needs of residents, workers and visitors and ensure that new development is of an appropriate scale and character for the centre in which it is located
■ we will promote the distribution of retail growth to meet the capacity for an additional 2,200 m2 (net) of convenience goods floorspace across Barnet by 2021 -2026. The majority of the convenience capacity arises in the East sub-area (centred on the District Centre of North Finchley) and West sub-area (centred on the Major Centre of Edgware) beyond 2016. We will therefore not plan further significant convenience goods provision before 2026
■ we will promote the distribution of retail growth to meet the capacity for an additional 16,800 m2 (net) of comparison goods floorspace across Barnet by 2021 -2026. The majority of this capacity arises in the East, West and South West sub-areas. On basis of continued expenditure growth we will in addition support comparison goods provision in Edgware, North Finchley and Chipping Barnet
■ we will ensure that food, drink, entertainment uses as part of a healthy evening economy in our town centres do not have a harmful effect on residents and the local area
■ we will ensure the efficient use of land and buildings in all town centres, encouraging a mix of compatible uses including retail, managed affordable and flexible workspace, leisure and residential that add to the vibrancy of the area whilst respecting character
■ we will take a planned approach to manage development opportunities in Golders Green, Whetstone and New Barnet and through our Site Allocations DPD promote development opportunities in our smaller District Centres at Burnt Oak, Colindale – the Hyde and Cricklewood that enhance the overall attractiveness of these centres.
■ We will pursue further opportunities for town centre enhancement at smaller centres that attract private sector investment or have been highlighted for priority action
Land use issues only

72
Policy Number Summary of Requirement Cost implications
■ we will, in order for them to compete with other centres and particularly out of centre retail parks and shops, support retail uses in town centres by improvements to the public realm, the public transport network, short-trip parking and accessibility by cyclists and pedestrians. We will promote investment in the historic environment of town centres
■ we will seek to protect and enhance more ‘local’ neighbourhood centres and parades of shops in terms of their potential contribution to sustainable suburbs and shopping; and
■ we will seek to protect existing markets as part of the retail offer of Burnt Oak, Chipping Barnet and North Finchley town centres and, where appropriate, use S106 contributions to ensure the provision of 'affordable shops' in new retail development.
Brent Cross / Cricklewood ■ In order to create a distinct and attractive business offer we will
promote Brent Cross/Cricklewood as a new metropolitan town centre and an Outer London Development Centre through mixed use regeneration which delivers a net addition of 55,000m2 of gross comparison floorspace in town centre north and 370,000 m2 of office floorspace as part of a mix of uses that accords with the London Plan and the saved suite of UDP Policies on Brent Cross- Cricklewood. Brent Cross does not currently perform as wide a range of functions as a typical town centre. Any substantial future extension or redevelopment should be linked to an enhanced role for public transport to serve its catchment area and should make a positive contribution to encouraging a modal shift from car use to public transport. We will expect any substantial extension of Brent Cross and redevelopment of its immediate environs to :
■ complement the role of Brent Cross as a new metropolitan town centre and an Outer London Development Centre; and
■ to contribute to the balanced regeneration of the Brent Cross / Cricklewood Regeneration Area.
CS7 Enhancing and protecting Barnet’s open spaces
In order to maximise the benefits that open spaces can deliver and create a greener Barnet we will work with our partners to improve Barnet’s Green Infrastructure. We will create a greener Barnet by: ■ protecting open spaces, including Green Belt and Metropolitan
Open Land ■ enhancing open spaces, ensuring positive management of
Green Belt and Metropolitan Open Land to provide improvements in overall quality and accessibility
■ ensuring that the character of green spaces of historic significance is protected
■ meeting increased demand for access to open space and opportunities for physical activity, by tackling deficiencies and under provision through:
■ securing additional on-site open space or other open space improvements in the identified growth areas including 8 ha of new provision at Brent Cross – Cricklewood, 5.5 ha of new provision at Mill Hill East and 5 ha at Colindale
■ improving access to open spaces particularly in North and East Finchley and other areas of public open space deficiency identified by Map 10. We will seek to improve provision in these areas of deficiency with the objective of increasing the area of the borough that has access to district and local parks in accordance with the London Plan criteria
■ securing improvements to open spaces including provision for children’s play, sports facilities and better access arrangements, where opportunities arise, from all developments that create an additional demand for open space. Standards for new provision are set out in DM 15 – Green Belt and Open Spaces
■ maintaining and improving the greening of the environment through the protection of incidental greenspace, trees, hedgerows and watercourses enabling green corridors to link Barnet’s rural, urban fringe and urban green spaces
■ protecting existing Sites of Importance for Nature Conservation and working with our partners including the London Wildlife Trust to improve protection and enhancement of biodiversity in Barnet
No costs for development beyond CIL contributions. On-site open space allowed for in quantum of development assumed on each development typology.

73
Policy Number Summary of Requirement Cost implications
■ ensuring that development protects existing site ecology and makes the fullest contributions to enhancing biodiversity, both through on-site measures and by contribution to local biodiversity improvements; and
■ enhancing local food production through the protection of allotments and support for community food growing including the Mayor’s Capital Growth Initiative
In supporting new Green Infrastructure we will: ■ set out an approach to improving the network of green spaces
within the Green Infrastructure SPD ■ as part of the All London Green Grid work with neighbouring
authorities to establish Area Frameworks as the basis for identification, creation and management of new green spaces as part of: ■ Lea Valley and Finchley Ridge Green Grid Area ■ Brent Valley and Barnet Plateau Green Grid Area
Reflect the policies and objectives in the Watling Chase Forest Plan when assessing development proposals in the area covered by the Community Forest
CS8 Promoting a strong and prosperous Barnet
The council and its partners will ensure a strong and prosperous Barnet that provides opportunity for economic advancement. We will support Barnet residents in accessing work by: ■ Delivering 1,500 new jobs in our growth areas of Colindale and
Mill Hill East by 2021 and a total of 20,000 new jobs in Brent Cross-Cricklewood by 2026
■ Attracting business growth as part of Brent Cross - Cricklewood with further provision in the other growth areas and town centres to meet the forecast demand for business space of 13.5 ha (161,000m2) by 2026
■ requiring major developments to provide financial contributions and to deliver employment and training initiatives in consultation with the Skills Development and Employability Group;
■ working in partnership with the Skills Development and Employability Group in delivering the skills agenda required for a growing borough in a successful London suburb
We will support businesses by: ■ safeguarding existing employment sites that meet the needs of
modern business in accordance with Policy DM14 New and Existing Employment Space.
■ encouraging development that improves the quality of existing employment provision
■ encouraging new mixed use commercial floorspace in our priority town centres (Edgware, North Finchley, Finchley Church End and Chipping Barnet) where access to public transport is good
■ in order to support small to medium sized enterprises new employment provision should include a range of unit sizes and types such as affordable and flexible workspaces and home working hubs
■ through the Skills Development and Employability Group building an understanding about the experience of local businesses and their skills needs
■ encouraging partnership working between providers of further and higher education and local business
We will support providers of further and higher education by: ■ encouraging the provision of new and improved facilities within
Barnet and ■ encouraging the provision of further and higher education
programmes, skills training and continuing professional development programmes, business support initiatives and applied research
No cost implications for development; employment and skills requirements can be delivered through on-site apprenticeships and similar initiatives
CS9 Providing safe, effective and efficient travel
We will promote the delivery of appropriate transport infrastructure in order to support growth, relieve pressure on Barnet's transport network and reduce the impact of travel whilst maintaining freedom and ability to move at will. We will ensure that new development funds infrastructure (through Community Infrastructure Levy (CIL), Section 106 and other funding mechanisms) that enables Barnet to keep the existing traffic moving and cope with new movements both by all modes of transport.
Contributions towards public transport infrastructure will in the main be addressed through CIL.

74
Policy Number Summary of Requirement Cost implications
Ensuring more efficient use of the local road network ■ In order to enable traffic to flow more smoothly we will prioritise
the reduction of congestion, including through encouraging trips to route according to the road hierarchy, the implementation of development related schemes that also address pinch-points, a review of traffic signals, parking management measures and more efficient freight movements.
■ We will continue to invest in improvements to the condition of roads and footways in the borough to ensure that the local road network operates efficiently and safely, and seek to improve co-ordination of maintenance and utility works
■ We will continue to manage a parking regime which recognises that many Barnet residents will continue to own and travel by car
■ We will work with TfL to review and improve the bus network ■ We will continue to make travel safer and more attractive by
improving street lighting, security coverage and accessibility at transport interchanges and around bus stops as well as delivering, where resources permit, targeted local safety schemes.
Taking a comprehensive approach to tackling the school run ■ We will seek to improve the effectiveness of our School Travel
Plans to achieve a greater reduction in car based journeys and increase levels in walking and cycling to and from school
■ We will implement complementary traffic management schemes outside schools, including preventing pupil parking
Delivery of high quality transport systems in regeneration areas and town centres We will ensure that development is matched to capacity and promote key transport infrastructure proposals in our town centres and regeneration areas to support Barnet’s growth, in particular we will: ■ pursue housing and commercial growth in the areas outlined in
CS1 (Barnet’s Place Shaping Strategy - the Three Strands Approach), CS3 (Distribution of Growth in Meeting Housing Aspirations), and CS 6 (Promoting Barnet’s Town Centres).
■ ensure major planning proposals incorporate Transport Assessments, Travel Plans, Delivery and Servicing Plans, mitigation measures and S106 contributions / planning conditions and that adequate capacity and high quality safe transport facilities are delivered in line with demand for schemes that have phased delivery programmes
■ deliver with partners ■ high quality public transport improvements along the A5
corridor ■ bus service enhancements as part of regeneration
schemes, particularly at BXC and Colindale, including a new state of the art bus station as part of the redevelopment of the Brent Cross Shopping Centre and better bus services connecting these two key areas in Barnet
■ a Rapid Transit Bus Service at BXC - a dedicated bus service system which will link the key interchanges and destinations in the growth area
■ we will promote public transport provision that supports access to health services and is accessible to people with physical or sensory impairment including
a new step-free rail station at BXC together with improvements to Brent Cross underground and Cricklewood train stations ■ we will promote major improvements to the strategic road
network, especially the A406 (North Circular Road) at Staples Corner and the A41 interchanges, and in the long term Golders Green Road and Henly’s Corner
■ we will promote through Town Centre Frameworks and other planned approaches town centre development opportunities and enhancement programmes to improve the public realm, public transport services, and interchange, short-trip making by walking, parking and servicing controls and accessibility improvements
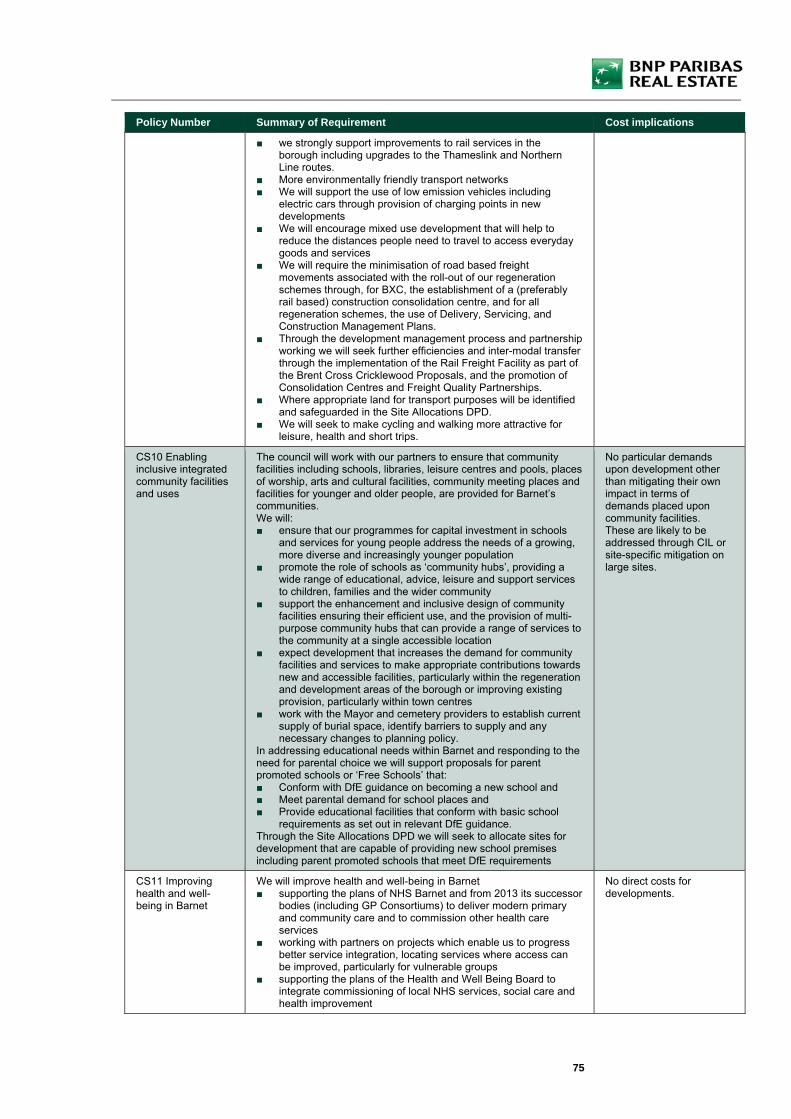
75
Policy Number Summary of Requirement Cost implications
■ we strongly support improvements to rail services in the borough including upgrades to the Thameslink and Northern Line routes.
■ More environmentally friendly transport networks ■ We will support the use of low emission vehicles including
electric cars through provision of charging points in new developments
■ We will encourage mixed use development that will help to reduce the distances people need to travel to access everyday goods and services
■ We will require the minimisation of road based freight movements associated with the roll-out of our regeneration schemes through, for BXC, the establishment of a (preferably rail based) construction consolidation centre, and for all regeneration schemes, the use of Delivery, Servicing, and Construction Management Plans.
■ Through the development management process and partnership working we will seek further efficiencies and inter-modal transfer through the implementation of the Rail Freight Facility as part of the Brent Cross Cricklewood Proposals, and the promotion of Consolidation Centres and Freight Quality Partnerships.
■ Where appropriate land for transport purposes will be identified and safeguarded in the Site Allocations DPD.
■ We will seek to make cycling and walking more attractive for leisure, health and short trips.
CS10 Enabling inclusive integrated community facilities and uses
The council will work with our partners to ensure that community facilities including schools, libraries, leisure centres and pools, places of worship, arts and cultural facilities, community meeting places and facilities for younger and older people, are provided for Barnet’s communities. We will: ■ ensure that our programmes for capital investment in schools
and services for young people address the needs of a growing, more diverse and increasingly younger population
■ promote the role of schools as ‘community hubs’, providing a wide range of educational, advice, leisure and support services to children, families and the wider community
■ support the enhancement and inclusive design of community facilities ensuring their efficient use, and the provision of multi-purpose community hubs that can provide a range of services to the community at a single accessible location
■ expect development that increases the demand for community facilities and services to make appropriate contributions towards new and accessible facilities, particularly within the regeneration and development areas of the borough or improving existing provision, particularly within town centres
■ work with the Mayor and cemetery providers to establish current supply of burial space, identify barriers to supply and any necessary changes to planning policy.
In addressing educational needs within Barnet and responding to the need for parental choice we will support proposals for parent promoted schools or ‘Free Schools’ that: ■ Conform with DfE guidance on becoming a new school and ■ Meet parental demand for school places and ■ Provide educational facilities that conform with basic school
requirements as set out in relevant DfE guidance. Through the Site Allocations DPD we will seek to allocate sites for development that are capable of providing new school premises including parent promoted schools that meet DfE requirements
No particular demands upon development other than mitigating their own impact in terms of demands placed upon community facilities. These are likely to be addressed through CIL or site-specific mitigation on large sites.
CS11 Improving health and well-being in Barnet
We will improve health and well-being in Barnet ■ supporting the plans of NHS Barnet and from 2013 its successor
bodies (including GP Consortiums) to deliver modern primary and community care and to commission other health care services
■ working with partners on projects which enable us to progress better service integration, locating services where access can be improved, particularly for vulnerable groups
■ supporting the plans of the Health and Well Being Board to integrate commissioning of local NHS services, social care and health improvement
No direct costs for developments.

76
Policy Number Summary of Requirement Cost implications
■ supporting healthier neighbourhoods through targeting of unhealthy lifestyles such as smoking and those which cause obesity and addressing health inequalities in terms of ill health and access to health facilities as identified in the Joint Strategic Needs Assessment
■ supporting the remodelling of residential care homes to other forms of special accommodation in order to widen housing choice, support healthy and independent lives and to reduce over supply
■ Ensuring that vulnerable residents benefit from housing choice and that additional residential care home provision only supported when evidence of local need can be demonstrated and that the proposal addresses the priorities of NHS Barnet or its successor bodies, and the Council’s Adult Social Services
■ Ensuring increased access to Barnet’s green spaces and opportunities for higher levels of physical activity through the Green Infrastructure SPD
CS12 Making Barnet a safer place
We will aim to make Barnet a safer place. It is important that we ensure through the management of growth that Barnet is a place where people from different communities get on together. We will: ■ work with our partners to tackle crime, fear of crime and anti-
social behaviour; ■ work with the Metropolitan Police to provide re-modelling of its
estate as a basis for an effective and responsive police service in Barnet;
■ work with Her Majesty’s Court Service as it reviews its estate to ensure that it best meets needs for modern court facilities;
■ support the work of neighbourhood policing teams to make our neighbourhoods safer places to live in, work in and visit;
■ encourage appropriate security and community safety measures in buildings, spaces and the transport system;
■ require developers to demonstrate that they have incorporated design principles which contribute to community safety and security in all new development;
■ ensure that through the town centre strategy programme we promote safer and more secure town centre environments; and
■ promote safer streets and public areas including open spaces.
Reflects normal design standards for schemes.
CS13 Ensuring the efficient use of natural resources
We will seek to minimise Barnet’s contribution to climate change and ensure that through the efficient use of natural resources the borough develops in a way which respects environmental limits and improves quality of life. ■ We will promote the highest environmental standards for
development and through our SPDs on Sustainable Design and Construction and Green Infrastructure we will continue working to deliver exemplary levels of sustainability throughout Barnet in order to mitigate and adapt to the effects of a changing climate
■ We will expect all development to be energy-efficient and seek to minimise any wasted heat or power.
■ In line with London Plan Policy 5.2 – Minimising Carbon Dioxide Emissions we will expect major development in accordance with the Mayor’s energy hierarchy to reduce carbon dioxide emissions beyond the 2010 Building Regulations.
■ We will maximise opportunities for implementing new district-wide networks supplied by decentralised energy (including renewable generation) in partnership with key stakeholders in areas of major mixed use growth including town centres. Where feasible we will expect all development to contribute to new and existing frameworks
■ We will support solutions that minimise or avoid harm to a heritage asset’s significance while delivering improved energy performance or generation.
■ We will make Barnet a water efficient borough and minimise the potential for fluvial and surface flooding by ensuring development does not cause harm to the water environment, water quality and drainage systems. Development should utilise Sustainable Urban Drainage Systems (SUDS) in order to reduce surface water run-off and ensure such run-off is managed as close to its source as possible subject to local geology and ground water levels.
Additional costs reflected in assessment.

77
Policy Number Summary of Requirement Cost implications
■ We will improve air and noise quality by requiring Air Quality Assessments and Noise Impact Assessments from development in line with Barnet's SPD on Sustainable Design and Construction
CS14 Dealing with our waste
We will encourage sustainable waste management by: ■ promoting waste prevention, re-use, recycling, composting and
resource efficiency over landfill ■ requiring developments to provide waste and recycling facilities
which fit current and future collection practices and targets ■ designating sites through the NLWP to meet an aggregated
apportionment target across the seven North London boroughs. These sites will be the principle locations considered suitable for waste facilities
■ safeguarding all existing waste facilities in Barnet including a Waste Management Facility in the Brent Cross - Cricklewood Regeneration Area.
Requires developments to provide waste and recycling facilities but this is now a standard design feature.
CS15 Delivering the Core Strategy
We will work with the Local Strategic Partnership (One Barnet Partnership Board) and other partners to deliver the vision, objectives and policies of this Core Strategy. We will: ■ Utilise the Infrastructure Delivery Plan to improve understanding
of current and future assets and their long term investment and management
■ work with relevant providers and developers to ensure that necessary infrastructure is secured and delivered in time to support Barnet's consolidated growth and development and provide the facilities needed for the borough's communities.
■ use planning obligations where appropriate alongside other suitable funding mechanisms to support the delivery of infrastructure, facilities and services to meet needs generated by development and mitigate the impact of development;
■ work with neighbouring boroughs to co-ordinate delivery across boundaries; and
■ monitor the implementation of the Core Strategy and publish the results in our Annual Monitoring Report.
No cost issues beyond CIL and planning obligations (the latter required to meet the tests set out in CIL Regulation 122)

78
Policy Number Summary of Requirement Cost implications
DM01: Protecting Barnet’s character and amenity
a. All development should represent high quality design which demonstrates high levels of environmental awareness and contributes to climate change mitigation and adaptation. b. Development proposals should be based on an understanding of local characteristics. Proposals should preserve or enhance local character and respect the appearance, scale, mass, height and pattern of surrounding buildings, spaces and streets. c. Development proposals should ensure attractive, safe and, where appropriate, vibrant streets which provide visual interest, particularly at street level and avoid blank walls. d. Development proposals should create safe and secure environments and reduce opportunities for crime and minimise the fear of crime. e. Development proposals should be designed to allow for adequate daylight, sunlight, privacy and outlook for adjoining and potential occupiers and users. f. Development proposals for lighting schemes should not have a demonstrably harmful impact on residential amenity or biodiversity. g. Development proposals should retain outdoor amenity space having regard to its character. h. Conversion of dwellings into flats in roads characterised by houses will not normally be appropriate i. Loss of houses in roads characterised by houses will not normally be appropriate j. Development proposals will be required to include hard and soft landscaping that: i. Is well laid out in terms of access, car parking and landscaping ii. Considers the impact of hardstandings on character iii. Achieve a suitable visual setting for the building iv. Provide an appropriate level of new habitat including tree and shrub planting v. Make a positive contribution to the surrounding area vi. Contributes to biodiversity including the retention of existing wildlife habitat and trees vii. Adequately protects existing trees and their root systems k. Trees should be safeguarded. When protected trees are to be felled the council will require replanting with suitable size and species of tree where appropriate.
Standard requirements for well-designed development. Level of professional fees included in appraisals reflects fees for good standard of architectural design. Some policies are land use issues only and will prevent some sites being redeveloped. No cost issues to be considered in appraisals.
DM02: Development standards
Where appropriate, development will be expected to demonstrate compliance with the following national and Londonwide standards supported by the guidance set out in the council’s suite of Supplementary Planning Documents: 1. By Design, the CABE urban design principles 2. Lifetime homes, the 16 design criteria required by the London Plan policy 3.8 3. Code for Sustainable Homes, the national standard for sustainable homes 4. BREEAM, the environmental assessment method for non-residential development 5. Wheelchair accessibility, the London Plan policy 3.8 6. Minimum floor space, the London Plan policy 3.5 7. Outdoor amenity space, the Sustainable Design and Construction SPD 8. Secured by Design, the national Police initiative 9. Play space, the London Plan policy 3.6
Draft New London Plan requirements reflected in the appraisals.
DM03: Accessibility and inclusive design
Development proposals should meet the highest standards of accessible and inclusive design by demonstrating that they meet the following principles: i. can be used safely, easily and with dignity by all regardless of disability, age, gender, ethnicity or economic circumstances ii. are convenient and welcoming with no disabling barriers, so everyone can use them independently without undue effort, separation or special treatment iii. are flexible and responsive taking account of what different people say they need and want, so people can use them in different ways iv. are realistic, offering more than one solution to help balance everyone’s needs, recognising that one solution may not work for all.
Latest accessibility standards reflected in the appraisals.
DM04: Environmental Considerations
a. All major development will be required to demonstrate through an Energy Statement compliance with the Mayor’s targets for reductions in carbon dioxide emissions within the framework of the Mayor’s
Draft New London Plan requirements reflected in the appraisals.

79
Policy Number Summary of Requirement Cost implications
energy hierarchy. b. Where Decentralised Energy (DE) is feasible or planned, major development will either provide: i.suitable connection ii. the ability to connect in future iii.a feasibility study iv.a financial contribution to a proposed feasibility study. c. i. Where there is a localised source of air pollution, buildings should be designed and sited to reduce exposure to air pollutants. ii. Development proposals will ensure that development is not contributing to poor air quality and provide air quality assessments where appropriate. d. Proposals to locate development that is likely to generate unacceptable noise levels close to noise sensitive uses will not normally be permitted. Proposals to locate noise sensitive development in areas with existing high levels of noise will not normally be permitted. Mitigation of noise impacts through design, layout, and insulation will be expected where appropriate. e. Proposals on land which may be contaminated should be accompanied by an investigation to establish the level of contamination in the soil and/or groundwater/surface waters and identify appropriate mitigation. Development which could adversely affect the quality of groundwater will not be permitted. f. Proposals for Notifiable Installations or developments near to existing Notifiable Installations will only be permitted provided that: i. There is no unacceptable risk to an individual’s health and safety; and ii. There will be no significant threat to environmental quality. g. Development should demonstrate compliance with the London Plan water hierarchy for run off especially in areas identified as prone to flooding from surface water run off. All new development in areas at risk from fluvial flooding must demonstrate application of the sequential approach set out in the NPPF (paragraphs 100 to 104) and provide information on the known flood risk potential of the application site. h. Development proposals will wherever possible be expected to naturalise a water course, ensure an adequate buffer zone is created and enable public accessibility. Where appropriate, contributions towards river restoration and de-culverting will be expected.
DM05: Tall Buildings
Tall buildings outside the strategic locations identified in the Core Strategy will not be considered acceptable. Proposals for tall buildings will need to demonstrate: i. an active street frontage where appropriate ii. successful integration into the existing urban fabric iii. a regard to topography and no adverse impact on Local Viewing Corridors, local views and the skyline iv. not cause harm to heritage assets and their setting v. that the potential microclimatic effect does not adversely affect existing levels of comfort in the public realm Proposals for redevelopment or refurbishment of existing tall buildings will be required to make a positive contribution to the townscape
Land use issue only – restricts density on some sites
DM06: Barnet’s Heritage and Conservation
a. All heritage assets will be protected in line with their significance. All development will have regard to the local historic context. b. Development proposals must preserve or enhance the character and appearance of 16 Conservation Areas in Barnet. c. Proposals involving or affecting Barnet’s heritage assets set out in table 5.1 should demonstrate the following:
the significance of the heritage asset the impact of the proposal on the significance of the
heritage asset the impact of the proposal on the setting of the heritage
asset how the significance and/or setting of a heritage asset can
be better revealed the opportunities to mitigate or adapt to climate change how the benefits outweigh any harm caused to the
heritage asset d. There will be a presumption in favour of retaining all 1,600 locally listed buildings in Barnet and any buildings which makes a positive contribution to the character
Land use issue only – will restrict extent of development on some sites but these restrictions should be reflected in site value.

80
Policy Number Summary of Requirement Cost implications
or appearance of the 16 conservation areas. e. Archaeological remains will be protected in particular in the 19 identified Local Areas of Special Archaeological Significance and elsewhere in Barnet. Any development that may affect archaeological remains will need to demonstrate the likely impact upon the remains and the proposed mitigation to reduce that impact.
DM07: Protecting housing in Barnet
Loss of residential accommodation will not be permitted unless: a. the proposed use is for a local facility (children’s nursery, educational or health use) provided that it is not detrimental to residential amenity and; b. where need can be demonstrated and; c. the demand for the proposed use cannot adequately be met elsewhere and is in line with other policies or; d. the location is no longer environmentally suitable and viable for residential use or; e. it involves identified regeneration areas with large scale demolition of housing and estates which provides for the net replacement of the total residential units
Land use issue – will prevent some sites coming forward but does not give rise to any additional costs on sites that do come forward
DM08: Ensuring a variety of sizes of new homes to meet housing need
Development should provide where appropriate a mix of dwelling types and sizes in order to provide choice for a growing and diverse population for all households in the borough. Our dwelling size priorities are: i. For social rented housing – homes with 3 bedrooms are the highest priority ii. For intermediate affordable housing – homes with 3/4 bedrooms are the highest priority iii. For market housing – homes with 4 bedrooms are the highest priority, homes with 3 bedroom are a medium priority
Mix reflected in appraisals
DM09: Specialist housing – Houses in Multiple Occupation, student accommodation and housing choice for older people
a: Houses in Multiple Occupation (HMO) The council will seek to retain existing HMO provided that they meet an identified housing need. Proposals for new HMO will be encouraged provided that they meet an identified need, can demonstrate that they will not have a harmful impact on the character and amenities of the surrounding area, are easily accessible by public transport, cycling and walking and meet the relevant housing standards for HMO. b: Student Accommodation The council expects proposals for student accommodation to demonstrate that they support educational establishments within Barnet and meet an identified local need. Provision for students should be located in accessible locations. c: Housing Choice for Older People Housing proposals for older people should: i. help to meet an identified need; ii. demonstrate that they will not have a harmful impact on the character and amenities of the surrounding area; and iii. be within walking distance of local shops and easily accessible by public transport; and iv. provide adequate communal facilities including accommodation for essential staff on site.
No particular cost implications for new developments. Some land use issues if these particular types of development are not permitted. Student Accommodation requirements overtaken to some extent by Draft New London Plan requirements.
DM10 Affordable housing contributions
Having regard to the borough-wide target that 40% of housing provision should be affordable, the maximum reasonable amount of affordable housing will be required on site, subject to viability, from all new sites providing 10 or more units gross or covering an area of 0.4 hectares or more.
Impact of affordable housing requirement tested in study
DM11 Development principles in the town centres
The council will expect a suitable mix of appropriate uses as part of development within the town centres to support their continued vitality and viability. a: Town centre uses i. Significant new retail and other appropriate town centre uses outside the town centres or any expansion of existing out of centre sites will be strongly resisted unless they can meet the sequential approach and tests set out in the NPPF or are identified in an adopted Area Action Plan. Edge of centre proposals will not normally be appropriate and therefore should demonstrate why they are not locating in a town centre site. ii. The town centre boundaries, primary and secondary retail frontages are shown in the maps in Appendix 5.
Land use issue only

81
Policy Number Summary of Requirement Cost implications
b: Primary and secondary frontages i. A development proposal which reduces the combined proportion of class A1 retail use at ground floor level (including vacant) in the primary frontage below 75% will not be permitted. The proposal should not create an over-concentration of similar uses which detracts from the retail function of the town centre. ii. A development proposal which reduces the combined proportion of class A1 retail use at ground floor level (including vacant) in the secondary frontage below 65% will not be permitted. The proposal should not create an over-concentration of similar uses which detract from the retail function of the town centre. iii. Change from a retail use (Class A1) will be strongly resisted unless it can be demonstrated that there is no viable demand for continued Class A1 use. When it can be demonstrated that the site has been marketed effectively for Class A1 use acceptable alternatives to Class A1 use will be Class A2, A3, A4, A5 or community uses. Conversion of any Class A use to a community use will be expected to present an active frontage at ground floor and be able to demonstrate a similar weekday footfall to a Class A1 use. iv. Any significant new retail development will be expected to provide a mix of unit sizes, avoid an inward looking layout, maintain the street frontage and provide suitable and convenient linkages for shoppers to access other town centre uses. v. Evening economy uses will be expected not to have an adverse effect on the amenity of local residents and be in keeping with the scale and character of the surrounding area. c: Mixed use development i. The protection of employment floorspace should meet the requirements set out in Policy DM14: New and Existing Employment Space unless otherwise indicated in the: a) Site Allocation DPD b) Town Centre Frameworks c) Areas identified as a Locally Significant Industrial Site, Industrial Business Park or Business Locations. ii. Appropriate mixed use re-development will be expected to provide re-provision of employment use, residential and community use. iii. The council will consider the location of new and the relocation of existing community, leisure and cultural uses (including arts) to the town centres only where they maintain active frontages.
DM12 Maintaining local centres and parades
The council will protect all retail uses (Class A1) in the existing local centres, parades and isolated shops unless it can be demonstrated that: i. there will be no significant reduction of shopping facilities as a result; and ii. that alternative shopping facilities that are similarly accessible by walking, cycling or public transport exist to meet the needs of the area; and iii. the proposed use is within Class A2, A3, A4, A5 or meets an identified local need; and iv. there is no demand for continued Class A1 use, and that the site has been marketed effectively for such use. A proposal that either creates an over concentration of Class A2, A3, A4 and A5 uses or has a significant adverse effect on the amenity of existing residents will be refused. Community uses will be expected to present an active frontage at ground floor and be able to demonstrate a similar weekday footfall to a Class A1 use. Proposals for residential use should not cause a break in a frontage.
Land use issue only
DM13 Community and education uses
a: Loss of community / educational use Loss of community / educational use will only be acceptable in exceptional circumstances where: i. New community or education use of at least equivalent quality or quantity are provided on the site or at a suitable alternative location; or ii. There is no demand for continued community or education use, and that the site has been marketed effectively for such use. b: New community or educational use New community or educational uses should be located where they are accessible by public transport, walking and cycling, preferably in town centres or local centres. New community or educational uses should ensure that there is no significant impact on the free flow of traffic and road safety. New community or educational uses will be
Land use issue only – policy will restrict the ability of landowners of these sites to bring them forward for development

82
Policy Number Summary of Requirement Cost implications
expected to protect the amenity of residential properties.
DM14 New and existing employment space
a: Existing employment space i. Proposals which result in a redevelopment or change of use of a Locally Significant Industrial Site, Industrial Business Park or Business Location as shown on the Proposals Map to a non B Class use will not be permitted. ii. Outside these locations loss of a B Class use will only be permitted where it can be demonstrated to the council’s satisfaction that a site is no longer suitable and viable for its existing or alternative business use in the short, medium and long term and a suitable period of effective marketing has been undertaken. Where this can be demonstrated the priority for re-use will be a mixture of small business units with residential use. iii. Office space (Class B1) should be retained in town centres and edge of centre locations. Loss of office space (Class B1) will only be permitted in town centres and edge of centre locations where it can be demonstrated to the council’s satisfaction that a site is no longer suitable and viable for its existing or alternative business use in the short, medium and long term and a suitable period of active marketing has been undertaken. Where this can be demonstrated the proposal will be expected to provide appropriate mixed use re-development which provides some re-provision of employment use, residential and community use. iv. Proposals to redevelop or reuse an existing employment space which reduces the levels of employment use and impacts negatively on the local economy will be resisted. v. Where appropriate, loss of employment space will be expected to provide mitigation in the form of contributions to employment training. b: New employment space i. All proposals for new office space should follow a sequential approach which considers town centre sites before edge of centre sites. ii. New industrial/warehousing space will be expected to locate in Locally Significant Industrial sites. Warehousing uses or uses which generate high levels of movement should be located in close proximity to tier one and two roads as set out in Policy DM17 Travel Impact and Parking Standards and minimise impact on residential areas. iii. Proposals for new employment space will be expected to provide on site servicing for the intended use and include space for waiting for goods vehicles.
Land use issue only.
DM15 Green belt and open spaces
a: Green Belt / Metropolitan Open Land 1. Development proposals in Green Belt are required to comply with the NPPF (paragraphs 79 to 92). In line with the London Plan the same level of protection given to Green Belt land will be given to Metropolitan Open Land (MOL). 2. Except in very special circumstances, the council will refuse any development in the Green Belt or MOL which is not compatible with their purposes and objectives and does not maintain their openness. 3. The construction of new buildings within the Green Belt or Metropolitan Open Land, unless there are very special circumstances, will be inappropriate, except for the following purposes: i. Agriculture, horticulture and woodland; ii. Nature conservation and wildlife use; or iii. Essential facilities for appropriate uses will only be acceptable where they do not have an adverse impact on the openness of Green Belt or MOL. 4. Extensions to buildings in Green Belt or MOL will only be acceptable where they do not result in a disproportionate addition over and above the size of the original building or an over intensification of the use of the site. 5. The replacement or re-use of buildings will not be permitted where they would have an adverse impact on the openness of the area or the purposes of including land in Green Belt or MOL. 6. Development adjacent to Green Belt/MOL should not have a detrimental impact on visual amenity and respect the character of its surroundings. b: Open Spaces 1. Open space will be protected from development. In exceptional
Land use issue only.

83
Policy Number Summary of Requirement Cost implications
circumstances loss of open space will be permitted where the following can be satisfied: i.The development proposal is a small scale ancillary use which supports the use of the open space or ii.Equivalent or better quality open space provision can be made. Any exception will need to ensure that it does not create further public open space deficiency and has no significant impact on biodiversity. 2. In areas which are identified as deficient in public open space, where the development site is appropriate or the opportunity arises the council will expect on site provision in line with the standards set out in the supporting text [para 16.3.6].
DM16: Biodiversity
a. When considering development proposals the council will seek the retention and enhancement, or the creation of biodiversity. b. Where development will affect a Site of Importance for Nature Conservation and / or species of importance the council will expect the proposal to meet the requirements of London Plan Policy 7.19E. c. Development adjacent to or within areas identified as part of the Green Grid Framework will be required to make a contribution to the enhancement of the Green Grid.
Standard requirement – reflected in development density which allows sufficient space for open space and opportunities for biodiversity.
Policy DM17: Travel impact and parking standards
a: Road Safety The council will ensure that the safety of all road users is taken into account when considering development proposals, and will refuse proposals that unacceptably increase conflicting movements on the road network or increase the risk to vulnerable users. b: Road Hierarchy The council will seek to ensure that roads within the borough are used appropriately according to their status in the defined road hierarchy. In taking into account the function of adjacent roads the council may refuse development proposals which would result in inappropriate road use, or adversely affect the operation of roads in an area c: Development, Location and Accessibility The council will expect major development proposals with the potential for significant trip generation to be in locations which are, or will be made, highly accessible by a range of transport modes. d: Transport Assessment In considering planning applications for new development, the council will require developers to submit a full Transport Assessment (as defined by Department for Transport threshold) where the proposed development is anticipated to have significant transport implications in order to ensure that these impacts are considered. This assessment should include an analysis of accessibility by all modes of transport. e: Travel Planning For significant trip generating developments, (defined by Transport for London thresholds), the council will require the occupier to develop, implement and maintain a satisfactory Travel Plan (or plans) to minimise increases in road traffic and meet mode split targets. In order to ensure that they are delivering this the travel plan will need to contain measurable outputs so that they can be monitored. f: Local Infrastructure Needs i. Developments should be located and designed to make the use of public transport more attractive for all users by providing improved access to existing facilities, and if necessary the development of new routes and services, including improved and fully accessible interchange facilities. ii. The council will expect development to provide safe and suitable access arrangements for all road users to new developments. Where improvements or changes to the road network are necessary by virtue of an approved development, the council will secure a Legal Agreement from the developer. iii. The council will require appropriate measures to control vehicle movements, servicing and delivery arrangements. Where appropriate the council will require Construction Management and/or Delivery and Servicing Plans. iv. Where appropriate, development will be required to improve cycle and pedestrian facilities in the local catchment area by providing facilities on site and/or funding improvements off site
Standard requirements in London context.

84
Policy Number Summary of Requirement Cost implications
g: Parking management 1. The council will expect development to provide parking in accordance with the London Plan standards, except in the case of residential development, where the maximum standards will be: i. 2 to 1.5 spaces per unit for detached and semi detached houses and flats (4 or more bedrooms) ii. 1.5 to 1 spaces per unit for terraced houses and flats (2 to 3 bedrooms); and iii. 1 to less than 1 space per unit for development consisting mainly of flats (1 bedroom) 2. Residential development may be acceptable: i. with limited or no parking outside a Controlled Parking Zone (CPZ) but only where it can be demonstrated through a survey that there is sufficient on street parking capacity. ii. with limited or no parking within a CPZ, where it can be demonstrated that there is insufficient capacity on street the applicant will be required to enter into a legal agreement to restrict future occupiers from obtaining on street parking permits. For proposals in close proximity to the edge of a CPZ a survey will also be required to demonstrate that there is sufficient on street parking capacity on streets outside the CPZ.
Policy DM18: Telecommunications
Proposals for the installation of telecommunications equipment will be permitted where it can be demonstrated that: i. There is no significant adverse effect on the external appearance of the building on which, or space in which, they are located; ii. The special character and appearance of all heritage assets are preserved or enhanced; iii. The possibility of sharing facilities, such as masts, cabinet boxes and satellite dishes, and erecting antennae on existing buildings or other structures has been fully explored and where practical becomes the preferred location; iv. Technologies to miniaturise and camouflage any telecommunications apparatus have been explored; v. They are appropriately designed, coloured and landscaped to take account of their setting; and vi. There is no significant adverse impact on the visual amenities of neighbouring occupiers.
May limit opportunities for developers to sell the right to locate telecoms equipment on roofs of their developments.

85
Appendix 2 - Residential sales values

Details Location Postcode Total HomesOf which
private Min £psf Avg £psf Max £psf Min £ Ave £ Max £ Final sale
Millbrook Park - 5 - Joseph Homes - No 1 Millbrook Joseph Homes Barnet NW7 1PX 149 123 £440 £635 £820 £474,995 £752,762 £1,224,995 08-Nov-19Sir Thomas Lipton (Memorial Hospital) Yogo Group Barnet N14 5HE 25 25 £737 £804 £900 £995,000 £1,339,444 £1,800,000 29-Oct-19The Rushgroves (Homebase NW9) L&Q Barnet NW9 6SS 386 308 £589 £676 £765 £352,500 £467,227 £590,000 14-Oct-19Oakleigh Grove Taylor Wimpey North Thames Barnet N20 0NX 288 229 £531 £615 £795 £399,995 £687,708 £1,075,000 11-Oct-19Ridgeway Views (National Institute For Medical Research) Barratt London Barnet NW7 1AA 512 311 £620 £696 £919 £535,000 £785,431 £2,100,000 10-Oct-19The Westbury (Brookdene) Mondev Construction Barnet N12 7DR 34 34 £672 £741 £781 £400,000 £599,454 £999,000 09-Oct-19Millbrook Park - 9A/B - Barratt Barratt London Barnet NW7 1NY 355 £674 £698 £721 £377,000 £490,333 £575,000 09-Oct-19Millbrook Park - 4c - Taylor Wimpey Taylor Wimpey North Thames Barnet NW7 1PX 89 77 £437 £523 £636 £689,950 £794,433 £960,000 09-Oct-19Colindale Gardens - Phase 1 Redrow London Barnet NW9 5JE 2,900 2,320 £424 £598 £743 £360,000 £546,527 £845,000 09-Oct-19Beaufort Park - F1/2/8/9 St George Barnet NW9 5HA 383 383 £708 £752 £802 £402,450 £590,783 £834,950 08-Oct-19Beaufort Park - C5-C12 St George Barnet NW9 5JE 517 424 £665 £709 £748 £164,950 £582,569 £1,850,000 08-Oct-19Bower & Barnabas (St Barnabas Church) Cullen & Davis Holdings Barnet N12 7DN 30 30 £688 £765 £975 £425,000 £540,000 £625,000 04-Oct-19Millbrook Park - 4b - The Claves - Eco World London Eco World London Barnet NW7 1NY 188 159 £619 £724 £826 £410,000 £668,000 £1,100,000 01-Oct-19Whetstone Square Gold Compass Developments Ltd Barnet N20 0QP 56 47 £571 £663 £802 £585,000 £975,217 £1,300,000 26-Sep-19Oakley Gardens (Church Walk House) Goldenstone Development Barnet NW2 2TJ 35 35 £918 £1,078 £1,258 £595,000 £998,500 £1,760,000 26-Sep-19706 High Road Property 4 Investment Barnet N12 9QL 21 21 £574 £613 £670 £295,000 £477,727 £600,000 24-Sep-19The Broadway Fairview New Homes Barnet NW2 2DP 122 101 £597 £685 £812 £360,000 £512,700 £660,000 24-Sep-19Trinity Square (Barnet and Southgate College) Barratt London Barnet NW9 5RA 396 372 £393 £529 £613 £353,000 £438,417 £560,000 24-Sep-1921 (Castle House) Castle Invest Ltd Barnet EN5 1PH 40 40 £612 £626 £640 £265,000 £419,752 £585,000 19-Sep-19Elmbank Linden Homes Chiltern Barnet EN5 3HD 114 90 £518 £581 £634 £360,000 £758,037 £1,600,000 19-Sep-19Clementine Court (Rear of Winston House) Cavendish & Gloucester Barnet N3 1DH 27 24 £599 £722 £858 £750,000 £1,062,187 £1,325,000 19-Sep-19Pulse Phase 2 (Montrose Park Sites) Fairview New Homes Barnet NW9 5DZ 240 194 £364 £462 £580 £245,000 £325,125 £399,000 17-Sep-19Seventeen (Groupama House) EEH Ventures Barnet EN5 1PG 36 36 £556 £611 £692 £325,000 £431,445 £595,000 16-Sep-19Asprey Park City & Westminster Developments Barnet NW4 1PN 55 55 £532 £621 £710 £325,000 £515,898 £725,000 16-Sep-19Hendon Waterside - 3B+C Barratt London Barnet NW9 7QJ 298 181 £506 £647 £737 £355,000 £473,569 £630,500 16-Sep-19Millbrook Park - 4a - Taylor Wimpey Taylor Wimpey North Thames Barnet NW7 1NY 114 100 £373 £530 £641 £415,000 £833,724 £1,395,000 01-Sep-19The Beaumont Shree Hari Construction Barnet NW11 8LX 25 25 £915 £1,047 £1,351 £1,100,000 £1,505,714 £2,250,000 26-Jun-19The Arc (Adastra House) Mizen Homes Barnet N3 1LW 34 27 £777 £816 £896 £420,000 £570,714 £820,000 19-Jun-19Brook Valley Gardens - Phase 2 Countryside Barnet EN5 2UJ 163 95 £405 £540 £680 £345,000 £556,104 £780,000 25-Mar-19Fellows Square (Former Parcelforce Depot) A2Dominion Barnet NW2 6LT 230 169 £497 £604 £799 £315,000 £452,435 £640,000 15-Mar-19Buxmead (Leo Baeck House) Harrison Varma Services Limited Barnet N2 0BG 20 20 £2,591 £2,728 £2,865 £8,250,000 £8,612,500 £8,975,000 09-Mar-19Millbrook Park - 1 - The Mount - Countryside Countryside Barnet NW7 1PZ 133 133 £432 £566 £741 £319,995 £669,459 £1,075,000 26-Sep-18Gateway House Columbia Group Ltd Barnet N3 2TX 77 77 £666 £763 £843 £400,000 £527,854 £825,000 25-Jun-18Hampstead Reach (Chandos Lawn Tennis Club) Barratt London Barnet NW11 7HP 45 45 £1,055 £1,180 £1,360 £995,000 £1,648,536 £4,800,000 25-Jun-18Oakwell Grange (Bretheren Meeting Hall) David Wilson Homes (Southern) Barnet N20 9EQ 70 50 £514 £577 £679 £995,000 £1,304,104 £1,800,000 26-Mar-18Millbrook Park - 3 - Linden Linden Homes Chiltern Barnet NW7 1PZ 138 105 £488 £538 £578 £405,000 £820,775 £1,450,000 26-Mar-18The Lofts (Trafalgar House) Trafalgar House LLP Barnet NW7 3SA 28 28 £531 £607 £662 £285,000 £560,812 £995,000 26-Mar-18

86
Appendix 3 - Commercial lettings

Address City Floor Total SF Leased Rent/SF/Yr Rent Type Service Rent PA Use20 Edgwarebury Edgware GRND 222 50.00 Asking 11,100.00 Office20 Edgwarebury Edgware GRND 207 49.85 Asking 10,318.95 Office20 Edgwarebury Edgware GRND 130 49.85 Asking 6,480.50 Office20 Edgwarebury Edgware GRND 193 49.74 Asking 9,599.82 Office137-139 Brent London 1st 654 48.19 Achieved 31,516.26 Office1-3 Hale Grove Gdns London 1st 405 39.50 Effective FRI 15,996.02 Office1-3 Totteridge Ln London GRND 1,507 36.50 Effective 55,005.11 Office1A Finchley Rd London GRND 250 36.00 Asking 9,000.00 Office5 Oakleigh Gardens London GRND 115 35.48 Asking 4,080.20 OfficeThe Ridgeway London GRND 1,133 35.30 Effective FRI 39,994.90 Office5 Oakleigh Gardens London GRND 258 34.89 Asking 9,001.62 Office2c Birkbeck Rd London GRND 430 34.88 Asking FRI 14,998.40 Office5 Oakleigh Gardens London GRND 465 31.61 Achieved FRI 14,698.65 Office12-16 Portsdown Mews London GRND 621 29.36 Asking FRI 18,232.56 Office904-910 High Rd London 1st 518 28.95 Asking 14,996.10 Office158b Deans Ln Edgware GRND 206 27.60 Asking 5,685.60 Office158b Deans Ln Edgware GRND 155 27.60 Asking 4,278.00 Office2A Accommodation Rd London GRND 650 27.47 Effective 17,854.18 Office26 North End Rd London GRND 694 26.46 Effective 18,363.18 Office26 North End Rd London 1-3 1,385 26.46 Effective 36,646.98 Office300 Ballards Ln London GRND 570 26.32 Effective FRI 15,002.12 Office592 Finchley Rd London GRND 800 26.25 Effective FRI 20,999.23 OfficeArcadia Ave London GRND 965 26.00 Asking FRI 25,090.00 Office35-37 Brent St London GRND 880 25.57 Asking FRI 22,501.60 Office5 Breasy Pl London GRND 553 25.32 Asking FRI 14,001.96 Office1345 High Rd London 1st 695 25.18 Asking FRI 17,500.10 Office26-28 St Albans Ln London GRND,1 7,570 25.00 Asking FRI 189,250.00 Office741 High Rd London 3rd 1,050 25.00 Asking 26,250.00 Office741 High Rd London 2nd 494 25.00 Asking 12,350.00 Office2-4 Woodberry Grove London 1st 1,218 25.00 Asking 30,450.00 Office2 Dollis Park London GRND 1,013 25.00 Asking FRI 25,325.00 Office765 Finchley Rd London GRND 4,500 25.00 Asking 112,500.00 Office154 Brent St London GRND,2 3,225 25.00 Effective 80,624.20 Office234-236 West Hendon Broadway London GRND 1,455 24.74 Asking 35,996.70 OfficeWest Heath Dr London GRND 3,253 24.59 Asking FRI 79,991.27 Office12-16 Portsdown Mews London GRND 613 24.47 Effective FRI 14,999.96 OfficeSt Albans Ln London 1st 221 24.43 Asking 5,399.03 Office958-964 High Rd London 2nd 200 24.00 Asking 4,800.00 Office886-902 High Rd London GRND 885 23.82 Effective 21,078.06 Office304 Regents Park Rd London GRND,1-4 24,538 23.63 Effective 579,954.62 Office1a Budd Close London GRND 1,609 23.62 Asking 38,004.58 Office886-902 High Rd London GRND 1,966 23.37 Effective FRI 45,935.83 Office886-902 High Rd London GRND 814 23.23 Effective FRI 18,910.84 Office1 Bridge Ln London 2nd 1,642 23.23 Effective FRI 38,142.39 Office

Address City Floor Total SF Leased Rent/SF/Yr Rent Type Service Rent PA Use823-825 High Rd London GRND 1,190 23.10 Achieved 27,489.00 Office131-133 Ballards Ln London 2nd 1,215 23.05 Asking FRI 28,005.75 Office1379 High Rd London LL,GRND 4,931 22.50 Asking FRI 110,947.50 Office1379 High Rd London GRND 3,491 22.50 Asking FRI 78,547.50 Office1379 High Rd London GRND 1,334 22.50 Asking FRI 30,015.00 OfficePopes Dr London 2nd 703 22.48 Effective FRI 15,803.40 Office886-902 High Rd London GRND 1,476 22.36 Effective FRI 33,003.09 Office4 Oakleigh Mews London GRND 350 22.29 Achieved FRI 7,801.50 Office2-8 Games Rd Barnet GRND 981 22.22 Asking FRI 21,797.82 Office315 Regents Park Rd London 1st 725 22.07 Effective FRI 16,000.75 Office823-825 High Rd London 1st 550 21.80 Effective 11,989.84 Office189-191 High St Barnet 1-2 1,148 21.78 Effective FRI 25,003.26 OfficeBrent Cross Gdns London 3rd 1,850 21.62 Asking 39,997.00 Office2 Dollis Park London 3rd 3,500 21.50 Asking FRI 75,250.00 Office10 North End Rd London 1st 610 20.08 Asking FRI 12,248.80 Office96 Edgware Way Edgware GRND 1,300 20.00 Asking FRI 26,000.00 Office45 Vivian Ave London 1st 1,000 20.00 Asking FRI 20,000.00 Office3 Brampton London 2nd 1,860 19.89 Asking FRI 36,995.40 Office39 Lodge Ln London GRND 730 19.86 Asking FRI 14,497.80 OfficePopes Dr London 1st 2,624 19.65 Effective FRI 51,561.18 Office2-8 Games Rd Barnet 2nd 1,153 19.43 Achieved 22,402.79 Office165 Granville Rd London GRND 1,458 19.00 Asking FRI 27,702.00 Office165 Granville Rd London GRND 1,348 19.00 Asking FRI 25,612.00 Office165 Granville Rd London GRND 589 19.00 Asking FRI 11,191.00 Office165 Granville Rd London 1st 599 19.00 Asking FRI 11,381.00 Office165 Granville Rd London 2nd 637 19.00 Asking FRI 12,103.00 Office165 Greenville Rd London GRND 544 19.00 Asking FRI 10,336.00 Office165 Greenville Rd London 2nd 827 19.00 Asking FRI 15,713.00 Office165 Greenville Rd London 1st 811 19.00 Asking FRI 15,409.00 Office3 Shakespeare Rd London GRND 1,800 18.88 Effective 33,983.67 OfficeStation Rd Barnet 6th 3,523 18.50 Effective FRI 65,175.50 OfficeBunns Ln London GRND 1,945 18.00 Achieved FRI 35,010.00 OfficeBunns Ln London GRND 1,525 18.00 Achieved FRI 27,450.00 Office128-136 High St Edgware 2nd 1,550 18.00 Effective FRI 27,899.77 OfficeGrahame Park Way London 1st 847 17.71 Effective FRI 15,000.01 Office770 High Rd London 1st 955 17.54 Asking FRI 16,750.70 OfficeColindeep Ln London GRND,1 6,263 17.00 Asking 106,471.00 Office207 Crescent Rd Barnet GRND 720 16.66 Effective FRI 11,995.12 Office128-136 High St Edgware 3rd 1,550 16.50 Asking FRI 25,575.00 Office128-136 High St Edgware 3rd 1,550 16.50 Asking FRI 25,575.00 OfficeThe Hyde London 9th 1,335 16.00 Asking 21,360.00 OfficeThe Hyde London 9th 1,285 16.00 Asking 20,560.00 Office3 Shakespeare Rd London 2nd 1,574 15.88 Asking FRI 24,995.12 Office120 High St Edgware 2nd 950 15.79 Effective FRI 15,000.50 Office

Address City Floor Total SF Leased Rent/SF/Yr Rent Type Service Rent PA UseArcadia Ave London 1st 1,332 15.77 Asking FRI 21,005.64 Office209 Crescent Rd Barnet GRND 762 15.74 Effective FRI 11,993.77 OfficeArcadia Ave London 1st 1,200 15.42 Effective FRI 18,503.93 Office2-8 Games Rd Barnet 1st 938 15.29 Achieved 14,342.02 Office70-78 West Hendon Broadway London 2nd 1,280 15.23 Achieved FRI 19,494.40 Office4 Breasy Pl London GRND 500 15.19 Effective FRI 7,595.00 Office311 Ballards Ln London 1st 1,550 14.51 Achieved 22,490.50 Office54-58 High Edgware 2nd 1,557 13.00 Asking FRI 20,241.00 Office115C Brunswick Park Rd London GRND 2,195 12.76 Achieved 61,460,000.00 Office128-136 High St Edgware 1st 1,600 11.62 Asking FRI 18,592.00 Office15-17 Western Parade Barnet GRND,1-2 31,560 10.75 Effective 261,794.75 Office1a Heronsgate Edgware GRND 243 9.76 Asking FRI 2,371.68 Office1a Heronsgate Edgware 1st 883 9.76 Asking FRI 8,618.08 OfficeOakleigh Rd S London 2nd 43,000 9.37 Effective FRI 402,910.00 Office115 Brunswick Park Rd London GRND 2,195 6.83 Achieved 14,991.85 Office

Sign Date Start Date Address City Floor Total SF LeasedRent/SF/Yr Rent Type Service Rent PA Use10/09/2018 10/10/2018 1322 High Rd London GRND,1 2,075 75.90 Asking FRI 157,500.00 Retail25/05/2017 25/05/2017 Prince Charles Dr London 1st 1,051 72.95 Effective FRI 76,671.12 Retail01/07/2018 01/09/2018 61 Totteridge Ln London GRND 143 69.93 Asking FRI 10,000.00 Retail07/08/2017 07/08/2017 741 High Rd London 3rd 1,000 66.95 Effective FRI 66,949.71 Retail23/11/2017 23/11/2017 6 Union St Barnet GRND,1 300 66.67 Asking FRI 20,000.00 Retail01/06/2019 01/07/2019 Station Rd Edgware GRND 1,294 65.69 Asking 85,000.00 Retail16/11/2018 16/12/2018 133 West Hendon Broadway London GRND 691 59.36 Asking FRI 26,000.00 Retail03/11/2017 03/11/2017 45 Station Rd Edgware GRND 600 55.00 Achieved FRI 33,000.00 Retail31/03/2019 31/03/2019 130 Colindale Ave London GRND 620 53.23 Effective FRI 32,999.92 Retail20/10/2018 09/12/2018 172 High Rd London GRND 442 52.04 Asking FRI 23,000.00 Retail23/02/2018 23/02/2018 750 Finchley Rd London GRND 500 52.00 Effective 25,999.74 Retail24/09/2018 24/10/2018 345 Ballards Ln London GRND 550 50.91 Asking FRI 28,000.00 Retail16/05/2017 15/06/2017 Charcoat Rd London GRND,1 1,204 49.83 Asking FRI 60,000.00 Retail20/07/2017 20/07/2017 174 High Rd London GRND 505 49.50 Asking FRI 25,000.00 Retail01/09/2017 01/09/2017 1328 High Rd London GRND 505 49.50 Effective 24,999.93 Retail30/09/2017 30/09/2017 29 Temple Fortune Parade London GRND 805 49.07 Asking 39,500.00 Retail01/09/2018 01/10/2018 Station Rd Edgware GRND 2,045 48.90 Asking FRI 100,000.00 Retail01/09/2017 01/09/2017 3-4 Station Rd Edgware GRND 676 48.08 Asking FRI 32,500.00 Retail15/06/2017 15/06/2017 131 High St Barnet GRND 468 48.08 Asking FRI 22,500.00 Retail09/05/2018 09/05/2018 400 Finchley Rd London GRND 500 48.00 Asking 24,000.00 Retail05/02/2019 05/02/2019 1357-1359 High Rd London GRND 1,463 47.85 Asking FRI 70,000.00 Retail01/07/2018 01/09/2018 58-60 Totteridge Ln London GRND 316 47.47 Asking 15,000.00 Retail17/07/2018 16/08/2018 135 Deans Ln Edgware GRND 300 46.67 Asking 14,000.00 Retail27/04/2017 27/04/2017 18 Station Rd Barnet BSMT,GRND 550 45.45 Asking FRI 25,000.00 Retail12/12/2017 12/12/2017 784-786 Finchley Rd London GRND 830 45.18 Effective FRI 37,499.64 Retail10/08/2018 10/09/2018 814 Finchley Rd London GRND 645 44.96 Asking FRI 29,000.00 Retail15/01/2019 11/04/2019 25 Temple Fortune Parade London GRND 900 44.44 Achieved FRI 40,000.00 Retail17/05/2018 17/05/2018 Finchley Rd London GRND 1,152 43.40 Effective FRI 49,999.72 Retail15/04/2017 15/05/2017 26 Cricklewood Ln London GRND 1,033 43.08 Effective FRI 44,506.52 Retail15/04/2019 15/04/2019 2 East Barnet Rd Barnet Unkwn 396 42.93 Achieved FRI 17,000.00 Retail10/07/2018 06/08/2018 98 Ballards Ln London GRND 700 42.86 Asking FRI 30,000.00 Retail02/05/2017 15/05/2017 53 The Broadway London GRND 586 42.66 Effective FRI 24,999.64 Retail14/09/2017 19/09/2017 14 Temple Fortune Parade London GRND 425 42.35 Effective 17,999.72 Retail03/04/2017 03/04/2017 31 Temple Fortune Parade London GRND 1,301 42.28 Asking FRI 55,000.00 Retail07/01/2019 24/01/2019 716 High Rd London GRND 814 41.77 Achieved FRI 34,000.00 Retail26/09/2018 26/10/2018 62-62A Golders Green Rd London GRND 360 41.67 Asking 15,000.00 Retail04/05/2019 04/06/2019 343 Ballards Ln London GRND 605 41.32 Effective FRI 24,999.95 Retail22/03/2019 22/03/2019 Station Rd Edgware GRND,1 2,183 41.23 Asking FRI 90,000.00 Retail02/10/2018 08/11/2018 161 Ballards Ln London GRND 680 39.71 Asking FRI 27,000.00 Retail09/06/2017 09/06/2017 Prince Charles Dr London GRND 22,350 39.68 Effective FRI 886,782.06 Retail12/11/2016 12/11/2016 731 High Rd London GRND 431 39.44 Asking FRI 17,000.00 Retail14/09/2017 14/09/2017 91 Ballards Ln London GRND 547 39.31 Asking FRI 21,500.00 Retail08/05/2017 08/05/2017 87 The Broadway London GRND 1,100 39.19 Effective FRI 28,999.79 Retail04/05/2018 04/05/2018 184 Cricklewood Broadway London GRND 515 38.83 Asking FRI 20,000.00 Retail

Sign Date Start Date Address City Floor Total SF LeasedRent/SF/Yr Rent Type Service Rent PA Use11/01/2019 12/02/2019 1061 Finchley Rd London GRND 629 38.16 Achieved FRI 24,000.00 Retail17/06/2019 17/06/2019 32 Watling Ave Edgware GRND 660 37.88 Asking 25,000.00 Retail30/01/2017 30/01/2017 40 The Broadway London GRND 848 37.74 Effective FRI 31,999.90 Retail04/06/2019 04/06/2019 18 Golders Green Rd London GRND 1,061 37.29 Effective FRI 39,561.27 Retail18/08/2017 18/08/2017 338 Regents Park Rd London GRND 671 37.26 Asking FRI 25,000.00 Retail23/06/2017 23/06/2017 Geron Way London GRND 2,031 37.20 Effective FRI 75,544.35 Retail03/07/2018 02/08/2018 400 Finchley Rd London GRND 350 37.14 Asking 13,000.00 Retail15/01/2019 11/04/2019 8 North End Rd London GRND 728 37.09 Achieved FRI 27,000.00 Retail01/03/2019 01/03/2019 1201 Finchley Rd London GRND 1,050 36.53 Effective FRI 38,353.97 Retail31/05/2018 13/07/2018 1033 Finchley Rd London GRND 616 36.53 Asking FRI 22,500.00 Retail25/03/2017 25/03/2017 41 The Broadway London GRND 931 36.52 Effective FRI 33,999.75 Retail02/12/2017 01/01/2018 Geron Way London GRND 1,030 36.50 Asking FRI 37,600.00 Retail17/07/2017 17/07/2017 741 High Rd London Unkwn 1,000 36.33 Effective FRI 36,327.65 Retail15/11/2016 15/11/2016 17 Ballards Ln London GRND 895 36.09 Asking FRI 32,300.00 Retail16/09/2019 16/10/2019 746 High Rd London GRND 975 35.90 Asking FRI 35,000.00 Retail15/06/2017 15/06/2017 1386 High Rd London GRND 280 35.71 Effective 9,999.90 Retail01/02/2018 01/02/2018 42 Golders Green Rd London GRND 990 35.35 Asking FRI 35,000.00 Retail24/03/2017 24/03/2017 32 North End Rd London GRND 907 35.28 Achieved FRI 32,000.00 Retail01/12/2016 01/12/2016 40 Totteridge Ln London GRND 567 35.27 Effective FRI 20,000.00 Retail02/12/2017 01/01/2018 778-780 High Rd London BSMT,GRND 1,928 35.12 Effective FRI 67,708.81 Retail25/01/2017 25/01/2017 48 Cricklewood Ln London GRND 457 35.01 Effective 15,999.94 Retail03/09/2019 03/09/2019 240 Station Rd Edgware GRND 870 35.00 Effective 27,999.92 Retail01/07/2018 01/07/2018 108-114 Golders Green Rd London GRND 858 34.97 Achieved 30,000.00 Retail22/07/2019 22/07/2019 2F Lodge Ln London GRND 516 34.88 Asking 18,000.00 Retail01/12/2017 01/12/2017 1185 Finchley Rd London GRND 860 34.88 Asking FRI 30,000.00 Retail26/06/2018 08/08/2018 38 Totteridge Ln London GRND 696 34.48 Asking FRI 24,000.00 Retail22/10/2018 22/10/2018 400 Finchley Rd London GRND 350 34.29 Effective FRI 11,999.79 Retail28/09/2017 28/09/2017 Geron Way London GRND 8,122 34.26 Effective FRI 278,257.30 Retail09/06/2017 09/06/2017 12 Station Rd London GRND 585 34.19 Effective FRI 19,999.84 Retail29/12/2016 29/12/2016 804-806A High Rd London BSMT,GRND,1 2,963 34.12 Effective 101,099.75 Retail25/02/2018 27/03/2018 Geron Way London GRND 3,428 34.00 Effective 116,555.90 Retail01/01/2018 01/01/2018 6 Union St Barnet GRND,1 300 33.33 Asking FRI 10,000.00 Retail24/04/2019 24/05/2019 17C Market Pl London GRND 556 33.27 Asking 18,500.00 Retail25/05/2017 25/05/2017 15 Church Hill Rd Barnet GRND 470 33.19 Asking FRI 15,600.00 Retail01/03/2017 01/03/2017 9 Market Pl London GRND 889 33.18 Asking FRI 29,500.00 Retail19/09/2018 25/10/2018 349 Ballards Ln London GRND 800 33.12 Asking FRI 26,500.00 Retail20/12/2017 19/01/2018 Finchley Rd London GRND 1,450 33.04 Effective FRI 47,913.95 Retail25/06/2018 27/06/2018 10 Great North Rd Barnet GRND 543 32.97 Effective 17,999.91 Retail07/08/2017 07/08/2017 57-57A Brent St London GRND 410 32.93 Asking 13,500.00 Retail09/07/2018 09/07/2018 119 High St Barnet GRND 920 32.61 Asking FRI 30,000.00 Retail16/01/2018 16/01/2018 35A High St Barnet 1st 660 32.58 Effective FRI 21,499.78 Retail02/09/2019 13/10/2019 783 High Rd London GRND 995 32.16 Asking FRI 32,000.00 Retail13/02/2018 13/02/2018 2-8 Games Rd Barnet GRND 1,160 31.47 Achieved 36,500.00 Retail03/07/2017 03/07/2017 Geron Way London GRND 20,000 31.38 Effective FRI 627,608.10 Retail

Sign Date Start Date Address City Floor Total SF LeasedRent/SF/Yr Rent Type Service Rent PA Use18/01/2019 18/01/2019 343 Ballards Ln London GRND 800 31.25 Asking FRI 25,000.00 Retail01/12/2018 01/12/2018 142-144 East End Rd London GRND 800 31.25 Effective FRI 24,999.97 Retail04/08/2017 03/09/2017 146-150 Golders Green Rd London GRND 2,400 31.25 Asking FRI 75,000.00 Retail01/12/2016 01/12/2016 24 The Broadway London GRND 800 31.25 Effective 25,000.00 Retail04/06/2019 04/07/2019 45-45A The Broadway London GRND 578 31.14 Effective FRI 17,999.84 Retail01/04/2019 01/04/2019 69-71 The Broadway London Unkwn 517 30.95 Effective FRI 16,000.00 Retail07/11/2016 07/11/2016 1 Oakleigh Rd N London BSMT,GRND 858 30.30 Asking 26,000.00 Retail04/06/2018 04/06/2018 130 Colindale Ave London GRND 1,566 30.00 Asking IRO 46,980.00 Retail12/12/2018 13/01/2019 754 High Rd London GRND 1,040 29.81 Effective FRI 30,999.70 Retail09/03/2018 09/03/2018 1332 High Rd London GRND 755 29.80 Effective FRI 22,499.82 Retail01/11/2017 01/12/2017 112 High St Barnet GRND 1,846 29.79 Asking FRI 55,000.00 Retail19/03/2019 18/04/2019 424 Finchley Rd London GRND 1,021 29.38 Achieved FRI 30,000.00 Retail01/02/2018 01/02/2018 2 Temple Parade Barnet GRND 410 29.27 Effective 12,000.00 Retail01/02/2018 01/02/2018 2 Netherlands Rd Barnet GRND 410 29.27 Asking 12,000.00 Retail29/03/2019 28/04/2019 9 Central Circus London GRND 942 29.19 Asking FRI 27,500.00 Retail02/09/2018 07/10/2018 134 High St Edgware GRND 620 29.03 Asking FRI 18,000.00 Retail25/03/2019 25/03/2019 69-71 The Broadway London GRND 517 29.01 Achieved FRI 15,000.00 Retail02/02/2019 04/03/2019 127 The Broadway London BSMT,GRND 1,903 28.90 Achieved FRI 55,000.00 Retail02/03/2017 02/03/2017 Geron Way London GRND 26,900 28.70 Effective FRI 771,968.90 Retail04/07/2019 03/08/2019 7 Falloden London GRND 685 28.47 Asking FRI 19,500.00 Retail07/02/2018 07/02/2018 High St Barnet GRND,1 2,951 28.36 Effective 83,694.59 Retail19/12/2017 19/12/2017 70 High St Edgware GRND 635 28.35 Asking 18,000.00 Retail20/04/2018 20/04/2018 2 Watford Way London GRND 1,237 28.29 Effective FRI 34,999.86 Retail02/07/2018 02/07/2018 Charcot Rd London GRND 1,204 28.24 Effective FRI 33,999.96 Retail18/05/2017 18/05/2017 429 Oakleigh Rd N London GRND 244 28.14 Effective FRI 6,865.86 Retail23/03/2018 23/03/2018 1-1B Church Passage Barnet GRND 2,150 27.91 Asking FRI 60,000.00 Retail16/11/2018 16/12/2018 5 Park Rd London GRND 310 27.74 Asking FRI 8,600.00 Retail13/09/2018 13/10/2018 335-337 Regents Park Rd London BSMT 575 27.45 Asking 15,784.00 Retail29/01/2017 28/02/2017 103 The Broadway London GRND 1,215 27.16 Asking FRI 33,000.00 Retail17/07/2017 17/07/2017 20 Temple Fortune Parade London GRND 1,210 26.86 Effective FRI 32,499.78 Retail29/03/2018 28/04/2018 1 Church Passage Barnet GRND 2,150 26.52 Effective 57,014.09 Retail31/10/2017 31/10/2017 178-180 Long Ln London GRND 948 26.37 Asking FRI 25,000.00 Retail25/06/2018 25/06/2018 76 Brunswick Park Rd London GRND 457 26.26 Asking FRI 12,000.00 Retail19/12/2016 18/01/2017 281 Ballards Ln London GRND 2,490 26.10 Effective FRI 64,999.33 Retail28/06/2018 28/06/2018 30 Watford Way London GRND 520 25.96 Effective FRI 13,499.97 Retail01/03/2017 01/03/2017 9a-9b Cricklewood Ln London GRND 1,936 25.83 Effective FRI 50,000.00 Retail03/07/2018 02/08/2018 108 Golders Green Rd London GRND 1,180 25.42 Asking FRI 30,000.00 Retail29/11/2018 29/11/2018 1361 High Rd London GRND 887 25.37 Effective 22,499.30 Retail01/09/2017 01/10/2017 179 Station Rd Edgware GRND 1,442 25.33 Effective FRI 36,526.74 Retail12/09/2018 28/11/2018 3 Church Hill Rd Barnet GRND 395 25.32 Asking FRI 10,000.00 Retail01/04/2019 06/05/2019 118 Brent St London GRND 990 25.25 Asking FRI 25,000.00 Retail01/12/2016 01/12/2016 20-22 Station Rd Barnet GRND 715 25.17 Effective 18,000.00 Retail08/04/2019 08/04/2019 435-437 Oakleigh Rd N London GRND 847 25.12 Effective FRI 21,273.84 Retail15/03/2019 17/04/2019 Aerodrome Rd London GRND 1,141 25.00 Asking FRI 28,525.00 Retail

Sign Date Start Date Address City Floor Total SF LeasedRent/SF/Yr Rent Type Service Rent PA Use27/04/2018 27/05/2018 56 Golders Green Rd London GRND 1,200 25.00 Effective FRI 29,999.89 Retail26/03/2018 26/03/2018 114 Ballards Ln London GRND 800 25.00 Effective 19,999.87 Retail31/01/2018 31/01/2018 48 Glengall Rd Edgware GRND 600 25.00 Asking 15,000.00 Retail06/09/2017 06/09/2017 Aerodrome Rd London GRND 1,000 25.00 Asking 25,000.00 Retail14/08/2017 14/08/2017 2 High St Edgware GRND 500 24.96 Effective FRI 12,477.59 Retail05/06/2017 05/06/2017 162 High St Barnet GRND 425 24.71 Asking 10,500.00 Retail24/03/2017 24/03/2017 83 Church Rd London GRND 648 24.69 Effective FRI 15,999.92 Retail23/06/2017 23/06/2017 736 High Rd London BSMT,GRND,MEZZ 1,177 24.56 Effective FRI 28,901.51 Retail15/04/2019 15/04/2019 756-756A High Rd London GRND 1,379 24.55 Effective FRI 33,853.92 Retail19/08/2017 18/09/2017 50 Golders Green Rd London GRND 1,209 24.18 Effective FRI 29,239.17 Retail24/04/2017 24/04/2017 233 Deansbrook Rd Edgware GRND 500 24.00 Asking 12,000.00 Retail07/09/2018 07/09/2018 Station Rd Edgware GRND 2,300 23.91 Effective 54,999.63 Retail01/02/2018 03/03/2018 71 Ballards Ln London GRND 1,258 23.85 Asking 30,000.00 Retail26/02/2019 28/03/2019 14 Heritage Ave London GRND 1,197 23.56 Effective FRI 28,199.84 Retail29/09/2017 29/09/2017 4 Colin Parade London GRND 466 23.50 Effective FRI 10,949.94 Retail15/04/2019 15/05/2019 24 Charcot Rd Collindale GRND 1,926 23.36 Asking FRI 45,000.00 Retail15/01/2019 13/04/2019 756 High Rd London GRND 1,115 23.32 Asking FRI 26,000.00 Retail07/06/2019 07/06/2019 241 Regents Park Rd London GRND 1,122 23.28 Effective FRI 26,115.86 Retail25/08/2018 24/09/2018 176 High St Barnet GRND 1,285 22.96 Effective FRI 29,502.52 Retail06/03/2018 05/04/2018 Aerodrome Rd London GRND 1,536 22.79 Effective 34,999.83 Retail13/04/2018 13/04/2018 219 Regents Park Rd London GRND 773 22.78 Effective FRI 17,606.12 Retail19/07/2019 18/08/2019 203 Regents Park Rd London GRND 4,030 22.33 Asking FRI 90,000.00 Retail21/12/2017 21/12/2017 948-956 High Rd London GRND 1,235 22.27 Effective FRI 27,499.82 Retail14/11/2016 14/11/2016 Pegasus Way London GRND 20,410 22.13 Effective 451,595.79 Retail27/06/2019 27/06/2019 Finchley Rd London GRND 5,208 22.08 Effective FRI 114,999.45 Retail06/03/2017 06/03/2017 111 Friern Barnet Rd London GRND 733 21.83 Asking 16,000.00 Retail03/10/2019 02/11/2019 Golders Green Rd London GRND 925 21.62 Asking 20,000.00 Retail29/05/2017 29/05/2017 87 High Rd London BSMT,GRND 1,800 21.49 Effective FRI 38,690.12 Retail14/08/2018 11/09/2018 627 Watford Way London GRND 770 21.43 Achieved FRI 16,500.00 Retail21/12/2016 21/12/2016 76 East Barnet Rd Barnet GRND 550 21.40 Effective FRI 11,770.04 Retail06/03/2019 05/05/2019 2 Lambert Way London GRND 2,809 21.36 Asking 60,000.00 Retail19/01/2018 02/02/2018 10B Colin Parade London GRND 360 20.83 Effective FRI 7,499.99 Retail30/08/2018 30/08/2018 627 Watford Way London 1st 770 20.73 Effective FRI 15,959.67 Retail26/07/2018 25/08/2018 421 Hendon Way London GRND 966 20.70 Asking FRI 20,000.00 Retail01/03/2017 01/03/2017 820 High Rd London GRND 1,212 20.63 Asking 25,000.00 Retail24/10/2017 24/10/2017 Geron Way London GRND,MEZZ 8,000 20.61 Effective FRI 164,917.78 Retail01/06/2018 01/07/2018 266 Watford Way London GRND 729 20.51 Effective FRI 14,950.00 Retail20/04/2019 20/04/2019 35 Market Pl London GRND 1,044 20.38 Effective FRI 21,279.60 Retail12/06/2018 12/06/2018 638 Finchley Rd London BSMT,GRND 1,463 19.83 Effective FRI 29,009.81 Retail31/07/2017 31/07/2017 36 Vivian Ave London GRND 908 19.82 Effective FRI 17,999.98 Retail03/07/2019 02/08/2019 249 East Barnet Rd Barnet GRND 936 19.76 Asking FRI 18,500.00 Retail21/01/2019 20/02/2019 169 West Hendon Broadway London GRND 1,836 19.61 Effective FRI 35,999.67 Retail01/06/2017 01/06/2017 93 Watling Ave Harrow BSMT,GRND,1 877 19.38 Asking FRI 17,000.00 Retail01/11/2016 01/12/2016 9 Ballards Ln London BSMT,GRND 1,145 19.21 Asking FRI 22,000.00 Retail

Sign Date Start Date Address City Floor Total SF LeasedRent/SF/Yr Rent Type Service Rent PA Use01/03/2018 31/03/2018 563-571 Watford Way London GRND 3,534 19.10 Asking FRI 67,500.00 Retail22/02/2019 24/03/2019 18 High St Shepperton GRND 1,264 18.99 Asking 24,000.00 Retail07/11/2016 07/11/2016 109 Colindale Ave London GRND 431 18.56 Asking FRI 8,000.00 Retail03/10/2019 02/11/2019 818-818A High Rd London GRND 2,426 18.55 Asking FRI 45,000.00 Retail08/10/2018 01/11/2018 23 Bell Ln London GRND 546 18.32 Asking FRI 10,000.00 Retail25/10/2017 25/10/2017 230 High St Barnet GRND,1-2 1,405 17.79 Asking 25,000.00 Retail14/04/2018 07/12/2018 278 Watford Way Hendon Unkwn 3,694 17.60 Achieved 65,000.00 Retail01/11/2017 01/12/2017 4-6 High St Edgware GRND 2,266 17.43 Effective FRI 39,500.00 Retail11/07/2018 12/07/2018 354 Cricklewood Ln London GRND 775 17.42 Achieved FRI 13,500.00 Retail12/01/2017 12/01/2017 The Hyde London GRND 8,000 16.88 Effective FRI 135,040.00 Retail01/05/2017 01/05/2017 7D High St Barnet GRND 1,185 16.03 Asking FRI 19,000.00 Retail15/05/2017 15/05/2017 752-752A High Rd London BSMT,GRND 2,087 15.96 Effective 33,302.50 Retail01/04/2017 06/04/2017 749 High Rd London BSMT,GRND,1 9,240 15.61 Effective 144,281.49 Retail01/02/2018 01/02/2018 762 Finchley Rd London GRND 1,769 15.55 Asking FRI 27,500.00 Retail13/02/2018 15/03/2018 14 Station Rd Barnet BSMT,GRND 1,070 15.42 Effective FRI 16,499.83 Retail10/01/2018 09/02/2018 31 Watford Way London GRND 1,080 14.78 Effective FRI 15,959.67 Retail01/03/2017 01/03/2017 74 High St Barnet BSMT,GRND 2,060 14.56 Asking 30,000.00 Retail11/07/2017 10/08/2017 59 Ballards Ln London GRND,1 2,434 14.38 Asking 35,000.00 Retail22/02/2017 22/02/2017 Station Rd Edgware GRND,1 10,629 14.11 Effective 149,998.42 Retail26/05/2017 26/05/2017 3 Pennine Dr London GRND 775 14.04 Effective FRI 10,881.61 Retail01/12/2016 01/12/2016 Pennine Dr London GRND,MEZZ 646 13.77 Effective FRI 8,950.00 Retail28/02/2019 12/10/2019 38 Vivian Ave London GRND 1,650 13.33 Effective FRI 21,999.79 Retail31/08/2017 31/08/2017 38 Vivian Ave London GRND 1,650 13.33 Effective FRI 21,999.97 Retail01/06/2018 17/10/2018 183-191 Ballards Ln London GRND 4,552 13.18 Achieved FRI 60,000.00 Retail17/08/2017 17/08/2017 144 Gallants Farm Rd Barnet GRND 610 13.11 Effective 7,999.84 Retail15/03/2019 15/03/2019 203 Regents Park Rd London GRND 900 12.65 Effective FRI 11,380.80 Retail18/06/2018 02/07/2018 17-19 Hendon Ln London BSMT,GRND 1,801 12.22 Achieved FRI 22,000.00 Retail10/07/2017 10/07/2017 14 Pennine Parade London GRND 936 11.22 Effective FRI 10,499.91 Retail18/12/2018 18/03/2019 Edgware Rd London GRND 13,500 11.11 Effective FRI 149,994.98 Retail17/10/2017 16/11/2017 3-5 Pennine Dr London GRND 1,076 10.46 Asking FRI 11,250.00 Retail03/01/2017 02/02/2017 4 Pennine Dr London GRND 1,076 10.46 Asking FRI 11,250.00 Retail31/01/2018 02/03/2018 383 Long Ln London BSMT 2,500 10.00 Asking 25,000.00 Retail15/08/2017 15/08/2017 7 East Barnet Rd Barnet GRND 1,358 9.57 Asking 13,000.00 Retail24/01/2018 24/01/2018 112-132 Brent St London GRND 1,900 9.47 Effective 17,999.92 Retail11/10/2019 11/10/2019 704-708 High Rd London BSMT,GRND 12,065 8.29 Achieved FRI 100,000.00 Retail24/08/2018 24/11/2018 Aerodrome Rd London GRND 5,947 4.29 Achieved FRI 25,500.00 Retail05/05/2017 05/05/2017 Prince Charles Dr London 1st 1,960 0.10 Effective FRI 204.08 Retail01/03/2017 01/03/2017 Prince Charles Dr London 1st 3,737 0.05 Effective FRI 181.37 Retail22/10/2019 22/10/2019 218 Woodhouse Rd London GRND 610 0.04 Achieved FRI 23.44 Retail29/05/2018 29/05/2018 Prince Charles Dr London 1st 2,700 0.02 Effective FRI 58.53 Retail

Sign Date Start Date Address City Floor Total SF LeasedRent/SF/Yr Rent Type Service Rent PA Use01/06/2019 02/07/2019 2A Bedford RdLondon 1st 745 22.14 Asking 16,494.30 Industrial28/02/2018 30/03/2018 Aerodrome RdLondon GRND 1,092 20.00 Asking FRI 21,840.00 Industrial08/11/2017 08/11/2017 Temple Close London GRND 312 19.23 Effective 5,999.33 Industrial30/04/2019 22/07/2019 Grahame Park WayLondon 1st 847 15.94 Effective FRI 13,500.94 Industrial01/04/2019 31/05/2019 346-348 Burnt Oak BroadwayEdgware GRND 9,238 15.70 Effective FRI 145,036.37 Industrial01/02/2018 01/02/2018 Irving Way London GRND,1 12,611 14.21 Effective FRI 168,754.06 Industrial31/03/2017 31/03/2017 Garrick Rd London GRND 6,340 14.04 Effective 88,990.80 Industrial01/12/2017 01/12/2017 116 Victoria RdBarnet GRND 650 13.85 Asking FRI 9,002.50 Industrial31/08/2018 31/08/2018 Flower Ln London GRND 2,368 13.72 Effective FRI 32,488.92 Industrial02/01/2019 02/01/2019 100 West Hendon BroadwayLondon GRND,1 27,717 13.53 Effective 375,010.75 Industrial22/09/2017 22/09/2017 Flower Ln London GRND,1 7,744 12.91 Asking FRI 99,975.04 Industrial25/03/2019 24/05/2019 70 Colindeep LnLondon GRND 7,000 12.85 Asking FRI 89,950.00 Industrial15/08/2018 07/09/2018 North Circular RdLondon GRND,1,MEZZ,2 17,800 12.50 Asking FRI 222,500.00 Industrial01/05/2017 01/05/2017 Brunswick WayLondon GRND,1 12,626 11.30 Effective FRI 144,095.24 Industrial01/09/2017 04/09/2017 19 Colindale AveLondon GRND 8,900 10.67 Effective FRI 94,962.77 Industrial12/05/2017 12/05/2017 Brunswick WayLondon GRND 9,074 10.01 Effective FRI 90,813.07 Industrial30/09/2017 30/09/2017 1A Cecil Rd London GRND,1 8,992 10.00 Asking 89,920.00 Industrial04/07/2018 02/10/2018 17 Colindale AveLondon GRND 15,000 9.50 Asking FRI 142,500.00 Industrial21/03/2017 21/03/2017 Brunswick WayLondon GRND,MEZZ,1 17,609 8.67 Effective FRI 152,649.69 Industrial27/05/2019 02/08/2019 269 Ballards LnLondon GRND,1 9,633 7.89 Asking FRI 76,004.37 Industrial02/01/2017 02/01/2017 Brunswick WayLondon GRND,1 8,117 7.50 Effective FRI 60,846.71 Industrial08/07/2019 08/07/2019 63 Lancaster RdBarnet GRND,1 7,860 7.19 Achieved FRI 56,513.40 Industrial06/06/2018 07/07/2018 164 High Barnet GRND 3,000 4.30 Effective 12,899.59 Industrial14/05/2018 01/06/2018 164 High St Barnet GRND 3,961 4.30 Effective 17,032.30 Industrial

87
Appendix 4 - Appraisal results with growth

88
Maximum CIL rates (before buffer) with growth, 40% affordable housing – BLV of £12.3 million

89
Maximum CIL rates (before buffer) with growth, 40% affordable housing – BLV of £5.40 million

90
Maximum CIL rates (before buffer) with growth, 40% affordable housing – BLV of £1.20 million

91
Maximum CIL rates (before buffer) with growth, 35% affordable housing – BLV of £12.30 million

92
Maximum CIL rates (before buffer) with growth, 35% affordable housing – BLV of £5.40 million

93
Maximum CIL rates (before buffer) with growth, 35% affordable housing – BLV of £1.20 million

94
Maximum CIL rates (before buffer) with growth, 30% affordable housing – BLV of £12.30 million

95
Maximum CIL rates (before buffer) with growth, 30% affordable housing – BLV of £5.40 million

96
Maximum CIL rates (before buffer) with growth, 30% affordable housing – BLV of £1.20 million

97
Maximum CIL rates (before buffer) with growth, 25% affordable housing – BLV of £12.30 million

98
Maximum CIL rates (before buffer) with growth, 25% affordable housing – BLV of £5.40 million

99
Maximum CIL rates (before buffer) with growth, 25% affordable housing – BLV of £1.20 million

100
Maximum CIL rates (before buffer) with growth, 20% affordable housing – BLV of £12.30 million

101
Maximum CIL rates (before buffer) with growth, 20% affordable housing – BLV of £5.40 million

102
Maximum CIL rates (before buffer) with growth, 20% affordable housing – BLV of £1.20 million

103
Appendix 5 - Sites details

1 2 3 4 5 6 7 8 9 10 11 12 13 14 15 16LONDON BOROUGH OF BARNET
Gross Net site No of No of No of No of No of No of Resi costs Resi costs GIA GIA Site ref SITE NAME Site area area Site coverage Heights Houses Flats Houses Flats Houses Flats Houses Flats Houses flats 1 Very small residential (house) 1 unit 0.01 0.01 50% 2 1 1,652 1,883 108 - 2 Very small residential (houses) 5 units 0.04 0.04 60% 2 5 1,652 1,883 478 - 3 Very small residential (houses) 6 units 0.05 0.05 60% 2 6 1,652 1,883 585 - 4 Very small residential (flats) 6 units 0.03 0.03 60% 3 6 1,652 1,883 - 450 5 Small residential development (flats) 10 units 0.05 0.05 60% 3 10 1,652 1,883 - 815 6 Small residential development (houses) 10 units 0.07 0.07 70% 2 10 1,652 1,883 975 - 7 Small residential development (flats) 15 units 0.05 0.05 80% 4 15 1,652 1,883 - 1,675 8 Small residential development (houses) 15 units 0.07 0.07 70% 3 15 1,652 1,883 1,413 - 9 Medium residential dev (flats and houses) 50 units 0.10 0.10 80% 5 10 40 1,652 1,883 828 3,312 10 Medium residential development (flats) 50 units 0.12 0.12 80% 5 50 1,652 1,883 - 4,150 11 Large residential (flats and houses) 100 units 0.17 0.17 80% 6 20 80 1,652 2,314 1,680 6,720 12 Large residential (flats) 100 units 0.13 0.13 80% 8 100 1,652 2,314 - 8,400 13 Large resdential (flats and houses) 150 units 0.32 0.32 80% 5 30 120 1,652 2,314 2,545 10,180 14 Large residential (flats) 150 units 0.14 0.14 90% 10 150 1,652 2,314 - 12,275 15 Large resdential (flats and houses) 250 units 0.43 0.43 80% 6 50 200 1,652 2,314 4,175 16,700 16 Large residential (flats) 250 units 0.11 0.11 90% 20 250 1,652 2,314 - 19,865 17 Large residential (flats) 500 units 0.65 0.65 80% 8 500 1,652 2,314 - 41,500 18 Large residential (flats) 750 units 0.33 0.33 80% 24 750 1,652 2,314 - 62,375 19 Large residential (flats) 1,000 units 0.93 0.93 75% 12 1,000 1,652 2,314 - 84,000 20 Large residential (flats) 1,500 units 1.40 1.40 90% 10 1,500 1,652 2,314 - 126,000 21 Large residential (flats) 2,000 units 1.38 1.38 80% 15 2,000 1,652 2,314 - 165,500 22 Large residential (flats) 2,500 units 1.51 1.51 75% 18 2,500 1,652 2,314 - 203,750 23 Estate regeneration (small) 50 houses 0.26 0.26 65% 3 50 1,652 1,883 - 4,975 24 Estate regeneration (large) 250 flats 0.44 0.44 70% 6 250 1,652 2,314 - 18,315 25 Older person's housing scheme (50 flats) 0.08 0.08 90% 5 50 1,652 1,883 - 3,750 26 Older person's housing schme (25 houses, 25 flats) 0.18 0.18 70% 3 50 1,652 1,883 - 3,750 27 Older person's housing scheme (75 flats) 0.10 0.10 90% 6 75 1,652 2,314 - 5,375 28 Offices 0.10 0.10 80% 5 1,652 1,883 - - 29 Offices 0.12 0.12 80% 8 1,652 1,883 - - 30 Industrial 1.00 1.00 50% 1 1,652 1,883 - - 31 Industrial 1.00 1.00 50% 1 1,652 1,883 - - 32 Storage 1.00 1.00 50% 1 1,652 1,883 - - 33 Storage 1.00 1.00 50% 1 1,652 1,883 - - 34 Leisure 0.29 0.29 70% 2 1,652 1,883 - - 35 Leisure 0.29 0.29 70% 3 1,652 1,883 - - 36 Retail (smalll scale comparison) 0.01 0.01 95% 1 1,652 1,883 - - 37 Retail (smalll scale comparison) 0.02 0.02 95% 1 1,652 1,883 - - 38 Retail (medium scale comparison) 0.09 0.09 80% 1 1,652 1,883 - - 39 Retail (medium scale comparison) 0.06 0.06 80% 1 1,652 1,883 - - 40 Retail (large scale comparison) 0.07 0.07 70% 2 1,652 1,883 - - 41 Retail (large scale comparison) 0.18 0.18 70% 2 1,652 1,883 - - 42 Retail (large scale comparison) 0.31 0.31 65% 2 1,652 1,883 - - 43 Retail (convenience) 0.43 0.43 70% 1 1,652 1,883 - - 44 Retail (convenience) 0.20 0.20 75% 1 1,652 1,883 - - 45 Retail (convenience) 0.03 0.03 95% 1 1,652 1,883 - - 46 Hotel 0.11 0.11 70% 4 1,652 1,883 - - 47 Hotel 0.16 0.16 75% 6 1,652 1,883 - - 48 Hotel -budget 0.08 0.08 95% 5 1,652 1,883 - - 49 Student 0.12 0.12 80% 5 1,652 1,883 - - 50 Student 0.18 0.18 80% 6 1,652 1,883 - -
Years 1 - 5 Years 6 - 10 Years 11 - 15

1LONDON B
Site ref1234567891011121314151617181920212223242526272829303132333435363738394041424344454647484950
18 19 20 21 22 23 24 25 26 27 28 29 30 31 32 33 34 35 36 37 38Floor areas - proposed (sqm) CIL (rate per sqm) - INCL MAYORAL CIL
Note: B1 office inlcudes B1(b) Total resi Total resi FSRetail A1-A5Retail S'MarkeB1 office B2 industria B8 storage C1 Hotel C2 resi inst D1 D2 units Retail A1-ARetail S'MaB1 office B2 industriaB8 storage C1 Hotel C2 resi instD1 D2 Resi
- - - - - - - - - 1 108 60 60 60 60 60 60 60 £60 £60 60- - - - - - - - - 5 478 60 60 60 60 60 60 60 £60 £60 60- - - - - - - - - 6 585 60 60 60 60 60 60 60 £60 £60 60- - - - - - - - - 6 450 60 60 60 60 60 60 60 £60 £60 60- - - - - - - - - 10 815 60 60 60 60 60 60 60 £60 £60 60- - - - - - - - - 10 975 60 60 60 60 60 60 60 £60 £60 60- - - - - - - - - 15 1,675 60 60 60 60 60 60 60 £60 £60 60- - - - - - - - - 15 1,413 60 60 60 60 60 60 60 £60 £60 60- - - - - - - - - 50 4,140 60 60 60 60 60 60 60 £60 £60 60- - - - - - - - - 50 4,150 60 60 60 60 60 60 60 £60 £60 60- - - - - - - - - 100 8,400 60 60 60 60 60 60 60 £60 £60 60- - - - - - - - - 100 8,400 60 60 60 60 60 60 60 £60 £60 60- - - - - - - - - 150 12,725 60 60 60 60 60 60 60 £60 £60 60- - - - - - - - - 150 12,275 60 60 60 60 60 60 60 £60 £60 60- - - - - - - - - 250 20,875 60 60 60 60 60 60 60 £60 £60 60- - - - - - - - - 250 19,865 60 60 60 60 60 60 60 £60 £60 60- - - - - - - - - 500 41,500 60 60 60 60 60 60 60 £60 £60 60- - - - - - - - - 750 62,375 60 60 60 60 60 60 60 £60 £60 60- - - - - - - - - 1,000 84,000 60 60 60 60 60 60 60 £60 £60 60- - - - - - - - - 1,500 126,000 60 60 60 60 60 60 60 £60 £60 60- - - - - - - - - 2,000 165,500 60 60 60 60 60 60 60 £60 £60 60- - - - - - - - - 2,500 203,750 60 60 60 60 60 60 60 £60 £60 60- - - - - - - - - 50 4,975 60 60 60 60 60 60 60 £60 £60 60- - - - - - - - - 250 18,315 60 60 60 60 60 60 60 £60 £60 60- - - - - - - - - 50 3,750 60 60 60 60 60 60 60 £60 £60 60- - - - - - - - - 50 3,750 60 60 60 60 60 60 60 £60 £60 60- - - - - - - - - 75 5,375 60 60 60 60 60 60 60 £60 £60 60- - 4,000 - - - - - - - - 60 60 60 60 60 60 60 £60 £60 60- - 8,000 - - - - - - - - 60 60 60 60 60 60 60 £60 £60 60- - - 5,000 - - - - - - - 60 60 60 60 60 60 60 £60 £60 60- - - 5,000 - - - - - - - 60 60 60 60 60 60 60 £60 £60 60- - - - 5,000 - - - - - - 60 60 60 60 60 60 60 £60 £60 60- - - - 5,000 - - - - - - 60 60 60 60 60 60 60 £60 £60 60- - - - - - - 4,000 - - - 60 60 60 60 60 60 60 £60 £60 60- - - - - - - 6,000 - - - 60 60 60 60 60 60 60 £60 £60 60100 - - - - - - - - - - 60 60 60 60 60 60 60 £60 £60 60200 - - - - - - - - - - 60 60 60 60 60 60 60 £60 £60 60750 - - - - - - - - - - 60 60 60 60 60 60 60 £60 £60 60750 - - - - - - - - - - 60 60 60 60 60 60 60 £60 £60 60
1,000 - - - - - - - - - - 60 60 60 60 60 60 60 £60 £60 602,500 - - - - - - - - - - 60 60 60 60 60 60 60 £60 £60 604,000 - - - - - - - - - - 60 60 60 60 60 60 60 £60 £60 60
- 3,000 - - - - - - - - - 60 60 60 60 60 60 60 £60 £60 60- 1,500 - - - - - - - - - 60 60 60 60 60 60 60 £60 £60 60- 250 - - - - - - - - - 60 60 60 60 60 60 60 £60 £60 60- - - - - 3,000 - - - - - 60 60 60 60 60 60 60 £60 £60 60- - - - - 7,000 - - - - - 60 60 60 60 60 60 60 £60 £60 60- - - - - 3,750 - - - - - 60 60 60 60 60 60 60 £60 £60 60- - - - - - 5,000 - - - - 60 60 60 60 60 60 60 £60 £60 60- - - - - - 8,750 - - - - 60 60 60 60 60 60 60 £60 £60 60

1LONDON B
Site ref1234567891011121314151617181920212223242526272829303132333435363738394041424344454647484950
48 49 50 51 52 53 54 55 56 57 58 59 60 61 62 63 64 65 66 67 68S106 (per sqm for commercial; per unit for resi Rents Cap val
E&T cost Retail A1-ARetail S'MaB1 office B2 industriaB8 storage C1 Hotel C2 resi instD1 D2 Resi Retail A1-ARetail S'MaB1 office B2 industriaB8 storage C1 Hotel C2 resi instD1 D2 Resi
- 20 20 20 20 20 20 20 20 20 1,500 504 325 366 170 170 425 390 250 250 12,000 - 20 20 20 20 20 20 20 20 20 1,500 504 325 366 170 170 425 390 250 250 12,000 - 20 20 20 20 20 20 20 20 20 1,500 504 325 366 170 170 425 390 250 250 12,000 - 20 20 20 20 20 20 20 20 20 1,500 504 325 366 170 170 425 390 250 250 12,000 - 20 20 20 20 20 20 20 20 20 1,500 504 325 366 170 170 425 390 250 250 12,000 - 20 20 20 20 20 20 20 20 20 1,500 504 325 366 170 170 425 390 250 250 12,000 - 20 20 20 20 20 20 20 20 20 1,500 504 325 366 170 170 425 390 250 250 12,000 - 20 20 20 20 20 20 20 20 20 1,500 504 325 366 170 170 425 390 250 250 12,000 - 20 20 20 20 20 20 20 20 20 1,500 504 325 366 170 170 425 390 250 250 12,000 - 20 20 20 20 20 20 20 20 20 1,500 504 325 366 170 170 425 390 250 250 12,000 - 20 20 20 20 20 20 20 20 20 1,500 504 325 366 170 170 425 390 250 250 12,000 - 20 20 20 20 20 20 20 20 20 1,500 504 325 366 170 170 425 390 250 250 12,000 - 20 20 20 20 20 20 20 20 20 1,500 504 325 366 170 170 425 390 250 250 12,000 - 20 20 20 20 20 20 20 20 20 1,500 504 325 366 170 170 425 390 250 250 12,000 - 20 20 20 20 20 20 20 20 20 1,500 504 325 366 170 170 425 390 250 250 12,000 - 20 20 20 20 20 20 20 20 20 1,500 504 325 366 170 170 425 390 250 250 12,000 - 20 20 20 20 20 20 20 20 20 1,500 504 325 366 170 170 425 390 250 250 12,000 - 20 20 20 20 20 20 20 20 20 1,500 504 325 366 170 170 425 390 250 250 12,000 - 20 20 20 20 20 20 20 20 20 1,500 504 325 366 170 170 425 390 250 250 12,000 - 20 20 20 20 20 20 20 20 20 1,500 504 325 366 170 170 425 390 250 250 12,000 - 20 20 20 20 20 20 20 20 20 1,500 504 325 366 170 170 425 390 250 250 12,000 - 20 20 20 20 20 20 20 20 20 1,500 504 325 366 170 170 425 390 250 250 12,000 - 20 20 20 20 20 20 20 20 20 1,500 504 325 366 170 170 425 390 250 250 12,000 - 20 20 20 20 20 20 20 20 20 1,500 504 325 366 170 170 425 390 250 250 12,000 - 20 20 20 20 20 20 20 20 20 1,500 504 325 366 170 170 425 390 250 250 12,000 - 20 20 20 20 20 20 20 20 20 1,500 504 325 366 170 170 425 390 250 250 12,000 - 20 20 20 20 20 20 20 20 20 1,500 504 325 366 170 170 425 390 250 250 12,000 - 20 20 20 20 20 20 20 20 20 1,500 504 325 366 170 170 425 390 250 250 12,000 - 20 20 20 20 20 20 20 20 20 1,500 504 325 366 170 170 425 390 250 250 12,000 - 20 20 20 20 20 20 20 20 20 1,500 504 325 366 170 170 425 390 250 250 12,000 - 20 20 20 20 20 20 20 20 20 1,500 504 325 366 170 170 425 390 250 250 12,000 - 20 20 20 20 20 20 20 20 20 1,500 504 325 366 170 170 425 390 250 250 12,000 - 20 20 20 20 20 20 20 20 20 1,500 504 325 366 170 170 425 390 250 250 12,000 - 20 20 20 20 20 20 20 20 20 1,500 504 325 366 170 170 425 390 250 250 12,000 - 20 20 20 20 20 20 20 20 20 1,500 504 325 366 170 170 425 390 250 250 12,000 - 20 20 20 20 20 20 20 20 20 1,500 504 325 366 170 170 425 390 250 250 12,000 - 20 20 20 20 20 20 20 20 20 1,500 504 325 366 170 170 425 390 250 250 12,000 - 20 20 20 20 20 20 20 20 20 1,500 504 325 366 170 170 425 390 250 250 12,000 - 20 20 20 20 20 20 20 20 20 1,500 504 325 366 170 170 425 390 250 250 12,000 - 20 20 20 20 20 20 20 20 20 1,500 504 325 366 170 170 425 390 250 250 12,000 - 20 20 20 20 20 20 20 20 20 1,500 504 325 366 170 170 425 390 250 250 12,000 - 20 20 20 20 20 20 20 20 20 1,500 504 325 366 170 170 425 390 250 250 12,000 - 20 20 20 20 20 20 20 20 20 1,500 504 325 366 170 170 425 390 250 250 12,000 - 20 20 20 20 20 20 20 20 20 1,500 504 325 366 170 170 425 390 250 250 12,000 - 20 20 20 20 20 20 20 20 20 1,500 504 325 366 170 170 425 390 250 250 12,000 - 20 20 20 20 20 20 20 20 20 1,500 504 325 366 170 170 425 390 250 250 12,000 - 20 20 20 20 20 20 20 20 20 1,500 504 325 366 170 170 425 390 250 250 12,000 - 20 20 20 20 20 20 20 20 20 1,500 504 325 366 170 170 425 390 250 250 12,000 - 20 20 20 20 20 20 20 20 20 1,500 504 325 366 170 170 425 390 250 250 12,000 - 20 20 20 20 20 20 20 20 20 1,500 504 325 366 170 170 425 390 250 250 12,000

1LONDON B
Site ref1234567891011121314151617181920212223242526272829303132333435363738394041424344454647484950
69 70 71 72 73 74 75 76 77 78 79 80 81 82 83 84 85 86 87 88Yields n/a Build costs
NOT USEDRetail A1-ARetail S'MaB1 office B2 industriaB8 storage C1 Hotel C2 resi instD1 D2 Resi Retail A1-A5 Retail S'MaB1 office B2 industriaB8 storage C1 Hotel C2 resi instD1 D2
6.25% 4.50% 6.50% 5.00% 5.00% 5.50% 5.75% 7.00% 7.00% 1,900 2,043 2,391 1,354 1,280 2,637 2,430 1,772 1,772 6.25% 4.50% 6.50% 5.00% 5.00% 5.50% 5.75% 7.00% 7.00% 1,900 2,043 2,391 1,354 1,280 2,637 2,430 1,772 1,772 6.25% 4.50% 6.50% 5.00% 5.00% 5.50% 5.75% 7.00% 7.00% 1,900 2,043 2,391 1,354 1,280 2,637 2,430 1,772 1,772 6.25% 4.50% 6.50% 5.00% 5.00% 5.50% 5.75% 7.00% 7.00% 1,900 2,043 2,391 1,354 1,280 2,637 2,430 1,772 1,772 6.25% 4.50% 6.50% 5.00% 5.00% 5.50% 5.75% 7.00% 7.00% 1,900 2,043 2,391 1,354 1,280 2,637 2,430 1,772 1,772 6.25% 4.50% 6.50% 5.00% 5.00% 5.50% 5.75% 7.00% 7.00% 1,900 2,043 2,391 1,354 1,280 2,637 2,430 1,772 1,772 6.25% 4.50% 6.50% 5.00% 5.00% 5.50% 5.75% 7.00% 7.00% 1,900 2,043 2,391 1,354 1,280 2,637 2,430 1,772 1,772 6.25% 4.50% 6.50% 5.00% 5.00% 5.50% 5.75% 7.00% 7.00% 1,900 2,043 2,391 1,354 1,280 2,637 2,430 1,772 1,772 6.25% 4.50% 6.50% 5.00% 5.00% 5.50% 5.75% 7.00% 7.00% 1,900 2,043 2,391 1,354 1,280 2,637 2,430 1,772 1,772 6.25% 4.50% 6.50% 5.00% 5.00% 5.50% 5.75% 7.00% 7.00% 1,900 2,043 2,391 1,354 1,280 2,637 2,430 1,772 1,772 6.25% 4.50% 6.50% 5.00% 5.00% 5.50% 5.75% 7.00% 7.00% 1,900 2,043 2,391 1,354 1,280 2,637 2,430 1,772 1,772 6.25% 4.50% 6.50% 5.00% 5.00% 5.50% 5.75% 7.00% 7.00% 1,900 2,043 2,391 1,354 1,280 2,637 2,430 1,772 1,772 6.25% 4.50% 6.50% 5.00% 5.00% 5.50% 5.75% 7.00% 7.00% 1,900 2,043 2,391 1,354 1,280 2,637 2,430 1,772 1,772 6.25% 4.50% 6.50% 5.00% 5.00% 5.50% 5.75% 7.00% 7.00% 1,900 2,043 2,391 1,354 1,280 2,637 2,430 1,772 1,772 6.25% 4.50% 6.50% 5.00% 5.00% 5.50% 5.75% 7.00% 7.00% 1,900 2,043 2,391 1,354 1,280 2,637 2,430 1,772 1,772 6.25% 4.50% 6.50% 5.00% 5.00% 5.50% 5.75% 7.00% 7.00% 1,900 2,043 2,391 1,354 1,280 2,637 2,430 1,772 1,772 6.25% 4.50% 6.50% 5.00% 5.00% 5.50% 5.75% 7.00% 7.00% 1,900 2,043 2,391 1,354 1,280 2,637 2,430 1,772 1,772 6.25% 4.50% 6.50% 5.00% 5.00% 5.50% 5.75% 7.00% 7.00% 1,900 2,043 2,391 1,354 1,280 2,637 2,430 1,772 1,772 6.25% 4.50% 6.50% 5.00% 5.00% 5.50% 5.75% 7.00% 7.00% 1,900 2,043 2,391 1,354 1,280 2,637 2,430 1,772 1,772 6.25% 4.50% 6.50% 5.00% 5.00% 5.50% 5.75% 7.00% 7.00% 1,900 2,043 2,391 1,354 1,280 2,637 2,430 1,772 1,772 6.25% 4.50% 6.50% 5.00% 5.00% 5.50% 5.75% 7.00% 7.00% 1,900 2,043 2,391 1,354 1,280 2,637 2,430 1,772 1,772 6.25% 4.50% 6.50% 5.00% 5.00% 5.50% 5.75% 7.00% 7.00% 1,900 2,043 2,391 1,354 1,280 2,637 2,430 1,772 1,772 6.25% 4.50% 6.50% 5.00% 5.00% 5.50% 5.75% 7.00% 7.00% 1,900 2,043 2,391 1,354 1,280 2,637 2,430 1,772 1,772 6.25% 4.50% 6.50% 5.00% 5.00% 5.50% 5.75% 7.00% 7.00% 1,900 2,043 2,391 1,354 1,280 2,637 2,430 1,772 1,772 6.25% 4.50% 6.50% 5.00% 5.00% 5.50% 5.75% 7.00% 7.00% 1,900 2,043 2,391 1,354 1,280 2,637 2,430 1,772 1,772 6.25% 4.50% 6.50% 5.00% 5.00% 5.50% 5.75% 7.00% 7.00% 1,900 2,043 2,391 1,354 1,280 2,637 2,430 1,772 1,772 6.25% 4.50% 6.50% 5.00% 5.00% 5.50% 5.75% 7.00% 7.00% 1,900 2,043 2,391 1,354 1,280 2,637 2,430 1,772 1,772 6.25% 4.50% 6.50% 5.00% 5.00% 5.50% 5.75% 7.00% 7.00% 1,900 2,043 2,391 1,354 1,280 2,637 2,430 1,772 1,772 6.25% 4.50% 6.50% 5.00% 5.00% 5.50% 5.75% 7.00% 7.00% 1,900 2,043 2,391 1,354 1,280 2,637 2,430 1,772 1,772 6.25% 4.50% 6.50% 5.00% 5.00% 5.50% 5.75% 7.00% 7.00% 1,900 2,043 2,391 1,354 1,280 2,637 2,430 1,772 1,772 6.25% 4.50% 6.50% 5.00% 5.00% 5.50% 5.75% 7.00% 7.00% 1,900 2,043 2,391 1,354 1,280 2,637 2,430 1,772 1,772 6.25% 4.50% 6.50% 5.00% 5.00% 5.50% 5.75% 7.00% 7.00% 1,900 2,043 2,391 1,354 1,280 2,637 2,430 1,772 1,772 6.25% 4.50% 6.50% 5.00% 5.00% 5.50% 5.75% 7.00% 7.00% 1,900 2,043 2,391 1,354 1,280 2,637 2,430 1,772 1,772 6.25% 4.50% 6.50% 5.00% 5.00% 5.50% 5.75% 7.00% 7.00% 1,900 2,043 2,391 1,354 1,280 2,637 2,430 1,772 1,772 6.25% 4.50% 6.50% 5.00% 5.00% 5.50% 5.75% 7.00% 7.00% 1,900 2,043 2,391 1,354 1,280 2,637 2,430 1,772 1,772 6.25% 4.50% 6.50% 5.00% 5.00% 5.50% 5.75% 7.00% 7.00% 1,900 2,043 2,391 1,354 1,280 2,637 2,430 1,772 1,772 6.25% 4.50% 6.50% 5.00% 5.00% 5.50% 5.75% 7.00% 7.00% 1,900 2,043 2,391 1,354 1,280 2,637 2,430 1,772 1,772 6.25% 4.50% 6.50% 5.00% 5.00% 5.50% 5.75% 7.00% 7.00% 1,900 2,043 2,391 1,354 1,280 2,637 2,430 1,772 1,772 6.25% 4.50% 6.50% 5.00% 5.00% 5.50% 5.75% 7.00% 7.00% 1,900 2,043 2,391 1,354 1,280 2,637 2,430 1,772 1,772 6.25% 4.50% 6.50% 5.00% 5.00% 5.50% 5.75% 7.00% 7.00% 1,900 2,043 2,391 1,354 1,280 2,637 2,430 1,772 1,772 6.25% 4.50% 6.50% 5.00% 5.00% 5.50% 5.75% 7.00% 7.00% 1,900 2,043 2,391 1,354 1,280 2,637 2,430 1,772 1,772 6.25% 4.50% 6.50% 5.00% 5.00% 5.50% 5.75% 7.00% 7.00% 1,900 2,043 2,391 1,354 1,280 2,637 2,430 1,772 1,772 6.25% 4.50% 6.50% 5.00% 5.00% 5.50% 5.75% 7.00% 7.00% 1,900 2,043 2,391 1,354 1,280 2,637 2,430 1,772 1,772 6.25% 4.50% 6.50% 5.00% 5.00% 5.50% 5.75% 7.00% 7.00% 1,900 2,043 2,391 1,354 1,280 2,637 2,430 1,772 1,772 6.25% 4.50% 6.50% 5.00% 5.00% 5.50% 5.75% 7.00% 7.00% 1,900 2,043 2,391 1,354 1,280 2,637 2,430 1,772 1,772 6.25% 4.50% 6.50% 5.00% 5.00% 5.50% 5.75% 7.00% 7.00% 1,900 2,043 2,391 1,354 1,280 2,637 2,430 1,772 1,772 6.25% 4.50% 6.50% 5.00% 5.00% 5.50% 5.75% 7.00% 7.00% 1,900 2,043 2,391 1,354 1,280 2,637 2,430 1,772 1,772 6.25% 4.50% 6.50% 5.00% 5.00% 5.50% 5.75% 7.00% 7.00% 1,900 2,043 2,391 1,354 1,280 2,637 2,430 1,772 1,772 6.25% 4.50% 6.50% 5.00% 5.00% 5.50% 5.75% 7.00% 7.00% 1,900 2,043 2,391 1,354 1,280 2,637 2,430 1,772 1,772 6.25% 4.50% 6.50% 5.00% 5.00% 5.50% 5.75% 7.00% 7.00% 1,900 2,043 2,391 1,354 1,280 2,637 2,430 1,772 1,772

1LONDON B
Site ref1234567891011121314151617181920212223242526272829303132333435363738394041424344454647484950
89 90 91 92 93 94 95 96 97 98 120 121 122 123 124 125 126 127 128 129 130 131Net to gross Build start (QUARTERS)
DRetail A1-A5Retail S'MaB1 office B2 industrial B8 storage C1 Hotel C2 resi instD1 D2 Resi Highways/S278 Retail A1-ARetail S'MaB1 office B2 industriaB8 storage C1 Hotel C2 resi instD1 D2 Resi
85% 88% 85% 90% 90% 85% 85% 85% 85% 100% 108 1,000 2 2 2 2 2 2 2 2 2 285% 88% 85% 90% 90% 85% 85% 85% 85% 100% 478 5,000 2 2 2 2 2 2 2 2 2 285% 88% 85% 90% 90% 85% 85% 85% 85% 100% 585 6,000 2 2 2 2 2 2 2 2 2 285% 88% 85% 90% 90% 85% 85% 85% 85% 85% 450 - 2 2 2 2 2 2 2 2 2 285% 88% 85% 90% 90% 85% 85% 85% 85% 85% 815 10,000 2 2 2 2 2 2 2 2 2 285% 88% 85% 90% 90% 85% 85% 85% 85% 100% 975 10,000 2 2 2 2 2 2 2 2 2 285% 88% 85% 90% 90% 85% 85% 85% 85% 85% 1,675 15,000 2 2 2 2 2 2 2 2 2 285% 88% 85% 90% 90% 85% 85% 85% 85% 100% 1,413 15,000 2 2 2 2 2 2 2 2 2 285% 88% 85% 90% 90% 85% 85% 85% 85% 85% 4,140 50,000 2 2 2 2 2 2 2 2 2 285% 88% 85% 90% 90% 85% 85% 85% 85% 85% 4,150 50,000 2 2 2 2 2 2 2 2 2 285% 88% 85% 90% 90% 85% 85% 85% 85% 83% 8,400 100,000 2 2 2 2 2 2 2 2 2 285% 88% 85% 90% 90% 85% 85% 85% 85% 83% 8,400 100,000 2 2 2 2 2 2 2 2 2 285% 88% 85% 90% 90% 85% 85% 85% 85% 80% 12,725 150,000 2 2 2 2 2 2 2 2 2 285% 88% 85% 90% 90% 85% 85% 85% 85% 85% 12,275 150,000 2 2 2 2 2 2 2 2 2 285% 88% 85% 90% 90% 85% 85% 85% 85% 83% 20,875 250,000 2 2 2 2 2 2 2 2 2 285% 88% 85% 90% 90% 85% 85% 85% 85% 78% 19,865 250,000 2 2 2 2 2 2 2 2 2 285% 88% 85% 90% 90% 85% 85% 85% 85% 83% 41,500 500,000 2 2 2 2 2 2 2 2 2 285% 88% 85% 90% 90% 85% 85% 85% 85% 78% 62,375 750,000 2 2 2 2 2 2 2 2 2 285% 88% 85% 90% 90% 85% 85% 85% 85% 83% 84,000 1,000,000 2 2 2 2 2 2 2 2 2 285% 88% 85% 90% 90% 85% 85% 85% 85% 83% 126,000 1,500,000 2 2 2 2 2 2 2 2 2 285% 88% 85% 90% 90% 85% 85% 85% 85% 83% 165,500 2,000,000 2 2 2 2 2 2 2 2 2 285% 88% 85% 90% 90% 85% 85% 85% 85% 80% 203,750 2,500,000 2 2 2 2 2 2 2 2 2 285% 88% 85% 90% 90% 85% 85% 85% 85% 85% 4,975 50,000 2 2 2 2 2 2 2 2 2 285% 88% 85% 90% 90% 85% 85% 85% 85% 85% 18,315 250,000 2 2 2 2 2 2 2 2 2 285% 88% 85% 90% 90% 85% 85% 85% 85% 70% 3,750 50,000 2 2 2 2 2 2 2 2 2 285% 88% 85% 90% 90% 85% 85% 85% 85% 70% 3,750 50,000 2 2 2 2 2 2 2 2 2 285% 88% 85% 90% 90% 85% 85% 85% 85% 70% 5,375 75,000 2 2 2 2 2 2 2 2 2 285% 88% 85% 90% 90% 85% 85% 85% 85% 85% 4,000 60,000 2 2 2 2 2 2 2 2 2 285% 88% 85% 90% 90% 85% 85% 85% 85% 85% 8,000 120,000 2 2 2 2 2 2 2 2 2 285% 88% 85% 90% 90% 85% 85% 85% 85% 85% 5,000 75,000 2 2 2 2 2 2 2 2 2 285% 88% 85% 90% 90% 85% 85% 85% 85% 85% 5,000 75,000 2 2 2 2 2 2 2 2 2 285% 88% 85% 90% 90% 85% 85% 85% 85% 85% 5,000 75,000 2 2 2 2 2 2 2 2 2 285% 88% 85% 90% 90% 85% 85% 85% 85% 85% 5,000 75,000 2 2 2 2 2 2 2 2 2 285% 88% 85% 90% 90% 85% 85% 85% 85% 85% 4,000 60,000 2 2 2 2 2 2 2 2 2 285% 88% 85% 90% 90% 85% 85% 85% 85% 85% 6,000 90,000 2 2 2 2 2 2 2 2 2 285% 88% 85% 90% 90% 85% 85% 85% 85% 85% 100 1,500 2 2 2 2 2 2 2 2 2 285% 88% 85% 90% 90% 85% 85% 85% 85% 85% 200 3,000 2 2 2 2 2 2 2 2 2 285% 88% 85% 90% 90% 85% 85% 85% 85% 85% 750 11,250 2 2 2 2 2 2 2 2 2 285% 88% 85% 90% 90% 85% 85% 85% 85% 85% 750 11,250 2 2 2 2 2 2 2 2 2 285% 88% 85% 90% 90% 85% 85% 85% 85% 85% 1,000 15,000 2 2 2 2 2 2 2 2 2 285% 88% 85% 90% 90% 85% 85% 85% 85% 85% 2,500 37,500 2 2 2 2 2 2 2 2 2 285% 88% 85% 90% 90% 85% 85% 85% 85% 85% 4,000 60,000 2 2 2 2 2 2 2 2 2 285% 88% 85% 90% 90% 85% 85% 85% 85% 85% 3,000 45,000 2 2 2 2 2 2 2 2 2 285% 88% 85% 90% 90% 85% 85% 85% 85% 85% 1,500 22,500 2 2 2 2 2 2 2 2 2 285% 88% 85% 90% 90% 85% 85% 85% 85% 85% 250 3,750 2 2 2 2 2 2 2 2 2 285% 88% 85% 90% 90% 85% 85% 85% 85% 85% 3,000 145,000 2 2 2 2 2 2 2 2 2 285% 88% 85% 90% 90% 85% 85% 85% 85% 85% 7,000 305,000 2 2 2 2 2 2 2 2 2 285% 88% 85% 90% 90% 85% 85% 85% 85% 85% 3,750 206,250 2 2 2 2 2 2 2 2 2 285% 88% 85% 90% 90% 85% 85% 85% 85% 85% 5,000 275,000 2 2 2 2 2 2 2 2 2 285% 88% 85% 90% 90% 85% 85% 85% 85% 85% 8,750 481,250 2 2 2 2 2 2 2 2 2 2
Total new floorspace

1LONDON B
Site ref1234567891011121314151617181920212223242526272829303132333435363738394041424344454647484950
132 133 134 135 136 137 138 139 140 141 142 143 144 145 146 147 148 149 150 151 152 153Build period (QUARTERS) Investment sale (QUARTERS) Resi sales period (qtrs) Sales period start
Retail A1-ARetail S'MaB1 office B2 industriaB8 storage C1 Hotel C2 resi instD1 D2 Resi Retail A1-ARetail S'MaB1 office B2 industriaB8 storage C1 Hotel C2 resi instD1 D2 Resi Resi Resi 4 4 4 4 4 4 4 4 4 4 6 6 6 6 6 6 6 6 6 1 64 4 4 4 4 4 4 4 4 4 6 6 6 6 6 6 6 6 6 1 64 4 4 4 4 4 4 4 4 4 6 6 6 6 6 6 6 6 6 1 66 6 6 6 6 6 6 6 6 6 8 8 8 8 8 8 8 8 8 1 86 6 6 6 6 6 6 6 6 6 8 8 8 8 8 8 8 8 8 1 84 4 4 4 4 4 4 4 4 4 6 6 6 6 6 6 6 6 6 1 66 6 6 6 6 6 6 6 6 6 8 8 8 8 8 8 8 8 8 1 84 4 4 4 4 4 4 4 4 4 6 6 6 6 6 6 6 6 6 1 66 6 6 6 6 6 6 6 6 6 8 8 8 8 8 8 8 8 8 2 86 6 6 6 6 6 6 6 6 6 8 8 8 8 8 8 8 8 8 3 88 8 8 8 8 8 8 8 8 8 10 10 10 10 10 10 10 10 10 4 108 8 8 8 8 8 8 8 8 8 10 10 10 10 10 10 10 10 10 4 108 8 8 8 8 8 8 8 8 8 10 10 10 10 10 10 10 10 10 6 108 8 8 8 8 8 8 8 8 8 10 10 10 10 10 10 10 10 10 6 10
10 10 10 10 10 10 10 10 10 10 12 12 12 12 12 12 12 12 12 8 1210 10 10 10 10 10 10 10 10 10 12 12 12 12 12 12 12 12 12 8 1214 14 14 14 14 14 14 14 14 14 16 16 16 16 16 16 16 16 16 14 1016 16 16 16 16 16 16 16 16 16 18 18 18 18 18 18 18 18 18 16 1020 20 20 20 20 20 20 20 20 20 22 22 22 22 22 22 22 22 22 20 1024 24 24 24 24 24 24 24 24 24 26 26 26 26 26 26 26 26 26 24 1028 28 28 28 28 28 28 28 28 28 30 30 30 30 30 30 30 30 30 28 1032 32 32 32 32 32 32 32 32 32 34 34 34 34 34 34 34 34 34 32 10
6 6 6 6 6 6 6 6 6 6 8 8 8 8 8 8 8 8 8 3 815 15 15 15 15 15 15 15 15 15 17 17 17 17 17 17 17 17 17 8 10
6 6 6 6 6 6 6 6 6 6 8 8 8 8 8 8 8 8 8 4 86 6 6 6 6 6 6 6 6 6 8 8 8 8 8 8 8 8 8 4 86 6 6 6 6 6 6 6 6 6 8 8 8 8 8 8 8 8 8 5 86 6 6 6 6 6 6 6 6 6 8 8 8 8 8 8 8 8 8 4 88 8 8 8 8 8 8 8 8 8 10 10 10 10 10 10 10 10 10 4 104 4 4 4 4 4 4 4 4 4 6 6 6 6 6 6 6 6 6 4 64 4 4 4 4 4 4 4 4 4 6 6 6 6 6 6 6 6 6 4 64 4 4 4 4 4 4 4 4 4 6 6 6 6 6 6 6 6 6 4 64 4 4 4 4 4 4 4 4 4 6 6 6 6 6 6 6 6 6 4 66 6 6 6 6 6 6 6 6 6 8 8 8 8 8 8 8 8 8 4 86 6 6 6 6 6 6 6 6 6 8 8 8 8 8 8 8 8 8 4 86 6 6 6 6 6 6 6 6 6 8 8 8 8 8 8 8 8 8 4 86 6 6 6 6 6 6 6 6 6 8 8 8 8 8 8 8 8 8 4 86 6 6 6 6 6 6 6 6 6 8 8 8 8 8 8 8 8 8 4 86 6 6 6 6 6 6 6 6 6 8 8 8 8 8 8 8 8 8 4 86 6 6 6 6 6 6 6 6 6 8 8 8 8 8 8 8 8 8 4 86 6 6 6 6 6 6 6 6 6 8 8 8 8 8 8 8 8 8 4 86 6 6 6 6 6 6 6 6 6 8 8 8 8 8 8 8 8 8 4 86 6 6 6 6 6 6 6 6 6 8 8 8 8 8 8 8 8 8 4 86 6 6 6 6 6 6 6 6 6 8 8 8 8 8 8 8 8 8 4 86 6 6 6 6 6 6 6 6 6 8 8 8 8 8 8 8 8 8 4 86 6 6 6 6 6 6 6 6 6 8 8 8 8 8 8 8 8 8 4 86 6 6 6 6 6 6 6 6 6 8 8 8 8 8 8 8 8 8 4 86 6 6 6 6 6 6 6 6 6 8 8 8 8 8 8 8 8 8 4 86 6 6 6 6 6 6 6 6 6 8 8 8 8 8 8 8 8 8 4 86 6 6 6 6 6 6 6 6 6 8 8 8 8 8 8 8 8 8 4 8

104
Appendix 6 - Sample appraisal

Site details sheet1 of 1
[Page]
LOCAL PLAN AND CIL VIABILITY MODEL This is input source box for reference info that appears on all sheets
Local Authority Site 10 DO NOT CHANGE SITE USING THIS CELL - USE M3 IN "RES ULTS" PAGEArea(s)
Author 0.115272253
Date
Reference
Values: - NOT USED FALSE A Value 1 6500Sales values H B Value 1 6750
Residual Land Values Total units Total floor area GIA Private floor area Ave unit size
CIL as % of dev costs C Value 1 7000Affordable housing percentage 40% £8,888,626 50 4,150 2,490 83 2.8% D Value 1 7250 of which social rented 70% E Value 1 7500 of which intermediate 30% F Value 1 7750
G Value 1 8000Sustainability H Value 1 11500Cost allowance - all tenures (% of base costs) 7.4% I Value 1 12000Cost upliift on commercial 2%Green roofs
Grant available
Site area 0.115272253Scheme above AH threshold y
GIA per unit Units years 1 -5 Units years 6 - 10 Units years 11 - 15 GIA years 1 - 5 GIA years 6 - 10 GIA years 11 - 15 G to N flats NIAs years 1 -5 NIAs years 1 -6 NIAs years 1 -7 Totals Houses 83 - - - - - - 100% - - - - Flats 83 50 - - 4,150 - - 85% 3,528 - - 3,528 Totals 50 - - 4,150 - - 3,528 - - 3,528
Private NIAs 2,117 - - 2,117 PRS units - - - -
Revenue Years 1 -5 Years 6 - 10 Years 11 - 15 Affordable NIAs 1,411 - - 1,411 Value psm 12000 12000 12,000 12,000 Private GDV 25,398,000 - - 25,398,000
85% of MV
Base costs Per sqm Years 1 -5 Years 6 - 10 Years 11 - 15 Houses 1,652 1,652 1,652 1,652 Houses externals 15% 248 248 248 Flats 1,883 1,883 1,883 1,883 Flats externals 15% 282 282 282 Costs + externals 8,986,618 - - 8,986,618
Growth/inflation Year 1-5 Year 6 - 10 Year 11 - 15
Sales 0.00% 0.00% 0.00%Build 0.00% 0.00% 0.00%
1
PRS units to be sold at
20 November 2019
LONDON BOROUGH OF BARNET
check box

Costs, s106, CIL, Timings, Other costs, Inflation 03/12/2019
LOCAL PLAN AND CIL VIABILITY MODEL
Local Authority
Area(s)
Author
Date
Reference
BUILD COSTS
Build start
Build period
Sales period
Sales period start S106 payments CIL Charges (incl Mayoral CIL) Fees
Typology
Build costs per gross sqm - HOUSES
Build costs per gross sq m - FLATS
External works and other costs
Gross to net adjustment for flats Quarters Quarters Quarters
Quarters from start on site
£s per sqm all tenures
Quarter paid
£s p sq m private sales only
Instal-ment 1 - Qtr paid
Instal-ment 2 - Qtr paid
Instal-ment 3 - Qtr paid
% of build cost
Residential £1,652 £1,883 £282 85.0% 2 6 3 8 £1,500 3 £262 1 2 3 10%
NB externals included in base costs in 'sites page'
Highways/S278 £50,000 (Total for scheme)
Employment & training £0
OTHER COSTS Cat 2 accessibility: Applies to all dwellings Nos of units: Houses £521 -
Private 18.00% Flats £924 50 Affordable 6.00%
Zero carbon All tenures 7.4% Cat 3 accessibility Applies to 5% of affordable dwellingsContingency 5% Houses £22,694 - Marketing costs % of sales values 3.00% Flats £7,906 1 Legal Fees % of GDV 0.25%
Site acquisition costs % land value 6.80%
Development Finance 6.00%
TIMINGS for cash flow PLANNING OBLIGATIONS / CIL
Developer return % GDV
LONDON BOROUGH OF BARNET
0
0
20 November 2019
0

COMMERCIAL INPUTS
Value Retail A1-A5 Retail S'Market B1 office B2 industrial B8 storage C1 Hotel C2 resi institutionD1 D2
Rent per sq m £503.97 £325.00 £365.98 £170.00 £170.00 £425.00 £390.45 £250.00 £250.00
Yield 6.25% 4.50% 6.50% 5.00% 5.00% 5.50% 5.75% 7.00% 7.00%
Rent free/void period (years) 1.0 0.50 1.00 1.00 1.00 1.00 1.00 1.00 1.00
Net floor area (sq m) - - - - - - - - -
Purchaser's costs 6.80% 6.80% 6.80% 6.80% 6.80% 6.80% 6.80% 6.80% 6.80%
Disposal CostsLetting Agent's fee (% of rent ) 10.00% 10.00% 10.00% 10.00% 10.00% 10.00% 10.00% 10.00% 10.00%
Agent's fees (on capital value) 1.00% 1.00% 1.00% 1.00% 1.00% 1.00% 1.00% 1.00% 1.00%
Legal fees (% of capital value) 0.75% 0.75% 0.75% 0.75% 0.75% 0.75% 0.75% 0.75% 0.75%
Costs Demolition costs £50 psm £50 psm £50 psm £50 psm £50 psm £50 psm £50 psm £50 psm £50 psm
Demolition area (sq m)
Building costs £1900 psm £2043 psm £2391 psm £1354 psm £1280 psm £2637 psm £2430 psm £1772 psm £1772 psm
Net to gross floor area 85.00% 87.50% 85.00% 90.00% 90.00% 85.00% 85.00% 85.00% 85.00%
External works 10.00% 10.00% 10.00% 10.00% 10.00% 10.00% 10.00% 10.00% 10.00%
CIL (incl Mayoral) £262 £262 £60 £60 £60 £262 £262 £60 £60
Crossrail S106 £0 £0 £0 £0 £0 £0 £0 £0 £0
S106 (per net sq m) £20 psm £20 psm £20 psm £20 psm £20 psm £20 psm £20 psm £20 psm £20 psm
Cashflow timing Quarters Build start 2 2 2 2 2 2 2 2 2
Build period 6 6 6 6 6 6 6 6 6
Investment sale (quarters from start on site) 8 8 8 8 8 8 8 8 8
Note: demolition of existing floorspace is loaded as a single amount on Retail A1-A5
Site 10

Cash Flow1 of 1
03/12/2019Barnet CIL appraisal model 011219.xlsm
LOCAL PLAN AND CIL VIABILITY MODEL
Local Authority
Area(s)
Proxy number
DateReference 0.115272253
DEVELOPMENT PERIOD CASHFLOW
dev hectarage dev acreage
Qtr 1 Qtr 2 Qtr 3 Qtr 4 Qtr 5 Qtr 6 Qtr 7 Qtr 8 Qtr 9 Qtr 10 Qtr 11 Qtr 12 Qtr 13 Qtr 14 Qtr 15 Qtr 16 Qtr 17 Qtr 18 Qtr 19 Qtr 20 Qtr 21 Qtr 22
Project Year 1 Year 1 Year 1 Year 1 Year 2 Year 2 Year 2 Year 2 Year 3 Year 3 Year 3 Year 3 Year 4 Year 4 Year 4 Year 4 Year 5 Year 5 Year 5 Year 5 Year 6 Year 6Revenue per Qtr Totals 1 2 3 4 1 2 3 4 1 2 3 4 1 2 3 4 1 2 3 4 1 2
Revenue0 25,398,000£ 8466000 25,398,000£ 0 0 0 0 0 0 0 8,466,000 8,466,000 8,466,000 0 0 0 0 0 0 0 0 0 0 0 0
Investment value of ground rents 0 -£ -£ -£ 0 0 0 0 0 0 0 0 0 0 0 0 0 0 0 0 0 0 0 0 0 0
GDV before costs of sale Sub Total 25,398,000£ 0 0 0 0 0 0 0 8,466,000 8,466,000 8,466,000 0 0 0 0 0 0 0 0 0 0 0 0Costs of Sale
Marketing costs 3.00% 761,940-£ 0 0 0 0 0 0 0 -253,980 -253,980 -253,980 0 0 0 0 0 0 0 0 0 0 0 0Legal fees 0.25% 63,495-£ 0 0 0 0 0 0 0 -21,165 -21,165 -21,165 0 0 0 0 0 0 0 0 0 0 0 0
Sub Total -£825,435 0 0 0 0 0 0 0 -275,145 -275,145 -275,145 0 0 0 0 0 0 0 0 0 0 0 0
Net commercial investment value Retail A1-A5 -£ -£ -£ 0 0 0 0 0 0 0 0 0 0 0 0 0 0 0 0 0 0 0 0 0 0Retail S'Market -£ -£ -£ 0 0 0 0 0 0 0 0 0 0 0 0 0 0 0 0 0 0 0 0 0 0B1 office -£ -£ -£ 0 0 0 0 0 0 0 0 0 0 0 0 0 0 0 0 0 0 0 0 0 0B2 industrial -£ -£ -£ 0 0 0 0 0 0 0 0 0 0 0 0 0 0 0 0 0 0 0 0 0 0B8 storage -£ -£ -£ 0 0 0 0 0 0 0 0 0 0 0 0 0 0 0 0 0 0 0 0 0 0C1 Hotel -£ -£ -£ 0 0 0 0 0 0 0 0 0 0 0 0 0 0 0 0 0 0 0 0 0 0C2 resi institution -£ -£ -£ 0 0 0 0 0 0 0 0 0 0 0 0 0 0 0 0 0 0 0 0 0 0D1 -£ -£ -£ 0 0 0 0 0 0 0 0 0 0 0 0 0 0 0 0 0 0 0 0 0 0D2 -£ -£ -£ 0 0 0 0 0 0 0 0 0 0 0 0 0 0 0 0 0 0 0 0 0 0
Total commercial value Sub Total £0 0 0 0 0 0 0 0 0 0 0 0 0 0 0 0 0 0 0 0 0 0 0
Speculative NDV 24,572,565£ 0 0 0 0 0 0 0 8,190,855 8,190,855 8,190,855 0 0 0 0 0 0 0 0 0 0 0 0Affordable Housing Revenue
No fees on sale Revenue per Qtr -£ 0 3,871,893£ 645,315 6 3,871,893£ 0 645,315 645,315 645,315 645,315 645,315 645,315 0 0 0 0 0 0 0 0 0 0 0 0 0 0 0
-£
NDV Total 28,444,458£ 0 645,315 645,315 645,315 645,315 645,315 645,315 8,190,855 8,190,855 8,190,855 0 0 0 0 0 0 0 0 0 0 0 0
Standard CostsCost per Qtr
Residential 9,651,627£ 1,608,605 6 9,651,627£ 0 1,608,605 1,608,605 1,608,605 1,608,605 1,608,605 1,608,605 0 0 0 0 0 0 0 0 0 0 0 0 0 0 0GF infrastructure costs -£ Retail A1-A5 -£ - 6 -£ 0 0 0 0 0 0 0 0 0 0 0 0 0 0 0 0 0 0 0 0 0 0Retail S'Market -£ - 6 -£ 0 0 0 0 0 0 0 0 0 0 0 0 0 0 0 0 0 0 0 0 0 0B1 office -£ - 6 -£ 0 0 0 0 0 0 0 0 0 0 0 0 0 0 0 0 0 0 0 0 0 0B2 industrial -£ - 6 -£ 0 0 0 0 0 0 0 0 0 0 0 0 0 0 0 0 0 0 0 0 0 0B8 storage -£ - 6 -£ 0 0 0 0 0 0 0 0 0 0 0 0 0 0 0 0 0 0 0 0 0 0C1 Hotel -£ - 6 -£ 0 0 0 0 0 0 0 0 0 0 0 0 0 0 0 0 0 0 0 0 0 0C2 resi institution -£ - 6 -£ 0 0 0 0 0 0 0 0 0 0 0 0 0 0 0 0 0 0 0 0 0 0D1 -£ - 6 -£ 0 0 0 0 0 0 0 0 0 0 0 0 0 0 0 0 0 0 0 0 0 0D2 -£ - 6 -£ 0 0 0 0 0 0 0 0 0 0 0 0 0 0 0 0 0 0 0 0 0 0Contingency 482,581£ 0 80,430 80,430 80,430 80,430 80,430 80,430 0 0 0 0 0 0 0 0 0 0 0 0 0 0 0
Sub Total 10,134,209£ 0 1,689,035 1,689,035 1,689,035 1,689,035 1,689,035 1,689,035 0 0 0 0 0 0 0 0 0 0 0 0 0 0 0Other Costs
Professional fees 10.00% 1,013,421£ 0 168,903 168,903 168,903 168,903 168,903 168,903 0 0 0 0 0 0 0 0 0 0 0 0 0 0 0
Sub Total 1,013,421£ 0 168,903 168,903 168,903 168,903 168,903 168,903 0 0 0 0 0 0 0 0 0 0 0 0 0 0 0CIL Total 652,112
Resi CIL 217,371£ 217,371£ 217,371 0 0 0 0 0 0 0 0 0 0 0 0 0 0 0 0 0 0 0 0 0217,371£ 217,371£ 0 217,371 0 0 0 0 0 0 0 0 0 0 0 0 0 0 0 0 0 0 0 0
217,371£ 217,371£ 0 0 217,371 0 0 0 0 0 0 0 0 0 0 0 0 0 0 0 0 0 0 0-£ 0 0 0 0 0 0 0 0 0 0 0 0 0 0 0 0 0 0 0 0 0 0
Sub Total 652,112£ 217,371 217,371 217,371 0 0 0 0 0 0 0 0 0 0 0 0 0 0 0 0 0 0 0
Resi Section 106 Costs 0 75,000£ 75,000£ 0 0 75,000 0 0 0 0 0 0 0 0 0 0 0 0 0 0 0 0 0 0 0Accessibility standards 54,106£ 54,106£ 0 0 54,106 0 0 0 0 0 0 0 0 0 0 0 0 0 0 0 0 0 0 0
Green roofs £138,327 £23,054.45 138,327£ 0 23,054 23,054 23,054 23,054 23,054 23,054 0 0 0 0 0 0 0 0 0 0 0 0 0 0 0Employment & Training levy -£ -£ 0
Highways/S278 50,000£ 50,000£ 50,000Sub Total 317,433£ 50,000 23,054 152,160 23,054 23,054 23,054 23,054 0 0 0 0 0 0 0 0 0 0 0 0 0 0 0
Total Other Costs Sub Total 969,545£ 267,371 240,425 369,531 23,054 23,054 23,054 23,054 0 0 0 0 0 0 0 0 0 0 0 0 0 0 0
Total Costs 12,117,174£ 267,371 2,098,363 2,227,469 1,880,993 1,880,993 1,880,993 1,880,993 0 0 0 0 0 0 0 0 0 0 0 0 0 0 0
-£
Developer's profit on GDV % of GDV private 18.00% 4,571,640£ 0 0 0 0 0 0 0 0 0 4,571,640 0 0 0 0 0 0 0 0 0 0 0 0% of GDV commercial 15.00% -£ 0 0 0 0 0 0 0 0 0 0 0 0 0 0 0 0 0 0 0 0 0 0% of GDV affordable 6% 232,314£ 0 0 0 0 0 0 0 0 0 232,314 0 0 0 0 0 0 0 0 0 0 0 0
Residual Sum before interest 11,523,330£ -267,371 -1,453,048 -1,582,154 -1,235,677 -1,235,677 -1,235,677 -1,235,677 8,190,855 8,190,855 3,386,901 0 0 0 0 0 0 0 0 0 0 0 0
Cumulative residual balance for interest calculation -267,371 -1,724,202 -3,330,755 -4,613,566 -5,914,529 -7,233,903 -8,571,947 -502,393 7,681,353 11,068,254 0 0 0 0 0 0 0 0 0 0 0 0
Interest 6.00% 455,075-£ -3,784 -24,399 -47,133 -65,286 -83,696 -102,367 -121,301 -7,109 0 0 0 0 0 0 0 0 0 0 0 0 0 0
Residual Sum for quarter after interest 11,068,254£ -271,154 -1,477,447 -1,629,287 -1,300,964 -1,319,373 -1,338,044 -1,356,978 8,183,746 8,190,855 3,386,901 0 0 0 0 0 0 0 0 0 0 0 0
9,537,152£ 10
Land Value 0 0 0 0 0 0 0 0 0 0 1 1 1 1 1 1 1 1 1 1 1 1
per developable hectare £77,109,850per gross hectare £77,109,850
Residual land value 9,537,152£
Site acquisition costs 6.80% 648,526£
MV (Residual Sum available to offer for Development Oppor tunity) 8,888,626£
Quarterly Interest 1.50% 52.53%
LONDON BOROUGH OF BARNET
10
20 November 2019

105
Appendix 7 - Development appraisals

LB Barnet - CIL viability review
Very small residential (houses) 5 units 0.04 ha
Development mix (square metres GIA) Residential 478 Retail (comparison and A3) - Retail (supermarket) - B1 office - B8 storage - C1 Hotel - C2 residential - D1 - D2 -
Affordable housing 40%
Summary viability Private housing value £5,543,775Affordable housing value £0Commercial value £0Build costs £1,022,998Fees £102,300CIL £195,775Resi S106 £7,500Accessibility standards £2,605Green roofs £35,820Employment & Training levy £0Highways/S278 £5,000Developer's profit £1,031,400Interest £317,567Gross Residual Land Value £2,822,810Stamp duty, agents and legal fees £191,951
NET RESIDUAL LAND VALUE £2,630,859
Benchmark land value £407,951
Viable or unviable Viable

LB Barnet - CIL viability review
Very small residential (house) 1 unit 0.01 ha
Development mix (square metres GIA) Residential 108 Retail (comparison and A3) - Retail (supermarket) - B1 office - B8 storage - C1 Hotel - C2 residential - D1 - D2 -
Affordable housing 40%
Summary viability Private housing value £1,248,075Affordable housing value £0Commercial value £0Build costs £230,308Fees £23,031CIL £44,075Resi S106 £1,500Accessibility standards £521Green roofs £8,060Employment & Training levy £0Highways/S278 £1,000Developer's profit £232,200Interest £71,508Gross Residual Land Value £635,871Stamp duty, agents and legal fees £43,239
NET RESIDUAL LAND VALUE £592,632
Benchmark land value £110,159
Viable or unviable Viable

LB Barnet - CIL viability review
Very small residential (houses) 6 units 0.05 ha
Development mix (square metres GIA) Residential 585 Retail (comparison and A3) - Retail (supermarket) - B1 office - B8 storage - C1 Hotel - C2 residential - D1 - D2 -
Affordable housing 40%
Summary viability Private housing value £6,791,850Affordable housing value £0Commercial value £0Build costs £1,253,307Fees £125,331CIL £239,850Resi S106 £9,000Accessibility standards £3,126Green roofs £43,858Employment & Training levy £0Highways/S278 £6,000Developer's profit £1,263,600Interest £389,077Gross Residual Land Value £3,458,702Stamp duty, agents and legal fees £235,192
NET RESIDUAL LAND VALUE £3,223,510
Benchmark land value £499,490
Viable or unviable Viable

LB Barnet - CIL viability review
Very small residential (flats) 6 units 0.03 ha
Development mix (square metres GIA) Residential 450 Retail (comparison and A3) - Retail (supermarket) - B1 office - B8 storage - C1 Hotel - C2 residential - D1 - D2 -
Affordable housing 40%
Summary viability Private housing value £4,440,825Affordable housing value £0Commercial value £0Build costs £1,098,890Fees £109,889CIL £184,500Resi S106 £9,000Accessibility standards £5,544Green roofs £22,503Employment & Training levy £0Highways/S278 £0Developer's profit £826,200Interest £316,062Gross Residual Land Value £1,868,237Stamp duty, agents and legal fees £127,040
NET RESIDUAL LAND VALUE £1,741,197
Benchmark land value £256,282
Viable or unviable Viable

LB Barnet - CIL viability review
Small residential development (flats) 10 units 0.05 ha
Development mix (square metres GIA) Residential 815 Retail (comparison and A3) - Retail (supermarket) - B1 office - B8 storage - C1 Hotel - C2 residential - D1 - D2 -
Affordable housing 40%
Summary viability Private housing value £4,825,697Affordable housing value £760,384Commercial value £0Build costs £1,990,212Fees £199,021CIL £200,490Resi S106 £15,000Accessibility standards £10,821Green roofs £40,750Employment & Training levy £0Highways/S278 £10,000Developer's profit £943,427Interest £328,795Gross Residual Land Value £1,847,564Stamp duty, agents and legal fees £125,634
NET RESIDUAL LAND VALUE £1,721,930
Benchmark land value £464,101
Viable or unviable Viable

LB Barnet - CIL viability review
Small residential development (houses) 10 units 0.07 ha
Development mix (square metres GIA) Residential 975 Retail (comparison and A3) - Retail (supermarket) - B1 office - B8 storage - C1 Hotel - C2 residential - D1 - D2 -
Affordable housing 40%
Summary viability Private housing value £6,791,850Affordable housing value £1,070,190Commercial value £0Build costs £2,088,844Fees £208,884CIL £239,850Resi S106 £15,000Accessibility standards £9,749Green roofs £73,126Employment & Training levy £0Highways/S278 £10,000Developer's profit £1,327,811Interest £389,345Gross Residual Land Value £3,499,430Stamp duty, agents and legal fees £237,961
NET RESIDUAL LAND VALUE £3,261,469
Benchmark land value £713,847
Viable or unviable Viable

LB Barnet - CIL viability review
Small residential development (flats) 15 units 0.05 ha
Development mix (square metres GIA) Residential 1,675 Retail (comparison and A3) - Retail (supermarket) - B1 office - B8 storage - C1 Hotel - C2 residential - D1 - D2 -
Affordable housing 40%
Summary viability Private housing value £9,917,843Affordable housing value £1,562,752Commercial value £0Build costs £4,090,313Fees £409,031CIL £412,050Resi S106 £22,500Accessibility standards £16,232Green roofs £62,812Employment & Training levy £0Highways/S278 £15,000Developer's profit £1,938,945Interest £677,950Gross Residual Land Value £3,835,761Stamp duty, agents and legal fees £260,832
NET RESIDUAL LAND VALUE £3,574,929
Benchmark land value £536,520
Viable or unviable Viable

LB Barnet - CIL viability review
Small residential development (houses) 15 units 0.07 ha
Development mix (square metres GIA) Residential 1,413 Retail (comparison and A3) - Retail (supermarket) - B1 office - B8 storage - C1 Hotel - C2 residential - D1 - D2 -
Affordable housing 40%
Summary viability Private housing value £9,839,475Affordable housing value £1,550,404Commercial value £0Build costs £3,026,146Fees £302,615CIL £347,475Resi S106 £22,500Accessibility standards £14,623Green roofs £70,618Employment & Training levy £0Highways/S278 £15,000Developer's profit £1,923,624Interest £565,843Gross Residual Land Value £5,101,434Stamp duty, agents and legal fees £346,898
NET RESIDUAL LAND VALUE £4,754,536
Benchmark land value £689,368
Viable or unviable Viable

LB Barnet - CIL viability review
Medium residential dev (flats and houses) 50 units 0.10 ha
Development mix (square metres GIA) Residential 4,140 Retail (comparison and A3) - Retail (supermarket) - B1 office - B8 storage - C1 Hotel - C2 residential - D1 - D2 -
Affordable housing 40%
Summary viability Private housing value £25,378,531Affordable housing value £3,998,889Commercial value £0Build costs £9,861,742Fees £986,174CIL £1,018,440Resi S106 £75,000Accessibility standards £53,034Green roofs £124,200Employment & Training levy £0Highways/S278 £50,000Developer's profit £4,961,521Interest £1,936,281Gross Residual Land Value £10,311,029Stamp duty, agents and legal fees £701,150
NET RESIDUAL LAND VALUE £9,609,879
Benchmark land value £1,060,875
Viable or unviable Viable

LB Barnet - CIL viability review
Medium residential development (flats) 50 units 0.12 ha
Development mix (square metres GIA) Residential 4,150 Retail (comparison and A3) - Retail (supermarket) - B1 office - B8 storage - C1 Hotel - C2 residential - D1 - D2 -
Affordable housing 40%
Summary viability Private housing value £24,572,565Affordable housing value £3,871,893Commercial value £0Build costs £10,134,209Fees £1,013,421CIL £1,020,900Resi S106 £75,000Accessibility standards £54,106Green roofs £138,327Employment & Training levy £0Highways/S278 £50,000Developer's profit £4,803,954Interest £1,968,031Gross Residual Land Value £9,186,511Stamp duty, agents and legal fees £624,683
NET RESIDUAL LAND VALUE £8,561,828
Benchmark land value £1,181,541
Viable or unviable Viable

LB Barnet - CIL viability review
Large residential (flats and houses) 100 units 0.17 ha
Development mix (square metres GIA) Residential 8,400 Retail (comparison and A3) - Retail (supermarket) - B1 office - B8 storage - C1 Hotel - C2 residential - D1 - D2 -
Affordable housing 40%
Summary viability Private housing value £50,322,384Affordable housing value £7,929,285Commercial value £0Build costs £23,765,438Fees £2,376,544CIL £2,066,400Resi S106 £150,000Accessibility standards £106,067Green roofs £209,994Employment & Training levy £0Highways/S278 £100,000Developer's profit £9,838,061Interest £4,804,750Gross Residual Land Value £14,834,415Stamp duty, agents and legal fees £1,008,740
NET RESIDUAL LAND VALUE £13,825,675
Benchmark land value £1,793,697
Viable or unviable Viable

LB Barnet - CIL viability review
Large residential (flats) 100 units 0.13 ha
Development mix (square metres GIA) Residential 8,400 Retail (comparison and A3) - Retail (supermarket) - B1 office - B8 storage - C1 Hotel - C2 residential - D1 - D2 -
Affordable housing 40%
Summary viability Private housing value £48,274,380Affordable housing value £7,606,582Commercial value £0Build costs £25,207,749Fees £2,520,775CIL £2,066,400Resi S106 £150,000Accessibility standards £108,212Green roofs £157,515Employment & Training levy £0Highways/S278 £100,000Developer's profit £9,437,675Interest £4,321,885Gross Residual Land Value £11,810,751Stamp duty, agents and legal fees £803,131
NET RESIDUAL LAND VALUE £11,007,620
Benchmark land value £1,345,442
Viable or unviable Viable

LB Barnet - CIL viability review
Large resdential (flats and houses) 150 units 0.32 ha
Development mix (square metres GIA) Residential 12,725 Retail (comparison and A3) - Retail (supermarket) - B1 office - B8 storage - C1 Hotel - C2 residential - D1 - D2 -
Affordable housing 40%
Summary viability Private housing value £74,459,574Affordable housing value £11,732,576Commercial value £0Build costs £36,001,810Fees £3,600,181CIL £3,130,350Resi S106 £225,000Accessibility standards £159,101Green roofs £381,752Employment & Training levy £0Highways/S278 £150,000Developer's profit £14,556,899Interest £7,791,529Gross Residual Land Value £20,195,529Stamp duty, agents and legal fees £1,373,296
NET RESIDUAL LAND VALUE £18,822,233
Benchmark land value £3,260,801
Viable or unviable Viable

LB Barnet - CIL viability review
Large residential (flats) 150 units 0.14 ha
Development mix (square metres GIA) Residential 12,275 Retail (comparison and A3) - Retail (supermarket) - B1 office - B8 storage - C1 Hotel - C2 residential - D1 - D2 -
Affordable housing 40%
Summary viability Private housing value £72,681,503Affordable housing value £11,452,406Commercial value £0Build costs £36,836,323Fees £3,683,632CIL £3,019,650Resi S106 £225,000Accessibility standards £162,318Green roofs £184,127Employment & Training levy £0Highways/S278 £150,000Developer's profit £14,209,284Interest £7,400,568Gross Residual Land Value £18,263,005Stamp duty, agents and legal fees £1,241,884
NET RESIDUAL LAND VALUE £17,021,121
Benchmark land value £1,398,001
Viable or unviable Viable

LB Barnet - CIL viability review
Large resdential (flats and houses) 250 units 0.43 ha
Development mix (square metres GIA) Residential 20,875 Retail (comparison and A3) - Retail (supermarket) - B1 office - B8 storage - C1 Hotel - C2 residential - D1 - D2 -
Affordable housing 40%
Summary viability Private housing value £125,057,115Affordable housing value £19,705,218Commercial value £0Build costs £59,059,944Fees £5,905,994CIL £5,135,250Resi S106 £375,000Accessibility standards £265,168Green roofs £521,866Employment & Training levy £0Highways/S278 £250,000Developer's profit £24,448,753Interest £16,328,644Gross Residual Land Value £32,471,715Stamp duty, agents and legal fees £2,208,077
NET RESIDUAL LAND VALUE £30,263,638
Benchmark land value £4,457,601
Viable or unviable Viable
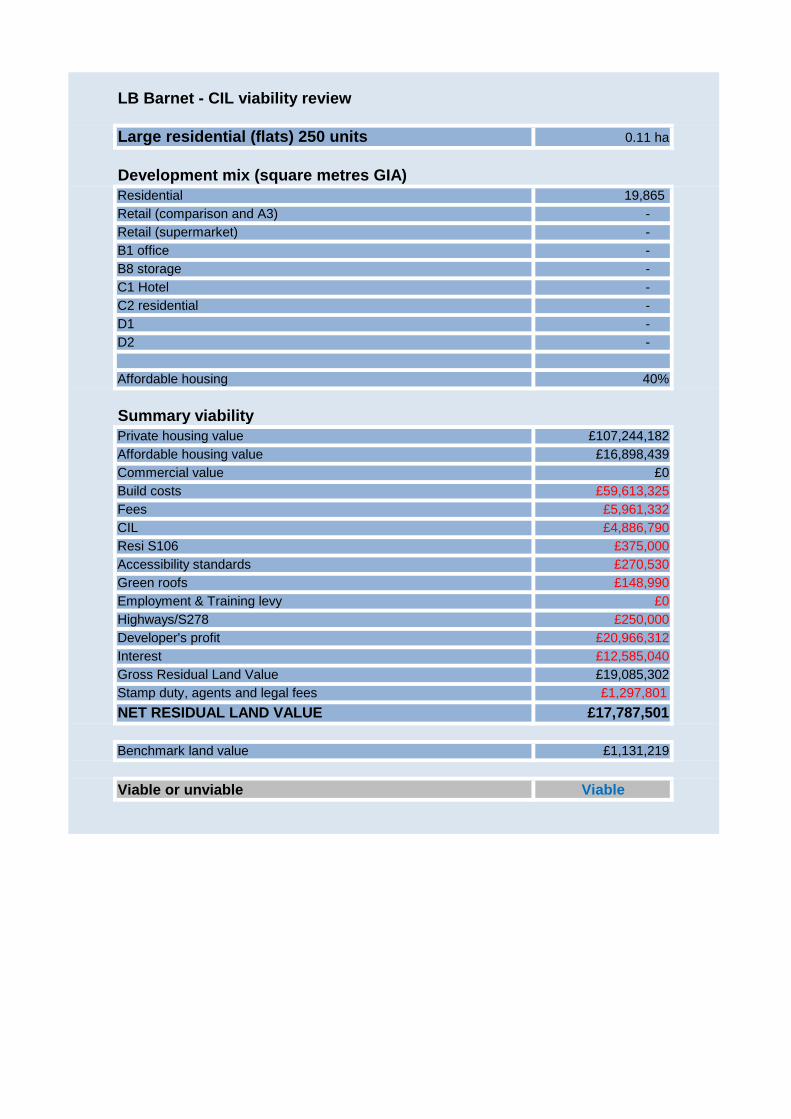
LB Barnet - CIL viability review
Large residential (flats) 250 units 0.11 ha
Development mix (square metres GIA) Residential 19,865 Retail (comparison and A3) - Retail (supermarket) - B1 office - B8 storage - C1 Hotel - C2 residential - D1 - D2 -
Affordable housing 40%
Summary viability Private housing value £107,244,182Affordable housing value £16,898,439Commercial value £0Build costs £59,613,325Fees £5,961,332CIL £4,886,790Resi S106 £375,000Accessibility standards £270,530Green roofs £148,990Employment & Training levy £0Highways/S278 £250,000Developer's profit £20,966,312Interest £12,585,040Gross Residual Land Value £19,085,302Stamp duty, agents and legal fees £1,297,801
NET RESIDUAL LAND VALUE £17,787,501
Benchmark land value £1,131,219
Viable or unviable Viable

LB Barnet - CIL viability review
Large residential (flats) 500 units 0.65 ha
Development mix (square metres GIA) Residential 41,500 Retail (comparison and A3) - Retail (supermarket) - B1 office - B8 storage - C1 Hotel - C2 residential - D1 - D2 -
Affordable housing 40%
Summary viability Private housing value £238,498,425Affordable housing value £37,580,137Commercial value £0Build costs £124,538,283Fees £12,453,828CIL £10,209,000Resi S106 £750,000Accessibility standards £541,060Green roofs £778,124Employment & Training levy £0Highways/S278 £500,000Developer's profit £46,626,608Interest £29,317,866Gross Residual Land Value £50,363,793Stamp duty, agents and legal fees £3,424,738
NET RESIDUAL LAND VALUE £46,939,055
Benchmark land value £6,646,478
Viable or unviable Viable

LB Barnet - CIL viability review
Large residential (flats) 750 units 0.33 ha
Development mix (square metres GIA) Residential 62,375 Retail (comparison and A3) - Retail (supermarket) - B1 office - B8 storage - C1 Hotel - C2 residential - D1 - D2 -
Affordable housing 40%
Summary viability Private housing value £336,740,794Affordable housing value £53,060,163Commercial value £0Build costs £187,182,539Fees £18,718,254CIL £15,344,250Resi S106 £1,125,000Accessibility standards £811,590Green roofs £397,721Employment & Training levy £0Highways/S278 £750,000Developer's profit £65,833,060Interest £40,096,467Gross Residual Land Value £59,542,076Stamp duty, agents and legal fees £4,048,861
NET RESIDUAL LAND VALUE £55,493,215
Benchmark land value £3,397,197
Viable or unviable Viable

LB Barnet - CIL viability review
Large residential (flats) 1,000 units 0.93 ha
Development mix (square metres GIA) Residential 84,000 Retail (comparison and A3) - Retail (supermarket) - B1 office - B8 storage - C1 Hotel - C2 residential - D1 - D2 -
Affordable housing 40%
Summary viability Private housing value £482,743,800Affordable housing value £76,065,820Commercial value £0Build costs £252,077,487Fees £25,207,749CIL £20,664,000Resi S106 £1,500,000Accessibility standards £1,082,120Green roofs £1,050,000Employment & Training levy £0Highways/S278 £1,000,000Developer's profit £94,376,749Interest £66,029,498Gross Residual Land Value £95,822,017Stamp duty, agents and legal fees £6,515,897
NET RESIDUAL LAND VALUE £89,306,120
Benchmark land value £9,566,663
Viable or unviable Viable
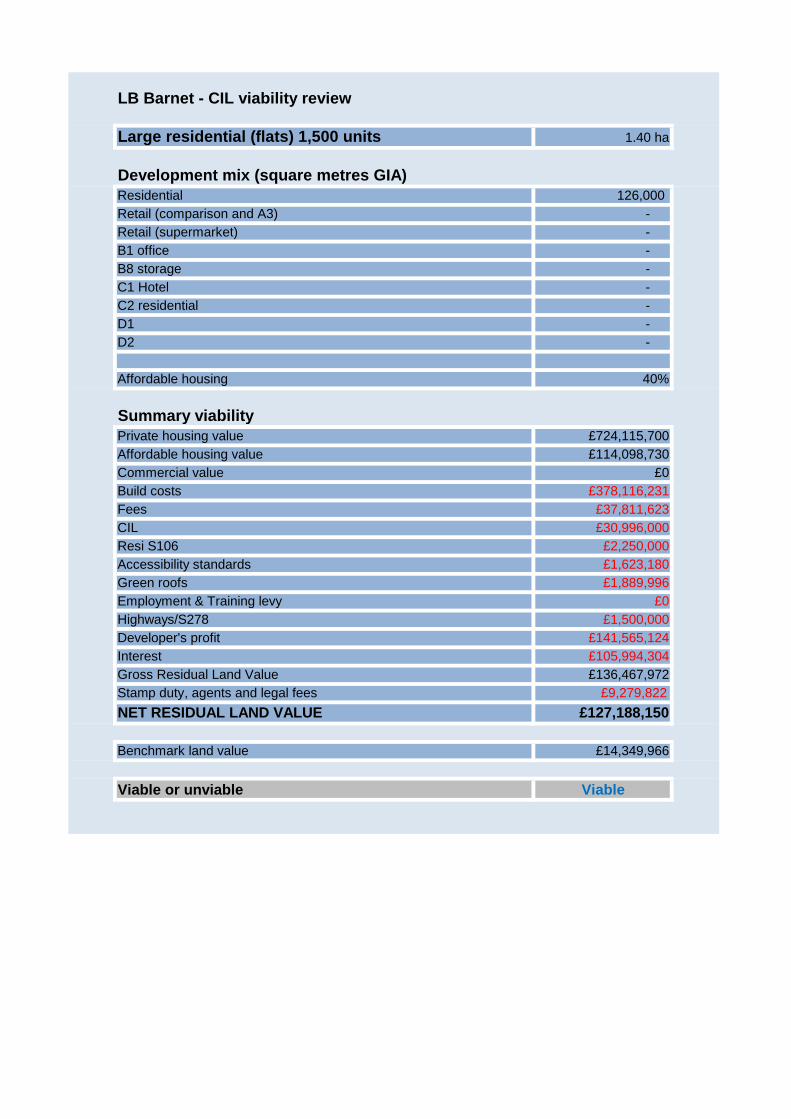
LB Barnet - CIL viability review
Large residential (flats) 1,500 units 1.40 ha
Development mix (square metres GIA) Residential 126,000 Retail (comparison and A3) - Retail (supermarket) - B1 office - B8 storage - C1 Hotel - C2 residential - D1 - D2 -
Affordable housing 40%
Summary viability Private housing value £724,115,700Affordable housing value £114,098,730Commercial value £0Build costs £378,116,231Fees £37,811,623CIL £30,996,000Resi S106 £2,250,000Accessibility standards £1,623,180Green roofs £1,889,996Employment & Training levy £0Highways/S278 £1,500,000Developer's profit £141,565,124Interest £105,994,304Gross Residual Land Value £136,467,972Stamp duty, agents and legal fees £9,279,822
NET RESIDUAL LAND VALUE £127,188,150
Benchmark land value £14,349,966
Viable or unviable Viable

LB Barnet - CIL viability review
Large residential (flats) 2,000 units 1.38 ha
Development mix (square metres GIA) Residential 165,500 Retail (comparison and A3) - Retail (supermarket) - B1 office - B8 storage - C1 Hotel - C2 residential - D1 - D2 -
Affordable housing 40%
Summary viability Private housing value £951,120,225Affordable housing value £149,867,776Commercial value £0Build costs £496,652,669Fees £49,665,267CIL £40,713,000Resi S106 £3,000,000Accessibility standards £2,164,240Green roofs £1,655,000Employment & Training levy £0Highways/S278 £2,000,000Developer's profit £185,944,667Interest £148,819,895Gross Residual Land Value £170,373,264Stamp duty, agents and legal fees £11,585,382
NET RESIDUAL LAND VALUE £158,787,882
Benchmark land value £14,136,454
Viable or unviable Viable

LB Barnet - CIL viability review
Large residential (flats) 2,500 units 1.51 ha
Development mix (square metres GIA) Residential 203,750 Retail (comparison and A3) - Retail (supermarket) - B1 office - B8 storage - C1 Hotel - C2 residential - D1 - D2 -
Affordable housing 40%
Summary viability Private housing value £1,135,458,000Affordable housing value £178,913,833Commercial value £0Build costs £611,437,953Fees £61,143,795CIL £50,122,500Resi S106 £3,750,000Accessibility standards £2,705,300Green roofs £1,697,904Employment & Training levy £0Highways/S278 £2,500,000Developer's profit £221,982,830Interest £179,652,522Gross Residual Land Value £179,379,029Stamp duty, agents and legal fees £12,197,774
NET RESIDUAL LAND VALUE £167,181,255
Benchmark land value £15,469,795
Viable or unviable Viable

LB Barnet - CIL viability review
Estate regeneration (small) 50 houses 0.26 ha
Development mix (square metres GIA) Residential 4,975 Retail (comparison and A3) - Retail (supermarket) - B1 office - B8 storage - C1 Hotel - C2 residential - D1 - D2 -
Affordable housing 40%
Summary viability Private housing value £29,457,473Affordable housing value £4,641,607Commercial value £0Build costs £12,148,840Fees £1,214,884CIL £1,223,850Resi S106 £75,000Accessibility standards £54,106Green roofs £248,741Employment & Training levy £0Highways/S278 £50,000Developer's profit £5,758,956Interest £2,354,443Gross Residual Land Value £10,970,258Stamp duty, agents and legal fees £745,978
NET RESIDUAL LAND VALUE £10,224,280
Benchmark land value £2,614,973
Viable or unviable Viable

LB Barnet - CIL viability review
Estate regeneration (large) 250 flats 0.44 ha
Development mix (square metres GIA) Residential 18,315 Retail (comparison and A3) - Retail (supermarket) - B1 office - B8 storage - C1 Hotel - C2 residential - D1 - D2 -
Affordable housing 40%
Summary viability Private housing value £108,444,947Affordable housing value £17,087,643Commercial value £0Build costs £54,961,895Fees £5,496,190CIL £4,505,490Resi S106 £375,000Accessibility standards £270,530Green roofs £457,833Employment & Training levy £0Highways/S278 £250,000Developer's profit £21,201,063Interest £10,522,441Gross Residual Land Value £27,492,149Stamp duty, agents and legal fees £1,869,466
NET RESIDUAL LAND VALUE £25,622,683
Benchmark land value £4,469,318
Viable or unviable Viable

LB Barnet - CIL viability review
Older person's housing scheme (50 flats) 0.08 ha
Development mix (square metres GIA) Residential 3,750 Retail (comparison and A3) - Retail (supermarket) - B1 office - B8 storage - C1 Hotel - C2 residential - D1 - D2 -
Affordable housing 40%
Summary viability Private housing value £18,285,750Affordable housing value £2,881,281Commercial value £0Build costs £9,157,417Fees £915,742CIL £922,500Resi S106 £75,000Accessibility standards £54,106Green roofs £112,508Employment & Training levy £0Highways/S278 £50,000Developer's profit £3,574,877Interest £1,399,904Gross Residual Land Value £4,904,978Stamp duty, agents and legal fees £333,538
NET RESIDUAL LAND VALUE £4,571,440
Benchmark land value £854,224
Viable or unviable Viable
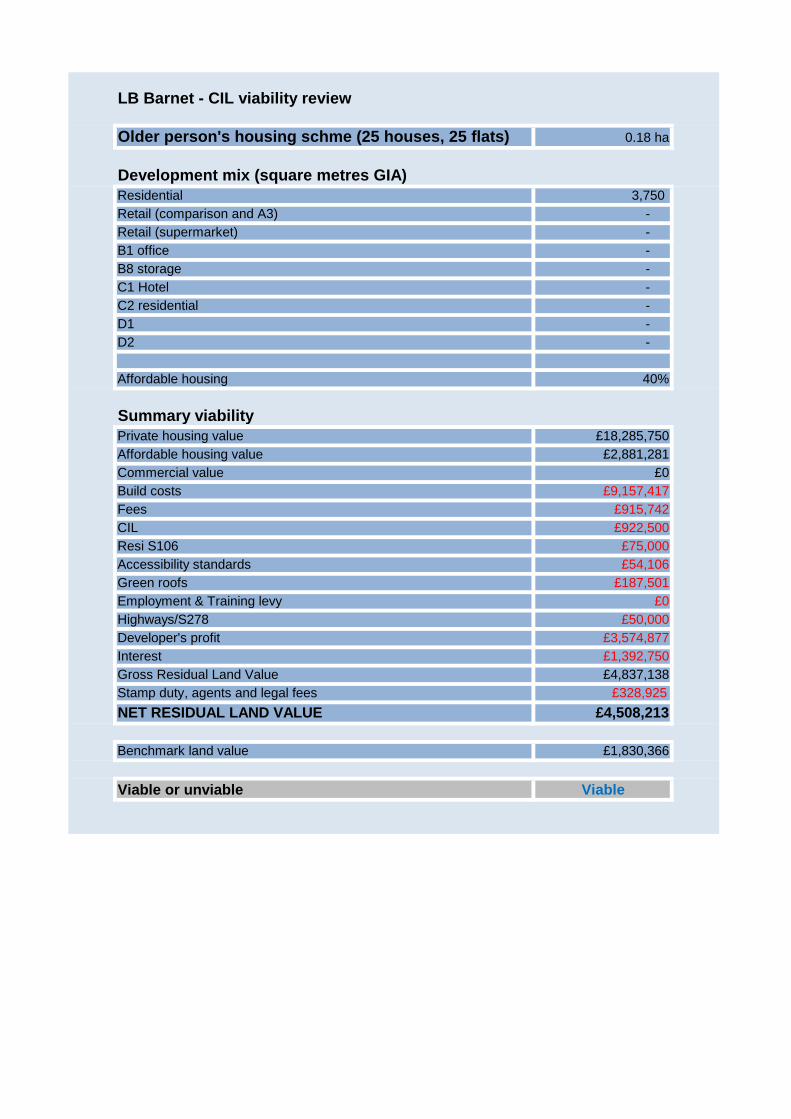
LB Barnet - CIL viability review
Older person's housing schme (25 houses, 25 flats) 0.18 ha
Development mix (square metres GIA) Residential 3,750 Retail (comparison and A3) - Retail (supermarket) - B1 office - B8 storage - C1 Hotel - C2 residential - D1 - D2 -
Affordable housing 40%
Summary viability Private housing value £18,285,750Affordable housing value £2,881,281Commercial value £0Build costs £9,157,417Fees £915,742CIL £922,500Resi S106 £75,000Accessibility standards £54,106Green roofs £187,501Employment & Training levy £0Highways/S278 £50,000Developer's profit £3,574,877Interest £1,392,750Gross Residual Land Value £4,837,138Stamp duty, agents and legal fees £328,925
NET RESIDUAL LAND VALUE £4,508,213
Benchmark land value £1,830,366
Viable or unviable Viable

LB Barnet - CIL viability review
Older person's housing scheme (75 flats) 0.10 ha
Development mix (square metres GIA) Residential 5,375 Retail (comparison and A3) - Retail (supermarket) - B1 office - B8 storage - C1 Hotel - C2 residential - D1 - D2 -
Affordable housing 40%
Summary viability Private housing value £26,209,575Affordable housing value £4,129,836Commercial value £0Build costs £16,129,958Fees £1,612,996CIL £1,322,250Resi S106 £112,500Accessibility standards £81,159Green roofs £134,376Employment & Training levy £0Highways/S278 £75,000Developer's profit £5,123,990Interest £1,845,734Gross Residual Land Value £3,901,448Stamp duty, agents and legal fees £265,298
NET RESIDUAL LAND VALUE £3,636,150
Benchmark land value £1,020,266
Viable or unviable Viable

LB Barnet - CIL viability review
Offices 0.10 ha
Development mix (square metres GIA) Residential - Retail (comparison and A3) - Retail (supermarket) - B1 office 4,000 B8 storage - C1 Hotel - C2 residential - D1 - D2 -
Affordable housing 40%
Summary viability Private housing value £0Affordable housing value £0Commercial value £16,313,693Build costs £11,495,266Fees £1,149,527CIL £0Resi S106 £0Accessibility standards £0Green roofs £120,008Employment & Training levy £0Highways/S278 £60,000Developer's profit £0Interest £697,145Gross Residual Land Value £2,791,747Stamp duty, agents and legal fees £23,439
NET RESIDUAL LAND VALUE £321,254
Benchmark land value £1,025,070
Viable or unviable Unviable
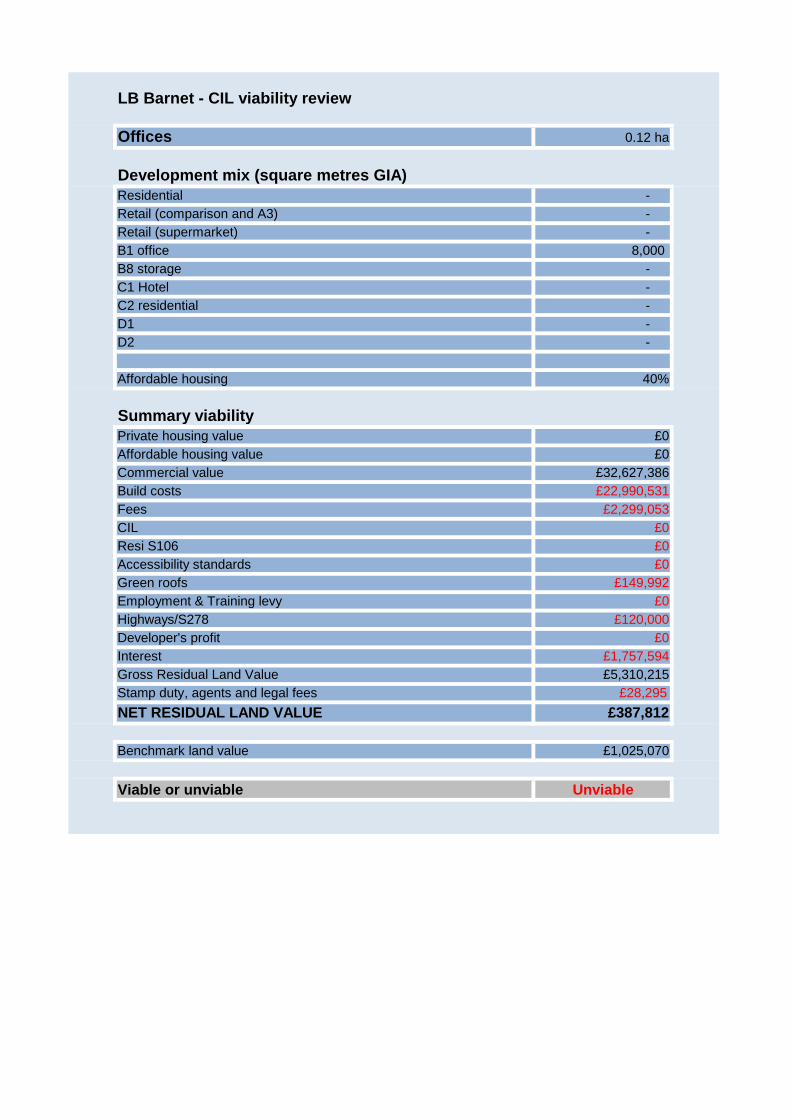
LB Barnet - CIL viability review
Offices 0.12 ha
Development mix (square metres GIA) Residential - Retail (comparison and A3) - Retail (supermarket) - B1 office 8,000 B8 storage - C1 Hotel - C2 residential - D1 - D2 -
Affordable housing 40%
Summary viability Private housing value £0Affordable housing value £0Commercial value £32,627,386Build costs £22,990,531Fees £2,299,053CIL £0Resi S106 £0Accessibility standards £0Green roofs £149,992Employment & Training levy £0Highways/S278 £120,000Developer's profit £0Interest £1,757,594Gross Residual Land Value £5,310,215Stamp duty, agents and legal fees £28,295
NET RESIDUAL LAND VALUE £387,812
Benchmark land value £1,025,070
Viable or unviable Unviable
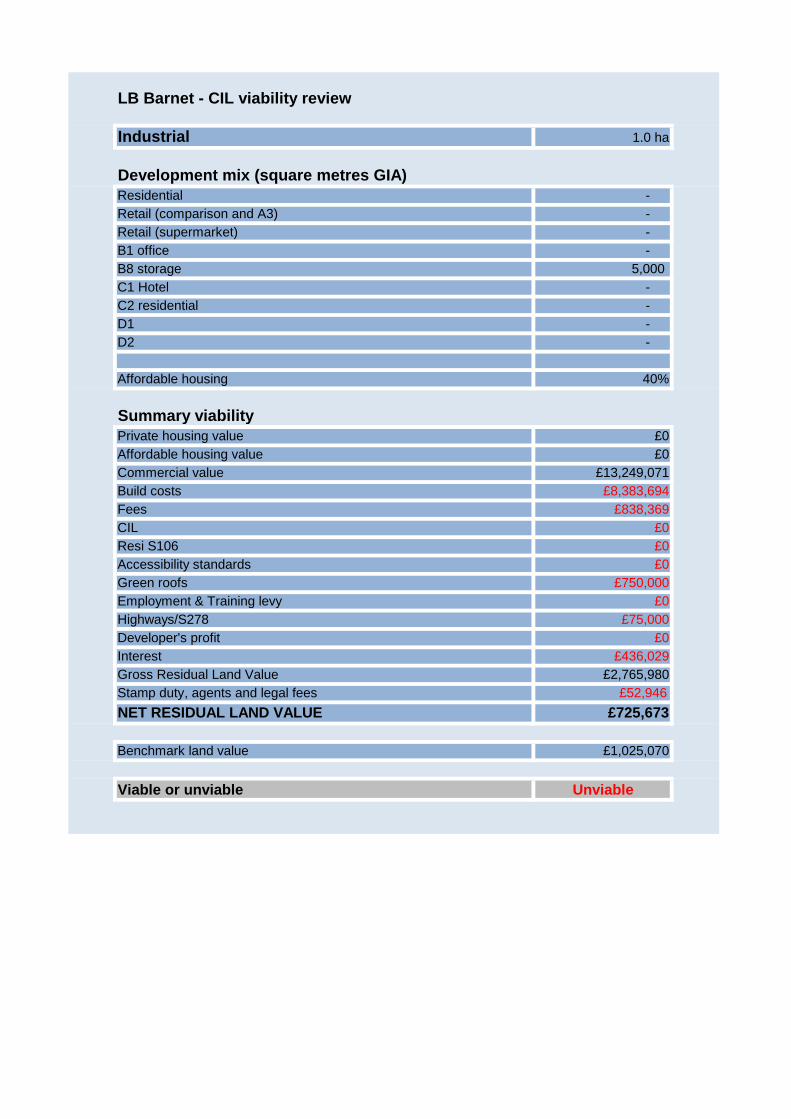
LB Barnet - CIL viability review
Industrial 1.0 ha
Development mix (square metres GIA) Residential - Retail (comparison and A3) - Retail (supermarket) - B1 office - B8 storage 5,000 C1 Hotel - C2 residential - D1 - D2 -
Affordable housing 40%
Summary viability Private housing value £0Affordable housing value £0Commercial value £13,249,071Build costs £8,383,694Fees £838,369CIL £0Resi S106 £0Accessibility standards £0Green roofs £750,000Employment & Training levy £0Highways/S278 £75,000Developer's profit £0Interest £436,029Gross Residual Land Value £2,765,980Stamp duty, agents and legal fees £52,946
NET RESIDUAL LAND VALUE £725,673
Benchmark land value £1,025,070
Viable or unviable Unviable

LB Barnet - CIL viability review
Storage 1.0 ha
Development mix (square metres GIA) Residential - Retail (comparison and A3) - Retail (supermarket) - B1 office - B8 storage - C1 Hotel 5,000 C2 residential - D1 - D2 -
Affordable housing 40%
Summary viability Private housing value £0Affordable housing value £0Commercial value £13,249,071Build costs £7,959,578Fees £795,958CIL £0Resi S106 £0Accessibility standards £0Green roofs £0Employment & Training levy £0Highways/S278 £75,000Developer's profit £0Interest £500,070Gross Residual Land Value £3,918,466Stamp duty, agents and legal fees £131,315
NET RESIDUAL LAND VALUE £1,799,791
Benchmark land value £1,025,070
Viable or unviable Viable

LB Barnet - CIL viability review
Storage 1.0 ha
Development mix (square metres GIA) Residential - Retail (comparison and A3) - Retail (supermarket) - B1 office - B8 storage - C1 Hotel 5,000 C2 residential - D1 - D2 -
Affordable housing 40%
Summary viability Private housing value £0Affordable housing value £0Commercial value £13,249,071Build costs £7,959,578Fees £795,958CIL £0Resi S106 £0Accessibility standards £0Green roofs £750,000Employment & Training levy £0Highways/S278 £75,000Developer's profit £0Interest £460,588Gross Residual Land Value £3,207,948Stamp duty, agents and legal fees £83,000
NET RESIDUAL LAND VALUE £1,137,588
Benchmark land value £1,025,070
Viable or unviable Viable

LB Barnet - CIL viability review
Leisure 0.29 ha
Development mix (square metres GIA) Residential - Retail (comparison and A3) - Retail (supermarket) - B1 office - B8 storage - C1 Hotel - C2 residential - D1 - D2 4,000
Affordable housing 40%
Summary viability Private housing value £0Affordable housing value £0Commercial value £10,293,171Build costs £8,508,839Fees £850,884CIL £0Resi S106 £0Accessibility standards £0Green roofs £299,991Employment & Training levy £0Highways/S278 £60,000Developer's profit £0Interest £349,817Gross Residual Land Value £223,640Stamp duty, agents and legal fees -£89,783
NET RESIDUAL LAND VALUE -£1,230,553
Benchmark land value £1,025,070
Viable or unviable Unviable

LB Barnet - CIL viability review
Leisure 0.29 ha
Development mix (square metres GIA) Residential - Retail (comparison and A3) - Retail (supermarket) - B1 office - B8 storage - C1 Hotel - C2 residential - D1 - D2 6,000
Affordable housing 40%
Summary viability Private housing value £0Affordable housing value £0Commercial value £15,439,756Build costs £12,763,258Fees £1,276,326CIL £0Resi S106 £0Accessibility standards £0Green roofs £299,991Employment & Training levy £0Highways/S278 £90,000Developer's profit £0Interest £532,836Gross Residual Land Value £477,345Stamp duty, agents and legal fees -£125,026
NET RESIDUAL LAND VALUE -£1,713,592
Benchmark land value £1,025,070
Viable or unviable Unviable

LB Barnet - CIL viability review
Retail (smalll scale comparison) 0.01 ha
Development mix (square metres GIA) Residential - Retail (comparison and A3) 100 Retail (supermarket) - B1 office - B8 storage - C1 Hotel - C2 residential - D1 - D2 -
Affordable housing 40%
Summary viability Private housing value £0Affordable housing value £0Commercial value £585,644Build costs £259,065Fees £25,907CIL £0Resi S106 £0Accessibility standards £0Green roofs £15,009Employment & Training levy £0Highways/S278 £1,500Developer's profit £0Interest £35,686Gross Residual Land Value £248,476Stamp duty, agents and legal fees £10,923
NET RESIDUAL LAND VALUE £149,707
Benchmark land value £1,025,070
Viable or unviable Unviable

LB Barnet - CIL viability review
Retail (smalll scale comparison) 0.02 ha
Development mix (square metres GIA) Residential - Retail (comparison and A3) 200 Retail (supermarket) - B1 office - B8 storage - C1 Hotel - C2 residential - D1 - D2 -
Affordable housing 40%
Summary viability Private housing value £0Affordable housing value £0Commercial value £1,171,288Build costs £518,130Fees £51,813CIL £0Resi S106 £0Accessibility standards £0Green roofs £29,994Employment & Training levy £0Highways/S278 £3,000Developer's profit £0Interest £71,375Gross Residual Land Value £496,976Stamp duty, agents and legal fees £21,847
NET RESIDUAL LAND VALUE £299,436
Benchmark land value £1,025,070
Viable or unviable Unviable

LB Barnet - CIL viability review
Retail (medium scale comparison) 0.09 ha
Development mix (square metres GIA) Residential - Retail (comparison and A3) 750 Retail (supermarket) - B1 office - B8 storage - C1 Hotel - C2 residential - D1 - D2 -
Affordable housing 40%
Summary viability Private housing value £0Affordable housing value £0Commercial value £4,392,330Build costs £1,942,988Fees £194,299CIL £0Resi S106 £0Accessibility standards £0Green roofs £112,468Employment & Training levy £0Highways/S278 £11,250Developer's profit £0Interest £267,656Gross Residual Land Value £1,863,669Stamp duty, agents and legal fees £81,928
NET RESIDUAL LAND VALUE £1,122,892
Benchmark land value £1,025,070
Viable or unviable Viable

LB Barnet - CIL viability review
Retail (medium scale comparison) 0.06 ha
Development mix (square metres GIA) Residential - Retail (comparison and A3) 750 Retail (supermarket) - B1 office - B8 storage - C1 Hotel - C2 residential - D1 - D2 -
Affordable housing 40%
Summary viability Private housing value £0Affordable housing value £0Commercial value £4,392,330Build costs £1,942,988Fees £194,299CIL £0Resi S106 £0Accessibility standards £0Green roofs £75,016Employment & Training levy £0Highways/S278 £11,250Developer's profit £0Interest £270,175Gross Residual Land Value £1,898,602Stamp duty, agents and legal fees £84,303
NET RESIDUAL LAND VALUE £1,155,450
Benchmark land value £1,025,070
Viable or unviable Viable

LB Barnet - CIL viability review
Retail (large scale comparison) 0.07 ha
Development mix (square metres GIA) Residential - Retail (comparison and A3) 1,000 Retail (supermarket) - B1 office - B8 storage - C1 Hotel - C2 residential - D1 - D2 -
Affordable housing 40%
Summary viability Private housing value £0Affordable housing value £0Commercial value £5,856,439Build costs £2,590,650Fees £259,065CIL £0Resi S106 £0Accessibility standards £0Green roofs £75,001Employment & Training levy £0Highways/S278 £15,000Developer's profit £0Interest £361,917Gross Residual Land Value £2,554,806Stamp duty, agents and legal fees £113,991
NET RESIDUAL LAND VALUE £1,562,350
Benchmark land value £1,025,070
Viable or unviable Viable

LB Barnet - CIL viability review
Retail (large scale comparison) 0.18 ha
Development mix (square metres GIA) Residential - Retail (comparison and A3) 2,500 Retail (supermarket) - B1 office - B8 storage - C1 Hotel - C2 residential - D1 - D2 -
Affordable housing 40%
Summary viability Private housing value £0Affordable housing value £0Commercial value £14,641,098Build costs £6,476,626Fees £647,663CIL £0Resi S106 £0Accessibility standards £0Green roofs £0Employment & Training levy £0Highways/S278 £37,500Developer's profit £0Interest £917,405Gross Residual Land Value £6,561,905Stamp duty, agents and legal fees £296,870
NET RESIDUAL LAND VALUE £4,068,871
Benchmark land value £1,025,070
Viable or unviable Viable

LB Barnet - CIL viability review
Retail (large scale comparison) 0.31 ha
Development mix (square metres GIA) Residential - Retail (comparison and A3) 4,000 Retail (supermarket) - B1 office - B8 storage - C1 Hotel - C2 residential - D1 - D2 -
Affordable housing 40%
Summary viability Private housing value £0Affordable housing value £0Commercial value £23,425,757Build costs £10,362,601Fees £1,036,260CIL £0Resi S106 £0Accessibility standards £0Green roofs £0Employment & Training levy £0Highways/S278 £60,000Developer's profit £0Interest £1,467,847Gross Residual Land Value £10,499,049Stamp duty, agents and legal fees £474,993
NET RESIDUAL LAND VALUE £6,510,192
Benchmark land value £1,025,070
Viable or unviable Viable

LB Barnet - CIL viability review
Retail (convenience) 0.43 ha
Development mix (square metres GIA) Residential - Retail (comparison and A3) - Retail (supermarket) 3,000 B1 office - B8 storage - C1 Hotel - C2 residential - D1 - D2 -
Affordable housing 40%
Summary viability Private housing value £0Affordable housing value £0Commercial value £16,874,682Build costs £8,268,328Fees £826,833CIL £0Resi S106 £0Accessibility standards £0Green roofs £0Employment & Training levy £0Highways/S278 £45,000Developer's profit £0Interest £997,855Gross Residual Land Value £6,736,667Stamp duty, agents and legal fees £285,972
NET RESIDUAL LAND VALUE £3,919,492
Benchmark land value £1,025,070
Viable or unviable Viable

LB Barnet - CIL viability review
Retail (convenience) 0.20 ha
Development mix (square metres GIA) Residential - Retail (comparison and A3) - Retail (supermarket) 1,500 B1 office - B8 storage - C1 Hotel - C2 residential - D1 - D2 -
Affordable housing 40%
Summary viability Private housing value £0Affordable housing value £0Commercial value £8,437,341Build costs £4,134,164Fees £413,416CIL £0Resi S106 £0Accessibility standards £0Green roofs £0Employment & Training levy £0Highways/S278 £22,500Developer's profit £0Interest £498,928Gross Residual Land Value £3,368,333Stamp duty, agents and legal fees £142,986
NET RESIDUAL LAND VALUE £1,959,746
Benchmark land value £1,025,070
Viable or unviable Viable
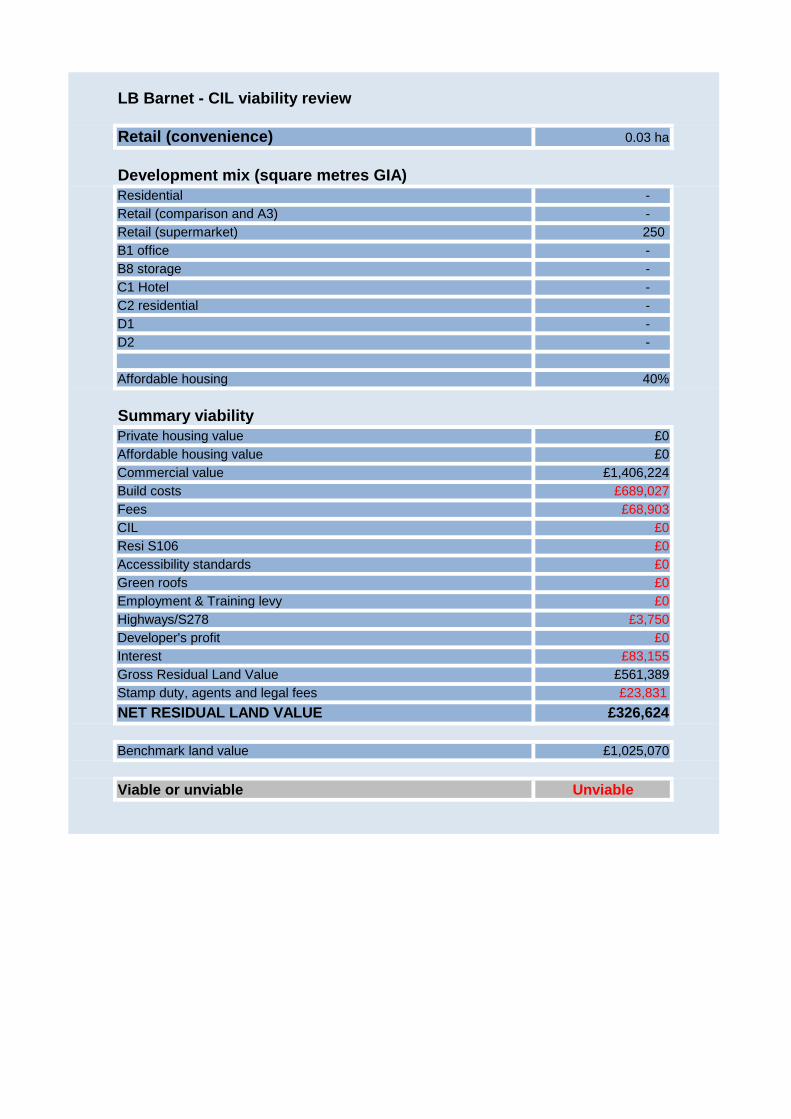
LB Barnet - CIL viability review
Retail (convenience) 0.03 ha
Development mix (square metres GIA) Residential - Retail (comparison and A3) - Retail (supermarket) 250 B1 office - B8 storage - C1 Hotel - C2 residential - D1 - D2 -
Affordable housing 40%
Summary viability Private housing value £0Affordable housing value £0Commercial value £1,406,224Build costs £689,027Fees £68,903CIL £0Resi S106 £0Accessibility standards £0Green roofs £0Employment & Training levy £0Highways/S278 £3,750Developer's profit £0Interest £83,155Gross Residual Land Value £561,389Stamp duty, agents and legal fees £23,831
NET RESIDUAL LAND VALUE £326,624
Benchmark land value £1,025,070
Viable or unviable Unviable

LB Barnet - CIL viability review
Hotel 0.11 ha
Development mix (square metres GIA) Residential - Retail (comparison and A3) - Retail (supermarket) - B1 office - B8 storage - C1 Hotel - C2 residential 3,000 D1 - D2 -
Affordable housing 40%
Summary viability Private housing value £0Affordable housing value £0Commercial value £16,972,011Build costs £10,323,716Fees £1,032,372CIL £0Resi S106 £0Accessibility standards £0Green roofs £0Employment & Training levy £0Highways/S278 £145,000Developer's profit £0Interest £852,998Gross Residual Land Value £4,617,925Stamp duty, agents and legal fees £140,904
NET RESIDUAL LAND VALUE £1,931,220
Benchmark land value £1,025,070
Viable or unviable Viable

LB Barnet - CIL viability review
Hotel 0.16 ha
Development mix (square metres GIA) Residential - Retail (comparison and A3) - Retail (supermarket) - B1 office - B8 storage - C1 Hotel - C2 residential 7,000 D1 - D2 -
Affordable housing 40%
Summary viability Private housing value £0Affordable housing value £0Commercial value £39,601,358Build costs £24,088,670Fees £2,408,867CIL £0Resi S106 £0Accessibility standards £0Green roofs £0Employment & Training levy £0Highways/S278 £305,000Developer's profit £0Interest £1,991,013Gross Residual Land Value £10,807,808Stamp duty, agents and legal fees £330,997
NET RESIDUAL LAND VALUE £4,536,607
Benchmark land value £1,025,070
Viable or unviable Viable

LB Barnet - CIL viability review
Hotel -budget 0.08 ha
Development mix (square metres GIA) Residential - Retail (comparison and A3) - Retail (supermarket) - B1 office - B8 storage - C1 Hotel - C2 residential 3,750 D1 - D2 -
Affordable housing 40%
Summary viability Private housing value £0Affordable housing value £0Commercial value £21,215,013Build costs £12,904,644Fees £1,290,464CIL £0Resi S106 £0Accessibility standards £0Green roofs £0Employment & Training levy £0Highways/S278 £206,250Developer's profit £0Interest £1,065,734Gross Residual Land Value £5,747,920Stamp duty, agents and legal fees £174,465
NET RESIDUAL LAND VALUE £2,391,203
Benchmark land value £1,025,070
Viable or unviable Viable

LB Barnet - CIL viability review
Student 0.12 ha
Development mix (square metres GIA) Residential - Retail (comparison and A3) - Retail (supermarket) - B1 office - B8 storage - C1 Hotel - C2 residential - D1 5,000 D2 -
Affordable housing 40%
Summary viability Private housing value £0Affordable housing value £0Commercial value £24,790,712Build costs £16,272,921Fees £1,627,292CIL £0Resi S106 £0Accessibility standards £0Green roofs £0Employment & Training levy £0Highways/S278 £275,000Developer's profit £0Interest £1,156,364Gross Residual Land Value £5,459,135Stamp duty, agents and legal fees £118,356
NET RESIDUAL LAND VALUE £1,622,172
Benchmark land value £1,025,070
Viable or unviable Viable
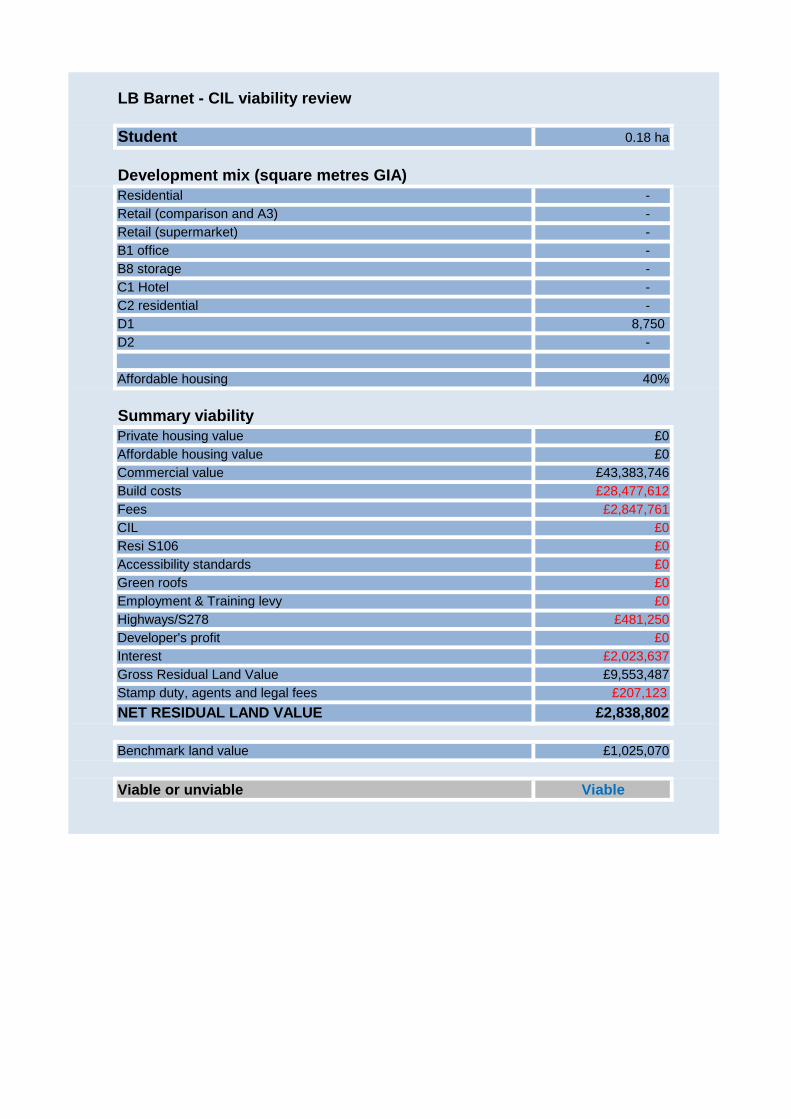
LB Barnet - CIL viability review
Student 0.18 ha
Development mix (square metres GIA) Residential - Retail (comparison and A3) - Retail (supermarket) - B1 office - B8 storage - C1 Hotel - C2 residential - D1 8,750 D2 -
Affordable housing 40%
Summary viability Private housing value £0Affordable housing value £0Commercial value £43,383,746Build costs £28,477,612Fees £2,847,761CIL £0Resi S106 £0Accessibility standards £0Green roofs £0Employment & Training levy £0Highways/S278 £481,250Developer's profit £0Interest £2,023,637Gross Residual Land Value £9,553,487Stamp duty, agents and legal fees £207,123
NET RESIDUAL LAND VALUE £2,838,802
Benchmark land value £1,025,070
Viable or unviable Viable