logo ultralow-power design in near-threshold region prof. : m. shams name: yiqi chang student...
TRANSCRIPT

LOGOUltralow-Power Design inNear-Threshold Region
Prof. : M. Shams
Name: Yiqi Chang
Student #:6624968

LOGO
Outline
Introduction1
Device and Circuit model2
Sensitivity Analysis3
Energy-Delay Optimization4
Sense-Amplifier-Based PTL (SAPTL)5
Architectural Optimization6
Conclusion7

LOGO
Introduction
Question:
Why we need ultralow power?
What is near-threshold region?
LOGO
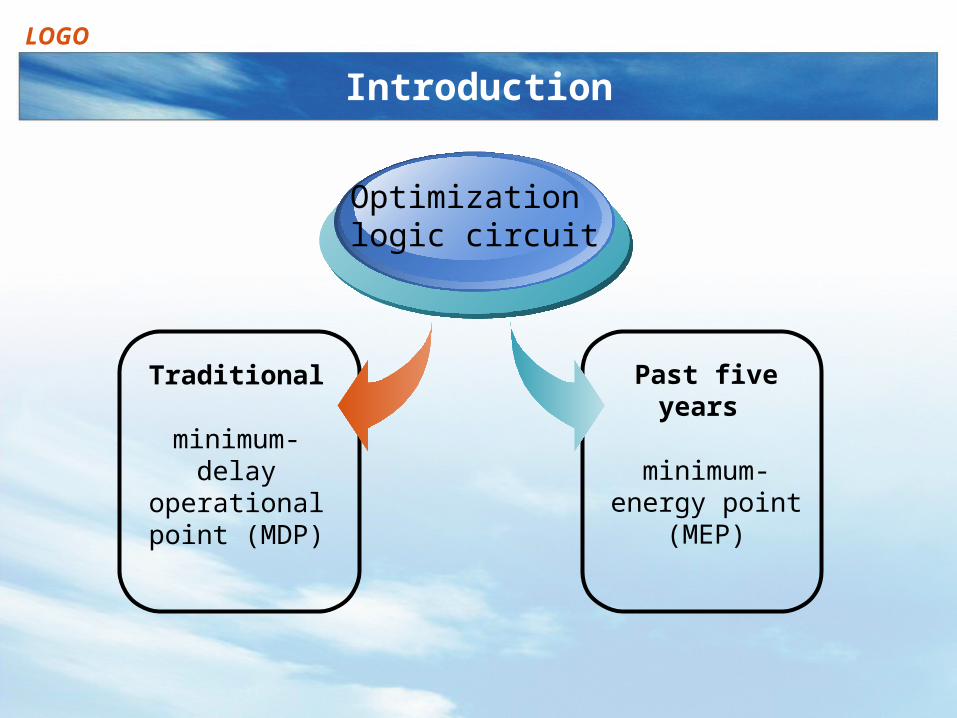
Introduction
Past five years
minimum-energy point
(MEP)
Traditional
minimum-delayoperational point (MDP)
Optimization logic circuit
LOGO
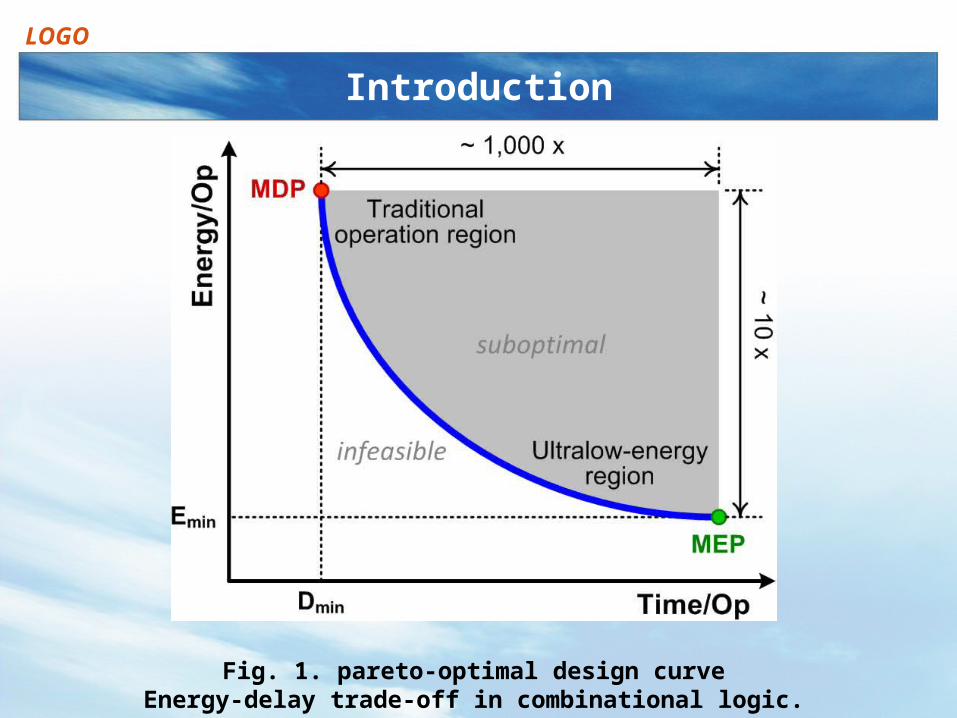
Introduction
Fig. 1. pareto-optimal design curveEnergy-delay trade-off in combinational logic.
LOGO
Introduction
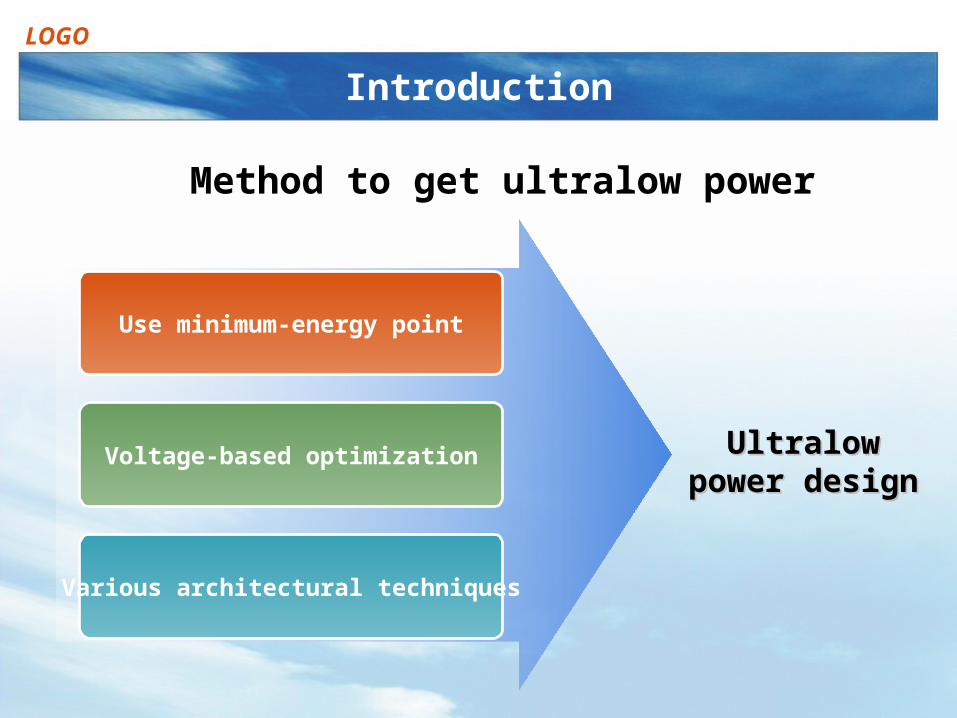
Use minimum-energy point
Voltage-based optimization
Various architectural techniques
Ultralow power Ultralow power designdesign
Method to get ultralow power

LOGO
Device and Circuit model
Current model:Current of starting point (VGS =VT) :
n: subthreshold slope, μ: mobility , Cox: oxide capacitance, and thermal voltage ϕt =kT/q
Current in the vicinity of VT:
IC: inversion coefficient, and kfit is model-fitting parameter

LOGO
Device and Circuit model
inversion coefficient: the degree of inversion of the transistor
sub-VT (IC<1)and above-VT (IC > 1)

LOGO
Device and Circuit model
Fig. 2 Inversion coefficient for HVT and LVT devices for a 65 nm technology.

LOGO
Device and Circuit model
Delay Model:

LOGO
Device and Circuit model
Energy Model:

LOGO
Sensitivity Analysis
gate sizing
supply voltage
threshold voltage
energy-delay trade-offs

LOGO
Sensitivity Analysis
Sensitivity: a parameter x represents a percent reduction in energy for a percent increase in delay

LOGO
Sensitivity Analysis

LOGO
Sensitivity Analysis
Formulas of S:
LOGO
Sensitivity Analysis
Good news for MEP region
Easier to do than to adjust gate sizing.
Not require any layout changes
Could be done after chip fabrication
LOGO
Energy-Delay Optimization
3 parameters for optimization:
Supply
Sizing
VT(selected from the available discrete values)

LOGO
Energy-Delay Optimization

LOGO
Energy-Delay Optimization

LOGO
Energy-Delay Optimization
Make VT is variable for
different regions of
energy-delay cure

LOGO
Sense-Amplifier-Based PTL (SAPTL)
How to make VT various?

LOGO
Sense-Amplifier-Based PTL (SAPTL)
PTL no path from VDD to gnd
LOGO
Sense-Amplifier-Based PTL (SAPTL)
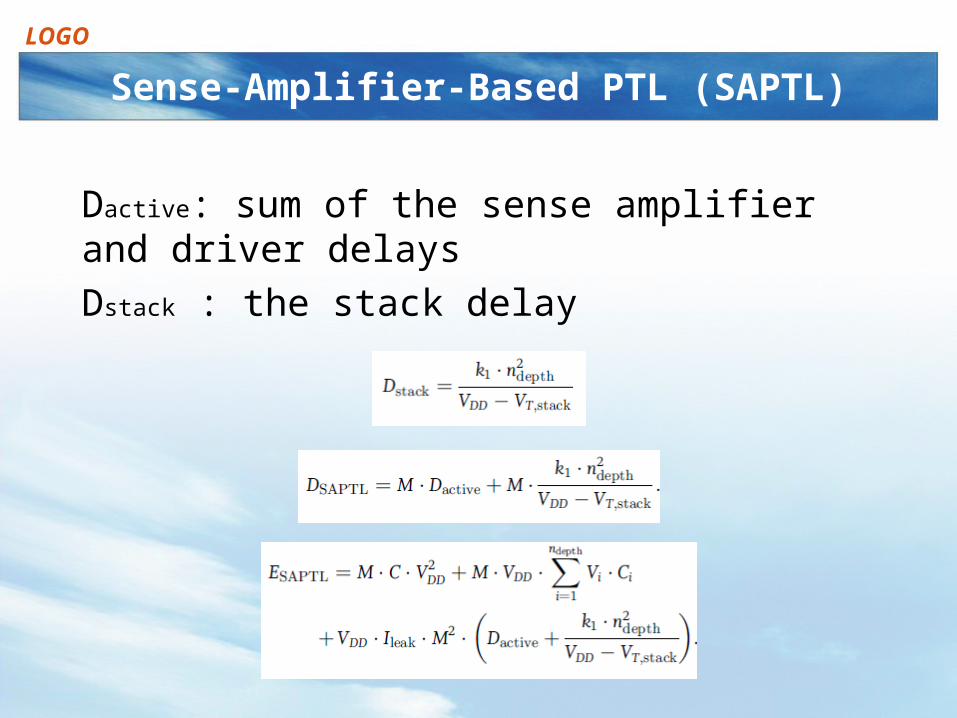
Dactive: sum of the sense amplifier and driver delays
Dstack : the stack delay

LOGO
Sense-Amplifier-Based PTL (SAPTL)
www.themegallery.com

LOGO
Architectural Optimization
Some architectural can be used to get optimizationTime-multiplexing technique
www.themegallery.com
LOGO
Architectural Optimization
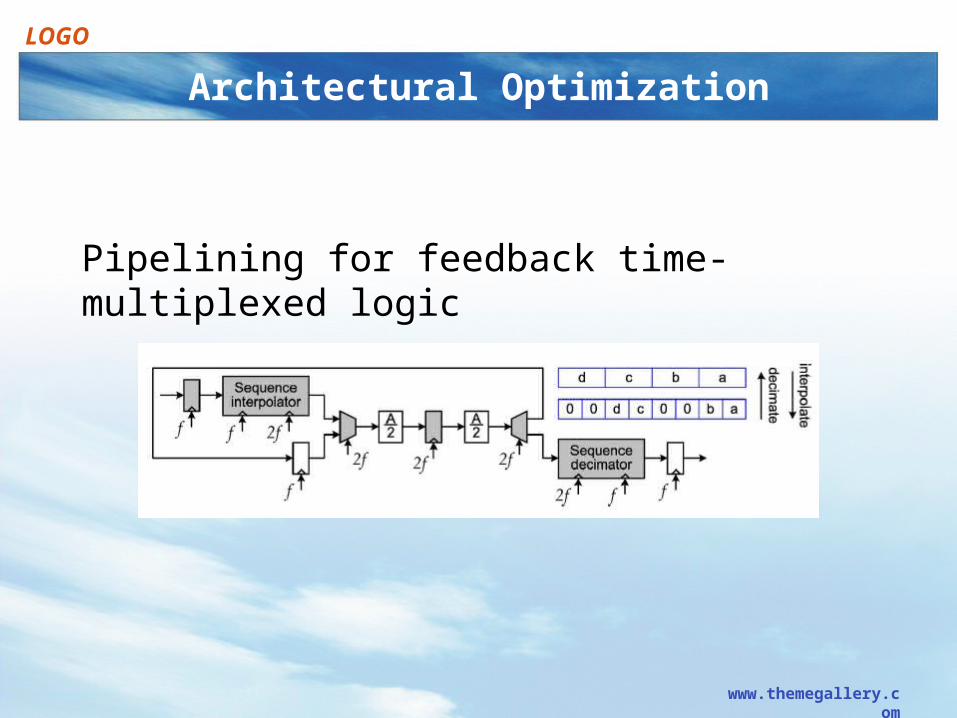
Pipelining for feedback time-multiplexed logic
www.themegallery.com

LOGO
Conclusion
1.MEP: expensive of performance.
2.MDP: expensive of energy.
3.Energy 20%↑ → 10-times in performance↑
4.PTL outperforms standard CMOS in the near-
threshold region(achieving lower energy).
5.The use of time-multiplexing: both lower area
and energy without performance penalty
(reduced leakage that comes with a lower area).

LOGO