logic-based and cellular pharmacodynamic modeling of
TRANSCRIPT
JPET #224766
1
Logic-based and Cellular Pharmacodynamic Modeling of Bortezomib Responses in U266
Human Myeloma Cells
Vaishali L. Chudasama, Meric A. Ovacik, Darrell R. Abernethy, and Donald E. Mager*
Department of Pharmaceutical Sciences, University at Buffalo, SUNY, Buffalo, NY (V.L.C.,
M.O., D.E.M.); and Office of Clinical Pharmacology, Food and Drug Administration, Silver
Springs, MD (D.R.A.)
This article has not been copyedited and formatted. The final version may differ from this version.JPET Fast Forward. Published on July 10, 2015 as DOI: 10.1124/jpet.115.224766
at ASPE
T Journals on A
pril 5, 2022jpet.aspetjournals.org
Dow
nloaded from
This article has not been copyedited and formatted. The final version may differ from this version.JPET Fast Forward. Published on July 10, 2015 as DOI: 10.1124/jpet.115.224766
at ASPE
T Journals on A
pril 5, 2022jpet.aspetjournals.org
Dow
nloaded from
This article has not been copyedited and formatted. The final version may differ from this version.JPET Fast Forward. Published on July 10, 2015 as DOI: 10.1124/jpet.115.224766
at ASPE
T Journals on A
pril 5, 2022jpet.aspetjournals.org
Dow
nloaded from
This article has not been copyedited and formatted. The final version may differ from this version.JPET Fast Forward. Published on July 10, 2015 as DOI: 10.1124/jpet.115.224766
at ASPE
T Journals on A
pril 5, 2022jpet.aspetjournals.org
Dow
nloaded from
This article has not been copyedited and formatted. The final version may differ from this version.JPET Fast Forward. Published on July 10, 2015 as DOI: 10.1124/jpet.115.224766
at ASPE
T Journals on A
pril 5, 2022jpet.aspetjournals.org
Dow
nloaded from
This article has not been copyedited and formatted. The final version may differ from this version.JPET Fast Forward. Published on July 10, 2015 as DOI: 10.1124/jpet.115.224766
at ASPE
T Journals on A
pril 5, 2022jpet.aspetjournals.org
Dow
nloaded from
This article has not been copyedited and formatted. The final version may differ from this version.JPET Fast Forward. Published on July 10, 2015 as DOI: 10.1124/jpet.115.224766
at ASPE
T Journals on A
pril 5, 2022jpet.aspetjournals.org
Dow
nloaded from
This article has not been copyedited and formatted. The final version may differ from this version.JPET Fast Forward. Published on July 10, 2015 as DOI: 10.1124/jpet.115.224766
at ASPE
T Journals on A
pril 5, 2022jpet.aspetjournals.org
Dow
nloaded from
This article has not been copyedited and formatted. The final version may differ from this version.JPET Fast Forward. Published on July 10, 2015 as DOI: 10.1124/jpet.115.224766
at ASPE
T Journals on A
pril 5, 2022jpet.aspetjournals.org
Dow
nloaded from
This article has not been copyedited and formatted. The final version may differ from this version.JPET Fast Forward. Published on July 10, 2015 as DOI: 10.1124/jpet.115.224766
at ASPE
T Journals on A
pril 5, 2022jpet.aspetjournals.org
Dow
nloaded from
This article has not been copyedited and formatted. The final version may differ from this version.JPET Fast Forward. Published on July 10, 2015 as DOI: 10.1124/jpet.115.224766
at ASPE
T Journals on A
pril 5, 2022jpet.aspetjournals.org
Dow
nloaded from
This article has not been copyedited and formatted. The final version may differ from this version.JPET Fast Forward. Published on July 10, 2015 as DOI: 10.1124/jpet.115.224766
at ASPE
T Journals on A
pril 5, 2022jpet.aspetjournals.org
Dow
nloaded from
This article has not been copyedited and formatted. The final version may differ from this version.JPET Fast Forward. Published on July 10, 2015 as DOI: 10.1124/jpet.115.224766
at ASPE
T Journals on A
pril 5, 2022jpet.aspetjournals.org
Dow
nloaded from
This article has not been copyedited and formatted. The final version may differ from this version.JPET Fast Forward. Published on July 10, 2015 as DOI: 10.1124/jpet.115.224766
at ASPE
T Journals on A
pril 5, 2022jpet.aspetjournals.org
Dow
nloaded from
This article has not been copyedited and formatted. The final version may differ from this version.JPET Fast Forward. Published on July 10, 2015 as DOI: 10.1124/jpet.115.224766
at ASPE
T Journals on A
pril 5, 2022jpet.aspetjournals.org
Dow
nloaded from
This article has not been copyedited and formatted. The final version may differ from this version.JPET Fast Forward. Published on July 10, 2015 as DOI: 10.1124/jpet.115.224766
at ASPE
T Journals on A
pril 5, 2022jpet.aspetjournals.org
Dow
nloaded from
This article has not been copyedited and formatted. The final version may differ from this version.JPET Fast Forward. Published on July 10, 2015 as DOI: 10.1124/jpet.115.224766
at ASPE
T Journals on A
pril 5, 2022jpet.aspetjournals.org
Dow
nloaded from
This article has not been copyedited and formatted. The final version may differ from this version.JPET Fast Forward. Published on July 10, 2015 as DOI: 10.1124/jpet.115.224766
at ASPE
T Journals on A
pril 5, 2022jpet.aspetjournals.org
Dow
nloaded from
This article has not been copyedited and formatted. The final version may differ from this version.JPET Fast Forward. Published on July 10, 2015 as DOI: 10.1124/jpet.115.224766
at ASPE
T Journals on A
pril 5, 2022jpet.aspetjournals.org
Dow
nloaded from
This article has not been copyedited and formatted. The final version may differ from this version.JPET Fast Forward. Published on July 10, 2015 as DOI: 10.1124/jpet.115.224766
at ASPE
T Journals on A
pril 5, 2022jpet.aspetjournals.org
Dow
nloaded from
This article has not been copyedited and formatted. The final version may differ from this version.JPET Fast Forward. Published on July 10, 2015 as DOI: 10.1124/jpet.115.224766
at ASPE
T Journals on A
pril 5, 2022jpet.aspetjournals.org
Dow
nloaded from
This article has not been copyedited and formatted. The final version may differ from this version.JPET Fast Forward. Published on July 10, 2015 as DOI: 10.1124/jpet.115.224766
at ASPE
T Journals on A
pril 5, 2022jpet.aspetjournals.org
Dow
nloaded from
This article has not been copyedited and formatted. The final version may differ from this version.JPET Fast Forward. Published on July 10, 2015 as DOI: 10.1124/jpet.115.224766
at ASPE
T Journals on A
pril 5, 2022jpet.aspetjournals.org
Dow
nloaded from
This article has not been copyedited and formatted. The final version may differ from this version.JPET Fast Forward. Published on July 10, 2015 as DOI: 10.1124/jpet.115.224766
at ASPE
T Journals on A
pril 5, 2022jpet.aspetjournals.org
Dow
nloaded from
This article has not been copyedited and formatted. The final version may differ from this version.JPET Fast Forward. Published on July 10, 2015 as DOI: 10.1124/jpet.115.224766
at ASPE
T Journals on A
pril 5, 2022jpet.aspetjournals.org
Dow
nloaded from
This article has not been copyedited and formatted. The final version may differ from this version.JPET Fast Forward. Published on July 10, 2015 as DOI: 10.1124/jpet.115.224766
at ASPE
T Journals on A
pril 5, 2022jpet.aspetjournals.org
Dow
nloaded from
This article has not been copyedited and formatted. The final version may differ from this version.JPET Fast Forward. Published on July 10, 2015 as DOI: 10.1124/jpet.115.224766
at ASPE
T Journals on A
pril 5, 2022jpet.aspetjournals.org
Dow
nloaded from
This article has not been copyedited and formatted. The final version may differ from this version.JPET Fast Forward. Published on July 10, 2015 as DOI: 10.1124/jpet.115.224766
at ASPE
T Journals on A
pril 5, 2022jpet.aspetjournals.org
Dow
nloaded from
This article has not been copyedited and formatted. The final version may differ from this version.JPET Fast Forward. Published on July 10, 2015 as DOI: 10.1124/jpet.115.224766
at ASPE
T Journals on A
pril 5, 2022jpet.aspetjournals.org
Dow
nloaded from
This article has not been copyedited and formatted. The final version may differ from this version.JPET Fast Forward. Published on July 10, 2015 as DOI: 10.1124/jpet.115.224766
at ASPE
T Journals on A
pril 5, 2022jpet.aspetjournals.org
Dow
nloaded from
This article has not been copyedited and formatted. The final version may differ from this version.JPET Fast Forward. Published on July 10, 2015 as DOI: 10.1124/jpet.115.224766
at ASPE
T Journals on A
pril 5, 2022jpet.aspetjournals.org
Dow
nloaded from
JPET #224766
2
Running Title: Mathematical modeling of cellular responses to bortezomib
Corresponding Author: Dr. Donald E. Mager, Department of Pharmaceutical Sciences,
University at Buffalo, SUNY, 431 Kapoor Hall, Buffalo, NY 14214; Tel: (716) 645-2903; Fax:
(716) 829-6569; Email: [email protected]
Text pages: 41
Tables: 1
Figures: 6
References: 56 (limit 60)
Abstract: 247 words (limit 250)
Introduction: 747 words (limit 750)
Discussion: 1348 words (limit 1500)
Abbreviations
NF-κB: nuclear factor kappa B
JAK/STAT: janus kinase/signal transducers and activator of transcription
PI3K/Akt: phosphatidylinositol 3-kinase and protein kinase B
MAPK: mitogen activated protein kinase
TNFα: tumor necrosis factor α
Designated section: Quantitative systems pharmacology
This article has not been copyedited and formatted. The final version may differ from this version.JPET Fast Forward. Published on July 10, 2015 as DOI: 10.1124/jpet.115.224766
at ASPE
T Journals on A
pril 5, 2022jpet.aspetjournals.org
Dow
nloaded from

JPET #224766
3
Abstract
Systems models of biological networks show promise for informing drug target
selection/qualification, identifying lead compounds and factors regulating disease progression,
rationalizing combinatorial regimens, and explaining sources of inter-subject variability and
adverse drug reactions. However, most models of biological systems are qualitative and are not
easily coupled with dynamical models of drug exposure-response relationships. In this proof of
concept study, logic-based modeling of signal transduction pathways in U266 multiple myeloma
(MM) cells is used to guide the development of a simple dynamical model linking bortezomib
exposure to cellular outcomes. Bortezomib is a commonly used first-line agent in MM treatment;
however, knowledge of the signal transduction pathways regulating bortezomib-mediated cell
cytotoxicity is incomplete. A Boolean network model of 66 nodes was constructed that includes
major survival and apoptotic pathways and was updated using responses to several chemical
probes. Simulated responses to bortezomib were in good agreement with experimental data, and
a reduction algorithm was used to identify key signaling proteins. Bortezomib-mediated
apoptosis was not associated with suppression of NFκB protein inhibition in this cell line, which
contradicts a major hypothesis of bortezomib pharmacodynamics. A pharmacodynamic model
was developed that included 3 critical proteins (pNFκB, BclxL, and cleaved PARP). Model-
fitted protein dynamics and cell proliferation profiles agreed with experimental data, and the
model-predicted IC50 (3.5 nM) is comparable to the experimental value (1.5 nM). The cell-based
pharmacodynamic model successfully links bortezomib exposure to MM cellular proliferation
via protein dynamics, and this model may show utility in exploring bortezomib-based
combination regimens.
This article has not been copyedited and formatted. The final version may differ from this version.JPET Fast Forward. Published on July 10, 2015 as DOI: 10.1124/jpet.115.224766
at ASPE
T Journals on A
pril 5, 2022jpet.aspetjournals.org
Dow
nloaded from

JPET #224766
4
Introduction
The fields of systems biology and pharmacokinetic/pharmacodynamic (PK/PD) modeling
have evolved largely in parallel, and there is an emerging consensus that an effective integration
of these disciplines is needed in order to fully realize the promise of each in bringing new
therapeutic molecules and combination regimens to the bedside (Sorger et al., 2011). Traditional
PK/PD models of drug action utilize compartmental structures to integrate the time-course of
drug exposure, pharmacological properties (capacity, sensitivity, and transduction of drug-target
interactions), and (patho)-physiological turnover processes (Mager et al., 2003). Such semi-
mechanistic models contain a minimal number of identifiable parameters to describe temporal
profiles of macro-scale therapeutic and adverse drug effects. When coupled with nonlinear
mixed effects modeling of relatively large clinical trials, a covariate analysis can be used to
identify patient specific characteristics (e.g., genetic polymorphisms) that explain the inter-
individual variability in model parameters (Pillai et al., 2005) Although a major component of
model-based drug development and therapeutics (Milligan et al., 2013), this approach can be
limited by specific study designs and is rarely sufficient for recapitulating multiple, complex
genotype-phenotype relationships.
Significant insights have been realized from the recognition that both drugs and disease
processes give rise to complex and dynamic clinical phenotypes by altering natural
interconnected biochemical networks and support the emergence of systems pharmacology
models of drug action (Zhao and Iyengar, 2012; Huang et al., 2013; Jusko, 2013). Multi-scale
models that combine PK/PD principles and signaling networks can serve as a platform for
integrating genomic/proteomic factors that regulate drug effects and clinical outcomes – so
called enhanced PD (ePD) models (Iyengar et al., 2012). Two major challenges to the
This article has not been copyedited and formatted. The final version may differ from this version.JPET Fast Forward. Published on July 10, 2015 as DOI: 10.1124/jpet.115.224766
at ASPE
T Journals on A
pril 5, 2022jpet.aspetjournals.org
Dow
nloaded from

JPET #224766
5
development of ePD models include the lack of complete mathematical models of signal
transduction networks (e.g., concentrations and reaction rate constants) and unknown
quantitative relationships between individual genomic/proteomic differences and model
parameters. Mechanistic network models are preferred over empirical structures (Birtwistle et al.,
2013); however, such models may not be defined or calibrated to specific pharmacological
and/or disease systems. Logic-based modeling techniques provide a global perspective of system
properties in the absence of kinetic parameters through the integration of qualitative a priori
knowledge of network connections (Albert and Wang, 2009). In this proof of concept study, a
reduction algorithm is applied to a mathematical network to guide the development of a small
signaling model for bortezomib, a potent proteasome inhibitor, which may ultimately serve as an
ePD model for its use in multiple myeloma (MM).
Multiple myeloma is a B-cell neoplasm associated with several co-morbidities including
hypercalcemia, renal insufficiency, anemia, and bone lesions (Caers et al., 2008; Blade et al.,
2010). The prognosis for advanced stages of MM is poor despite multiple treatment options, with
median survival of advanced stage patients of less than 10 months (Richardson et al., 2003;
Richardson et al., 2005). Bortezomib is commonly prescribed alone or in combination with other
anti-myeloma agents (Oancea et al., 2004), and the addition of bortezomib has significantly
improved overall survival of MM patients (Caers et al., 2008). However, almost all patients
relapse and become refractory to all treatment options (Richardson et al., 2005; San Miguel et
al., 2008), and better understanding of MM disease progression and mechanisms of drug action
are critical for improving the treatment of MM.
Bortezomib modulates both survival and apoptotic cellular pathways in MM cells (Figure
1), and multiple mechanisms of action are proposed for inducing cell death, including the
This article has not been copyedited and formatted. The final version may differ from this version.JPET Fast Forward. Published on July 10, 2015 as DOI: 10.1124/jpet.115.224766
at ASPE
T Journals on A
pril 5, 2022jpet.aspetjournals.org
Dow
nloaded from

JPET #224766
6
inhibition of proteasome and the pNFκB pathway (Hideshima et al., 2001; Hideshima et al.,
2002; Hideshima et al., 2003a; Hideshima et al., 2003b). However, recent reports suggest that
bortezomib stimulates RIP (a signaling protein upstream of the NFκB pathway) leading to
activation of pNFκB protein expression (Hideshima et al., 2009). Despite extensive qualitative
information on bortezomib-induced intracellular signaling, mathematical models linking
bortezomib exposure to intracellular protein dynamics have not been established. Systems-level
modeling may facilitate the rational design of single and combinatorial dosing regimens,
approaches to overcome drug resistance, and prevent sub-optimal dosing (Berger and Iyengar,
2011; Zhao and Iyengar, 2012). Mechanistic models are emerging in which chemotherapy
exposure is connected to ultimate responses through target occupancy and biomarker signal
transduction (Yamazaki et al., 2011; Harrold et al., 2012; Kay et al., 2012; Kirouac et al., 2013).
The purpose of this study is to integrate network systems analysis and PK/PD modeling
principles to study bortezomib effects on signal transduction in MM cells. Although the current
study is conducted in U266 cells, the strategic framework may be extended to other cell-lines and
applied to other therapeutic areas.
This article has not been copyedited and formatted. The final version may differ from this version.JPET Fast Forward. Published on July 10, 2015 as DOI: 10.1124/jpet.115.224766
at ASPE
T Journals on A
pril 5, 2022jpet.aspetjournals.org
Dow
nloaded from

JPET #224766
7
Methods
Tissue Culture Materials. The human myeloma cell line U266 (TIB-196TM) was
purchased from ATCC®. IKKi (PS-1145) and JAKi (Jak inhibitor I) were purchased from Santa
Cruz Biotechnology, Inc®. IκBi (BAY11-7085) was purchased from Sigma-Aldrich®. The
clinically available formulation of bortezomib was used for all experiments (Millennium
Pharmaceuticals, Inc). The primary monoclonal antibodies to phospho-p65 (p-p65), p-IκBα, p-
Stat3, Bcl-xL, PARP, p65, Stat3, IκBα, and β-actin were purchased from Cell Signaling
Technology® (Danvers, MA). α-tubulin primary and rabbit and mouse secondary antibodies
were purchased from Santa Cruz Biotechnology, Inc®. WST-1 reagent assay kit was purchased
from Roche®. HRP-conjugate was purchased from BioRad®, and ECL-substrate was purchased
from Thermo Scientific®. RPMI-1640 and FBS were purchased from ATCC®.
Cell Culture Experimental Design. All experiments were conducted in U266 myeloma
cells. Cells were cultured in RPMI 1640 medium supplemented with 15% FBS and 1% pen/strep
antibiotics. Treatment protocols included 1) IKKi (10 µM), 2) JAKi (10 µM), 3) IκBi (10 µM),
4) IKKi and JAKi (10 µM each), 5) IκBi and JAKi (10 µM each), 6) bortezomib (20 and 2 nM),
and 7) DMSO vehicle control. All treatments were continuous for 48h, with the exception of
IκBi experiments (10h). A transient exposure to bortezomib (20 nM) was also conducted, in
which cells were incubated for either 1 or 2h followed by removal of drug from the culture
media and subsequent incubation with vehicle control for up to 48h.
WST-1 Cell Proliferation Assay. Approximately 10,000 cells per well were incubated
with a range of concentrations (from 0.001-100 µM) of JAKi, IKKi, or a combination of IKKi
and JAKi. Incubation experiments with bortezomib alone ranged from 0.001-100 nM. Cell
viability was measured at 0, 24, 48, 72, and 96h according to manufacturer instructions.
This article has not been copyedited and formatted. The final version may differ from this version.JPET Fast Forward. Published on July 10, 2015 as DOI: 10.1124/jpet.115.224766
at ASPE
T Journals on A
pril 5, 2022jpet.aspetjournals.org
Dow
nloaded from

JPET #224766
8
Absorbance was measured at 450 and 690 nm after 2h incubation with WST-1 reagent with a
Microplate spectrophotometer (Molecular Devices, Sunnydale, CA).
Western Blot Analysis. Relative protein expression levels of pStat3, pNFκB, pIκBα,
cleaved PARP, and BclxL were measured following treatment regimens as specified in
Supplemental Table S1. Cells (5×10⁶/10mL culture media) were incubated in 10 cm2 culture
dishes. Cells were collected at the end of the treatment duration, washed with ice cold PBS, and
lysed at 4 °C in RIPA buffer (Cell Signaling Technology®) supplemented with protease and
phosphatase inhibitor cocktail (BioRad®) and PMSF (BioRad®). Protein lysates were stored at -
80 °C until used. Equal amounts of proteins were separated on SDS-PAGE gels and transferred
to nitrocellulose membranes. Immunoblotting was performed according to manufacturer
instructions, and the relative intensity of bands was assessed by densitometric analysis of
digitized images using ImageJ software (National Cancer Institute, Bethesda, MD). All
experiments were conducted in at least duplicate.
Drug Stability. Bortezomib degradation in cell culture was assessed at different time-
points (0, 12, 24, 48, and 72h). Bortezomib concentrations were measured after incubation (20
nM) at 37 °C in culture medium (RPMI1640 supplemented with 15% FBS and 1% Pen/strep)
using an LC-MS/MS assay previously validated in our lab (unpublished). Bortezomib
degradation kinetics were fit with a monoexponential (λ) decay model, and the half-life was
calculated as: ln (2) / λ.
Boolean Network Assembly and Simulations. The Boolean network model (Figure S1)
was drawn with SmartDraw software (http://www.smartdraw.com) and was implemented in
Odefy (http://www.helmholtz-muenchen.de/cmb/odefy) (Wittmann et al., 2009), a MATLAB®
(The Mathworks, Natick, MA) compatible toolbox. Odefy converts Boolean relationships into a
This article has not been copyedited and formatted. The final version may differ from this version.JPET Fast Forward. Published on July 10, 2015 as DOI: 10.1124/jpet.115.224766
at ASPE
T Journals on A
pril 5, 2022jpet.aspetjournals.org
Dow
nloaded from

JPET #224766
9
continuous framework using a Hill type function. In the hypothetical case in which node B
stimulates A, the relationship can be described by ��/�� � 1/���/�� ��� ��. Default
parameter values for k (0.5), n (3), and τ (1) were used for all nodes. All model simulations were
performed using the ‘HillCubeNorm’ option within Odefy (MATLAB model code is provided in
Supplemental materials). Each node in the model was initialized as ON (1) or OFF (0) based on
baseline activity in the cell. For example, if the state is constitutively active in the cell, it was
initialized as 1. A list of Boolean transfer functions and initial state values are summarized in
Table S2 (Supplemental materials). An example of ODEs corresponding to each node, which
were generated using Odefy, are listed in Supplemental materials (Eqs. S1 to S5).
Three specific probes, JAKi, IκBi, and IKKi, were used to develop and update the
network model. The effect of the JAKi was added such that it inhibits nodes JAK1 and JAK2.
The IκBi inhibitor was added by direct inhibition of pIκB node activation. Similarly, the IKKi
effect was added such that it inhibits node IKK. Model simulations were performed to predict
bortezomib outcomes, and drug effect was incorporated as direct inhibition of the proteasome
node and stimulation of the RIP node. For simulations of transient bortezomib exposure, the
bortezomib node was activated for only 1 or 2 iterations.
Network Reduction. The final full Boolean network model developed for U266 cells
(Figure S1) was reduced using a model reduction algorithm (Veliz-Cuba, 2011) to identify
critical proteins involved in bortezomib-mediated signal transduction. Figure 2 shows examples
of the steps taken to reduce the network. First, nodes with only one input and one output are
eliminated and the pathways are reconnected (Figure 2A). For example, RAF was removed and
RAS and MEK1 were directly connected (Figure 2B). In another network reduction rule, non-
functional edges are identified and removed based on the Boolean relationships (algorithm S
This article has not been copyedited and formatted. The final version may differ from this version.JPET Fast Forward. Published on July 10, 2015 as DOI: 10.1124/jpet.115.224766
at ASPE
T Journals on A
pril 5, 2022jpet.aspetjournals.org
Dow
nloaded from

JPET #224766
10
from (Veliz-Cuba, 2011)). For example, Figure 2C shows nodes A, B, and C, with the following
Boolean functions: f(A) = B OR (B AND NOT C), f(B) = (A AND C), and f(C) = A. Hence node
C is non-functional in f(A) because of the ‘OR’ relationship, and the B node is sufficient to elicit
the same effect without invoking C. The resulting diagram is shown (block arrow, Figure 2C)
with the Boolean relationships: f(A) = B, f(B) = (A AND C), and f(C) = A. p21 is an example of
non-functional edges (Figure 2D), and Boolean relationships for p21 (f(p21) = p53 AND (NOT
AKT OR NOT MDM OR NOT MYC OR NOT CKD4)) were refined using step 2 to f(p21) =
p53 AND NOT AKT to remove non-functional edges. AKT is the sole connection to BAD;
therefore, the p21 connection to AKT is retained (Figure 2D).
Finally, non-functional nodes are identified and removed from the network (algorithm R
from Veliz-Cuba, 2011). Before applying this rule, the network is re-wired and the first rule is
re-applied. Nodes that do not have any impact on other nodes are considered non-functional and
removed. In Figure 2E, node C is regulating node B, but at the same time node A is regulating
node C. Therefore, the connection from node C to B can be removed, and consequently node C
can be removed. As an example, the only node modulated by MYC is CYCE, as the MYC
connection to CYCD can be removed because of the AKT connection to CYCD (Figure 2F).
pStat3, MEKK, and ERK stimulate MYC independently, and MEKK was removed following the
first network reduction rule (Figure 2A). Similarly, ERK was removed as it does not modulate
any other node besides MYC. pStat3 modulates several other nodes (e.g., BclxL and XIAP) and
stimulates MYC. MYC can be removed following the one input-one output rule, and therefore
CYCE is directly modulated by pStat3 (Figure 2F), resulting in 4 final nodes. This entire process
was repeated until no further nodes could be removed from the Boolean network. Boolean
This article has not been copyedited and formatted. The final version may differ from this version.JPET Fast Forward. Published on July 10, 2015 as DOI: 10.1124/jpet.115.224766
at ASPE
T Journals on A
pril 5, 2022jpet.aspetjournals.org
Dow
nloaded from

JPET #224766
11
simulations of the final reduced network were compared to simulations of the full network using
Odefy (Wittmann et al., 2009).
Dynamical Model Development. Several critical proteins identified using the model
reduction algorithm were incorporated into a reduced cellular PD model based on mechanisms of
bortezomib action and signal transduction pathways. The reduced dynamic model of bortezomib
is depicted in Figure 3. In brief, bortezomib stimulates protein expression of pNFκB and cleaved
PARP (following delays) and inhibits expression of BclxL. A transit compartment (M1B) was
added to account for the slight delay in stimulation of pNFκB protein expression (Mager and
Jusko, 2001). Bortezomib stimulates the synthesis rate of M1B (ksyn_M1B) via a linear stimulation
coefficient (Sm_M1B), and the rate of change in expression of M1B is defined as:
( ) ( )B B B
Bsyn_M1 m_M1 B deg_M1 B B
d M1=k 1+S C k M1 ; M1 (0) 1
dt⋅ ⋅ − ⋅ = [1]
with CB as the concentration of bortezomib, and kdeg_M1B is a first-order degradation rate constant
of M1B. pNFκB protein expression increases but returns toward the baseline after 24 hours of
continuous bortezomib exposure. To capture this trend, a precursor-dependent indirect response
model was proposed (Sharma et al., 1998), with stimulation of the first-order transfer rate
constant from the precursor pool (pre_pNFκB) to the pNFκB compartment (ktr_NFκB). The rate of
change of pre_pNFκB and pNFκB are described by the following equations:
( ) syn_NFκBsyn_NFκB tr_NFκB B
tr_NFκB
kd pre_pNFκB=k k pre_pNFκB M1 ; pre_pNFκB(0)
dt k− ⋅ ⋅ = [2]
( )tr_NFκB B deg_NFκB
d pNFκB=k pre_pNFκB M1 k pNFκB; pNFκB(0) 1
dt⋅ ⋅ − ⋅ = [3]
with ksyn_NFκB as a zero-order production rate constant of pre_pNFκB, and kdeg_NFκB is a first-
order degradation rate constant of pNFκB. Changes in cleaved PARP expression follows a
This article has not been copyedited and formatted. The final version may differ from this version.JPET Fast Forward. Published on July 10, 2015 as DOI: 10.1124/jpet.115.224766
at ASPE
T Journals on A
pril 5, 2022jpet.aspetjournals.org
Dow
nloaded from

JPET #224766
12
significant delay, and the protein expression profile was best characterized using a time-
dependent transduction model (Mager and Jusko, 2001), with negative feedback from the last
compartment to the synthesis rate of first cleaved PARP compartment in order to characterize the
downward phase of protein expression. Bortezomib stimulates the synthesis rate (ksyn_PARP) of
the first cleaved PARP compartment (cPARP1) with a linear stimulation coefficient (Sm_PARP):
( ) ( )syn_PARP1m_PARP_B B tr_PARP 1 1
4
kd cPARP= 1+S C -k cPARP ; cPARP (0) 1
dt cPARP⋅ ⋅ ⋅ = [4]
The three subsequent transit compartments are described by the general equation:
( ) ( )ntr_PARP n 1 n n
d cPARP=k cPARP cPARP ; cPARP (0) 1
dt −⋅ − = [5]
with n representing the compartment number (n = 2 to 4). pNFκB is a pro-survival transcription
factor that upregulates anti-apoptotic proteins (e.g., BclxL), whereas PARP is a pro-apoptotic
factor that results in apoptosis when activated (cleaved PARP) and stimulates the degradation of
BclxL. The rate of change of BclxL is defined as:
( )syn_Bcl deg_Bcl 4
d BclxL=k pNFκB k cPARP BclxL; BclxL(0) 1
dtλ⋅ − ⋅ ⋅ = [6]
with ksyn_Bcl as a zero-order synthesis rate constant of BclxL, kdeg_Bcl is a first-order degradation
rate constant of BclxL, and λ is a power coefficient for the cleaved PARP effect on BclxL. Cell
proliferation is dependent on the balance between apoptotic and anti-apoptotic signals.
Therefore, cell proliferation (N) was modulated by BclxL and cleaved PARP expression profiles,
with the first-order natural cell death rate constant (kd) inhibited by BclxL and stimulated by
cleaved PARP. N represents cell proliferation:
( )( )d 4
g
d N k cPARP=N k ; N(0) 1
dt 2-BclxL
⎛ ⎞⋅⋅ − =⎜ ⎟⎜ ⎟⎝ ⎠
[7]
This article has not been copyedited and formatted. The final version may differ from this version.JPET Fast Forward. Published on July 10, 2015 as DOI: 10.1124/jpet.115.224766
at ASPE
T Journals on A
pril 5, 2022jpet.aspetjournals.org
Dow
nloaded from

JPET #224766
13
with kg representing a first-order growth rate constant. Secondary equations defining zero-order
production rate constants are listed in Supplemental materials (Eqs. S6-S9).
Data Analysis. The dynamical model (Figure 3) was first fitted to mean pNFκB and
cleaved PARP data, followed by pooling of all relative changes in these protein expression
patterns (naïve pooled data approach). Initially, pNFκB and cleaved PARP protein dynamics
were fit separately. BclxL data were subsequently included and all the data including BclxL,
pNFκB, and cleaved PARP protein dynamics were fitted simultaneously. Next, cell proliferation
was introduced to the existing cellular dynamic model and all of the data (three biomarkers and
cell proliferation) were fitted simultaneously. The in vitro degradation half-life of bortezomib
was included for all model runs. Parameters were estimated using MATLAB (fminsearch
function, Maximum Likelihood algorithm, and ode23s) and a model development framework
(Harrold and Abraham, 2014). All protein dynamics were described using a proportional error
variance model ���� � ����� · � and cell proliferation was fitted using an additive plus
proportional error variance model: ���� � ����� · � � �, with Yobs as the observation at time t,
Ypred is the model predicted value at time t, and σ and ε are estimated variance model parameters.
Model Qualification. The final cell-based model and parameter estimates were used to
simulate protein dynamics and cell proliferation after continuous exposure to a 10-fold lower
bortezomib concentration (2 nM). Simulations were compared to the experimentally measured
cell proliferation and protein expression profiles. Only parameters associated with natural cell
proliferation (kg and kd) were estimated. Cell proliferation was measured at 0, 24, 48, and 72h
and protein expression measurements were made at 0, 1, 4, 6, 8, 11, 24, 33, and 48h. The final
model was also used to predict cell proliferation at 48h for a range of bortezomib concentrations
This article has not been copyedited and formatted. The final version may differ from this version.JPET Fast Forward. Published on July 10, 2015 as DOI: 10.1124/jpet.115.224766
at ASPE
T Journals on A
pril 5, 2022jpet.aspetjournals.org
Dow
nloaded from

JPET #224766
14
(0.001-100 nM). The experimentally estimated IC50 value was compared to the IC50 obtained
from the simulated data.
This article has not been copyedited and formatted. The final version may differ from this version.JPET Fast Forward. Published on July 10, 2015 as DOI: 10.1124/jpet.115.224766
at ASPE
T Journals on A
pril 5, 2022jpet.aspetjournals.org
Dow
nloaded from
JPET #224766
15
Results
Network Development with IKK and JAK Inhibitors. The final Boolean network
model incorporates major survival and apoptotic pathways in U266 cells (Figure S1), and Table
S2 summarizes all node descriptions, Boolean inter-nodal relationships, and initial values. The
green connections in Figure S1 indicate how the initial network was updated based on cellular
responses to the pathway probes. Nodes that are constitutively active under baseline cell
conditions were set as being active (1) or otherwise inactive (0) in the network. An initial
Boolean network was constructed, and the performance of the initial model was tested with two
pathway specific probes, IKKi and JAKi, to inhibit the NFκB and JAK/STAT pathways. In the
Boolean network, the effect of each inhibitor was added such that IKKi inhibits node IKK, and
JAKi inhibits nodes JAK1 and JAK2. Simulations of the initial Boolean network show that
nodes representing pIκBα, pNFκB, pStat3, and BclxL expression decrease gradually upon
inhibition of node IKK (Figure S2A, black dash-dotted lines). Inhibition of pStat3 expression
appears to be due to IL6 inhibition (major stimulus of JAK/STAT3 pathway) via pNFκB
expression. However, in vitro western blot experiments show that expressions of pNFκB,
pStat3, and BclxL remained unchanged after 48h exposure to the IKKi, whereas pIκBα
expression decreased (Figure S2B, black symbols and dotted lines). In contrast, simulations of
the same proteins using the initial model following JAKi exposure (Figure S2A, green dashed
lines) were comparable to observed experimental profiles over 48h (Figure S2B, green symbols
and dashed lines). In order to account for the observed trend in pNFκB expression, the initial
network was modified such that pStat3 also stimulates pNFκB (Figure S1). Although not yet
confirmed in U266 or other MM cell lines, studies suggest cross-talk between NFκB and STAT3
signaling in tumors (Squarize et al., 2006; Lee et al., 2009; Saez-Rodriguez et al., 2011). To
This article has not been copyedited and formatted. The final version may differ from this version.JPET Fast Forward. Published on July 10, 2015 as DOI: 10.1124/jpet.115.224766
at ASPE
T Journals on A
pril 5, 2022jpet.aspetjournals.org
Dow
nloaded from
JPET #224766
16
further test this hypothesis, model simulations were compared for the combination of IKKi and
JAKi treatment with measured temporal expression profiles of pNFκB. Simulations of pNFκB
following combination treatment with JAKi and IKKi using the initial Boolean network showed
a steady decrease over time (data not shown). However, pNFκB expression measured by
western blot analysis only transiently decreased with a return to baseline values (Figure S2B,
blue symbols and dash-dot lines). A detailed evaluation of pNFκB is described in the next
section. Overall, cellular protein dynamic simulations using the final model (Figure S2C)
reasonably agree with the experimental results (Figure S2B).
NFκB Dynamics. As the expression of pNFκB was not suppressed by the IKKi, either as
a single agent or in combination with the JAKi, cellular responses to another NFκB pathway
inhibitor (IκBi) were evaluated alone or in combination with the JAKi. Using the initial Boolean
network, inhibition of node pIκBα by IκBi resulted in simulations showing inhibition of pNFκB
expression (data not shown). However, continuous IκBi exposure to U266 cells for up to 10h
(alone and in combination with JAKi) maintained pIκBα expression below baseline values
(Figure S3A), whereas pNFκB expression transiently decreased followed by a steady increase
above the baseline (Figure S3A). Based on the lack of pNFκB suppression with either the IKKi
or IκBi, alone or in combination with JAKi, additional factors were assumed to govern pNFκB
expression in U266 cells outside of IKK, pIκBα, and pStat3 signaling. This phenomenon was
emulated by incorporating a dummy node ‘X’ to constantly stimulate pNFκB in the final network
(Figure S1). The addition of this factor stabilized the Boolean network and reconciled
simulations (Figures S2C, S2D, and S2F) with all experimental data (Figures S2B, S2E, and
S2G). These results highlight the need to inhibit NFκB activity directly rather than through
upstream pathways. Both final model simulations and experimental data confirm inhibition of
This article has not been copyedited and formatted. The final version may differ from this version.JPET Fast Forward. Published on July 10, 2015 as DOI: 10.1124/jpet.115.224766
at ASPE
T Journals on A
pril 5, 2022jpet.aspetjournals.org
Dow
nloaded from

JPET #224766
17
pIκBα expression following continuous 48h exposure to the IKKi (10 µM), as well as the lack of
suppression of pNFκB and BclxL expression levels (Figures S2B and S2C, black symbols and
dotted lines). Analogously, continuous exposure to the JAKi (10 µM) suppressed expression of
pStat3, whereas pNFκB and BclxL expression levels remained unchanged (Figures S2B and
S2C, green symbols and dashed lines). In addition, final model simulations of U266 cellular
proliferation and apoptosis agreed well with experimental cellular responses (Figure S2D-G). A
range of IKKi and JAKi concentrations (0.001 to 100 µM) was used to evaluate cell viability,
and neither induction of apoptosis nor decreased cell viability was observed after 72h continuous
exposure alone or in combination (Figure S2E and S2G).
Bortezomib Pharmacodynamics. Once the final Boolean network model was updated
using protein dynamics and cellular responses after exposures to probe inhibitors, the model was
used to evaluate bortezomib pharmacodynamics. Bortezomib effect was introduced into the
network such that it directly inhibits the ‘Proteasome’ node and stimulates the ‘RIP’ node
(Figure S1). Stimulation of RIP activates a downstream cascade leading to activation of pIκBα
followed by pNFκB. In the Boolean network, a state initialized as 1 (active) cannot be further
stimulated; therefore, pIκBα and pNFκB signal intensities remain unchanged (Figure S4A, blue
dash-dot line). However, our immunoblot analysis revealed transient increases in pNFκB and
pIκBα expression levels, followed by a gradual return to baseline values (Figure S4B, blue
symbols and lines), which is in agreement with published profiles (Hideshima et al., 2009).
Comparing steady-state values for pNFκB and pIκBα before and after treatment suggests no
change in expression levels, which is in agreement with Boolean network simulations (Figure
S4A). Furthermore, inhibition of proteasome results in accumulated cellular stress that activates
the JNK pathway as well as the apoptotic pathway. The mitochondrial apoptotic pathway
This article has not been copyedited and formatted. The final version may differ from this version.JPET Fast Forward. Published on July 10, 2015 as DOI: 10.1124/jpet.115.224766
at ASPE
T Journals on A
pril 5, 2022jpet.aspetjournals.org
Dow
nloaded from

JPET #224766
18
activates caspase-3 leading to activation of p53 followed by p21, resulting in the inhibition of the
Bcl-2 family proteins (e.g., BclxL and Bcl-2) (Figure S4B, blue symbols and lines). The
activated JNK pathway inversely regulates pStat3 leading to down regulation of pStat3
expression (Figure S4B, blue symbols and lines). Simulations using the final Boolean network
model correctly predicted the inhibition of pStat3 and BclxL in U266 cells after bortezomib
exposure (Figure S4A, blue symbols and lines). In addition, final model simulations of U266
cellular outcomes to bortezomib exposure were in good agreement with in vitro measurements of
cell viability and apoptosis measured via cleaved PARP expression (Figure 4).
In order to further test the fidelity of the Boolean network model to predict bortezomib
pharmacodynamics, we compared Boolean network simulations with experimental results of
cellular responses upon transient bortezomib exposures. Simulations of transient drug exposure
were achieved by maintaining the Bortezomib node as active (1 = ON) for a limited number of
iterations, and the dynamics and steady-states of protein and cellular response nodes were
monitored. Transient experiments were conducted in which U266 cells were briefly exposed
(i.e., for 1 and 2h) to bortezomib. Interestingly, some nodes (e.g., proteasome) returned to
baseline values once bortezomib was removed from the system, whereas other nodes (e.g.,
cleaved PARP or Cl. PARP) achieved a new steady-state even after drug was removed.
Furthermore, steady-state outcomes for several nodes varied depending on the duration of
simulated bortezomib exposure. For example, a relatively short duration of proteasome
suppression produces a transient induction of apoptosis, whereas longer durations of bortezomib
exposure resulted in steady-states of apoptosis induction and inhibited cell growth that are
similar to simulated outcomes following continuous drug exposure. A shorter duration of
bortezomib exposure was associated with a delay in apoptosis induction as compared with
This article has not been copyedited and formatted. The final version may differ from this version.JPET Fast Forward. Published on July 10, 2015 as DOI: 10.1124/jpet.115.224766
at ASPE
T Journals on A
pril 5, 2022jpet.aspetjournals.org
Dow
nloaded from

JPET #224766
19
continuous drug exposure (Figure S5A), and similar trends were observed experimentally
(Figure S5B). Western blot analysis of BclxL and cleaved PARP expression shows a reduced
magnitude in changes from baseline values between transient and continuous bortezomib
exposure. The magnitude of cleaved PARP induction was reduced from 22- to 6-fold after 24h
of bortezomib treatment. Model simulations of selected proteins were comparable with
experimental results (Figure S5A and B). However, stimulation of cleaved PARP is associated
with apoptosis induction, down-regulation of total NFκB expression, and subsequent suppression
of pNFκB expression. In contrast, incubation of U266 cells with bortezomib (20 nM) for 2h
failed to inhibit pNFκB expression (Figure S5C, bottom panel) despite activation of cleaved
PARP for over 48h (Figure S5B, Apoptosis, black triangles). A specific threshold of cleaved
PARP activation might be required to inhibit NFκB expression, which is not incorporated into
the current network model, and further studies are needed to test this hypothesis.
Network Reduction. A Boolean network reduction approach (Veliz-Cuba, 2011)
identified 8 critical nodes (Figure S6A), 5 of which are survival pathway nodes (AKT, pNFκB,
BclxL, proteasome, and pRB) and 3 are apoptotic pathway nodes (Caspase3, JNK, and p21).
Boolean simulations of the reduced network are identical to the steady-state values of the full
network, which further supports the reduction algorithm (Figure S6B). Although Caspase3 was
identified as a critical protein through the Boolean network reduction, cleaved PARP expression
was measured as a marker for apoptosis due to Caspase3 assay limitations.
Bortezomib Cellular Pharmacodynamic Model. Three critical proteins (i.e., pNFκB,
BclxL, and cleaved PARP) were selected from the reduced Boolean network model (Figure S6A)
for measurement and inclusion in the cellular pharmacodynamic model. The final cellular model
(Figure 3) integrates the time-courses of bortezomib exposure, protein dynamics, and cell
This article has not been copyedited and formatted. The final version may differ from this version.JPET Fast Forward. Published on July 10, 2015 as DOI: 10.1124/jpet.115.224766
at ASPE
T Journals on A
pril 5, 2022jpet.aspetjournals.org
Dow
nloaded from

JPET #224766
20
proliferation. Bortezomib elicits its effects on pNFκB via stimulation of upstream proteins in
pNFκB pathway and on cleaved PARP via stress accumulation due to proteasome inhibition.
Upon continuous exposure of U266 cells to bortezomib, pNFκB protein expression is stimulated
after a slight delay with a return toward the baseline (Figure 5A). The slight delay in the
stimulation of pNFκB was well characterized by adding a simple transit compartment (M1B, Eqs.
1 and 2). pNFκB expression was well described by a precursor model, in which the delayed
signal (M1B) stimulates the first-order transfer from the precursor to the pNFκB compartment
(Eqs. 2 and 3). Parameters associated with M1B and pNFκB (kdeg_M1B and Sm_M1B) were not
estimated with good precision, therefore M1B associated parameters were fixed to the estimates
during an initial model run. This had no impact on model performance (i.e., model fits were not
compromised and parameter values did not change substantially), but precision of the estimated
parameters was significantly improved (Table 1). A relatively long delay was observed before
cleaved PARP expression increased (Figure 5B), and a transit-compartment model was selected
to describe this delay. Four transit compartments were found to be adequate, and the total transit
time was well estimated at 26.8h (Table 1, ktr_parp). BclxL expression starts decreasing after 12h
(Figure 5C), and this delay was also well characterized by the proposed model. The initial phase
of BclxL was maintained at steady-state by pNFκB, and the eventual decrease in BclxL
expression was successfully described using cleaved PARP stimulation of the BclxL degradation
rate constant. An exponential growth model well captured the natural cell proliferation under
control conditions (Figure 5D, triangles). The final signal transduction model reasonably
captured the delay in cell death, and parameters were estimated with good precision (Table 1).
Overall, the pharmacodynamic model well characterized the time-courses of protein expression
and cell proliferation profiles after exposure to bortezomib at 20 nM.
This article has not been copyedited and formatted. The final version may differ from this version.JPET Fast Forward. Published on July 10, 2015 as DOI: 10.1124/jpet.115.224766
at ASPE
T Journals on A
pril 5, 2022jpet.aspetjournals.org
Dow
nloaded from

JPET #224766
21
Sensitivity to Dose and Model Qualification. The final pharmacodynamic model
(Figure 3) was developed using several cellular biomarkers after continuous exposure to a single,
relatively high concentration of bortezomib (20 nM). Simulations of protein expression profiles
and cell proliferation following exposure to different bortezomib concentrations (0.1 to 20 nM)
were performed to evaluate the role of bortezomib dose in cellular outcomes (Figure S7). As
bortezomib concentration is increased, the magnitude of pNFκB expression is also increased and
the time to peak response is decreased (Figure S7A). The extent of induced cleaved PARP is also
increased (Figure S7B), along with greater suppression of BclxL expression (Figure S7C) as
bortezomib concentration increases. For cell proliferation, cell growth is suppressed up to 2 nM
(Figure S7D, red line), but greater concentrations result in cell death (Figure S7D). As an
external predictive check, protein expression profiles and cell proliferation after low-dose
bortezomib exposure (2 nM) were measured and compared with model simulations, which were
obtained using the final model (Figure 3) and parameter estimates (Table 1) from the high-dose
bortezomib (20 nM) experiments. The low concentration of bortezomib (2 nM) was chosen as it
is close to its IC50 value (1.5 nM) from the in vitro exposure-response relationship at 48h. Thus,
the selected concentration is relatively low but should still elicit a pharmacological response.
Model predicted pNFκB, cleaved PARP, and BclxL profiles and cell proliferation dynamics are
in good agreement with the experimental data (Figure S8).
The final model was also used to predict the IC50 for bortezomib after 48 hours of
continuous exposure. Although the model was developed based on temporal profiles after a
single concentration of bortezomib, the model predicted IC50 was comparable to that obtained
from the in vitro concentration-effect experiments (3.5 vs. 1.5 nM; Figure 6).
This article has not been copyedited and formatted. The final version may differ from this version.JPET Fast Forward. Published on July 10, 2015 as DOI: 10.1124/jpet.115.224766
at ASPE
T Journals on A
pril 5, 2022jpet.aspetjournals.org
Dow
nloaded from

JPET #224766
22
Discussion
Network-based approaches are increasingly used in drug discovery and development
(Csermely et al., 2013; Harrold et al., 2013). Pharmacological networks are now commonly
utilized for target identification (Sahin et al., 2009), evaluating signaling networks between
normal and diseased conditions (Saez-Rodriguez et al., 2011), and understanding interactions
among pathways (Thakar et al., 2007; Ge and Qian, 2009; Mai and Liu, 2009). For example, a
Boolean network was used to identify novel targets to overcome trastuzumab resistance in breast
cancer cell lines (Sahin et al., 2009), in which c-MYC was identified as a potential therapeutic
target. In another example, Boolean network modeling was used to analyze immune responses
due to the presence of virulence factors in lower respiratory tract infection (Thakar et al., 2007).
Three distinct phases of Bordetellae infection were identified, which was not possible using
traditional experimental methods (i.e., biochemical and molecular biology techniques). A similar
approach is used in the present analysis, in which a Boolean network model is applied for
evaluating bortezomib signal transduction pathways in U266 cells.
Our initial Boolean network model was developed based on the literature; however,
available studies focus on either NFκB (Bharti et al., 2003b) or JAK/STAT3 (Bharti et al.,
2003a; Park et al., 2011) pathways independently, and joint effects of these pathways have not
been previously evaluated in U266 cells (e.g., apoptosis and cell proliferation). In addition,
cellular protein dynamics and outcomes following exposure to specific probe compounds were
also unavailable. Therefore, in vitro experiments and computational modeling were combined
with pathway specific inhibitors to evaluate the roles of both pathways individually and
simultaneously. The Boolean network model confirmed that stress accumulation due to
This article has not been copyedited and formatted. The final version may differ from this version.JPET Fast Forward. Published on July 10, 2015 as DOI: 10.1124/jpet.115.224766
at ASPE
T Journals on A
pril 5, 2022jpet.aspetjournals.org
Dow
nloaded from

JPET #224766
23
proteasome inhibition is a major pathway of myeloma cell death despite the activation of pNFκB
protein expression, which contradicts a major proposed hypothesis of bortezomib effects.
Whereas logic-based models provide qualitative insight into network connectivity and
drug induced signal transduction, a quantitative dynamical model that includes important cellular
biomarkers allow for the integration of critical factors responsible for cell death upon
chemotherapy exposure (Yamazaki et al., 2011; Kay et al., 2012; Zhang et al., 2013). It is not
yet practical to quantify all components in cellular signaling pathways; therefore, it is necessary
to identify critical proteins for dynamical model development. A Boolean network reduction
algorithm (Veliz-Cuba, 2011) identified critical factors regulating bortezomib cell death that
guided development of a reduced PD model. Among the biomarkers (Figure S6), 2 anti-apoptotic
proteins and one pro-apoptotic protein (pNFκB, BclxL, and cleaved PARP) were integrated into
a reduced pharmacodynamic model (Figure 3). pNFκB was integrated in the model as
bortezomib increases its expression, contradictory to proposed mechanisms. BclxL was selected
as a major anti-apoptotic protein that inhibits apoptosis, and cleaved PARP is a primary pro-
apoptotic marker. The factor p21 was not incorporated in the current model as Boolean
simulations suggest that bortezomib effects on apoptosis precede cell growth arrest.
The final cellular PD model (Fig. 3) was successfully qualified using the external data set
following a low concentration of bortezomib (2 nM). Despite the fact that the cellular model was
developed based on a single bortezomib concentration (20 nM) and linear coefficients, the final
model reasonably predicted responses to the lower bortezomib exposure (Figure S8) and the
dose-response curve for bortezomib at 48h (Figure 6). Although there is a slight mis-fit for
BclxL and cleaved PARP profiles (Figure S8B and S8C), overall simulated profiles reasonably
agree with experimental data. Most commonly, exposure-response relationships of protein
This article has not been copyedited and formatted. The final version may differ from this version.JPET Fast Forward. Published on July 10, 2015 as DOI: 10.1124/jpet.115.224766
at ASPE
T Journals on A
pril 5, 2022jpet.aspetjournals.org
Dow
nloaded from

JPET #224766
24
expression data are sigmoidal in nature (Bharti et al., 2003a; Bharti et al., 2003b; Park et al.,
2008; Park et al., 2011). For example, the inhibition of pNFκB activity by curcumin is 10% at 1
μM and 40% at 10 μM (Bharti et al., 2003b). Similarly, cleaved PARP activation is about 1% at
10 μM of curcumin but 100% at 50 μM of curcumin (Park et al., 2008). It is therefore interesting
that although our model was developed using a single drug concentration and simple linear
coefficients (e.g., Sm_M1B and Sm_PARP in Eqs. 1 and 4), it reasonably predicts profiles to a lower
bortezomib concentration (Figure S8) and a sigmoidal concentration-effect relationship (Figure
6). Furthermore, the predicted exposure-response relationship for BclxL can be overlaid with
observed cell proliferation at 48 h (Figure S9). This suggests that BclxL could serve as a
potential biomarker to predict efficacy in MM and warrants further study. However, a potential
limitation is that the proteins measured in this study reflect relative fold-change and not absolute
values of protein concentrations. Grounding on relative changes in protein expression maintains
a degree of modularity, but more advanced proteomic methods are needed to quantitatively
measure low-abundance signaling proteins. Cell growth and death parameters were also
compared to available values from the literature. Natural cell growth and death were modeled
using first-order growth rate constants (kg and kd). The estimated net growth rate constant (kg –
kd) in the final model (0.00490 h-1) is comparable to net growth rate constants from U266
xenografts at 0.00487 h-1 (Siveen et al., 2014) and 0.00450 h-1 (Rhee et al., 2012) that were
obtained from fitting an exponential model to digitized control curves (data not shown).
Preliminary experiments were conducted to measure pNFκB in the nucleus and
cytoplasm of U266 cells after bortezomib exposure. Both cellular fractions showed a similar
trend of increased relative pNFκB expression (data not shown), and so total cellular pNFκB was
measured by western blot analysis of cell lysates, revealing transient increased expression
This article has not been copyedited and formatted. The final version may differ from this version.JPET Fast Forward. Published on July 10, 2015 as DOI: 10.1124/jpet.115.224766
at ASPE
T Journals on A
pril 5, 2022jpet.aspetjournals.org
Dow
nloaded from

JPET #224766
25
(Figure 5A). Despite the stimulation of pNFκB protein expression, apoptosis is induced and the
model is able to well capture this phenomenon. The NFκB pathway is one of the major cell
survival pathways and is deregulated in many types of cancer (Karin, 2009). Bortezomib
stimulates the upstream cascade of the NFκB pathway (Hideshima et al., 2009) leading to
activation of pNFκB protein expression. Apoptosis is still induced through cellular stress
resulting from the inhibition of proteasome (Figure 4D) (Hideshima et al., 2001). The cellular
model was able to well describe both mechanisms. Aberrant expression of pNFκB is responsible
for the lack of efficacy and resistance in some cases of MM (Hideshima et al., 2002; Bharti et al.,
2004). Greater expression of pNFκB results in greater expression of anti-apoptotic proteins (e.g.
BclxL) (Karin, 2002), with crosstalk between survival and apoptotic pathways determining
cellular fate. Hence, greater drug concentrations are required to activate the apoptotic pathway.
Initially, BclxL inhibition of cleaved PARP activation and cleaved PARP stimulation on removal
of BclxL was incorporated. However, since BclxL exerts a negative feedback on cell death, as
incorporated in the model, the BclxL effect on cleaved PARP was removed to simplify the model
and reduce model redundancy.
In summary, systems pharmacology is an emerging field that seeks to couple systems
biology and PD modeling, which could promote the discovery, development, and effective use of
drugs based upon first principles. Computational tools based on graph theory (Liu et al., 2013),
discrete dynamic relationships (Albert and Wang, 2009), and others, can be used to identify
critical system components within networks at multiple organizational levels, thus
providing guidance for multi-scale model construction and evaluation. We have used an
integrated approach to investigate bortezomib signal transduction and exposure-response
relationships in MM cells. A cell-based model of bortezomib in U266 human myeloma cells was
This article has not been copyedited and formatted. The final version may differ from this version.JPET Fast Forward. Published on July 10, 2015 as DOI: 10.1124/jpet.115.224766
at ASPE
T Journals on A
pril 5, 2022jpet.aspetjournals.org
Dow
nloaded from

JPET #224766
26
developed that incorporates one of the major survival pathway proteins pNFκB, anti-apoptotic
protein BclxL, and an apoptotic marker (cleaved PARP) to link bortezomib exposure to cell
proliferation. The final model-predicted in vitro IC50 for bortezomib reasonably agrees with the
experimental IC50 at 48h. Although the Boolean and dynamical models are relatively simple and
specific to U266 cells and bortezomib, the overall strategic approach can be easily extended with
slight modification to other myeloma cell lines (e.g., MM.1S and RPMI 8226) or bortezomib-
based combination regimens (e.g., HDAC inhibitors). This model may serve as a basis for
studying bortezomib combinations with anti-myeloma agents and to optimize xenograft
combination studies, which is a focus of current research and will be reported separately. In
addition, the model structure can be easily extended to describe responses in other cancer types
that share similar pathways.
This article has not been copyedited and formatted. The final version may differ from this version.JPET Fast Forward. Published on July 10, 2015 as DOI: 10.1124/jpet.115.224766
at ASPE
T Journals on A
pril 5, 2022jpet.aspetjournals.org
Dow
nloaded from

JPET #224766
27
Acknowledgements
The authors would like to thank Dr. John M. Harrold (University at Buffalo, SUNY) for
developing MATLAB code for this project.
This article has not been copyedited and formatted. The final version may differ from this version.JPET Fast Forward. Published on July 10, 2015 as DOI: 10.1124/jpet.115.224766
at ASPE
T Journals on A
pril 5, 2022jpet.aspetjournals.org
Dow
nloaded from

JPET #224766
28
Authorship Contributions
Design and execution of experiments: VLC
Mathematical model development and data analysis: VLC and DEM
Network analysis: VLC and MO
Wrote or contributed to the writing: VLC, MO, DRA, and DEM
This article has not been copyedited and formatted. The final version may differ from this version.JPET Fast Forward. Published on July 10, 2015 as DOI: 10.1124/jpet.115.224766
at ASPE
T Journals on A
pril 5, 2022jpet.aspetjournals.org
Dow
nloaded from

JPET #224766
29
References Albert R and Wang RS (2009) Discrete dynamic modeling of cellular signaling networks.
Methods Enzymol 467:281-306.
Berger SI and Iyengar R (2011) Role of systems pharmacology in understanding drug
adverse events. Wiley interdisciplinary reviews Systems biology and medicine 3:129-
135.
Bharti AC, Donato N and Aggarwal BB (2003a) Curcumin (diferuloylmethane) inhibits
constitutive and IL-6-inducible STAT3 phosphorylation in human multiple myeloma
cells. J Immunol 171:3863-3871.
Bharti AC, Donato N, Singh S and Aggarwal BB (2003b) Curcumin (diferuloylmethane)
down-regulates the constitutive activation of nuclear factor-kappa B and
IkappaBalpha kinase in human multiple myeloma cells, leading to suppression of
proliferation and induction of apoptosis. Blood 101:1053-1062.
Bharti AC, Shishodia S, Reuben JM, Weber D, Alexanian R, Raj-Vadhan S, Estrov Z, Talpaz M,
and Aggarwal BB (2004) Nuclear factor-kappaB and STAT3 are constitutively active
in CD138+ cells derived from multiple myeloma patients, and suppression of these
transcription factors leads to apoptosis. Blood 103:3175-84.
Birtwistle MR, Mager DE and Gallo JM (2013) Mechanistic vs. Empirical network models of
drug action. CPT: pharmacometrics & systems pharmacology 2:e72.
Blade J, Cibeira MT, Fernandez de Larrea C and Rosinol L (2010) Multiple myeloma. Ann
Oncol 21 Suppl 7:vii313-vii319.
This article has not been copyedited and formatted. The final version may differ from this version.JPET Fast Forward. Published on July 10, 2015 as DOI: 10.1124/jpet.115.224766
at ASPE
T Journals on A
pril 5, 2022jpet.aspetjournals.org
Dow
nloaded from
JPET #224766
30
Caers J, Vande broek I, De Raeve H, Michaux L, Trullemans F, Schots R, Van Camp B and
Vanderkerken K (2008) Multiple myeloma--an update on diagnosis and treatment.
Eur J Haematol 81:329-343.
Csermely P, Korcsmaros T, Kiss HJ, London G and Nussinov R (2013) Structure and
dynamics of molecular networks: a novel paradigm of drug discovery: a
comprehensive review. Pharmacol Ther 138:333-408.
Ge H and Qian M (2009) Boolean network approach to negative feedback loops of the p53
pathways: synchronized dynamics and stochastic limit cycles. J Comput Biol 16:119-
132.
Harrold JM and Abraham AK (2014) Ubiquity: a framework for physiological/mechanism-
based pharmacokinetic/pharmacodynamic model development and deployment.
Journal of pharmacokinetics and pharmacodynamics 41:141-151.
Harrold JM, Ramanathan M and Mager DE (2013) Network-based approaches in drug
discovery and early development. Clinical pharmacology and therapeutics 94:651-
658.
Harrold JM, Straubinger RM and Mager DE (2012) Combinatorial chemotherapeutic
efficacy in non-Hodgkin lymphoma can be predicted by a signaling model of CD20
pharmacodynamics. Cancer Res 72:1632-1641.
Hideshima T, Chauhan D, Hayashi T, Akiyama M, Mitsiades N, Mitsiades C, Podar K, Munshi
NC, Richardson PG and Anderson KC (2003a) Proteasome inhibitor PS-341
abrogates IL-6 triggered signaling cascades via caspase-dependent downregulation
of gp130 in multiple myeloma. Oncogene 22:8386-8393.
This article has not been copyedited and formatted. The final version may differ from this version.JPET Fast Forward. Published on July 10, 2015 as DOI: 10.1124/jpet.115.224766
at ASPE
T Journals on A
pril 5, 2022jpet.aspetjournals.org
Dow
nloaded from

JPET #224766
31
Hideshima T, Chauhan D, Richardson P, Mitsiades C, Mitsiades N, Hayashi T, Munshi N,
Dang L, Castro A, Palombella V, Adams J and Anderson KC (2002) NF-kappa B as a
therapeutic target in multiple myeloma. J Biol Chem 277:16639-16647.
Hideshima T, Ikeda H, Chauhan D, Okawa Y, Raje N, Podar K, Mitsiades C, Munshi NC,
Richardson PG, Carrasco RD and Anderson KC (2009) Bortezomib induces canonical
nuclear factor-kappaB activation in multiple myeloma cells. Blood 114:1046-1052.
Hideshima T, Mitsiades C, Akiyama M, Hayashi T, Chauhan D, Richardson P, Schlossman R,
Podar K, Munshi NC, Mitsiades N and Anderson KC (2003b) Molecular mechanisms
mediating antimyeloma activity of proteasome inhibitor PS-341. Blood 101:1530-
1534.
Hideshima T, Richardson P, Chauhan D, Palombella VJ, Elliott PJ, Adams J and Anderson KC
(2001) The proteasome inhibitor PS-341 inhibits growth, induces apoptosis, and
overcomes drug resistance in human multiple myeloma cells. Cancer Res 61:3071-
3076.
Huang SM, Abernethy DR, Wang Y, Zhao P and Zineh I (2013) The utility of modeling and
simulation in drug development and regulatory review. Journal of pharmaceutical
sciences 102:2912-2923.
Iyengar R, Zhao S, Chung SW, Mager DE and Gallo JM (2012) Merging systems biology with
pharmacodynamics. Science translational medicine 4:126ps127.
Jusko WJ (2013) Moving from basic toward systems pharmacodynamic models. Journal of
pharmaceutical sciences 102:2930-2940.
Karin M (2009) NF-kappaB as a critical link between inflammation and cancer. Cold Spring
Harb Perspect Biol 1:a000141.
This article has not been copyedited and formatted. The final version may differ from this version.JPET Fast Forward. Published on July 10, 2015 as DOI: 10.1124/jpet.115.224766
at ASPE
T Journals on A
pril 5, 2022jpet.aspetjournals.org
Dow
nloaded from
JPET #224766
32
Karin M and Lin A (2002) NF-kappaB at the crossroads of life and death. Nat Immunol.
3:221-7.
Kay BP, Hsu CP, Lu JF, Sun YN, Bai S, Xin Y and D'Argenio DZ (2012) Intracellular-signaling
tumor-regression modeling of the pro-apoptotic receptor agonists dulanermin and
conatumumab. Journal of pharmacokinetics and pharmacodynamics 39:577-590.
Kirouac DC, Du JY, Lahdenranta J, Overland R, Yarar D, Paragas V, Pace E, McDonagh CF,
Nielsen UB and Onsum MD (2013) Computational Modeling of ERBB2-Amplified
Breast Cancer Identifies Combined ErbB2/3 Blockade as Superior to the
Combination of MEK and AKT Inhibitors. Science signaling 6:ra68.
Lee H, Herrmann A, Deng JH, Kujawski M, Niu G, Li Z, Forman S, Jove R, Pardoll DM and Yu
H (2009) Persistently activated Stat3 maintains constitutive NF-kappaB activity in
tumors. Cancer Cell 15:283-293.
Liu YY, Slotine JJ and Barabasi AL (2013) Observability of complex systems. Proc Natl Acad
Sci U S A 110:2460-2465.
Mager DE and Jusko WJ (2001) Pharmacodynamic modeling of time-dependent
transduction systems. Clinical pharmacology and therapeutics 70:210-216.
Mager DE, Wyska E and Jusko WJ (2003) Diversity of mechanism-based pharmacodynamic
models. Drug metabolism and disposition: the biological fate of chemicals 31:510-
518.
Mai Z and Liu H (2009) Boolean network-based analysis of the apoptosis network:
irreversible apoptosis and stable surviving. Journal of theoretical biology 259:760-
769.
This article has not been copyedited and formatted. The final version may differ from this version.JPET Fast Forward. Published on July 10, 2015 as DOI: 10.1124/jpet.115.224766
at ASPE
T Journals on A
pril 5, 2022jpet.aspetjournals.org
Dow
nloaded from

JPET #224766
33
Milligan PA, Brown MJ, Marchant B, Martin SW, van der Graaf PH, Benson N, Nucci G,
Nichols DJ, Boyd RA, Mandema JW, Krishnaswami S, Zwillich S, Gruben D, Anziano
RJ, Stock TC and Lalonde RL (2013) Model-based drug development: a rational
approach to efficiently accelerate drug development. Clinical pharmacology and
therapeutics 93:502-514.
Oancea M, Mani A, Hussein MA and Almasan A (2004) Apoptosis of multiple myeloma. Int J
Hematol 80:224-231.
Park J, Ayyappan V, Bae EK, Lee C, Kim BS, Kim BK, Lee YY, Ahn KS and Yoon SS (2008)
Curcumin in combination with bortezomib synergistically induced apoptosis in
human multiple myeloma U266 cells. Mol Oncol 2:317-326.
Park S, Lee HJ, Jeong SJ, Song HS, Kim M, Lee EO, Kim DH, Ahn KS and Kim SH (2011)
Inhibition of JAK1/STAT3 signaling mediates compound K-induced apoptosis in
human multiple myeloma U266 cells. Food Chem Toxicol 49:1367-1372.
Pillai GC, Mentre F and Steimer JL (2005) Non-linear mixed effects modeling - from
methodology and software development to driving implementation in drug
development science. Journal of pharmacokinetics and pharmacodynamics 32:161-
183.
Rhee YH, Jeong SJ, Lee HJ, Lee HJ, Koh W, Jung JH, Kim SH and Sung-Hoon K (2012)
Inhibition of STAT3 signaling and induction of SHP1 mediate antiangiogenic and
antitumor activities of ergosterol peroxide in U266 multiple myeloma cells. BMC
cancer 12:28.
Richardson PG, Barlogie B, Berenson J, Singhal S, Jagannath S, Irwin D, Rajkumar SV,
Srkalovic G, Alsina M, Alexanian R, Siegel D, Orlowski RZ, Kuter D, Limentani SA, Lee
This article has not been copyedited and formatted. The final version may differ from this version.JPET Fast Forward. Published on July 10, 2015 as DOI: 10.1124/jpet.115.224766
at ASPE
T Journals on A
pril 5, 2022jpet.aspetjournals.org
Dow
nloaded from

JPET #224766
34
S, Hideshima T, Esseltine DL, Kauffman M, Adams J, Schenkein DP and Anderson KC
(2003) A phase 2 study of bortezomib in relapsed, refractory myeloma. N Engl J Med
348:2609-2617.
Richardson PG, Sonneveld P, Schuster MW, Irwin D, Stadtmauer EA, Facon T, Harousseau
JL, Ben-Yehuda D, Lonial S, Goldschmidt H, Reece D, San-Miguel JF, Blade J,
Boccadoro M, Cavenagh J, Dalton WS, Boral AL, Esseltine DL, Porter JB, Schenkein D
and Anderson KC (2005) Bortezomib or high-dose dexamethasone for relapsed
multiple myeloma. N Engl J Med 352:2487-2498.
Saez-Rodriguez J, Alexopoulos LG, Zhang M, Morris MK, Lauffenburger DA and Sorger PK
(2011) Comparing signaling networks between normal and transformed
hepatocytes using discrete logical models. Cancer Res 71:5400-5411.
Sahin O, Frohlich H, Lobke C, Korf U, Burmester S, Majety M, Mattern J, Schupp I, Chaouiya
C, Thieffry D, Poustka A, Wiemann S, Beissbarth T and Arlt D (2009) Modeling ERBB
receptor-regulated G1/S transition to find novel targets for de novo trastuzumab
resistance. BMC Syst Biol 3:1.
San Miguel JF, Schlag R, Khuageva NK, Dimopoulos MA, Shpilberg O, Kropff M, Spicka I,
Petrucci MT, Palumbo A, Samoilova OS, Dmoszynska A, Abdulkadyrov KM, Schots R,
Jiang B, Mateos MV, Anderson KC, Esseltine DL, Liu K, Cakana A, van de Velde H and
Richardson PG (2008) Bortezomib plus melphalan and prednisone for initial
treatment of multiple myeloma. N Engl J Med 359:906-917.
Sharma A, Ebling WF and Jusko WJ (1998) Precursor-dependent indirect
pharmacodynamic response model for tolerance and rebound phenomena. Journal
of pharmaceutical sciences 87:1577-1584.
This article has not been copyedited and formatted. The final version may differ from this version.JPET Fast Forward. Published on July 10, 2015 as DOI: 10.1124/jpet.115.224766
at ASPE
T Journals on A
pril 5, 2022jpet.aspetjournals.org
Dow
nloaded from

JPET #224766
35
Siveen KS, Mustafa N, Li F, Kannaiyan R, Ahn KS, Kumar AP, Chng WJ and Sethi G (2014)
Thymoquinone overcomes chemoresistance and enhances the anticancer effects of
bortezomib through abrogation of NF-kappaB regulated gene products in multiple
myeloma xenograft mouse model. Oncotarget.
Sorger P, Allerheiligen S, Abernethy D, Altman R, Brouwer K, Califano A, D’Argenio D,
Iyenger R, Jusko W, Lalonde R, Lauffenburger D, Shoichet B, Stevens J, Subramaniam
S, Van der Graaf P and Vicini P (2011) Quantitative and systems pharmacology in
the postgenomic era: New approaches to discovering and understanding
therapeutic drugs and mechanisms. An NIH White Paper from the QSP Workshop
Group, in,
http://www.nigms.nih.gov/Training/Documents/SystemsPharmaWPSorger2011.p
df.
Squarize CH, Castilho RM, Sriuranpong V, Pinto DS, Jr. and Gutkind JS (2006) Molecular
cross-talk between the NFkappaB and STAT3 signaling pathways in head and neck
squamous cell carcinoma. Neoplasia 8:733-746.
Thakar J, Pilione M, Kirimanjeswara G, Harvill ET and Albert R (2007) Modeling systems-
level regulation of host immune responses. PLoS Comput Biol 3:e109.
Veliz-Cuba A (2011) Reduction of Boolean network models. Journal of theoretical biology
289:167-172.
Wittmann DM, Krumsiek J, Saez-Rodriguez J, Lauffenburger DA, Klamt S and Theis FJ
(2009) Transforming Boolean models to continuous models: methodology and
application to T-cell receptor signaling. BMC Syst Biol 3:98.
This article has not been copyedited and formatted. The final version may differ from this version.JPET Fast Forward. Published on July 10, 2015 as DOI: 10.1124/jpet.115.224766
at ASPE
T Journals on A
pril 5, 2022jpet.aspetjournals.org
Dow
nloaded from

JPET #224766
36
Yamazaki S, Nguyen L, Vekich S, Shen Z, Yin MJ, Mehta PP, Kung PP and Vicini P (2011)
Pharmacokinetic-pharmacodynamic modeling of biomarker response and tumor
growth inhibition to an orally available heat shock protein 90 inhibitor in a human
tumor xenograft mouse model. J Pharmacol Exp Ther 338:964-973.
Zhang T, Li Y, Zou P, Yu JY, McEachern D, Wang S and Sun D (2013) Physiologically based
pharmacokinetic and pharmacodynamic modeling of an antagonist (SM-406/AT-
406) of multiple inhibitor of apoptosis proteins (IAPs) in a mouse xenograft model
of human breast cancer. Biopharm Drug Dispos 34:348-359.
Zhao S and Iyengar R (2012) Systems pharmacology: network analysis to identify
multiscale mechanisms of drug action. Annual review of pharmacology and
toxicology 52:505-521.
This article has not been copyedited and formatted. The final version may differ from this version.JPET Fast Forward. Published on July 10, 2015 as DOI: 10.1124/jpet.115.224766
at ASPE
T Journals on A
pril 5, 2022jpet.aspetjournals.org
Dow
nloaded from

JPET #224766
37
Footnotes
This study was supported by the National Institutes of Health National Institute of General
Medical Sciences [Grant 57980] (DEM), the UB-Pfizer strategic alliance (DEM), an unrestricted
training grant from Daiichi Sankyo Pharma Development (DEM), and an AFPE-pre-doctoral
fellowship (VLC).
This article has not been copyedited and formatted. The final version may differ from this version.JPET Fast Forward. Published on July 10, 2015 as DOI: 10.1124/jpet.115.224766
at ASPE
T Journals on A
pril 5, 2022jpet.aspetjournals.org
Dow
nloaded from

JPET #224766
38
Legends for Figures
Figure 1 Signal transduction pathways in multiple myeloma disease pathology.
Figure 2 Boolean network reduction steps. A) Removal of nodes with one input and one output
(see node Y). B) Specific example of removing nodes with one input and one output, in which
nodes RAS and MEK1 are connected after removing RAF. C) General example of identification
and removal of non-functional edges in a network, in which the edge from node C to node A is
identified as a non-functional edge and removed. D) Specific sub-network example of removing
a non-functional edge for p21. E) General example of identification and removal of non-
functional nodes, in which node C is removed after applying the rule in Figure 1A. F) Specific
sub-network example for removing non-functional nodes (e.g., MYC). Block arrows indicate the
final network after applying the specific rule. ‘OR’ relationship is represented by ‘||’, ‘AND’ by
‘&&’, and ‘NOT’ by ‘~’.
Figure 3 Signal transduction model of bortezomib effects in multiple myeloma. Bortezomib
compartment represents bortezomib concentration in vitro with a degradation half-life of 144 h.
M1B is a signaling compartment for stimulating the conversion of the precursor compartment
(pre-NFκB) to pNFκB, which represents relative pNFκB protein expression. cPARPn represents
transit compartment n for cleaved PARP. The Bcl-xL compartment represents relative BclxL
protein expression, and N is cell proliferation in vitro. Yellow highlighted boxes are
compartments for which experimental data are measured. Open and closed rectangles represent
stimulation and inhibition processes.
This article has not been copyedited and formatted. The final version may differ from this version.JPET Fast Forward. Published on July 10, 2015 as DOI: 10.1124/jpet.115.224766
at ASPE
T Journals on A
pril 5, 2022jpet.aspetjournals.org
Dow
nloaded from
JPET #224766
39
Figure 4 Comparison of model simulated and observed U266 cellular outcomes with continuous
bortezomib exposure. A) Cell proliferation over 96 h after bortezomib (20 nM) exposure in U266
cells, B) Time-course of apoptosis as measured by cleaved PARP protein expression under
constant exposure to bortezomib (20 nM) in U266 cells, C) Final Boolean model (Figure S1)
simulations of cell proliferation, and D) Apoptosis under control conditions (red, solid) and after
constant exposure to bortezomib (blue, dash-dot). Symbols are mean observed data and error
bars represent standard deviation.
Figure 5 Time-course of cellular protein dynamics and cell proliferation after continuous
bortezomib exposure (20 nM). Relative protein expression profiles are shown for A) pNFκB, B)
cleaved PARP, and C) BclxL. Protein expression was measured using western blot in whole-cell
lysate. D) Cell proliferation measured using WST-1 assay kit. Measurements following
bortezomib treatment and vehicle control are represented by circles and triangles. Solid lines are
model-fitted profiles.
Figure 6 Comparison of model predicted and observed bortezomib concentration-effect profiles
at 48 h. Circles represent mean observed data (error bars are standard deviation) at 48 h. Lines
represent either a fitted curve to observed data using a Hill-type function (red) or the model
predicted data at 48 h (blue).
This article has not been copyedited and formatted. The final version may differ from this version.JPET Fast Forward. Published on July 10, 2015 as DOI: 10.1124/jpet.115.224766
at ASPE
T Journals on A
pril 5, 2022jpet.aspetjournals.org
Dow
nloaded from

JPET #224766
40
Table 1 Final Bortezomib Parameter Estimates in U266 Cells
Parameter Unit Definition Value %CV
Protein Dynamic Parameters
ktr_NFκB h-1 pNFκB transit rate constant 0.000429# -
kdeg_NFκB h-1 pNFκB degradation rate constant 0.54 52.0
kp_NFκB h-1 pNFκB precursor transfer rate
constant 0.034 5.76
Sm_NFκB nM-1 pNFκB stimulatory coefficient 24.8# -
ktr_parp h-1 cPARP transit rate constant 0.149 4.11
Sm_parp nM-1 cPARP stimulatory coefficient 6.72 11.4
Υbcl - BclxL power coefficient 0.949 14.6
kdeg_bcl h-1 BclxL degradation rate constant 7.72E-03 58.4
εNFκB - pNFκB proportional error
coefficient 0.097 11.4
εbcl - BclxL proportional error coefficient 0.163 11.1
εparp - cPARP proportional error
coefficient 0.229 11.7
In vitro Cell Dynamic Parameters
kg h-1 Cell growth rate constant 0.021 3.74
kd h-1 Cell death rate constant 2.56E-03 9.81
C0cell Initial cell density 1
σcell - Cell additive error coefficient 0.031 32.9
εcell - Cell proportional error coefficient 0.157 21.7 #Fixed value
This article has not been copyedited and formatted. The final version may differ from this version.JPET Fast Forward. Published on July 10, 2015 as DOI: 10.1124/jpet.115.224766
at ASPE
T Journals on A
pril 5, 2022jpet.aspetjournals.org
Dow
nloaded from

This article has not been copyedited and form
atted. The final version m
ay differ from this version.
JPET
Fast Forward. Published on July 10, 2015 as D
OI: 10.1124/jpet.115.224766
at ASPET Journals on April 5, 2022 jpet.aspetjournals.org Downloaded from

This article has not been copyedited and form
atted. The final version m
ay differ from this version.
JPET
Fast Forward. Published on July 10, 2015 as D
OI: 10.1124/jpet.115.224766
at ASPET Journals on April 5, 2022 jpet.aspetjournals.org Downloaded from

This article has not been copyedited and form
atted. The final version m
ay differ from this version.
JPET
Fast Forward. Published on July 10, 2015 as D
OI: 10.1124/jpet.115.224766
at ASPET Journals on April 5, 2022 jpet.aspetjournals.org Downloaded from

This article has not been copyedited and form
atted. The final version m
ay differ from this version.
JPET
Fast Forward. Published on July 10, 2015 as D
OI: 10.1124/jpet.115.224766
at ASPET Journals on April 5, 2022 jpet.aspetjournals.org Downloaded from

This article has not been copyedited and formatted. The final version may differ from this version.JPET Fast Forward. Published on July 10, 2015 as DOI: 10.1124/jpet.115.224766
at ASPE
T Journals on A
pril 5, 2022jpet.aspetjournals.org
Dow
nloaded from

This article has not been copyedited and form
atted. The final version m
ay differ from this version.
JPET
Fast Forward. Published on July 10, 2015 as D
OI: 10.1124/jpet.115.224766
at ASPET Journals on April 5, 2022 jpet.aspetjournals.org Downloaded from

1
Logic-based and Cellular Pharmacodynamic Modeling of Bortezomib Responses in U266
Human Myeloma Cells
Supplementary Material
Vaishali L. Chudasama, Meric A. Ovacik, Darrell R. Abernethy, and Donald E. Mager*
Department of Pharmaceutical Sciences, University at Buffalo, SUNY, Buffalo, NY (V.L.C.,
M.O., D.E.M.); and Office of Clinical Pharmacology, Food and Drug Administration, Silver
Springs, MD (D.R.A.)
Journal of Pharmacology and Experimental Therapeutics

2
Table S1 Western blot experimental design
Protein Measured
Treatment pIκB pNFκB pStat3 BclxL Cleaved PARP
DMSO (control) X X X X X IKKi (10 µM) X X X X X JAKi (10 µM) -‐ X X X X IKBi (10 µM) X X -‐ -‐ -‐
IKKi (10 µM) + JAKi (10 µM) X X X X X JAKi (10 µM) + IKBi (10 µM) X X -‐ -‐ -‐
Bortezomib (20 nM) X X X X X Bortezomib (2 nM) -‐ X -‐ X X
Bortezomib (20 nM transient exposure 1 or 2 hours) X X -‐ X X

3
Table S2 Boolean relationships for the final network model
Number Node Full name Boolean relation Initial value Reference
1 IL6 Interleukin 6 pNFκB 1 (Hideshima et al., 2003a; Oancea et al., 2004)
2 gp130 glycoprotein 130 ~Cas3 1 (Hideshima et al., 2003b)
3 TNFαR Tumor necrosis factor receptor alpha <> 1 (Mai and Liu, 2009)
4 TNFα Tumor necrosis factor alpha <> 1 (Mai and Liu, 2009)
5 RIP receptor interacting protein (TNFα && TNFαR) || Bort 1 (Hideshima et al., 2009; Oeckinghaus and Ghosh, 2009)
6 NIK NFκB-inducing kinase ~TRAF3 1 (Oeckinghaus and Ghosh, 2009)
7 JAK1 Janus associated kinase 1 (IL6 && gp130) && (~SHP1) 1 (Piazza et al., 2007; Kim et al., 2011)
8 JAK2 Janus associated kinase 2 (IL6 && gp130) && (~SHP1) 1 (Piazza et al., 2007; Kim et al., 2011)
9 IKK Inhibitor of kappa B kinase ((RIP && NIK) || AKT ) 1 (Piazza et al., 2007; Oeckinghaus and Ghosh, 2009)
10 pIκB Phospho-inhibitor of NFκB IKK 1 (Piazza et al., 2007; Oeckinghaus and Ghosh, 2009)
11 pNFκB Phospho-nuclear factor kappa B
(pIκB && Prot) || pIκB || pSTAT3 || X 1 (Lee et al., 2009; Oeckinghaus and
Ghosh, 2009)
12 FLIP FLICE-like inhibitory protein pNFκB 1 (Schlatter et al., 2009)
13 Prot Proteasome ~Bort 1 (Richardson et al., 2003)
14 XIAP x-linked inhibitor of apoptosis
(pNFκB || pSTAT3) && ~(Smac || p53) 1 (Oancea et al., 2004)
15 Bclxl B-cell linked protein extra large
(pNFκB || pSTAT3) && ~(BAX || BAD || p53) 1 (Oancea et al., 2004)
16 BCL2 B-cell leukemia/lymphoma 2
(pNFκB || pSTAT3) && ~(BAD || p53) 1 (Oancea et al., 2004)
17 CYCD Cyclin D MYC || AKT || ERK 1 (Al Zaid Siddiquee and Turkson,

4
2008; Sahin et al., 2009) 18 CYCE Cyclin E MYC 1 (Sahin et al., 2009)
19 MDM the murine double minute 2 (MDM2) (p53 || AKT) && ~ ATM 1 (Bommert et al., 2006)
20 MYC myelocytomatosis viral oncogene homolog pSTAT3 || ERK || MEKK 1 (Sahin et al., 2009)
21 STAT3 signal transducer and activator of transcription 3 ~ Cas3 1 (Zhang et al., 2008)
22 pSTAT3 phosphor-signal transducer
and activator of transcription 3
(JAK1 && JAK2 && STAT3) || (JAK1 && JAK2 && STAT3
&& ~IKK) && ~JNK 1 (Lim and Cao, 1999; Oancea et al.,
2004; Saez-Rodriguez et al., 2011)
23 AKT protein kinase B PIP3 1 (Piazza et al., 2007; Mai and Liu, 2009)
24 PI3K phosphoinositide-3-kinase (IL6 && gp130) 1 (Oancea et al., 2004; Piazza et al., 2007)
25 PIP3 Phosphatidylinositol (3,4,5)-triphosphate PIP3 && ~PTEN 1 (Mai and Liu, 2009)
26 pRB retinoblastoma 1 (CDK4 && CDK6) || (CDK4 && CDK2 && CDK6) 1 (Sahin et al., 2009)
27 CIAP inhibitor of apoptosis protein TNFαR 1 (Gilmore, 2007)
28 RAS small G-protein (IL6 && gp130) || SHP1 1 (Oancea et al., 2004) 29 RAF proto-oncogene c-RAF RAS 1 (Oancea et al., 2004)
30 MEK1 mitogen-activated protein kinase kinase 1 RAF 1 (Oancea et al., 2004)
31 MEKK MEK kinase MEK1 1 (Oancea et al., 2004)
32 MAPK mitogen-activated protein kinase MEK1 1 (Oancea et al., 2004)
33 ERK extracellular regulated MAP kinase MAPK 1 (Oancea et al., 2004)
34 CDK2 Cyclin dependent kinase 2 CYCE && ~p21 1 (Sahin et al., 2009) 35 CDK4 Cyclin dependent kinase 4 CYCD && ~(p21 || p27) 1 (Sahin et al., 2009) 36 CDK6 Cyclin dependent kinase 6 CYCD 1 (Sahin et al., 2009)

5
37 GROWTH - pRB 1 (Sahin et al., 2009)
38 Fas TNF receptor superfamily member 6 FasL || p53 0 (Mai and Liu, 2009)
39 FasL Fas ligand Fas || cJun 0 (Mai and Liu, 2009)
40 BAD BCL2-associated agonist of cell death ~AKT 0 (Mai and Liu, 2009)
41 TRAF3 TNF receptor-associated factor 3 ~CIAP 0 (Gilmore, 2007)
42 PTEN phosphatase and tensin homolog p53 0 (Mai and Liu, 2009)
43 SHP1 protein tyrosine phosphatase <> 0 (Kim et al., 2011)
44 p27 cyclin-dependent kinase inhibitor 1B
p53 && ~ (MYC || CDK4 || AKT) 0 (Sahin et al., 2009)
45 p21 cyclin-dependent kinase inhibitor 1A
p53 && ~ (MDM || AKT || MYC || CDK4) 0 (Sahin et al., 2009)
46 RAC Ras related protein STRESS 0 (Mai and Liu, 2009) 47 MEKK2 MEK kinase 2 RAC 0 (Mai and Liu, 2009) 48 MKK4 MAP kinase kinase 4 MEKK2 0 (Mai and Liu, 2009) 49 JNK c-Jun N-terminal kinase MKK4 && (~Prot) 0 (Mai and Liu, 2009) 50 DNAdam DNA damage Cas3 || STRESS 0 (Mai and Liu, 2009)
51 ATM ataxia telangiectasia mutated DNAdam || Cas3 0 (Mai and Liu, 2009)
52 DNAPK DNA-dependent protein kinase catalytic subunit ATM 0 (Hideshima et al., 2003c)
53 p53 p53 tumor suppressor (DNAPK || JNK) && ~(MDM && Prot) 0 (Oancea et al., 2004; Mai and Liu,
2009; Sahin et al., 2009) 54 cJun c-jun transcription factor JNK 0 (Mai and Liu, 2009)
55 BAX Bcl2-associated X protein (p53 || BID ) && ~(Bclxl || BCL2) 0 (Oancea et al., 2004)
56 BID BH3 interacting domain death agonist
(Cas8 || STRESS || Fas) && ~(BCL2 || Bclxl) 0 (Oancea et al., 2004)
57 Cas8 Caspase 8 (FasL && Fas) && ~ FLIP 0 (Oancea et al., 2004; Mai and Liu,

6
2009) 58 MITO mitochondria BAX 0 (Oancea et al., 2004)
59 Smac second mitochondria-derived activator of
caspases MITO 0 (Oancea et al., 2004)
60 Cytc Cytochrome c MITO 0 (Oancea et al., 2004) 61 Cas9 Caspase 9 Cytc && ~ (AKT || XIAP) 0 (Oancea et al., 2004) 62 Cas3 Caspase 3 (Cas8 || Cas9) && ~ XIAP 0 (Oancea et al., 2004)
63 Cl_PARP cleaved poly (ADP-ribose) polymerase Cas3 0 (Oancea et al., 2004)
64 STRESS - DNAdam || ~Prot 0 (Oancea et al., 2004) 65 Apo Apoptosis Cl_PARP 0 (Oancea et al., 2004) 66 X Dummy factor <> 1 - 67 Bort Bortezomib <> 1 -

7
Supplemental equations
OESs corresponding to simplified network. Subscript to the parameter value refers to the state it is modulating and the node
modulating the state. For example, parameter nD,B denotes parameter n belongs to node D and it is modulated by node B.
!"!"= 0 Eq. (S1)
!"!"= !
!!
!!!
!!!!!!!− 𝐵 Eq. (S2)
!"!"= !
!!1− !!!
!!!!!!!− 𝐶 Eq. (S3)
!"!"= !
!!1− !!!,!
!!!,!!!!!,!1− !!!,!
!!!,!!!!!,!+ !!!,!
!!!,!!!!!,!1− !!!,!
!!!,!!!!!,!+ !!!,!
!!!,!!!!!,!!!!,!
!!!,!!!!!,!− 𝐷 Eq. (S4)
!"!"= !
!!
!!!,!
!!!,!!!!!,!1− !!!,!
!!!,!!!!!,!− 𝐸 Eq. (S5)

8
Secondary equations corresponding to model in Figure 3A
B Bsyn_M1 deg_M1 Bk k M1 (0)= ⋅ S(6)
syn_NFκB deg_NFκBk k pNFκB(0)= ⋅ S(7)
syn_PARP tr_PARP 4k k cPARP (0)= ⋅ S(8)
deg_Bcl 4syn_Bcl
k BclxL(0) cPARP (0)k
pNFκB(0)⋅ ⋅
= S(9)

9
Supplemental Figures Figure S1
Figure S1 Schematic of the final Boolean network model in U266 cells. Yellow and blue
highlighted nodes represent those for which literature and experimental data were available or
generated. Purple nodes represent pathway specific probes. Blue-edged boxes are survival
pathway nodes and red-edged boxes represent apoptotic pathway nodes.
: ‘OR’ relation; : ‘AND’ relation between inhibitory and stimulatory signals; :
‘AND’ relation between more than one either stimulatory or inhibitory signals; :
Stimulation; : Effect when stimulation and inhibition are acting together; :
Inhibition; : new connection.
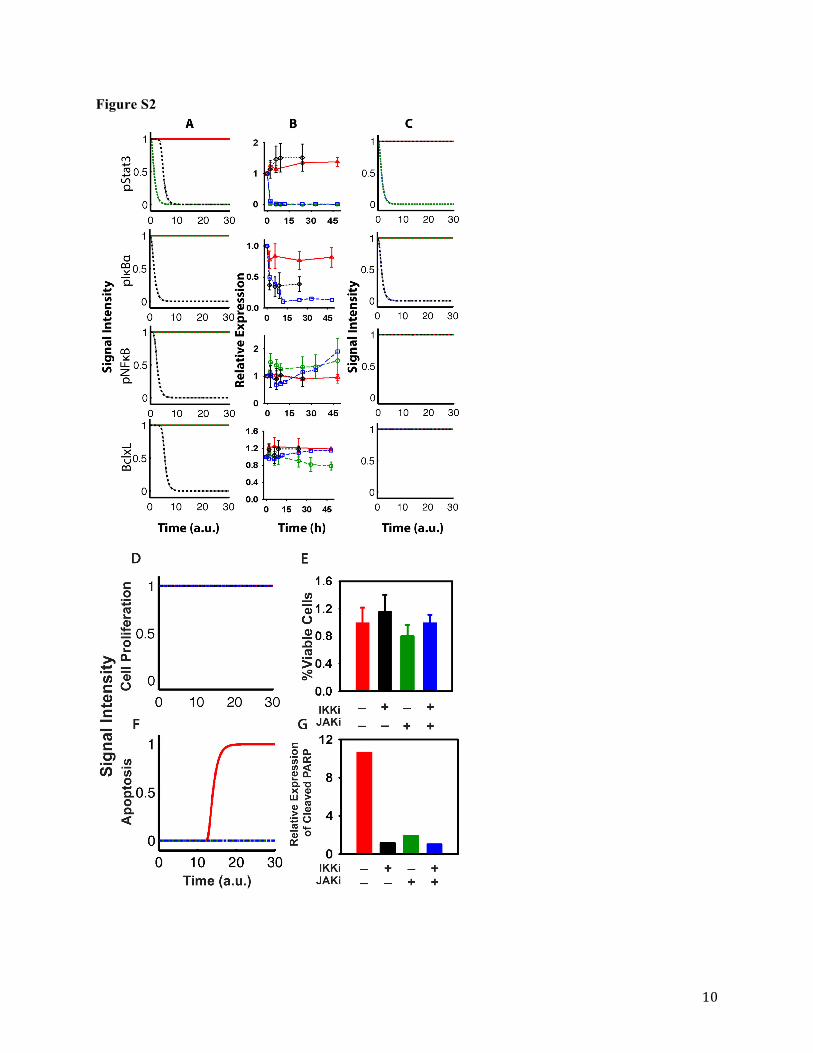
10
Figure S2

11
Figure S2 Comparison of model simulations of protein expression levels and cellular outcomes
with experimental results for pathway specific probes in U266 cells. A) Simulations using an
initial Boolean network model after constant exposure to IKKi and JAKi. B) Time-course of
protein expression levels after constant exposure to IKKi (10 µM), JAKi (10 µM), and IKKi (10
µM) + JAKi (10 µM) in U266 cells. C) Simulations using the final Boolean network model
(Figure S1) after constant exposure to IKKi, JAKi, and IKKi + JAKi. D) Boolean model (Figure
S1) simulations under control conditions (red) or after constant exposure to IKKi (black), JAKi
(green), and IKKi + JAKi (blue). E) Cell proliferation responses at 72h and apoptosis (measured
as cleaved PARP expression) obtained at 24h after constant exposure to IKKi (10 µM), JAKi (10
µM), and IKKi (10 µM) + JAKi (10 µM). Positive control was measured at 12h after incubation
with a cocktail of apoptosis inducers. Control (red, solid), JAKi (green, dash-dash), IKKi (black,
dash-dot), JAKi + IKKi (blue, dotted). Symbols are mean values and error bars are standard
deviations.

12
Figure S3
Figure S3 Comparison between model simulations using the final network (Figure S1) and
experimental protein expression profiles for pathway specific probes. A) Protein expression
levels obtained under constant exposure to IκBi (10 µM) (red) and IκBi (10 µM) + JAKi (10
µM) (blue) in U266 cells. B) Model simulations after constant exposure to IκBi (red) and IκBi +
JAKi (blue). Symbols are mean values from two replicates.
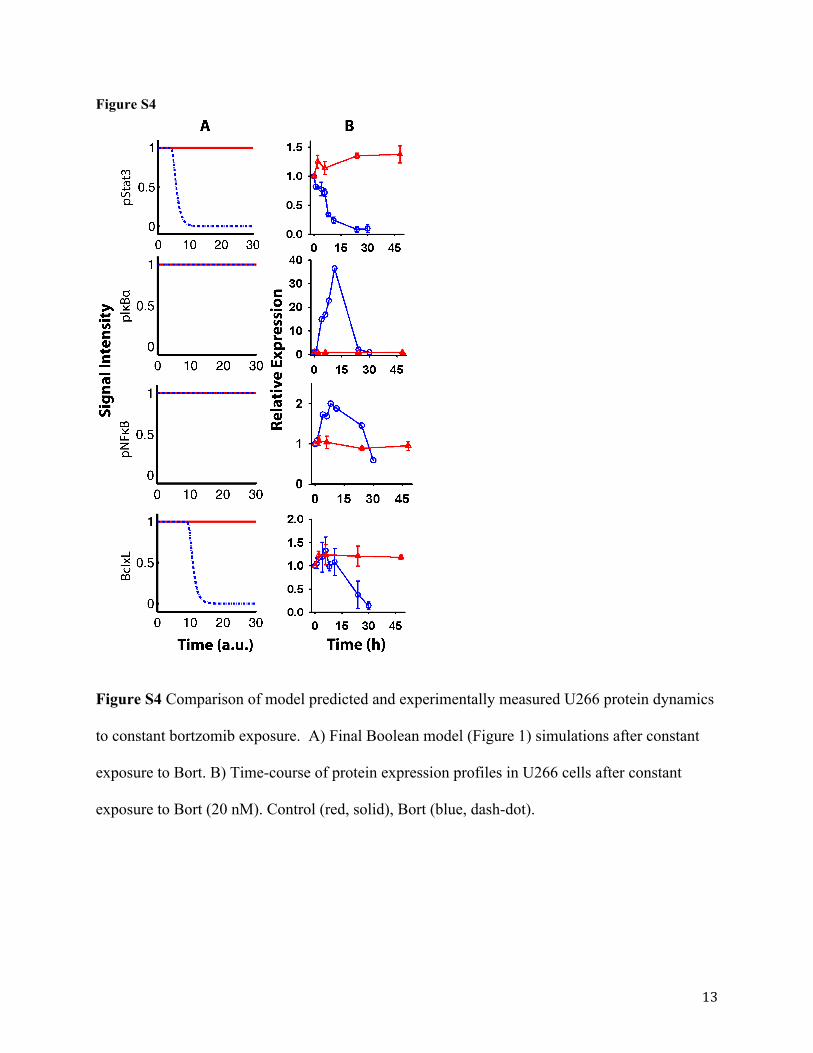
13
Figure S4
Figure S4 Comparison of model predicted and experimentally measured U266 protein dynamics
to constant bortzomib exposure. A) Final Boolean model (Figure 1) simulations after constant
exposure to Bort. B) Time-course of protein expression profiles in U266 cells after constant
exposure to Bort (20 nM). Control (red, solid), Bort (blue, dash-dot).
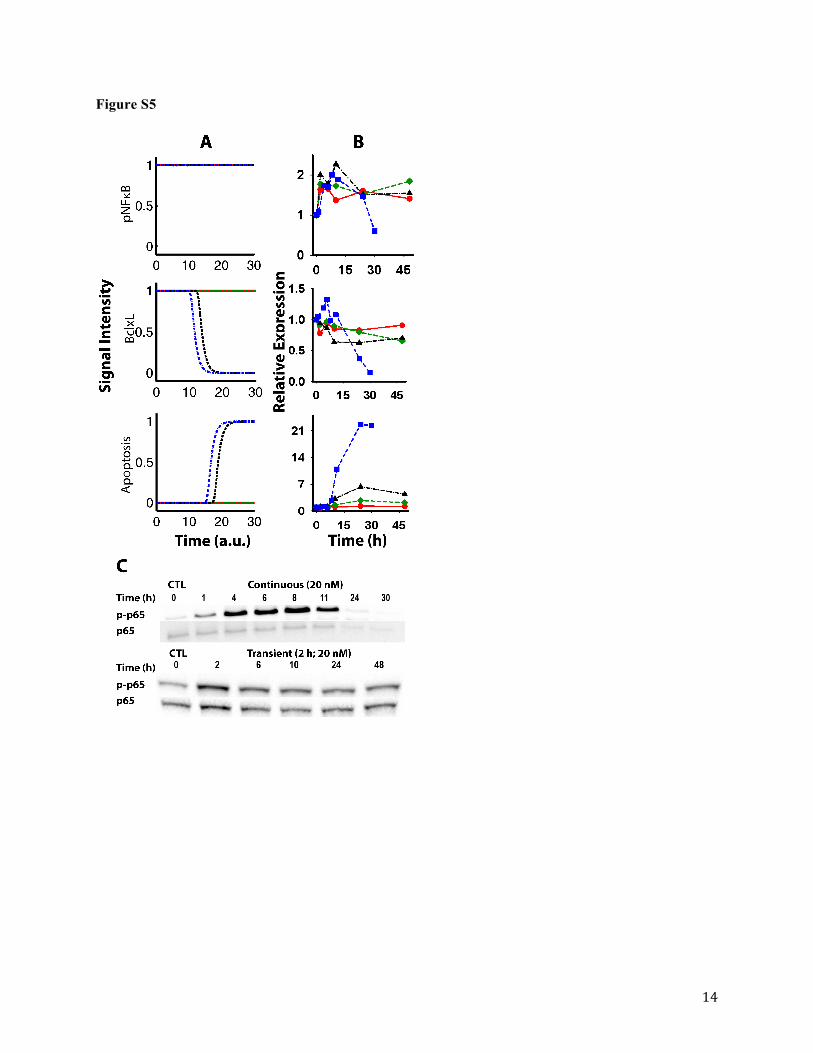
14
Figure S5
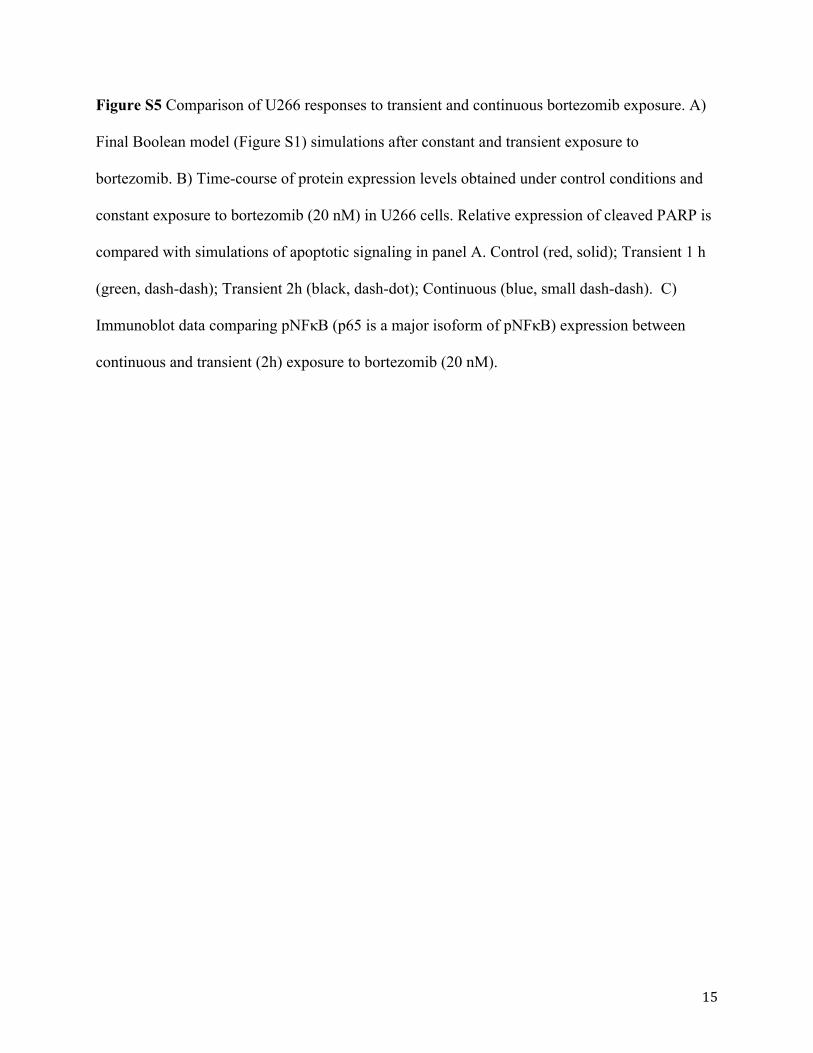
15
Figure S5 Comparison of U266 responses to transient and continuous bortezomib exposure. A)
Final Boolean model (Figure S1) simulations after constant and transient exposure to
bortezomib. B) Time-course of protein expression levels obtained under control conditions and
constant exposure to bortezomib (20 nM) in U266 cells. Relative expression of cleaved PARP is
compared with simulations of apoptotic signaling in panel A. Control (red, solid); Transient 1 h
(green, dash-dash); Transient 2h (black, dash-dot); Continuous (blue, small dash-dash). C)
Immunoblot data comparing pNFκB (p65 is a major isoform of pNFκB) expression between
continuous and transient (2h) exposure to bortezomib (20 nM).
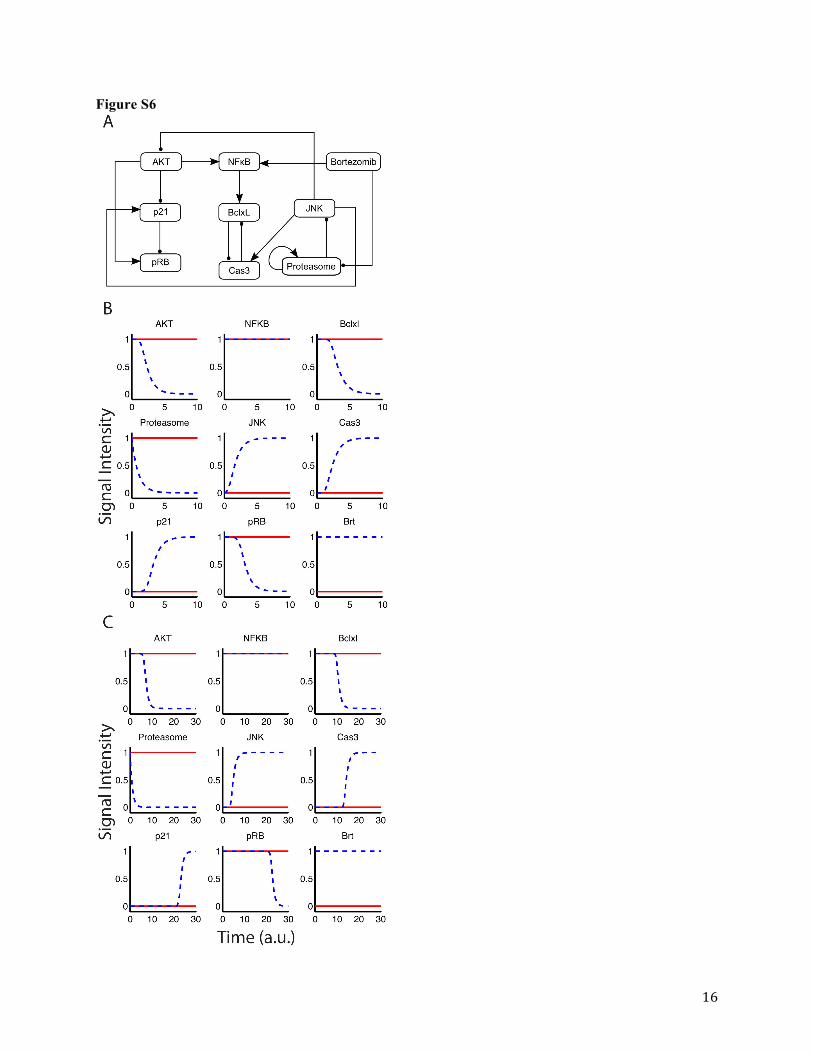
16
Figure S6

17
Figure S6 Reduced network and Boolean simulations. A) Reduced network using the Boolean
network reduction algorithm (Veliz-Cuba, 2011). Stimulation is represented by and
inhibition by . B) Simulations using the reduced Boolean network model in A. C)
Simulations using the final full network shown in Figure S1. Simulations were performed in
Odefy (a MATLAB compatible toolbox). Red solid lines are for control and blue dashed lines
are upon exposure to bortezomib (Brt).

18
Figure S7
Figure S7 Simulated protein dynamics and cell proliferation in U266 cells after increasing
bortezomib concentrations. Profiles were simulated using the final model structure (Figure 3)
and parameter estimates (Table 1). Arrow direction indicates increase in bortezomib
concentration, and lines correspond to 20 (blue), 10 (purple), 2 (orange), 1 (dark green), and 0.1
nM (dark red).

19
Figure S8
Figure S8 Comparison of simulated and experimental responses to low-dose bortezomib (2 nM).
Relative protein expression profiles are shown for A) pNFκB, B) cleaved PARP, and C) BclxL.
Protein expression was measured using western blot in whole-cell lysate. D) Cell proliferation
measured using WST-1 assay kit. Bortezomib treatment data are represented by circles, and
control data are represented by diamonds. Solid lines are simulated profiles using the model in
Figure 3 and final parameter estimates (Table 1).
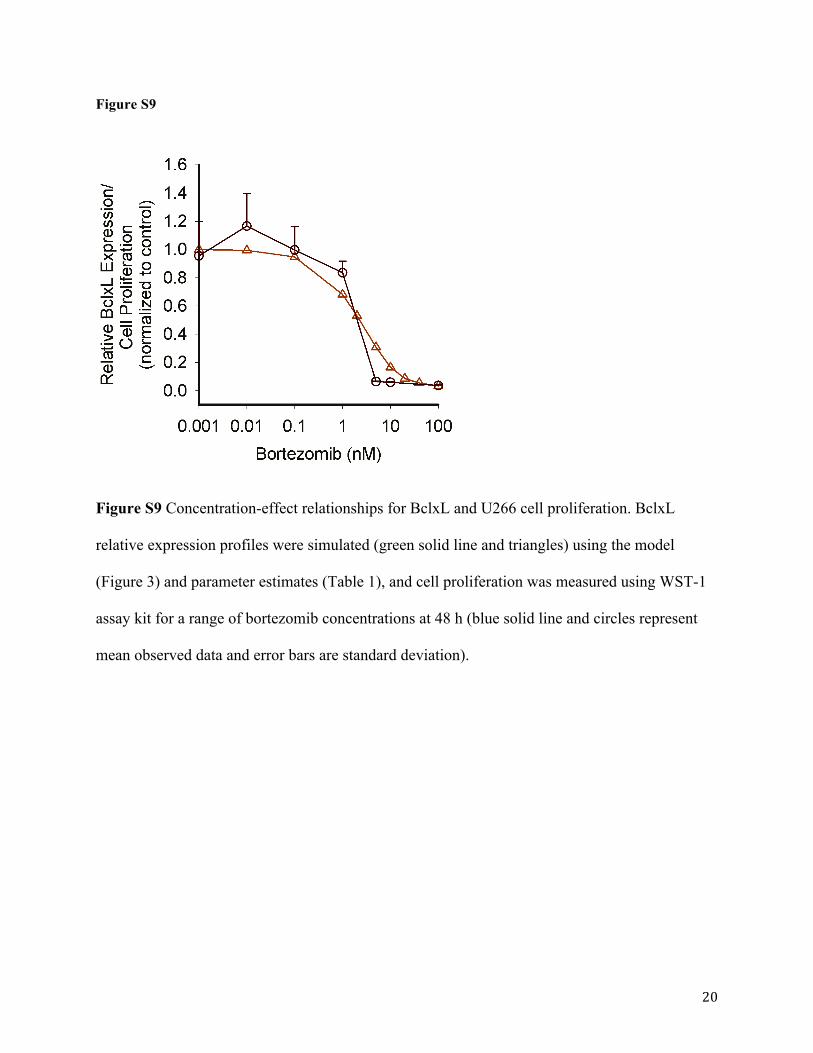
20
Figure S9
Figure S9 Concentration-effect relationships for BclxL and U266 cell proliferation. BclxL
relative expression profiles were simulated (green solid line and triangles) using the model
(Figure 3) and parameter estimates (Table 1), and cell proliferation was measured using WST-1
assay kit for a range of bortezomib concentrations at 48 h (blue solid line and circles represent
mean observed data and error bars are standard deviation).

21
Boolean Network Simulation Code Matlab.m file close all; clear all; clc; InitOdefy %% model= ExpressionsToOdefy({ 'IL6 = pNFKB ', 'gp130 = (~Cas3)', 'TNFaR = <>', 'TNFa = <>', 'RIP = (TNFa && TNFaR) || Bort', 'NIK = ~TRAF3', 'JAK1 = IL6 && gp130 && ~SHP1 && (~JAKi)', 'JAK2 = IL6 && gp130 && ~SHP1 && (~JAKi)', 'IKK = ((RIP && NIK) || AKT ) && (~IKKi) ', 'pIKB = (IKK)', 'pNFKB = ((pIKB && Prot) || pIKB || pSTAT3 || Dummy)' 'FLIP = pNFKB', 'Prot = ~Bort', 'XIAP = (pNFKB || pSTAT3) && ~(Smac || p53)', 'Bclxl = (pNFKB || pSTAT3) && ~(BAX || BAD || p53)', 'BCL2 = (pNFKB || pSTAT3) && ~(BAD || p53)', 'CYCD = MYC || AKT || ERK', 'CYCE = MYC', 'MDM = (p53 || AKT) && ~ATM', 'MYC = pSTAT3 || ERK || MEKK', 'STAT3 = ~Cas3', 'pSTAT3 = ((JAK1 && JAK2 && STAT3) || (JAK1 && JAK2 && STAT3 && ~IKK)) && ~JNK ', 'AKT = PIP3', 'PI3K = (IL6 && gp130)', 'PIP3 = PI3K && ~ PTEN', 'pRB = (CDK4 && CDK6) || (CDK4 && CDK2 && CDK6)', 'CIAP = TNFaR', 'RAS = (IL6 && gp130) || SHP1', 'RAF = RAS', 'MEK1 = RAF', 'MEKK = MEK1', 'MAPK = MEK1',

22
'ERK = MAPK', 'CDK2 = CYCE && (~p21)', 'CDK4 = CYCD && ~(p21 || p27)', 'CDK6 = CYCD ', 'Growth = pRB', 'FasL = FasL || cJun ', 'Fas = Fas || p53 ', 'BAD = ~AKT', 'TRAF3 = ~CIAP', 'PTEN = p53 ', 'SHP1 = <>', 'p27 = p53 && ~(MYC || CDK4 || AKT) ' 'p21 = p53 && ~(MDM || AKT || MYC || CDK4)', 'RAC = STRESS', 'MEKK2 = RAC', 'MKK4 = MEKK2', 'JNK = MKK4 && ~(Prot)', 'DNAdam = Cas3 || STRESS', 'ATM = DNAdam || Cas3', 'DNAPK = ATM', 'p53 = (DNAPK || JNK) && ~(MDM && Prot)', 'cJun = JNK ', 'BAX = (p53 || BID ) && ~(Bclxl || BCL2)', 'BID = (Cas8 || STRESS || Fas) && ~(BCL2 || Bclxl)', 'Cas8 = (FasL && Fas) && ~ FLIP ', 'MITO = BAX', 'Smac = MITO', 'Cytc = MITO', 'Cas9 = Cytc && ~(AKT || XIAP)', 'Cas3 = (Cas8 || Cas9) && ~ XIAP', 'Cl_PARP = Cas3', 'STRESS = DNAdam || ~Prot', 'Apo = Cl_PARP', 'JAKi = <>', 'IKKi = <>', 'Bort = <>', 'Dummy = <>', }); simstruct = CreateSimstruct(model); % Converting Boolean relations to continuous and saving in a file, % Defining Boolean simulation function (hillcubenorm) saveMatlabODE(model, 'ode_Fullmodel_expanded_V14_IKKi_JAKi_brt.m', 'hillcubenorm') rehash;
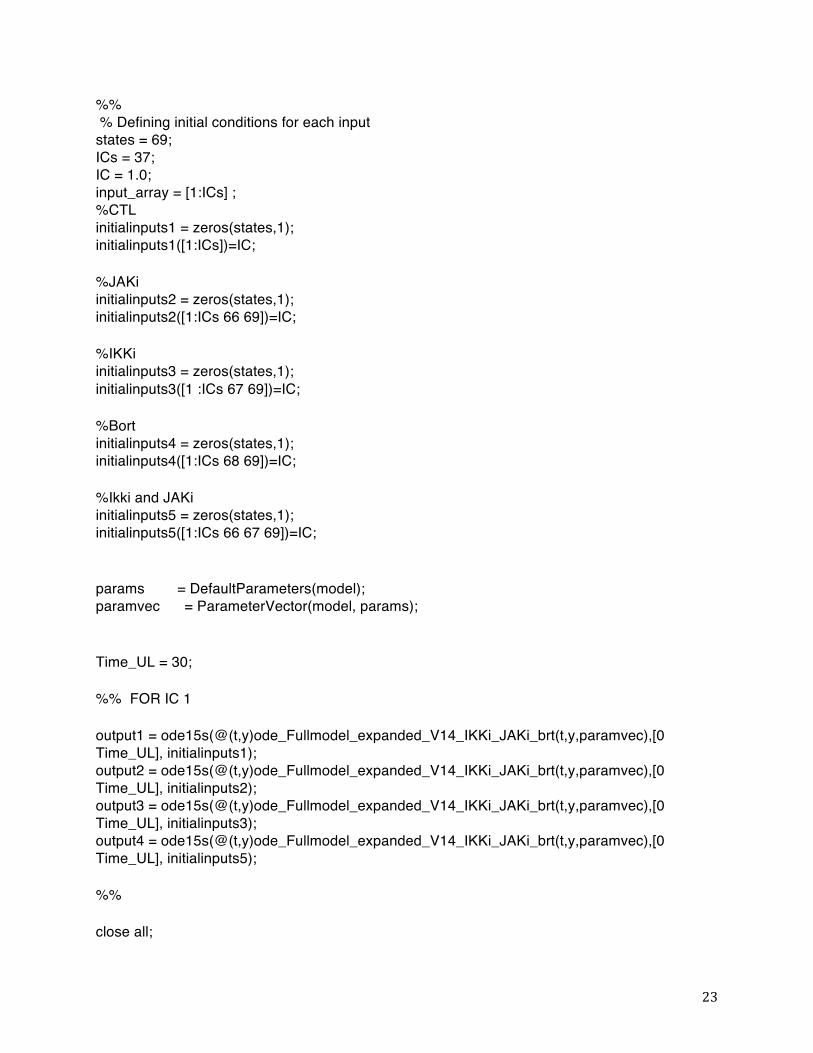
23
%% % Defining initial conditions for each input states = 69; ICs = 37; IC = 1.0; input_array = [1:ICs] ; %CTL initialinputs1 = zeros(states,1); initialinputs1([1:ICs])=IC; %JAKi initialinputs2 = zeros(states,1); initialinputs2([1:ICs 66 69])=IC; %IKKi initialinputs3 = zeros(states,1); initialinputs3([1 :ICs 67 69])=IC; %Bort initialinputs4 = zeros(states,1); initialinputs4([1:ICs 68 69])=IC; %Ikki and JAKi initialinputs5 = zeros(states,1); initialinputs5([1:ICs 66 67 69])=IC; params = DefaultParameters(model); paramvec = ParameterVector(model, params); Time_UL = 30; %% FOR IC 1 output1 = ode15s(@(t,y)ode_Fullmodel_expanded_V14_IKKi_JAKi_brt(t,y,paramvec),[0 Time_UL], initialinputs1); output2 = ode15s(@(t,y)ode_Fullmodel_expanded_V14_IKKi_JAKi_brt(t,y,paramvec),[0 Time_UL], initialinputs2); output3 = ode15s(@(t,y)ode_Fullmodel_expanded_V14_IKKi_JAKi_brt(t,y,paramvec),[0 Time_UL], initialinputs3); output4 = ode15s(@(t,y)ode_Fullmodel_expanded_V14_IKKi_JAKi_brt(t,y,paramvec),[0 Time_UL], initialinputs5); %% close all;

24
dgreen = [0 0.5 0]; options.lines = 3; options.markers = 1; myfontsize = 12.; my_title_font = 12.; mymarkersize = 4.; % to plot continuously add Fig_2 = 25; Fig_3 = 50; %% figure (1); for i=1:25 subplot(5,5,i) hold on plot(output1.x, output1.y(i,:),'r-','Linewidth',2); plot(output2.x, output2.y(i,:), 'color', [0 0.5 0],'linestyle', '--'); plot(output3.x, output3.y(i,:),'k:','Linewidth',2); plot(output4.x, output4.y(i,:),'-.','Linewidth',2); xlim([0,Time_UL]); ylim([-0.1, 1.1]); title(model.species(i), 'fontsize', my_title_font); set(gca, 'Fontsize', myfontsize); axis square bolder; set(gcf,'PaperPosition', [0.25 2.5 8 8]); end xlabel('Time (a.u.)', 'fontsize', myfontsize); ylabel('Signal Intensity', 'fontsize', myfontsize); print -dpng figure_1.png; figure (2); for i=1:25 subplot(5,5,i) hold on plot(output1.x, output1.y(i+Fig_2,:),'r-','Linewidth',2); plot(output2.x, output2.y(i+Fig_2,:),'g--','Linewidth',2);

25
plot(output3.x, output3.y(i+Fig_2,:),'k:','Linewidth',2); plot(output4.x, output4.y(i+Fig_2,:),'-.','Linewidth',2); xlim([0,Time_UL]); ylim([-0.1, 1.1]); title(model.species(i+Fig_2), 'fontsize', my_title_font); set(gca, 'Fontsize', myfontsize); axis square bolder; set(gcf,'PaperPosition', [0.25 2.5 8 8]); end xlabel('Time (a.u.)', 'fontsize', myfontsize); ylabel('Signal Intensity', 'fontsize', myfontsize); print -dpng figure_2_V14_Ki_Ji_Bort.png; figure (3); for i=1:19 subplot(4,5,i) hold on plot(output1.x, output1.y(i+Fig_3,:),'r-','Linewidth',2); plot(output2.x, output2.y(i+Fig_3,:),'g--','Linewidth',2); plot(output3.x, output3.y(i+Fig_3,:),'k:','Linewidth',2); plot(output4.x, output4.y(i+Fig_3,:),'-.','Linewidth',2); xlim([0,Time_UL]); ylim([-0.1, 1.1]); title(model.species(i+Fig_3), 'fontsize', my_title_font); set(gca, 'Fontsize', myfontsize); axis square bolder; set(gcf,'PaperPosition', [0.25 2.5 8 8]); end xlabel('Time (a.u.)', 'fontsize', myfontsize); ylabel('Signal Intensity', 'fontsize', myfontsize); print -dpng figure_3_V14_Ki_Ji_Bort.png;

26
bolder.m h=gca; set(h,'Fontsize',12); set(h,'linewidth',2.0); set(get(gca,'children'),'linewidth',2.0);

27
References
Al Zaid Siddiquee K and Turkson J (2008) STAT3 as a target for inducing apoptosis in solid and
hematological tumors. Cell Res 18:254-‐267.
Bommert K, Bargou RC and Stuhmer T (2006) Signalling and survival pathways in multiple myeloma.
European journal of cancer 42:1574-‐1580.
Gilmore TD (2007) Multiple myeloma: lusting for NF-‐kappaB. Cancer Cell 12:95-‐97.
Hideshima T, Chauhan D, Hayashi T, Akiyama M, Mitsiades N, Mitsiades C, Podar K, Munshi NC,
Richardson PG and Anderson KC (2003a) Proteasome inhibitor PS-‐341 abrogates IL-‐6 triggered
signaling cascades via caspase-‐dependent downregulation of gp130 in multiple myeloma.
Oncogene 22:8386-‐8393.
Hideshima T, Hayashi T, Chauhan D, Akiyama M, Richardson P and Anderson K (2003b) Biologic sequelae
of c-‐Jun NH(2)-‐terminal kinase (JNK) activation in multiple myeloma cell lines. Oncogene
22:8797-‐8801.
Hideshima T, Ikeda H, Chauhan D, Okawa Y, Raje N, Podar K, Mitsiades C, Munshi NC, Richardson PG,
Carrasco RD and Anderson KC (2009) Bortezomib induces canonical nuclear factor-‐kappaB
activation in multiple myeloma cells. Blood 114:1046-‐1052.
Hideshima T, Mitsiades C, Akiyama M, Hayashi T, Chauhan D, Richardson P, Schlossman R, Podar K,
Munshi NC, Mitsiades N and Anderson KC (2003c) Molecular mechanisms mediating
antimyeloma activity of proteasome inhibitor PS-‐341. Blood 101:1530-‐1534.
Kim SH, Ahn KS, Jeong SJ, Kwon TR, Jung JH, Yun SM, Han I, Lee SG, Kim DK, Kang M, Chen CY, Lee JW
and Kim SH (2011) Janus activated kinase 2/signal transducer and activator of transcription 3
pathway mediates icariside II-‐induced apoptosis in U266 multiple myeloma cells. Eur J
Pharmacol 654:10-‐16.

28
Lee H, Herrmann A, Deng JH, Kujawski M, Niu G, Li Z, Forman S, Jove R, Pardoll DM and Yu H (2009)
Persistently activated Stat3 maintains constitutive NF-‐kappaB activity in tumors. Cancer Cell
15:283-‐293.
Lim CP and Cao X (1999) Serine phosphorylation and negative regulation of Stat3 by JNK. J Biol Chem
274:31055-‐31061.
Mai Z and Liu H (2009) Boolean network-‐based analysis of the apoptosis network: irreversible apoptosis
and stable surviving. J Theor Biol 259:760-‐769.
Oancea M, Mani A, Hussein MA and Almasan A (2004) Apoptosis of multiple myeloma. Int J Hematol
80:224-‐231.
Oeckinghaus A and Ghosh S (2009) The NF-‐kappaB family of transcription factors and its regulation. Cold
Spring Harb Perspect Biol 1:a000034.
Piazza FA, Gurrieri C, Trentin L and Semenzato G (2007) Towards a new age in the treatment of multiple
myeloma. Ann Hematol 86:159-‐172.
Richardson PG, Barlogie B, Berenson J, Singhal S, Jagannath S, Irwin D, Rajkumar SV, Srkalovic G, Alsina
M, Alexanian R, Siegel D, Orlowski RZ, Kuter D, Limentani SA, Lee S, Hideshima T, Esseltine DL,
Kauffman M, Adams J, Schenkein DP and Anderson KC (2003) A phase 2 study of bortezomib in
relapsed, refractory myeloma. N Engl J Med 348:2609-‐2617.
Saez-‐Rodriguez J, Alexopoulos LG, Zhang M, Morris MK, Lauffenburger DA and Sorger PK (2011)
Comparing signaling networks between normal and transformed hepatocytes using discrete
logical models. Cancer research 71:5400-‐5411.
Sahin O, Frohlich H, Lobke C, Korf U, Burmester S, Majety M, Mattern J, Schupp I, Chaouiya C, Thieffry D,
Poustka A, Wiemann S, Beissbarth T and Arlt D (2009) Modeling ERBB receptor-‐regulated G1/S
transition to find novel targets for de novo trastuzumab resistance. BMC Syst Biol 3:1.

29
Schlatter R, Schmich K, Avalos Vizcarra I, Scheurich P, Sauter T, Borner C, Ederer M, Merfort I and
Sawodny O (2009) ON/OFF and beyond-‐-‐a boolean model of apoptosis. PLoS Comput Biol
5:e1000595.
Zhang R, Shah MV, Yang J, Nyland SB, Liu X, Yun JK, Albert R and Loughran TP, Jr. (2008) Network model
of survival signaling in large granular lymphocyte leukemia. Proc Natl Acad Sci U S A 105:16308-‐
16313.