logging with hadoop and pentaho data integration (pdi) · 2019-03-06 · we recommend that you have...
TRANSCRIPT

Logging with Hadoop and Pentaho Data Integration (PDI)

This page intentionally left blank.

Contents Overview .............................................................................................................................................................. 1
Before You Begin ............................................................................................................................................ 1
Prerequisites ............................................................................................................................................... 1
Use Case: Pentaho MapReduce Execution Troubleshooting ............................................................... 1
PDI Deployment and Execution on Hadoop Cluster ..................................................................................... 2
Installing PDI Libraries ................................................................................................................................... 2
Hadoop Monitoring and Logging on Pentaho ............................................................................................ 3
Using Resource Manager to Monitor PDI Execution in the Cluster .................................................... 4
Using AEL/Spark ................................................................................................................................................. 5
Debugging and Problem Solving ...................................................................................................................... 5
Getting Pentaho Logs from PMR Execution ............................................................................................... 5
Troubleshooting Problems ....................................................................................................................... 6
Accessing Logs After PMR Process .......................................................................................................... 8
Configuring PDI Memory Usage with JVM ................................................................................................... 8
PMR Configuration ......................................................................................................................................... 8
Hadoop Configuration ..................................................................................................................................... 10
Scheduling YARN Queues ........................................................................................................................... 10
Security – Encryption Zones ........................................................................................................................ 10
Security – Live Hatch .................................................................................................................................... 11
Hive – JDBC URL ............................................................................................................................................ 11
Related Information ......................................................................................................................................... 12
Finalization Checklist ........................................................................................................................................ 12

This page intentionally left blank.

Logging with Hadoop and PDI
Page 1
© Hitachi Vantara Corporation 2018. All Rights Reserved
Overview This document covers some best practices on logging with Hadoop and Pentaho Data Integration (PDI). In it, you will learn how to explore logs to find needed information, and how to customize and configure connections and logging.
Our intended audience is Pentaho and Hadoop administrators.
The intention of this document is to speak about topics generally; however, these are the specific versions covered here:
Software Version(s)
Pentaho 6.x, 7.x, 8.x
The Components Reference in Pentaho Documentation has a complete list of supported software and hardware.
Before You Begin Before beginning, use the following information to prepare for the procedures described in the main section of the document.
Prerequisites
This document assumes that you have knowledge of Pentaho, and administrator privileges in the Pentaho environment.
Use Case: Pentaho MapReduce Execution Troubleshooting
Janice is a Pentaho administrator who needs to troubleshoot issues that occur in the Hadoop side of the Pentaho orchestration process during Pentaho MapReduce execution.
Since these logs are not part of the Pentaho side, Janice must be able to find the associated information in Hadoop that will let her track logs to detect underlying issues in the Pentaho processes.

Logging with Hadoop and PDI
Page 2
© Hitachi Vantara Corporation 2018. All Rights Reserved
PDI Deployment and Execution on Hadoop Cluster Pentaho allows you to interface with Hadoop in a way that gives you control and performance, maximizing the capabilities of your processes.
You can find details on these topics in the following sections:
• Installing PDI Libraries • Hadoop Monitoring and Logging on Pentaho
Installing PDI Libraries The first time you trigger a job against the Hadoop cluster to perform a Pentaho MapReduce (PMR) process, all PDI libraries are copied from the client or server running the job into the Hadoop Distributed File System (HDFS).
PDI libraries, which are Java classes in Java Archive (JAR) file format, default to the location /opt/pentaho/mapreduce.
However, you can change the PDI libraries location in this way:
1. Open plugin.properties in the data-integration/plugins/pentaho-big-data-plugin directory.
2. Change the configuration property pmr.kettle.dfs.install.dir to the alternate path you prefer.
Remember that the user performing the PDI process, whether an operating system (OS) user or a Kerberos principal, must have access to the PDI deployment path on HDFS.

Logging with Hadoop and PDI
Page 3
© Hitachi Vantara Corporation 2018. All Rights Reserved
This illustrates how the process works:
Figure 1: Executing PDI
Hadoop Monitoring and Logging on Pentaho Interaction between PDI and the Hadoop cluster occurs in a few ways:
Table 1: PDI and Hadoop Integration
Interaction Details
Hive This interaction makes use of the JDBC driver and offers the same capabilities available for any other database vendor with PDI, such as. execute SQL, read/put data, etc.
HDFS HDFS interacts with the cluster distributed file system (read/copy files to/from HDFS). HDFS files are inputs or outputs of the stream.
PMR This is a native execution through YARN. You can distribute and scale processes to be executed in the cluster by using MapReduce as a YARN application.

Logging with Hadoop and PDI
Page 4
© Hitachi Vantara Corporation 2018. All Rights Reserved
Figure 2: PDI and Hadoop Interaction
Using Resource Manager to Monitor PDI Execution in the Cluster
Resource Manager coordinates and manages all the resources for distributed applications running on YARN. You can monitor it using Resource Manager, just as you would for any other YARN application in the cluster, because PDI triggers a YARN application execution
Each PDI execution has an application ID associated with it in the Resource Manager.
More information on YARN use is available at Simplifying User-Logs Management and Access in YARN.
You can configure your cluster log retention time with yarn.log-aggregation parameters. Be aware of your configuration; it may be set to remove related content after a process ends.

Logging with Hadoop and PDI
Page 5
© Hitachi Vantara Corporation 2018. All Rights Reserved
Using AEL/Spark Starting with Pentaho 8.0, execution over Spark using AEL is available. If you use this option, you will want to be able to monitor your events.
Capture running or completed Spark transformations an event log, which you can then view with the Spark History Server. The Spark History Server is a browser-based user interface to the event log. Before you can use the Spark History Server, you must configure AEL to log the events.
The steps for how to configure AEL for logging are available at Configure Event Logging in the Pentaho documentation.
Debugging and Problem Solving This section contains various procedures and tips for solving problems with logging in Hadoop and PDI:
• Getting Pentaho Logs from PMR Execution • Configuring PDI Memory Usage with JVM • PMR Configuration
Getting Pentaho Logs from PMR Execution Pentaho can show all the logs from the orchestration process, but you need to look in the YARN application execution logs for the part of the orchestration related to the PMR transformations executed as Mapper and Reducer.
Figure 3: MapReduce Debugging

Logging with Hadoop and PDI
Page 6
© Hitachi Vantara Corporation 2018. All Rights Reserved
Troubleshooting Problems
Here are some steps to try when the PMR process is running, if you experience problems in this part of the process:
1. Go to Resource Manager. 2. Find the application ID of the PMR process and click on its URL.
Figure 4: Application ID
3. Click on ApplicationMaster in the Tracking URL item. 4. Click on the MapReduce Job ID. The Application Master now shows a resume table with
Mappers and Reducers performed and the status of each (running, failed, killed, successful).
Figure 5: MapReduce Job ID

Logging with Hadoop and PDI
Page 7
© Hitachi Vantara Corporation 2018. All Rights Reserved
5. You can now get into one of the Mappers or Reducers and see the logs, which are distributed in stderr, stdout, and syslog. The Pentaho execution content (transformation steps log) is visible under stdout content.
Figure 6: Logs URLs
Figure 7: Pentaho Logs
If you have no web browser available, or cannot use the Resource Manager, use YARN commands to request logs per application or process ID or directly with the path of the logs’ destination. For example, Cloudera Distribution Including Apache Hadoop (CDH)’s YARN default log files location is /yarn/nm/usercache/%username%/appcache/%application_id%.

Logging with Hadoop and PDI
Page 8
© Hitachi Vantara Corporation 2018. All Rights Reserved
Accessing Logs After PMR Process
If the PMR process has already finished when you need to access the logs, try these steps instead:
1. Go to Resource Manager. 2. Find the application ID of the PMR process and click on its URL. 3. Click on History in the Tracking URL item. 4. The Application Master now shows a resume table with Mappers and Reducers executed
and the status of each (running, failed, killed, successful). 5. From here, you can explore Mappers and Reducers by clicking on the appropriate item and
choosing the number under the classification you want (such as Successful). Logs links are accessible from there.
Configuring PDI Memory Usage with JVM The amount of memory PDI uses is controlled by the parameter in the spoon.bat or spoon.sh file, specified with minimum and maximum values (default -xms1024m -xmx2048m).
We recommend that you have at least 2GB of memory dedicated to PDI in workstations and 8GB total with at least 4GB dedicated to Pentaho in a server-side configuration.
Many PDI transformation steps allow you to control how memory is allocated. Moving more memory over to PDI along with fine-tuning some step settings can have a big impact on performance.
You can change this configuration by setting the PENTAHO_DI_JAVA_OPTIONS environment variable. This does not affect the original configuration files.
PMR Configuration We recommend that you optimize and tune PMR executions to review and adapt your cluster configuration relative to YARN and MapReduce memory configuration settings.
Table 2: Cluster Memory Configuration Settings for YARN and MapReduce
Configuring File Configuration Setting Value Calculation (Recommendation)
yarn-site.xml yarn.nodemanager.resource.memory-mb
= Containers * RAM-per-Container
yarn-site.xml yarn.scheduler.minimum-allocation-mb = RAM-per-Container
yarn-site.xml yarn.scheduler.maximum-allocation-mb
= Containers * RAM-per-Container
mapred-site.xml mapreduce.map.memory.mb = RAM-per-Container
mapred-site.xml mapreduce.reduce.memory.mb = 2 * RAM-per-Container
mapred-site.xml mapreduce.map.java.opts = 0.8 * RAM-per-Container
mapred-site.xml mapreduce.reduce.java.opts = 0.8 * 2 * RAM-per-Container
Logging with Hadoop and PDI
Page 9
© Hitachi Vantara Corporation 2018. All Rights Reserved
Configuring File Configuration Setting Value Calculation (Recommendation)
yarn-site.xml yarn.app.mapreduce.am.resource.mb = 2 * RAM-per-Container
yarn-site.xml yarn.app.mapreduce.am.command-opts
= 0.8 * 2 * RAM-per-Container
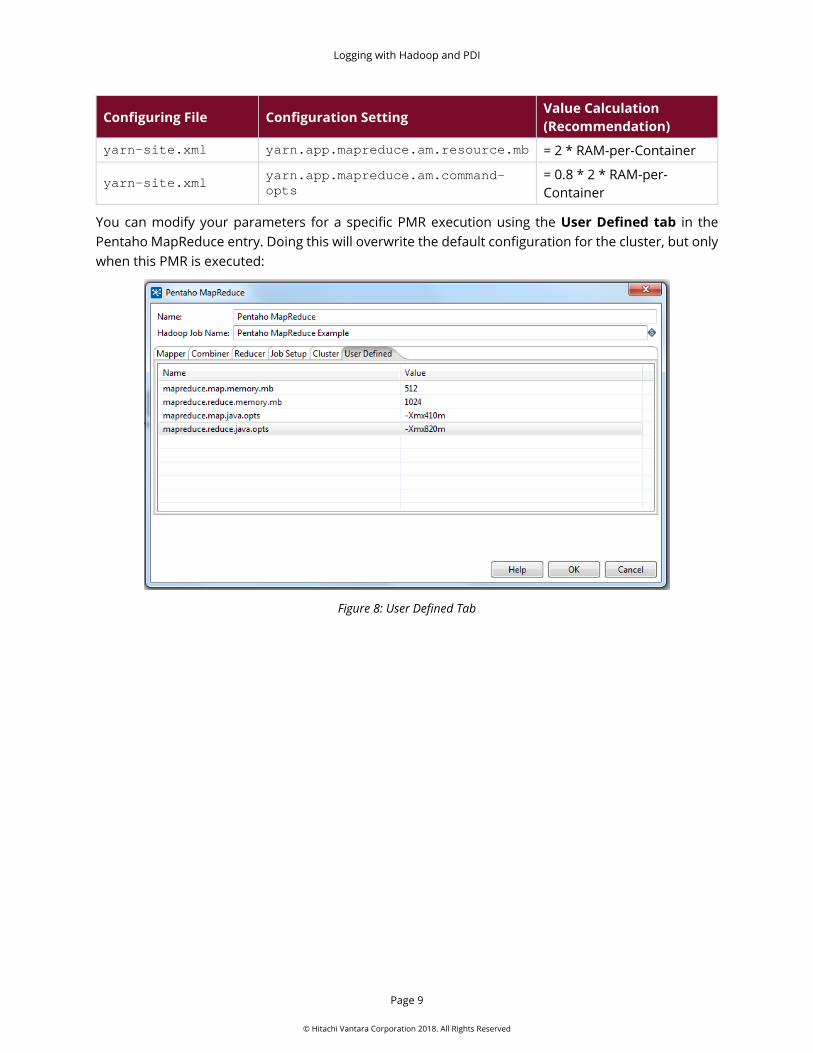
You can modify your parameters for a specific PMR execution using the User Defined tab in the Pentaho MapReduce entry. Doing this will overwrite the default configuration for the cluster, but only when this PMR is executed:
Figure 8: User Defined Tab

Logging with Hadoop and PDI
Page 10
© Hitachi Vantara Corporation 2018. All Rights Reserved
Hadoop Configuration This section details common issues and solutions for Hadoop configuration that directly affects PDI execution. It includes standard Hadoop configuration procedures that any Hadoop administrator should be able to work with:
• Scheduling YARN Queues • Security – Encryption Zones • Security – Hive Scratch Directory • Hive – JDBC URL
Scheduling YARN Queues A queue is the fundamental unit of scheduling in YARN. By default, there is only one queue, root, which can access the full cluster resources. Queues affect the amount of resources that are available to applications running on the clusters.
The YARN scheduler runs the applications in first-in-first-out (FIFO) fashion. If the cluster or queue capacity is full, the applications are queued up.
Because PDI integrates natively with YARN and the MapReduce framework, it is subject to the same constraints from any YARN application that uses queue management policies. The YARN queue configuration will affect the Pentaho MapReduce applications’ performance, because their execution will be throttled down.
Security – Encryption Zones Hadoop provides transparent encryption for data at rest and in transit. The encryption is end-to-end:
• Only the client can encrypt and decrypt data. • The client must have permission to access the correct decryption key to read the data. • Keys are stored in the Key Management Server (KMS).
The correct access to the decryption and encryption keys must be provided beforehand, because PDI acts as a client for HDFS. If the user does not have the correct permissions to read or write a file, they will get an error saying they do not have access to the file.
It is possible to read and write to and from different encryption zones, but again, the user must have access to the proper encryption and decryption keys.

Logging with Hadoop and PDI
Page 11
© Hitachi Vantara Corporation 2018. All Rights Reserved
Security – Live Hatch Hive uses temporary directories to store the intermediate and final outputs from its internal processes. This director defaults to /tmp/hive in HDFS.
When the final output from a Hive process is inside an encryption zone, the temporary directory must reside in that same encryption zone. The final step from the Hive processes moves a file into the final area, so the file encryption keys must match the encryption zone or the process will fail.
You can change the Hive scratch directory using a set command after the JDBC connection is established, or by changing the JDBC connection string:
set hive.exec.scratchdir=<scratchdir location>
jdbc:hive2://<server>:<port>/<db>;httpPath=cliservice;transportMode=http;principal=<principal>?hive.exec.scratchdir=<scratchdir location>
Hive – JDBC URL You can customize the connection string in the PDI connection configuration. The connection string that you use to connect to Hive will depend on the security infrastructure deployed:
• No security
jdbc:hive2://<host>:<port>/<db>
• No security with HTTP transport
jdbc:hive2://<host>:<port>/<db>;transportMode=http;httpPath=<http_endpoint>
• With Kerberos authentication
jdbc:hive2://<host>:<port>/<db>;principal=<Server_Principal_of_HiveServer2>
• Kerberos authentication with HTTP transport
jdbc:hive2://<host>:<port>/<db>;transportMode=http;httpPath=<http_endpoint>;principal=<Server_Principal_of_HiveServer2>

Logging with Hadoop and PDI
Page 12
© Hitachi Vantara Corporation 2018. All Rights Reserved
Related Information Here are some links to information that you may find helpful while using this best practices document:
• JDBC in HiveServer2 • Pentaho Components Reference • Securing JDBC and ODBC Clients’ Access to HiveServer2 Using Apache Knox • Simplifying User-Logs Management and Access in YARN • YARN Commands
Finalization Checklist This checklist is designed to be added to any implemented project that uses this collection of best practices, to verify that all items have been considered and reviews have been performed.
Name of the Project:___________________________________________________________________
Date of the Review:____________________________________________________________________
Name of the Reviewer:_________________________________________________________________
Item Response Comments
Did you place your cluster configuration in the proper SHIM folder?
YES________ NO________
Did you configure your SHIM to place PDI libraries properly on a HDFS location?
YES________ NO________
Did you have access to the Resource Manager to search for execution logs?
YES________ NO________
Did you check cluster memory configuration to optimize PMR execution?
YES________ NO________