loe - richlandcountysc.govrichlandcountysc.gov/portals/0/departments/planning/neighborhood... ·...
TRANSCRIPT

Envisioning a Future
The Strategic Community Master Plan for Lower Richland envisions a future where communities continue to grow and prosper and lands valued for their natural, agricultural, or historical importance are conserved.
lower r ich land countyRICHLAND COUNT Y STRATEGIC COMMUNIT Y MASTER PLAN
lower richland


Lower Richland CommunityPREPARED FOR:Richland County Government
2020 Hampton Street
Columbia, South Carolina
PREPARED BY:LandDesign
223 North Graham Street
Charlotte, NC 28202
In ASSOCIATIOn wITh
CDM Smith
Miley & Associates, Inc.
Quackenbush & Associates, Inc.
RyanHarris
MARCh 18, 2014
R I C H L A N D C O U N T Y strategic community master plans


A Special Thanks to
Marie Barber Adams, Harriet Barber House
Buddy Atkins, Richland County Conservation Department
Kenya Bryant, Richland County Recreation Commission
Lt. Col. Tim Dotson, McEntire ANG
LaToya Grate, AICP, Richland County Planning Department
Lauren Gurniewicz, Congaree National Park
Bryan Hall, Conservation Manager, Camp McCrady
Tracy Hegler, AICP, Richland County Planning Department
Norman Jackson, Richland County Council District 11
Holland Leger, AICP, Richland County Planning Department
R.A. Perkins, Richland One School District
Dan Purini, Richland County Utilities
William McConnell, Fort Jackson
Andy Metts, Richland County Utilities
Suzanne Sanders, Richland County Health Department
Jason Shaw, City of Columbia Utilities
Nancy Stone-Collum, Richland County Conservation Department
Kelvin Washington, Richland County Council District 10
Stuart White, Congaree Land Trust
R I C H L A N D C O U N T Y strategic community master plans

6 : final report lower richland

final report lower richland : 7
1
5
17
lower r ich land countyRICHLAND COUNT Y STRATEGIC COMMUNIT Y MASTER PLAN
Contents
InTRODUCTIOnCommunity Participation
LOwER RIChLAnD PROFILE
A PLAn FOR LOwER RIChLAnD The Future Land Use Map, Subareas & Recommendations
APPEnDICESA: Planning Area Maps
B: Snapshot of Lower Richland County
C: Summary of Feedback from Community Meetings
D: Implementation Matrix
E: List of Intersection improvements

1 : final report lower richland
final report lower richland : 1
This plan is an effort coordinated by the
Richland County Neighborhood Improvement
Program (NIP) to fund master plans and im-
provement projects in Richland County. The
vision of the Richland County Neighborhood
Improvement Program is a healthy and happy
community of high performing schools,
quality infrastructure, parks and trails, and
viable thriving neighborhoods and business
corridors. Sustaining this quality of life re-
quires coordination between many facets of
the community: neighborhood organizations,
military operations, businesses, schools,
local government, etc. Thus NIP’s mission is
to coordinate and empower citizens with the
resources necessary to achieve and sustain
healthy and happy neighborhoods.
The Strategic Community Master Plan for
Lower Richland is being created through
community collaboration to define a direction
for future growth and development in Lower
Richland County. It is a policy document
that conveys a future vision and the steps
to achieve that vision. The Plan is intended
to clearly reflect the community’s expecta-
tions and desires and to guide decisions of
Richland County staff, appointed and elected
officials, developers and others involved in
local development-related activities. More
importantly, it will facilitate consistency in the
decision making that affects this area. Such
decisions include those related to develop-
ment proposals, regulatory changes, and pub-
lic infrastructure investments, as each should
support the implementation of the Plan.
The Strategic Community Master Plan for
Lower Richland is the second community-
based comprehensive plan generated for the
Lower Richland area by the Richland County
Neighborhood Improvement Program. In ad-
dition, several other planning efforts including
the Southeast Richland Neighborhood Master
Plan ( SERN, 2005) and the ongoing Fort Jack-
son, McEntire Joint Land Use Implementation
Plan address specific areas within Lower Rich-
land. The Plan anticipates changes in Lower
Richland over a twenty year time period. Its
findings are based on a detailed analysis of
existing and future demographic and market
trends, environmental features and con-
straints, existing and planned infrastructure
improvements, historical and cultural assets,
existing and planned military operations, and
land use and development trends.
Introduction
The Strategic Community Master Plan for Lower Richland envisions a future where communities continue to grow and prosper and lands valued for their natural, agricultural, or historical importance are conserved.
A complete report detailing the existing conditions in Lower Richland can be found in the Appendix B of this document.

2 : final report lower richland
Community ParticipationKey to this process is a robust and inclusionary public
engagement process. Community participation and
input is critical in shaping the Strategic Community
Master Plan for Lower Richland County. Understanding
community values today ensures that this plan
can support recommendations to maintain those
priorities in the future. To inform citizens of meetings
and invite their participation in the process, 13,277
postcards were mailed out to property owners before
each meeting. In addition, 100 signs were placed
throughout the area to notify residents of the plan and
provide county contact information.
stakeholder IntervIewsStakeholder interviews were conducted in the fall of
2012 to verify and supplement the data gathered and
mapped, to explain the conditions observed and to
further the understanding of issues and opportunities
that affect the Planning Area. Stakeholder input
supplements the input received directly from citizens
and property owners participating in the process.
The stakeholders, include key personnel from
County organizations and agencies as well as
representatives of interest groups who can address
questions about the following topics: schools, utilities,
military, transportation, real estate, local businesses,
neighborhoods, emergency services, government,
economic development, parks and the environment.
InTRODUCTIOn
Open House Meeting, December 11, 2012 Lower Richland High School Auditorium
Open House Meeting, December 11, 2012 Lower Richland High School Auditorium
Open House Meeting, December 11, 2012 Lower Richland High School Auditorium

final report lower richland : 3
CommunIty meetIngsA community open house was held on December 11,
2012 in the Lower Richland High School Auditorium.
This meeting offered citizens and other stakeholders
the opportunity to learn about the project, the process,
and the related schedule, and to provide input. Over
95 people signed-in at the meeting. Attendees listed
community assets that should be acknowledged in the
plan as features to protect or to leverage for a better
community in the future. Attendees provided input on
possible community goals to guide the development
of the Strategic Community Master Plan for Lower
Richland County.
In January 2013, a two-day workshop provided an op-
portunity to work together to develop a future plan for
Lower Richland. The draft concept was presented dur-
ing a public meeting on January 29, 2013 at the Cross-
roads Community Center. Over 80 people signed-in at
the meeting. All feedback provided during the com-
munity workshop was considered in the refined plan
concept. A third and final community meeting was
held April 4, 2013 at Eastover Park. During this meeting
approximately 37 community members reviewed the
final plan, discussed recommendations to implement
the vision and prioritized action steps.
All feedback provided in community meetings is lo-
cated in Appendix C of this report.
websIteIn addition, to augment the input gathered through
meetings, a Web site (http://wikiplanning.org) was
created so Lower Richland residents, property own-
ers, business owners and other stakeholders could
take a survey and submit comments and questions in
response to information posted to the site. Such input
was recorded and, like the input shared at the com-
munity meeting, was used to clarify the issues and
desires of the community. The website also provided
project information including a schedule, project mate-
rials, and contact information. Those who logged into
the site received automatic updates on meeting dates
and locations.
Community Workshop, January 29, 2013 Crossroads Community Center
Final Community Meeting, April 4, 2013 Eastover Park
Community Workshop, January 29, 2013 Crossroads Community Center

4 : final report lower richland
final report lower richland : 5
1 prized pieces of land: the impact of reconstruction on african-american land ownership in lower richland County, South Carolina, USC, 2009.
Lower Richland Profile
Lower Richland is an area rich in natural, cultural and community amenities. Elected officials, County staff and community stakeholders realize that in order to sustain and enhance the quality of life valued by residents it is necessary to balance development opportunities with the need to preserve the natural, agricultural and historic assets of the region.
Planning AreaRichland County is located on the eastern
edge of the Piedmont Plateau and the west-
ern edge of the Atlantic Coastal Plain. The
Lower Richland Planning Area is located in
the southeast portion of Richland County. The
Planning Area consists of 326 square miles. It
begins southeast of Columbia and is bound-
ed by Leesburg Road, the county line to the
north, the Wateree River to the east, and the
Congaree River on the south.
The history and development of Lower Rich-
land is closely tied to the land. The Congaree
Indians first found home in the bottomland
hardwood forests of the river. Hernando
DeSoto passed through the area and estab-
lished Spanish outposts during his explora-
tion of the southeastern United States. Dur-
ing the American Revolution, Francis Marion,
also known as the Swamp Fox, eluded British
forces in the Congaree. Following the Revo-
lution, the rich soils of Lower Richland pro-
vided for a thriving and prosperous economy
based on cotton and slave labor. After the
Civil War and Reconstruction, the State of
South Carolina, became “the only southern
state to promote the redistribution of land for
the benefit of freed men and women, as well
as landless whites.1” With newly acquired
lands, African American families quickly
established themselves and grew in terms of
both influence and affluence.
During the late 1800s, Lower Richland had
the most population in the County second to
Columbia. Along with the new farms, more
families began to settle around the existing
rail line connecting Columbia to the coast.
Kingville, Acton, Eastover, Gadsden, Hopkins
and Wateree all become centers of activ-
ity complete with post offices, merchants,
schools, churches and other small agriculture-
based operations. Following the World Wars,
the railroads were replaced by the interstate
highway system and the population of Lower
Richland slowly declined as more and more
families moved from the country to the urban
centers such as Columbia, Atlanta and Chi-
cago seeking employment opportunities.
In recent history, the area has developed
with the growth of three significant military
operations, Fort Jackson, Camp McCrady

6 : final report lower richland
LOwER RIChLAnD PROFILE
Exhibit 1: Planning Area Map
and Camp McEntire. In addition, major employers
such as Westinghouse and International Paper located
facilities in the area. In 2003, the Congaree Swamp
National Monument was designated as a National
Park. This plan accommodates changes such as these
in Lower Richland while preserving the area’s cultural
identity and unique natural resources. This plan
recognizes the opportunity to reinvigorate the farming
and forestry economy in Lower Richland. Successful
agribusiness operations allow for the preservation of
the cultural heritage of the area, provide a compatible
use to neighboring military operations, conserve the
agricultural landscape and rural feel valued by existing
residents and provide local jobs.

final report lower richland : 7
Fort Jackson provides 50 percent of the Army’s Basic Combat Training and trains 60 percent of the women entering the Army each year.
Guiding Principles
CommunIty IdentItyResilient communities with unique histories define
the cultural identity of Lower Richland. From historic
Hopkins to the newer neighborhoods, residents seek
to preserve community character and define a future
direction that allows for opportunities to enhance their
quality of life. Stakeholder feedback and input given at
community meetings suggest that the rural landscape,
natural assets and the ‘being out in the country’ feel of
Lower Richland are key values not to be compromised
as the area grows. However, residents also indicated
a need for additional jobs and community services
such as health facilities and more retail and restaurant
options. This plan looks to balance the desire to
maintain the area’s rural character with additional
development opportunities.
mIssIon operabIlItyThree large military operations call Lower Richland
home. The McEntire Air National Guard military base,
home of the South Carolina Air National Guard’s 169th
Fighter Wing is located south of Garner’s Ferry Road
in the center of the Planning Area. Fort Jackson, a
U.S. Army installation, and Camp McCrady, a training
site for the Air National Guard, are located north of
Leesburg Road, just outside of the Planning Area. In
addition, Shaw Air Force Base in Sumter is only 20
miles from the study area.
Currently, there is an effort to identify compatible
uses in Lower Richland as part of an update to the
Joint Land Use Study (JLUS) completed in 2009.
Specifically the southern boundary of Fort Jackson
and Camp McCrady, Leesburg Road and the area
immediately around McEntire are being studied.
Ensuring mission operability is critical not only for the
Planning Area but also for Richland County and the
State of South Carolina. This plan supports the unique
needs of the military with the community’s interests
and preserves mission operability by suggesting
recommendations that balance military and economic
interests with community needs.
The Harriet Barber House, listed on the National Register of Historic Places, is the only freedman’s dwelling still remaining from the Land Commission Program.
8 : final report lower richland
LOwER RIChLAnD PROFILE
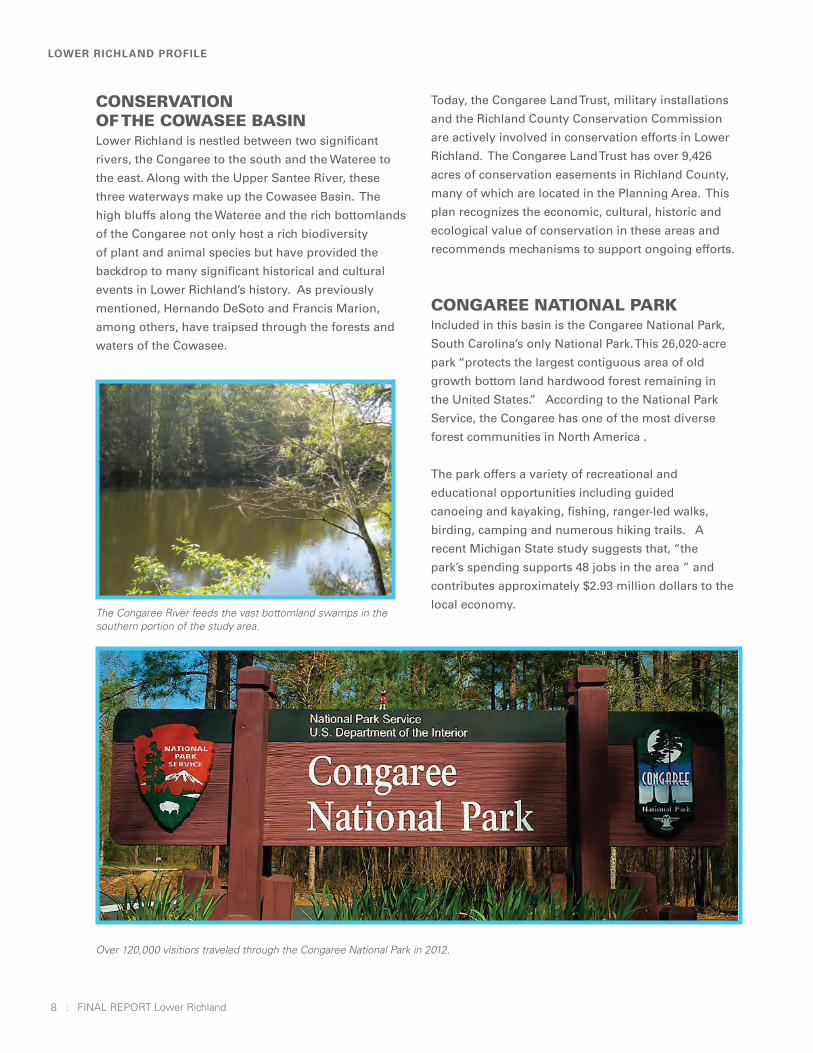
ConservatIon of the Cowasee basInLower Richland is nestled between two significant
rivers, the Congaree to the south and the Wateree to
the east. Along with the Upper Santee River, these
three waterways make up the Cowasee Basin. The
high bluffs along the Wateree and the rich bottomlands
of the Congaree not only host a rich biodiversity
of plant and animal species but have provided the
backdrop to many significant historical and cultural
events in Lower Richland’s history. As previously
mentioned, Hernando DeSoto and Francis Marion,
among others, have traipsed through the forests and
waters of the Cowasee.
Today, the Congaree Land Trust, military installations
and the Richland County Conservation Commission
are actively involved in conservation efforts in Lower
Richland. The Congaree Land Trust has over 9,426
acres of conservation easements in Richland County,
many of which are located in the Planning Area. This
plan recognizes the economic, cultural, historic and
ecological value of conservation in these areas and
recommends mechanisms to support ongoing efforts.
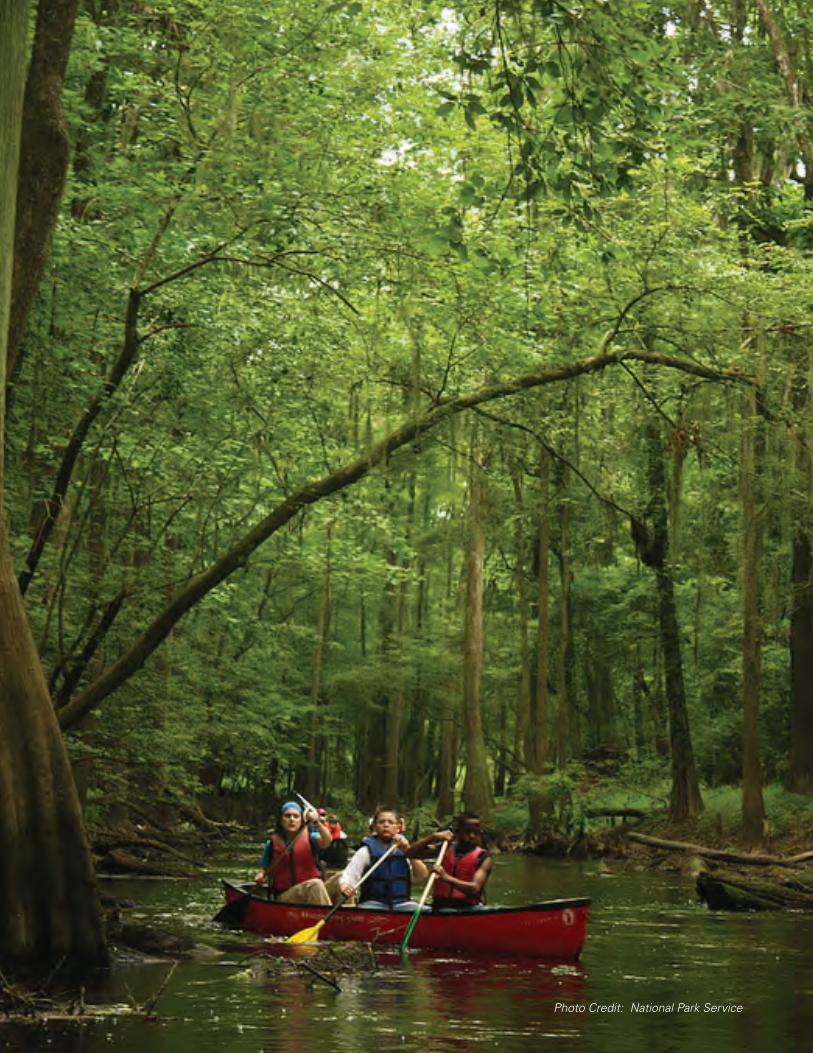
Congaree natIonal parkIncluded in this basin is the Congaree National Park,
South Carolina’s only National Park. This 26,020-acre
park “protects the largest contiguous area of old
growth bottom land hardwood forest remaining in
the United States.” According to the National Park
Service, the Congaree has one of the most diverse
forest communities in North America .
The park offers a variety of recreational and
educational opportunities including guided
canoeing and kayaking, fishing, ranger-led walks,
birding, camping and numerous hiking trails. A
recent Michigan State study suggests that, “the
park’s spending supports 48 jobs in the area ” and
contributes approximately $2.93 million dollars to the
local economy. The Congaree River feeds the vast bottomland swamps in the southern portion of the study area.
Over 120,000 visitiors traveled through the Congaree National Park in 2012.
final report lower richland : 9
In addition to its economic contributions, the Park
protects the critical and rare old growth bottom land
hardwood forest. In addition, there are 22 different
plant communities, over 80 species of trees, over
170 bird species, 60 reptile and amphibian species
and 49 fish species that call the park home. One key
theme guiding recommendations in this plan is the
promotion of economic development and tourism
opportunities while protecting this unique resource.
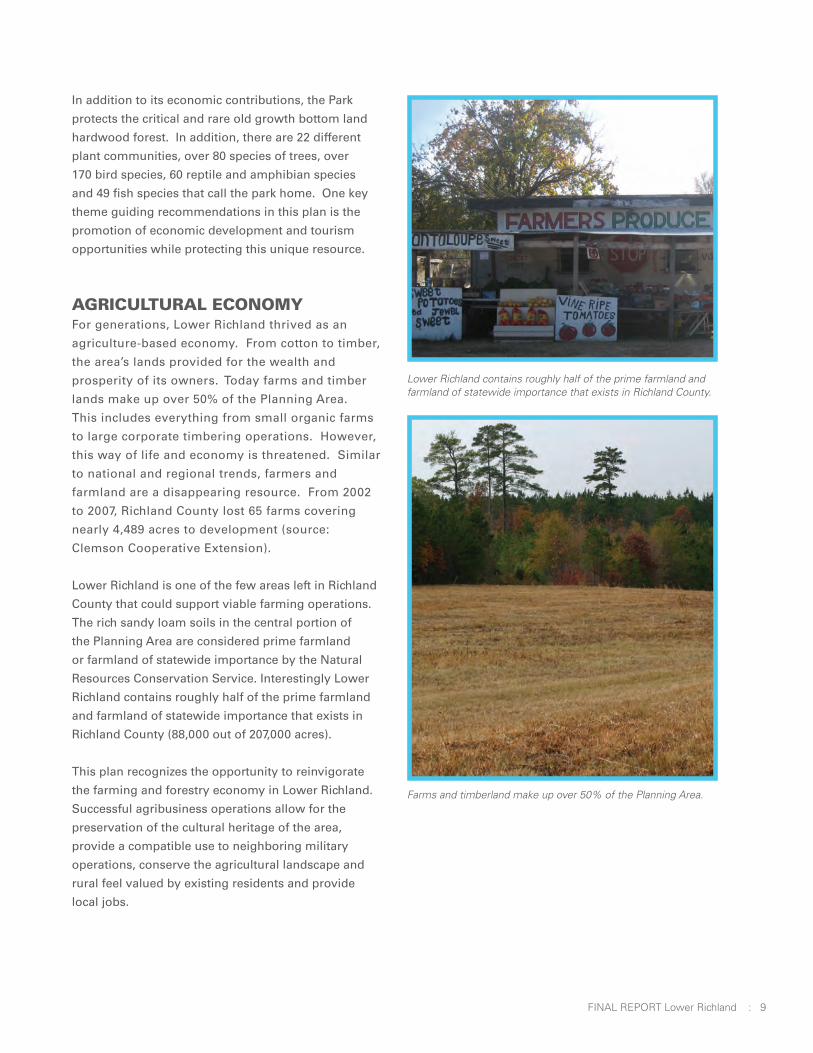
agrICultural eConomyFor generations, Lower Richland thrived as an
agriculture-based economy. From cotton to timber,
the area’s lands provided for the wealth and
prosperity of its owners. Today farms and timber
lands make up over 50% of the Planning Area.
This includes everything from small organic farms
to large corporate timbering operations. However,
this way of life and economy is threatened. Similar
to national and regional trends, farmers and
farmland are a disappearing resource. From 2002
to 2007, Richland County lost 65 farms covering
nearly 4,489 acres to development (source:
Clemson Cooperative Extension).
Lower Richland is one of the few areas left in Richland
County that could support viable farming operations.
The rich sandy loam soils in the central portion of
the Planning Area are considered prime farmland
or farmland of statewide importance by the Natural
Resources Conservation Service. Interestingly Lower
Richland contains roughly half of the prime farmland
and farmland of statewide importance that exists in
Richland County (88,000 out of 207,000 acres).
This plan recognizes the opportunity to reinvigorate
the farming and forestry economy in Lower Richland.
Successful agribusiness operations allow for the
preservation of the cultural heritage of the area,
provide a compatible use to neighboring military
operations, conserve the agricultural landscape and
rural feel valued by existing residents and provide
local jobs.
Lower Richland contains roughly half of the prime farmland and farmland of statewide importance that exists in Richland County.
Farms and timberland make up over 50% of the Planning Area.

10 : final report lower richland
LOwER RIChLAnD PROFILE
Issues & OpportunitiesThe State of South Carolina suggests nine elements be included in the Comprehensive Planning
Process including population, economic development, natural resources, cultural resources,
community facilities, housing, land use, transportation and priority investment areas. This report
identifies issues and opportunities for the first eight elements based on an analysis of the existing
conditions and supplemented with feedback from stakeholders.
populatIon growth
Annual Swampfest is a celebration of local culture.
Opportunities• Lower Richland County’s population will continue
to grow at around .63% each year. This growth
rate is well below County and State averages
indicating slow, but consistent growth each year.
• Changing demographics in the Planning Area,
such as the growth of the senior-aged cohort and
decreasing household size, indicate a shift in
consumer preferences for smaller, more accessible
housing.
Issues• There is a lack of diverse housing options in the
Planning Area. According to national trends,
there is a shift in consumer demand for more
apartments, townhomes and small-lot single
family homes. Much of this demand is driven by
the baby-boomer and millennial age-cohorts.
land use
Lower Richland Farmland is some of the most productive land in the state.
Opportunities• With additional private and/or public investment,
the Southeast Richland Neighborhood could
develop as suggested in the SERN Plan.
• Existing land use in the Planning Area today
supports a variety of objectives including
preservation of the rural landscape, compatibility
with military installations, conservation efforts and
preservation of agriculture lands for local food
production.
Issues• The mix of residential and nonresidential uses is
not very diverse, which affects the area’s ability to
support a strong tax base.
• Military operations’ impact (noise, odor, visual)
residential development within identified
military zones near McEntire ANG, Fort Jackson
and Camp McCrady.

final report lower richland : 11
• Current zoning prohibits certain types of
commercial and service land uses, such as
restaurants, that may be appropriate in certain
sections of the Planning Area.
• Investment in infrastructure in the southern
and eastern portion of the Planning Area could
increase pressure for additional development,
which might preclude the preservation of
open space for future agriculture purposes,
maintenance of the rural character of this area,
and protection of key habitats for rare species and
game animals.
• The low-density pattern of development is
contributing to the challenges of providing
infrastructure and services.
eConomIC CondItIons
McEntire Air National Guard Base is the home of SC ANG 169th Fighter Wing.
Opportunities• Proximity to key regional “economic drivers”,
such as the military installations,including Shaw
Air Force Base, downtown Columbia, USC and
the Congaree National Park could have a positive
impact on the Lower Richland economy. For
example, Lower Richland could develop as a hub
for recreation and cultural tourism.
• Several interstates including I-20, I-26, I-77 and
I-95 are located within a 15-minute drive of Lower
Richland. Proximity to these facilities could attract
warehousing and logistics businesses, bringing
jobs to the area.
Issues• There is a lack of high-wage jobs in the Planning
Area.
• Farming operations, once the mainstay of
the Lower Richland economy, have suffered a
significant decline in recent years due to the land
fragmentation, an aging farmer population and a
lack of a cash crop such as cotton or tobacco.
housIng
Newer neighborhoods in Lower Richland are suburban in scale and character.
Opportunities• Land in Lower Richland is less expensive
than neighboring areas with similar access to
downtown Columbia and Fort Jackson.
• An aging population could increase need for more
housing options for seniors who choose to remain
in Lower Richland.
• Decreasing household size could result in demand
for smaller homes and expanded choice in
housing types to suit various lifestyles.
Issues• Housing options in the planning area are limited.
• Existing housing stock is aging and energy
inefficient.
• Vacant residences lead to safety and blight concerns.
• Military operations impact (noise, odor, visual)
residential development within identified military
zones near McEntire ANG, Fort Jackson and Camp
McCrady.

12 : final report lower richland
• Vacant commercial and residential structures are
blighted.
• New developments lack character and
distinguishing elements.
• Litter is an increasing issue in some communities.
transportatIon
Opportunities• The Central Midlands Regional Transit Authority
(CMRTA) identified potential future transit
opportunities for the Lower Richland Planning
Area including a new Hopkins Limited Stop
Express route.
• CMRTA is also studying strategies to provide
rural areas with transportation solutions to assist
residents of these communities with their mobility
needs.
• There is funding for a multi-use path on a section
of Lower Richland Boulevard.
• The Palmetto Trail, a statewide trail, runs through
the Planning Area along Leesburg Road and picks
up again east of the Wateree River.
Issues• Intersection operational improvements are needed
along many of the main east-west corridors within
the Planning Area.
• Congestion during peak hours at the entrance to
Camp McCrady on Leesburg Road causes a queue
of cars in the main roadway.
• There is a lack of safe pedestrian and bike facilities
connecting key community facilities such as parks
and schools.
• The lack of connectivity in the current road
network affects circulation, which exacerbates
issues related to congestion and public safety.
• Safety improvements are needed along Garners
Ferry to improve driver awareness.
InTRODUCTIOn
CommunIty CharaCter
Opportunities• Rural character.
• Historic communities.
• Bucolic landscapes.
• Established neighborhoods.
• Distinct churches.
Issues• Commercial “strip” development that has occurred
along Leesburg Road and Garners Ferry Road does
not serve to create a distinct character for Lower
Richland.
St. John’s Episcopal Church is one of several historic churches in the area.
Leesburg Plaza is representative of the strip-commercial development currently in the area.

final report lower richland : 13
• If bike/pedestrian facilities along the roadway
are built, then access across the rail line will
need to be upgraded to meet the American with
Disabilities Act (ADA) requirements.
envIronment and natural resourCes
Lower Richland is home to the largest bottomland hardwood forest in the United States.
Opportunities• Water is abundant; there are few waters classified
as impaired.
• Carolina Bays are an unique geological features in
the Planning Area.
• The Congaree National Park contains the largest
contiguous area of old-growth bottomland
hardwood forest remaining in the United States
Area.
• The natural features, such as riparian and
bottomland forests, contribute to the quality and
character of the area.
• The area is not overly developed; the open space
that exists contains valuable working farmland
as well as important natural habitats and wildlife
corridors.
• Some soils are prime farmland or soils of
statewide importance and are therefore suitable
for agricultural purposes.
• Improved access to farmers markets and adoption
of specialty crops may improve economic viability
of farming smaller land holdings.
• There is a long history of forestry activities in the
area due to soils that provide high growth rates.
• Many privately owned sportsman (hunting and
fishing) clubs are located in the area providing
wildlife habitat and outdoor recreational
opportunities for members.
• Residents consider air quality to be good.
Issues• Floodplain makes up 21% of the land area with the
majority located along the Congaree River. Floods
pose a threat to some existing residences and
impede circulation along some roadways.
• Hydric soils and soils with limited septic tank
absorption capacity present challenges for
development.
• Many areas along the Wateree exceed 10% slope;
some bluffs exceed 25% slope.
• There are threatened and endangered species in
the area including the Bald Eagle, Red-Cockaded
Woodpecker, Flatwoods Salamander, Gopher Frog,
Big-eared Bat, Pine Barrens Treefrog, Spotted Turtle
and Ground-Dove.
• Suburban development encroaching on existing
agricultural and forestry operations may result in
land use conflicts.
• Fragmentation of forests and habitat can impact
rare species and game animals that utilize wildlife
corridors that extend beyond the borders of the
Congaree National Forest.
• There are a few water bodies that are classified as
303d Impaired Waters. These include parts of the
Congaree River (PathogenFecal Coliform), Cedar
Creek (Impaired Macroinvertebrate Biota) and
Tom’s Creek (Fecal Coliform).

14 : final report lower richland
• The Congaree National Park offers a variety
of recreational and educational opportunities
including guided canoeing and kayaking, fishing,
ranger-led walks, birding, camping and numerous
hiking trails.
• The Congaree River and Cedar Creek canoe trails
provide canoeing and kayaking opportunities.
Additional access points along the Wateree River
could attract additional recreational paddling
enthusiasts.
Issues• Pedestrian and bicycle connections between
park facilities are needed to improve access for
residents.
Cultural and hIstorIC resourCes
Opportunities• There is an abundant concentration of historic
sites in Lower Richland.
• There is a strong sense of preservation in the
community. Existing organizations such as the
Southeast Rural Community Outreach are actively
promoting Lower Richland’s historic assets.
parks, reCreatIon, greenways and open spaCe
Opportunities• Parks and the recreational facilities are abundant
in Lower Richland. There are seven facilities in the
Planning Area, many with new community centers.
• In addition to existing facilities, four neighborhood
parks are planned for the Lower Richland area.
The locations of these facilities have yet to be
determined.
• There is strong community support for parks and
recreation in Lower Richland.
• There are opportunities for shared use agreements
between community facilities and medical
providers to provide a critical service needed in
the area.
• The Palmetto Trail, a statewide trail system,
traverses the study area. The Fort Jackson Passage
is a 14-mile section through the installation and
along Leesburg Road that connects the Capital
City Passage with the yet to be completed Wateree
Passage into Sumter County.
• Visitorship to the Congaree National Park
continues to increase over time. In 2012, over
109,685 people visited the Park.
• There is support for greenways connecting key
community facilities such as parks and schools.
Hopkins Park is one of seven recreation facilities in the area.
Goodwill Plantation is one of many historic sites in Lower Richland.
final report lower richland : 15
• Community festivals, such as the Swamp Fest,
celebrate Lower Richland’s history.
Issues• There is a lack of funding to support continued
preservation of some of these assets.
• There is a lack of local and regional awareness and
appreciation of the cultural and historic assets in
the Planning Area.
utIlItIes
Opportunities• City of Columbia could provide a north-south
water main connection to existing water along
Leesburg and Garners Ferry Roads that would
complete the water main loop and increase service
reliability and capacity in the northwest portion of
the Planning Area.
• As noted in the 2010 Sewer Service Agreement
between the City of Columbia and Richland
County, the County is to assume management of
all wastewater facilities in Lower Richland by 2016.
Issues• The low density pattern of development
contributes to the challenges of providing water
and sewer services. There are too few customers
to justify the costs of utility extension.
• Water pressure is low in some areas, which affects
fire protection.
• Private utility systems, such as the water system in
Hopkins, are operating in the area and could create
issues in developing a single County system.
CommunIty faCIlItIes and servICes
Opportunities• There are several recently renovated/constructed
community centers in the area that could serve
multiple functions.
• The Garners Ferry Sports Complex opened in
July 2013 and includes a new senior center and
technology center for residents of Lower Richland.
Issues• There are a lack of affordable and urgent care
medical facilities in Lower Richland.
• Stakeholders suggest that there is an increase in
vandalism in the area.
• There is perception that schools in Lower Richland
need improvement.
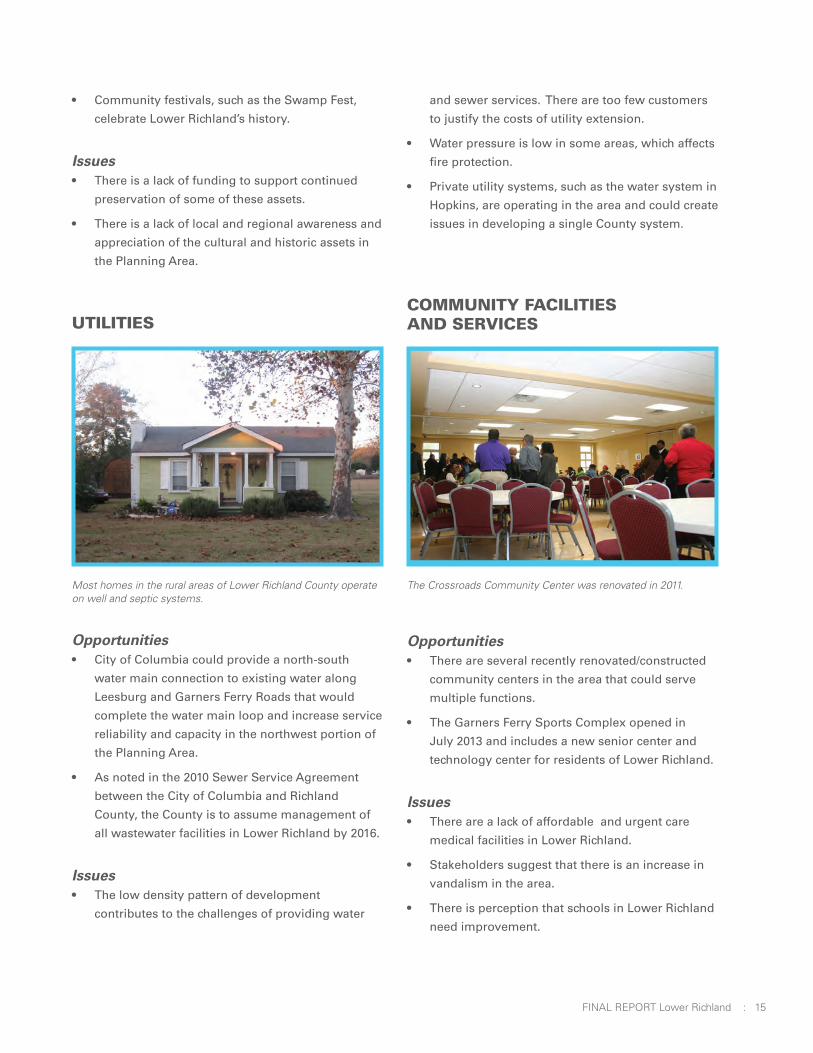
The Crossroads Community Center was renovated in 2011. Most homes in the rural areas of Lower Richland County operate on well and septic systems.
16 : final report lower richland Photo Credit: National Park Service

final report lower richland : 17
The Lower Richland Future Land Use Map is a conceptual representation that illustrates the
development patterns stakeholders, elected officials and citizens of Lower Richland envision for
the future of the Planning Area. The map is descriptive, not prescriptive, conveying the commu-
nity’s desires for the future and the flexibility needed to accommodate unforeseen opportunities
that may achieve the community’s new vision in exciting ways.
Subareas & RecommendationsSix land use subareas are depicted on the map. Each is intended to indicate a predominant
land use—or set of uses—as well as other features that define the character of the area. Each
description is consistent with the ideas and vision the community has for the future of each
subarea. These descriptions do not suggest a change to existing development within each
subarea; instead, they suggest a set of recommendations and list qualities to be embodied by
new development and redevelopment. Supporting all subareas are a set of transportation and
general recommendations.
suburban transItIon area
rural resIdentIal areas
mIlItary CompatIbIlIty Zones
nodes of aCtIvIty
Cowasee ConservatIon CorrIdor
agrICultural area
transportatIon
general reCommendatIons
A Plan for Lower Richland
The Strategic Community Master Plan for Lower Richland envisions a future where communities continue to grow and prosper and lands valued for their natural, agricultural, or historical importance are conserved.

18 : final report lower richland
Future Land Use Map The map’s features include the following:
• Clearly defined and delineated land use areas that
reflect the community’s desire to direct growth
in specific areas and protect the area’s natural,
cultural and historic assets;
• Existing community nodes, including the areas
already planned for in the Southeast Richland
Neighborhood Master Plan and Eastover;
• Future nodes, where with investments in
infrastructure and facilities, development could
occur;
• Transportation network improvements that
support the future land use pattern envisioned by
the community.

final report lower richland : 19

20 : final report lower richland
• Incorporate the
recommendations from
the Southeast Richland
Neighborhood Master
Plan (SERN) into the
Lower Richland Strategic
Community Master Plan.
• Invest in projects
that improve driver
awareness along
Garners Ferry.
• Identify and prioritize
sidewalk and greenway
connections to existing
community facilities such
as the Lower Richland
High School and Garners
Ferry Sports Complex.
• Promote a variety of
housing types including
townhomes and
apartments.
• Provide additional utility
service to increase
service reliability and
capacity.
• Promote development
that is respectful of
existing neighborhoods,
as well as natural,
agricultural and historic
resources.
Suburban Transition Area
suburban transItIon area reCommendatIons*
plannIng area
J o r d a n sP o n d
J o r d a n sP o n d
T w i nL a k e s
O l dH e i s e s
P o n d
H a r m o n sP o n d
G w i n n sP o n d
R e v e r e sP o n d
S u nV i e wL a k e
U p p e rL e g i o n
L a k e
M o r r e l l sP o n d
L a k eT r o t w o o d
Cabin Branch
Mil l Creek
Re
ede r P
oint B
ranch
Cedar Creek
Dry Bra nch
Horsepe n Branch
W ildca
t Cre
ek
Goos
e Br
anch
Myers Creek
GGAARRNNEERRSS FFEERRRRYY RRDD
CCOONNGGAARREEEE RRDD
BLUFF RD
BLUFF RD
PPIINNEEVVIIEEWW RRDD
LLEEEESSBBUURRGG RRDD
LEESBURG RDLEESBURG RD
Ft JacksonFt Jackson
GARNERSGARNERSFERRY SPORTSFERRY SPORTS
COMPLEXCOMPLEXHORRELHORREL
HILL PARKHILL PARK
0 0.850.425Miles
LOWER RICHLAND SUBURBAN TRANSITION AREA FUTURE LAND USE
Disclaimer: This map was created with the best available data, however, it is provided "as is" without warranty of any representation of accuracy, timeliness, reliability or completeness. This map does not represent a legal survey of the land and is for graphical purposes only. Use of this Data for any purpose should be with acknowlegement of the limitations of the Data, including the fact that the Data is dynamic and is in a constant state of maintenance.
Date: 4/3/2013 | LDI # 1011133Data Source: Richland County, USGS, Esri RICHLAND COUNTY, SC
1 inch = 1,159 feet
Activity CentersExisting Community Node
Rural Center
Rural Crossroads
Future Land Use ClassTransition Area
Rural Residential
Agriculture
Cowassee Corridor
Military Installation
Military Compatibility Area
Boundary FeaturesLower Richland Planning Area
Municipalities
SC Counties
Floodplain
Conservation Easements
Congaree National Park
County Park
Transportation NetworkInterstates
Primary & Secondary Roads
Rail
Exhibit 3: Suburban Transition Area highlighted in red. See Appendix A for map enlargement.
*partial list
The northwest portion of the Planning Area is a place in transition. Driven
by the proximity to Columbia and Fort Jackson, availability of existing
infrastructure and relatively affordable land prices, the suburban footprint
of Columbia is slowly extending westward into Lower Richland. The Sub-
urban Transition Area is defined as the northwest portion of the Planning
Area bounded by Trotter Road and Bitternut Road to the west. The eastern
boundary is formed by the series of wetlands and streams connecting
Jordan’s Pond, Harmon’s Pond and Morrell’s Pond. The northern border
is Leesburg Road; the southern border is formed by the rail line along Air
Base Road.
In 2005, the County recognized a smaller portion of the Lower Richland
area as a Priority Investment Area and commissioned the Southeast Rich-
land Neighborhood Master Plan (SERN) to help guide and balance devel-
opment in this section of the County. This plan recognizes the recommen-
dations of the SERN plan and reinforces its findings.
Within this Suburban Area is the Southeastern Richland Neighborhood
Master Plan (SERN) Planning Area. The SERN Planning Area is defined
as the vicinity generally within a one-mile radius from the intersection of
A PLAn FOR LOwER RIChLAnD

final report lower richland : 21
Exhibit 4: Southeastern Richland Neighborhood Master Plan Planning AreaSee Appendix A for map enlargement.
Lower Richland Boulevard and
Garners Ferry Road. This plan
supports the SERN’s findings that
this area is envisioned as a place
that could support a concentrated
mix of retail, commercial and
residential uses. Through the
public engagement process, many
of the residents of Lower Richland
agree that the area would benefit
from additional services such as
a medical facility and a grocery
store. Retail shops and restaurants
are also desired by community
stakeholders.
Building on the SERN, this plan
suggests recommendations to
guide development of these ser-
vices in a way that enhances the
community and creates a sense
of place. Small-scale pockets of
commercial activity connected to
apartments and/or townhomes by
sidewalks and plazas create a walk-
able, pedestrian-friendly shopping
destination. Traditional strip-
developments, the type that can
be found in “anywhere USA,” lack
identity and often result in single-
destination trips. Alternatively, a
destination with a mixture of uses,
including restaurants, retail and
services creates a place where
people want to visit and linger.
In addition to commercial develop-
ment, new housing development
should not be limited to traditional
¾-acre single-family lots. To ac-
commodate shifts in demographic
trends and buyer preferences, a
range of housing options includ-
ing single-family, townhomes and
apartments is appropriate.
Development in this area should
be balanced with community-
supported preservation of critical
open spaces and waterways. As a
gateway into Lower Richland, the
Suburban Area should highlight
many of the qualities valued by
residents of the area. Key wooded
areas should be preserved to
maintain natural viewsheds. In
addition, streams, ponds and
wetlands, especially Carolina Bays,
should be protected from develop-
ment. Open spaces and/or parks
should be integrated into all new
developments.
In addition to the type and scale of
development, particular attention
to connections between and within
these areas is critical to enhanc-
ing existing and future residents’
quality of life. Greenways and
sidewalks connecting neighbor-
hoods to facilities are needed to
provide a safe pedestrian route
for the community. Additional
road connections and intersection
improvements are suggested to
enhance mobility.
22 : final report lower richland
• Improve intersections
to enhance mobility
and safety along main
corridors.
• Identify and prioritize
sidewalk and greenway
connections to existing
community facilities
such as schools and
parks.
• Ensure housing is safe,
energy-efficient and
accessible.
• Identify and protect
critical natural assets
and wetlands including
Carolina Bays.
• Consider developing
buffers around key
historic and cultural
assets to protect the
integrity of the site.
• Identify vacant and
blighted structures and
determine appropriate
courses of action to
ensure community
health and safety.
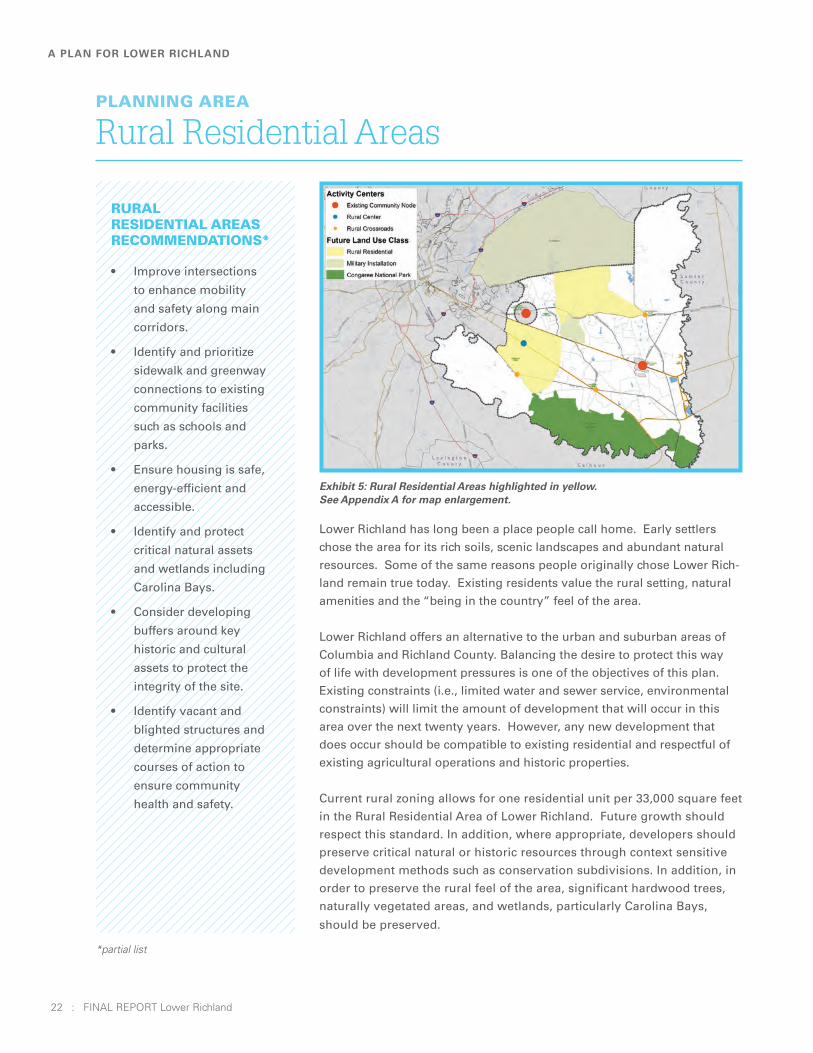
reCommendatIons*rural resIdentIal areas
A PLAn FOR LOwER RIChLAnD
Exhibit 5: Rural Residential Areas highlighted in yellow. See Appendix A for map enlargement.
Rural Residential AreasplannIng area
*partial list
Lower Richland has long been a place people call home. Early settlers
chose the area for its rich soils, scenic landscapes and abundant natural
resources. Some of the same reasons people originally chose Lower Rich-
land remain true today. Existing residents value the rural setting, natural
amenities and the “being in the country” feel of the area.
Lower Richland offers an alternative to the urban and suburban areas of
Columbia and Richland County. Balancing the desire to protect this way
of life with development pressures is one of the objectives of this plan.
Existing constraints (i.e., limited water and sewer service, environmental
constraints) will limit the amount of development that will occur in this
area over the next twenty years. However, any new development that
does occur should be compatible to existing residential and respectful of
existing agricultural operations and historic properties.
Current rural zoning allows for one residential unit per 33,000 square feet
in the Rural Residential Area of Lower Richland. Future growth should
respect this standard. In addition, where appropriate, developers should
preserve critical natural or historic resources through context sensitive
development methods such as conservation subdivisions. In addition, in
order to preserve the rural feel of the area, significant hardwood trees,
naturally vegetated areas, and wetlands, particularly Carolina Bays,
should be preserved.
rural resIdentIal areasreCommendatIons*

final report lower richland : 23
• Partner with the
JLUS Implementation
Team to develop
Comprehensive Plan
language to promote
community/military
coordination.
• Incorporate JLUS
Implementation Plan
recommendations for
the identified areas
of concern around
Fort Jackson, Camp
McCrady and McEntire
JNGB.
• Incorporate JLUS
Implementation Plan
recommendations for
the areas of concern
around Fort Jackson
• Keep residential
density very low in
these areas to reduce
nuisance conflicts
between neighborhood
residents and military
operations.
mIlItary Zones reCommendatIons
Exhibit 6: Military ZonesSee Appendix A for map enlargement.
Military Compatibility ZonesplannIng area
Within the Rural Residential areas are two zones identified by the
military that represent the Accident Potential Zone (APZ) of McEntire
National Guard Base and the Artillery Noise Contour of Fort Jackson
and Camp McCrady. Currently there is an effort underway to identify
and implement compatible growth strategies within these areas of
concern. As noted in the current Comprehensive Plan, “maintaining
the compatibility of land uses around the military installations and
reducing potential conflicts between the neighboring community and
the mission of these military bases is imperative.”
Three types of nodes are represented on the Future Land Use Plan.
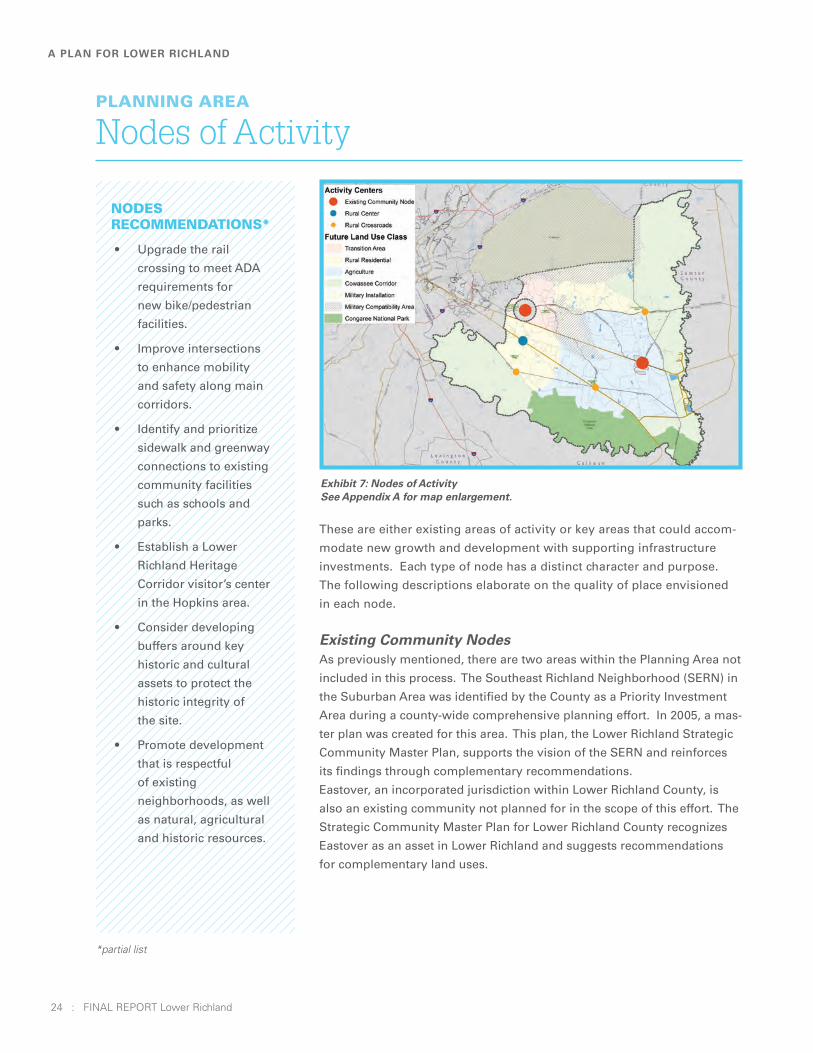
24 : final report lower richland
Exhibit 7: Nodes of ActivitySee Appendix A for map enlargement.
• Upgrade the rail
crossing to meet ADA
requirements for
new bike/pedestrian
facilities.
• Improve intersections
to enhance mobility
and safety along main
corridors.
• Identify and prioritize
sidewalk and greenway
connections to existing
community facilities
such as schools and
parks.
• Establish a Lower
Richland Heritage
Corridor visitor’s center
in the Hopkins area.
• Consider developing
buffers around key
historic and cultural
assets to protect the
historic integrity of
the site.
• Promote development
that is respectful
of existing
neighborhoods, as well
as natural, agricultural
and historic resources.
These are either existing areas of activity or key areas that could accom-
modate new growth and development with supporting infrastructure
investments. Each type of node has a distinct character and purpose.
The following descriptions elaborate on the quality of place envisioned
in each node.
Existing Community Nodes As previously mentioned, there are two areas within the Planning Area not
included in this process. The Southeast Richland Neighborhood (SERN) in
the Suburban Area was identified by the County as a Priority Investment
Area during a county-wide comprehensive planning effort. In 2005, a mas-
ter plan was created for this area. This plan, the Lower Richland Strategic
Community Master Plan, supports the vision of the SERN and reinforces
its findings through complementary recommendations.
Eastover, an incorporated jurisdiction within Lower Richland County, is
also an existing community not planned for in the scope of this effort. The
Strategic Community Master Plan for Lower Richland County recognizes
Eastover as an asset in Lower Richland and suggests recommendations
for complementary land uses.
Nodes of ActivityplannIng area
nodesreCommendatIons*
*partial list
A PLAn FOR LOwER RIChLAnD

final report lower richland : 25
TOP:Conceptual illustration of Hopkins
BOTTOM:Conceptual site plan for Hopkins
Rural CenterHopkins is identified as a Rural
Center on the Future Land Use
Plan. Hopkins was originally
settled by plantation owners who
used slave labor to clear land,
harvest crops and establish a
community. After Emancipation,
many of the freedmen and freed-
women acquired the lands they
originally worked through the
South Carolina Land Commission
Program. Hopkins grew as a center
of African-American community
and commerce. A stop on the rail
line from Charleston to Columbia
added to its importance as a hub
of activity in the Lower Richland
community. Today Hopkins re-
mains a center of activity; there are
a number of community facilities
in the area including schools, parks
and churches.
With a significant concentra-
tion of historic and cultural
landmarks, Hopkins could serve
as the origination point for the
Lower Richland Heritage Cor-
ridor Tour and as the gateway
into Lower Richland. By orient-
ing a few commercial buildings
across from a central community
green the area could develop as a
vibrant rural village center. In ad-
dition, the green could host many
of the annual events and festivals
held in the community.
With appropriate infrastructure
investments, Hopkins could
support additional single-family
residential complementary to
existing neighborhoods. By at-
tracting additional residents to
the area, the once thriving com-
munity can begin to reinvigorate
itself. In addition to a few road-
way improvements, a greenway
system connecting residents to
the schools, parks and churches
is needed to provide for safe
pedestrian access between com-
munity facilities. The following
sketch illustrates a concept plan
for Hopkins community.
26 : final report lower richland
A PLAn FOR LOwER RIChLAnD
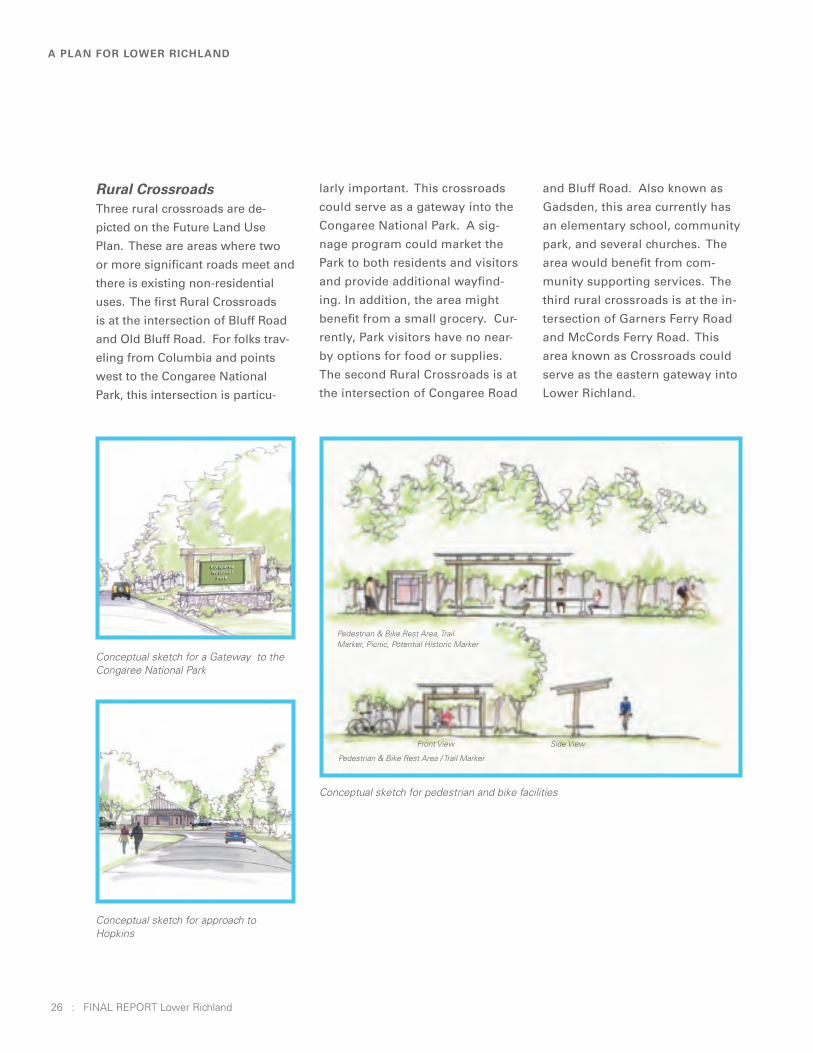
Conceptual sketch for a Gateway to the Congaree National Park
Conceptual sketch for pedestrian and bike facilities
Conceptual sketch for approach to Hopkins
Rural CrossroadsThree rural crossroads are de-
picted on the Future Land Use
Plan. These are areas where two
or more significant roads meet and
there is existing non-residential
uses. The first Rural Crossroads
is at the intersection of Bluff Road
and Old Bluff Road. For folks trav-
eling from Columbia and points
west to the Congaree National
Park, this intersection is particu-
larly important. This crossroads
could serve as a gateway into the
Congaree National Park. A sig-
nage program could market the
Park to both residents and visitors
and provide additional wayfind-
ing. In addition, the area might
benefit from a small grocery. Cur-
rently, Park visitors have no near-
by options for food or supplies.
The second Rural Crossroads is at
the intersection of Congaree Road
and Bluff Road. Also known as
Gadsden, this area currently has
an elementary school, community
park, and several churches. The
area would benefit from com-
munity supporting services. The
third rural crossroads is at the in-
tersection of Garners Ferry Road
and McCords Ferry Road. This
area known as Crossroads could
serve as the eastern gateway into
Lower Richland.
Pedestrian & Bike Rest Area, Trail Marker, Picnic, Potential Historic Marker
Pedestrian & Bike Rest Area / Trail Marker
Front View Side View
final report lower richland : 27
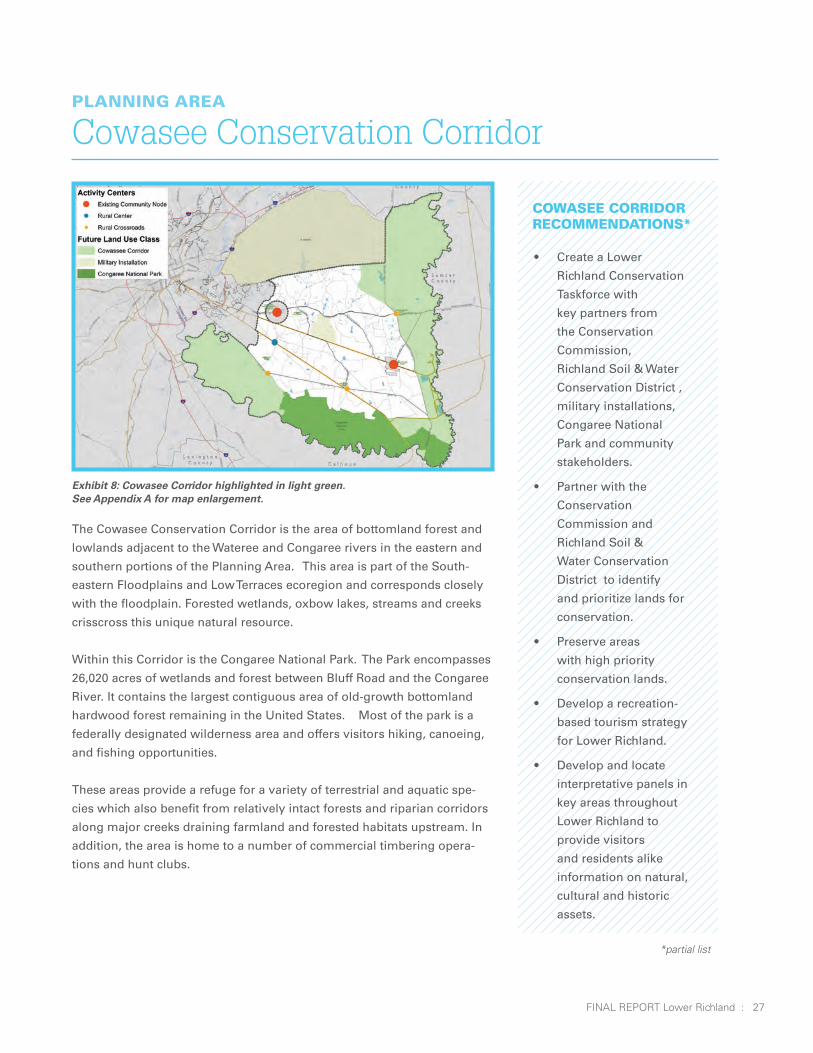
• Create a Lower
Richland Conservation
Taskforce with
key partners from
the Conservation
Commission,
Richland Soil & Water
Conservation District ,
military installations,
Congaree National
Park and community
stakeholders.
• Partner with the
Conservation
Commission and
Richland Soil &
Water Conservation
District to identify
and prioritize lands for
conservation.
• Preserve areas
with high priority
conservation lands.
• Develop a recreation-
based tourism strategy
for Lower Richland.
• Develop and locate
interpretative panels in
key areas throughout
Lower Richland to
provide visitors
and residents alike
information on natural,
cultural and historic
assets.
Exhibit 8: Cowasee Corridor highlighted in light green.See Appendix A for map enlargement.
*partial list
Cowasee Conservation CorridorplannIng area
The Cowasee Conservation Corridor is the area of bottomland forest and
lowlands adjacent to the Wateree and Congaree rivers in the eastern and
southern portions of the Planning Area. This area is part of the South-
eastern Floodplains and Low Terraces ecoregion and corresponds closely
with the floodplain. Forested wetlands, oxbow lakes, streams and creeks
crisscross this unique natural resource.
Within this Corridor is the Congaree National Park. The Park encompasses
26,020 acres of wetlands and forest between Bluff Road and the Congaree
River. It contains the largest contiguous area of old-growth bottomland
hardwood forest remaining in the United States. Most of the park is a
federally designated wilderness area and offers visitors hiking, canoeing,
and fishing opportunities.
These areas provide a refuge for a variety of terrestrial and aquatic spe-
cies which also benefit from relatively intact forests and riparian corridors
along major creeks draining farmland and forested habitats upstream. In
addition, the area is home to a number of commercial timbering opera-
tions and hunt clubs.
Cowasee CorrIdor reCommendatIons*

28 : final report lower richland
Source: National Park Service
A PLAn FOR LOwER RIChLAnD
The Cowasee Corridor is home to many endanged and threatened species, such as the spotted turtle.
The Congaree National Park provides an extensive network of walking and hiking trails.
Source: National Park Service
Lower Richland has the
opportunity to develop as an
outdoor recreation destination.
The amenities and facilities
offered in the Cowasee
Conservation Corridor and the
Congaree National Park are
unparalleled. From the canoe
trails along the Congaree
River and Cedar Creek to the
hunt clubs near the Wateree,
outdoor enthusiasts, naturalists,
environmentalists and the like
can take advantage of the area’s
natural assets. In addition,
the Congaree National Park
provides a family-friendly, low-
cost vacation destination. The
Park offers guided nature hikes,
campgrounds, an engaging
interpretative center and a
variety of other programs and
activities for visitors.
Conservation in the Cowasee
Corridor not only provides for
intact habitats, clean water
and scenic landscapes but
also has the potential to boost
the region’s economy through
recreation tourism.
Residential development in the
Cowasee Corridor should be
limited to very low densities.
Any new development should be
consistent with the existing low
density development pattern that
exists in the area today.

final report lower richland : 29
• Protect prime farmland
soils and soils of
statewide importance.
• Preserve existing
farmlands for active
agriculture use.
• Promote farming as a
viable occupation and
way of life for current
and future generations.
• Host a Lower Richland
Heritage Farm Tour
Day.
• Expand the market for
locally-grown, locally-
produced goods.
• Consider creating a
Lower Richland brand
for locally-grown,
locally-produced
goods.
• Partner with City
Roots to promote
a local Community
Supported Agriculture
Program (CSA) in area
communities.
Exhibit 9: Agricultural Area highlighted in blue.See Appendix A for map enlargement.
Agricultural AreaplannIng area
Lower Richland developed as an agrarian community. From cotton to
timber, farming and forestry have long been a mainstay of the Lower
Richland economy. Today that tradition and way of life is slowly eroding
due to a number of factors including the conversion of land to residential
development, the lack of a cash crop such as cotton, and the aging popu-
lation of farmers.
There are numerous benefits to the land remaining in active agriculture
use. There is growing evidence that farming in Richland County will ex-
perience a renaissance as the local food economy grows. Shifts in con-
sumer trends suggest greater demand for locally-grown, locally-produced
products. From the military’s perspective, farms are a compatible use to
military training operations. In addition, as municipal budgets are further
strained, the cost of providing services should be considered in land use
decision making, “property in agricultural use is found to be a net con-
tributor to local budgets,” while the residential sector costs jurisdictions
more in services than it brings in from tax revenue. In addition, preserving
active farming operations provides an important link to the history and cul-
ture of Lower Richland. Many of the families in Lower Richland have been
farming their lands for over a century. For these families, farming is not
just an occupation, but a way of life. Protecting Lower Richland’s farming
community is key to maintaining the rural character valued by residents.
agrICultural area reCommendatIons*
*partial list
30 : final report lower richland
• Provide more transit
options in Lower
Richland.
• Provide safe bicycle
and pedestrian
connections.
• Improve intersections
along key east-west
corridors.
• Evaluate and prioritize
paving of county-
maintained roads.
• Improve driver’s
awareness.
• Improve safety at rail
crossings.
transportatIon reCommendatIons*
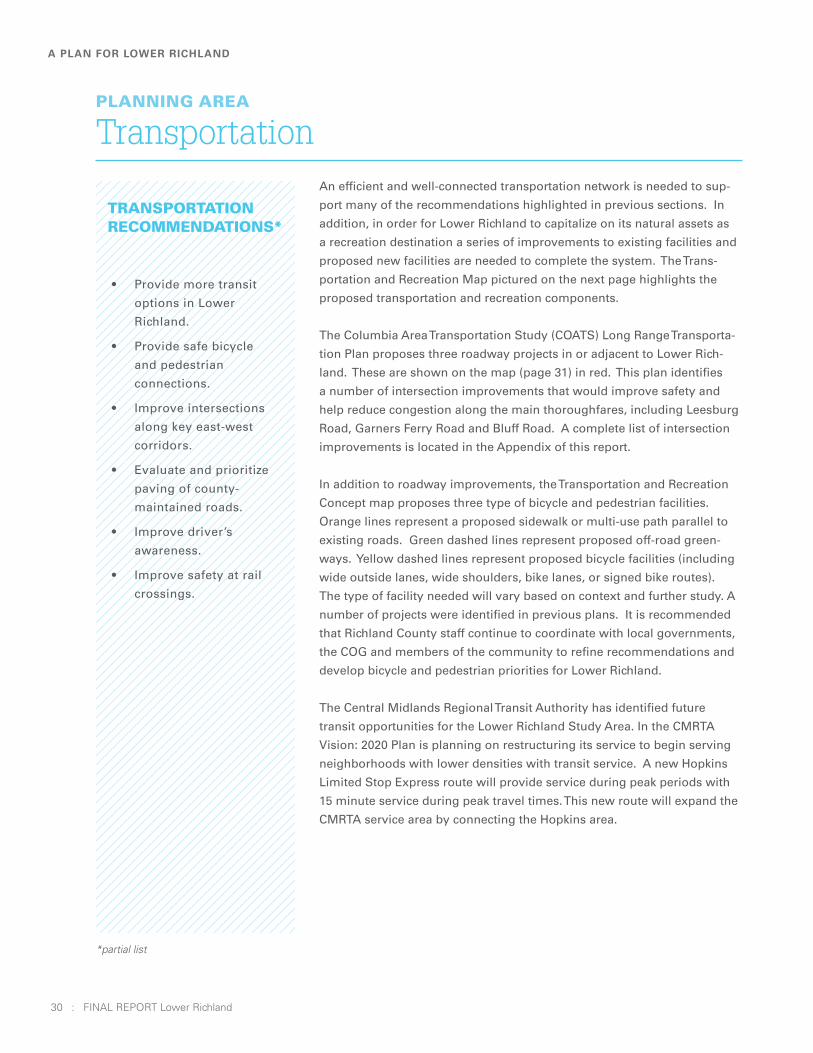
An efficient and well-connected transportation network is needed to sup-
port many of the recommendations highlighted in previous sections. In
addition, in order for Lower Richland to capitalize on its natural assets as
a recreation destination a series of improvements to existing facilities and
proposed new facilities are needed to complete the system. The Trans-
portation and Recreation Map pictured on the next page highlights the
proposed transportation and recreation components.
The Columbia Area Transportation Study (COATS) Long Range Transporta-
tion Plan proposes three roadway projects in or adjacent to Lower Rich-
land. These are shown on the map (page 31) in red. This plan identifies
a number of intersection improvements that would improve safety and
help reduce congestion along the main thoroughfares, including Leesburg
Road, Garners Ferry Road and Bluff Road. A complete list of intersection
improvements is located in the Appendix of this report.
In addition to roadway improvements, the Transportation and Recreation
Concept map proposes three type of bicycle and pedestrian facilities.
Orange lines represent a proposed sidewalk or multi-use path parallel to
existing roads. Green dashed lines represent proposed off-road green-
ways. Yellow dashed lines represent proposed bicycle facilities (including
wide outside lanes, wide shoulders, bike lanes, or signed bike routes).
The type of facility needed will vary based on context and further study. A
number of projects were identified in previous plans. It is recommended
that Richland County staff continue to coordinate with local governments,
the COG and members of the community to refine recommendations and
develop bicycle and pedestrian priorities for Lower Richland.
The Central Midlands Regional Transit Authority has identified future
transit opportunities for the Lower Richland Study Area. In the CMRTA
Vision: 2020 Plan is planning on restructuring its service to begin serving
neighborhoods with lower densities with transit service. A new Hopkins
Limited Stop Express route will provide service during peak periods with
15 minute service during peak travel times. This new route will expand the
CMRTA service area by connecting the Hopkins area.
TransportationplannIng area
*partial list
A PLAn FOR LOwER RIChLAnD

final report lower richland : 31
26
26
26
77
77
77
20
20
20
277
277
Richland Co.
Richland Co.
Lexington Co.
Lexington Co.
Richland Co.
Richland Co.
Kershaw Co.
Kershaw Co.
C a l h o u nC a l h o u nC o u n t yC o u n t y
K e r s h a wK e r s h a wC o u n t yC o u n t y
L e x i n g t o nL e x i n g t o nC o u n t yC o u n t y
R i c h l a n dR i c h l a n dC o u n t yC o u n t y
S u m t e rS u m t e rC o u n t yC o u n t y
SPEARS
CR
EEK CHURCH RD
HARM
ON
RD
OLD SANDY RUN ROAD
CHALK ST
OLD
PERCIVAL RD
PURPLE M
ARTIN
DR
BLANEY
RD
HAR
D
SCRABBLE RD
RE
ESE
RD
KENNERLY ROAD
DECKER BLVD
WHITE
POND RD
FAIRMO
NT RD
SHARPE RD
TRENHOLM RD
HAR
D SC
RAB
BLE
RD
HIG
HBE
E R
D
CAUGHMAN RD
ME
ETI
NG
HO
USE
RD
GERVAIS ST
CLARKSON RD
ALPINE RD
HAY
STA
CK
RD
PARKLAN
E R
D
STEVEN CAMPBELL RD
N BRICKYARD RD
TATHOM RD
DEER RIDG
E D
R
SAVANY HUNT CREEK ROAD
BASIL RD
RABON RD
CRANE CHUR
CH
RD
DO
E DR
CALHO
UN R
OAD
PADGETT RD
CABIN CREEK RD
PREFE
RENCE ROAD
KILLIAN RD
MAR
TIN
LUTH
ER KI
NG
BLVD
MARTHAN RD
FORK CHURCH RD
HO
US
E R
D
BITT
ERN
UT
DR
SPARKLEBERRY LN
SAMM
IE RD
BRAZELL RD
LON
GTO
WN
RD
BYNUM RD
TULIP LANE
CONGAREE CHURCH
RD
CALDON ROAD
PINEVIE
W R
D
OTT
SISTE
RS
ROAD
WATSON ST
MIN
ERVAVILLE R
D
FALL
BRAN
CH R
OAD
ADAMS ROAD
N PINES RD
RID
GE
RD
SLOAN RD
BRANHAM BRANCH ROAD
WE
STO
N RD
S TRAWBER R Y
LN
FAWN DR OLD LEESBURG RD
RO
SS
RD
GUY
RD
BUCK DR
REYNOLDS RD
SUGAR MAPLE
ROAD
RAILSID E
RD
SUNNY PLAIN ROAD
ATLAS RD
VALLEY RIDGE ROAD
WYLIE RD
KAIG
LER
RO
AD
TIDW
ELL LANE
POULTRY LN
CRIDER PO
ND RO
AD
OGLE SBY DR
MO
TLEY R
D
MO
NTG
OM
ERY
LN SOUTHWIND RD
HO
RSES
NE
CK
RO
AD
SWYGERT RD
HIGHWAY
CHU
RC
H RD
SONNTAG
DR
MOUNT VA
LLEY
RD
WORTHINGTON DR
N SP
RINGS
RD
RH
AME
RD
HANES MILL ROAD
KENNEDY RD
HO
RSE
S N
ECK
RD
SCREAMING EAGLE
RD
PR
EVA
TTE
ROAD
LAN
G S
YN
E R
OA
D
HIC
KO
RY
HIL
L LN
BIG
BE
AVER
CREE
K ROAD
EASTOVER
RD
HOLLIFIELD RD
CATALIN
A
BLVD
SUMTERS LANDING RD
POR
TER
CROSS RD
BEAVER CREEK RD
GARDNE
RS F
ARM
ROAD
PECAN GROVE LANE
ZEIGLER RD S
KELLY MILL
RDLEE RD
ROBERTS RD
FORT MOTTE ROAD
KOON RD
OLD TWO NOTCH RD
L ARRY
JEFF
ERS
RD
HEATH PON D RD
FRO
NTA
GE
RO
AD
INABIN
ET
ROAD
PETER SEYM
OR
E RD
LORENZO
DAVI
S R
D
BRO
AD R
IVER
RD
POW
ELL
RD
DR
Y BRAN
CH RD
GLOWW
ORM RD
GREY FOX ROAD
GREAT
CIRCLE DR
COPP
ERH
EAD ROAD
MALLET HILL RD
HALLWOOD RD
OLD CONGAREE RU
N R
D
BALDWIN RD
NE SHADY
GRO
VE LN
STABLER FARM ROAD
KOON STORE RD
HICKORY HILL RD
DRY BRANCH RD
NEW BETHANY
ROAD
TOW
ER
RD
GRIFFINS CREEK
RD
DOODLE HILL ROAD
WHITING WAY
LONGWOOD RD
DEARBORN ROAD
OLD BLUFF RD
N TR
ENH
OLM
RD
OLD BELLVILLE ROAD
OLD HOPKINS
RD
CLEMSON
RD
OLD
CO
NG
AREE RUN
PINEY BRANCH
RD
HORRELL HILL RD
HO
RRELL
HILL R
D
FLO
RA
DR
S BE
LTLI
NE
BLVD
PINE
NEEDLE
CIR
TRUBLUE ROAD
S CE
DAR
CREE
K RD
S C
EDA
R C
RE
EK
RD
TROTT
ER R
D
LOW
ER RI
CHL
AND
BLV
D
MT
ELON
CHURC
H RD
MT ELON CHURCH
RD
WILLIE WILS
ON
RD
STAB
LER
HIL
L
ROAD
FULMER RDFU
LMER
RD
SANDY OAKS RD
BLUE
JOH
NSO
N R
D
BOO
KMAN
RD
BAS
IL R
OAD
VALLEY
RIDGE ROAD
RED BANK RD
JACOBS MILL POND RD
CH
AIN G
ANG R
D
RABBIT RUN
GAY
RD
IDA LN
APRICOT C
T
BELLING
ER LANE
GOODWIN RD
DAV
E W
HIT
E RD
PIN
CU
SH
ION
RD
NEAL
RD
OLD
STATE RD
KING
VILLE
RD
CLA
REM
ONT
RD
ULM
ER
RD
OLD MCGRAW RD
R L
CO
WA
RD
RD
JOE COLLINS RD
CATE
RD
LON
GST
REE
T RO
AD
SAI
NT
MAR
KS R
D
GOODWIN
WAY
JOR
DAN
RD
ACC
ESS R
OAD
HUMMINGBIRD RO
AD
LIVI
NG
STO
N R
OA
D
TOMS CREEK RD
BAS
EH
ILL RD
GRIFFINS CREEK RD
WANNARIDGE
RO
AD
BLACKBERRY RD
OLD SWAMP ROAD
OLD
SWAM
P R
OA
D
ARN
OLD
RD
HAZ
ELW
OO
D R
D
CO
NG
RES
S R
D
LOW
ER RI
CH
LAN
D B
LVD
FIRETH
ORN RO
AD
CLEMSON RD
AIR BASE RD
CROSSING CREEK
RD
LOUIS LECON
TE R
D
COMMUNITY POND RD
CALVARY CHURCH RD
PIN
EY
BR
AN
CH
RD
GOVERNOR
HEYW
ARD RD
TTWWOO
NNOOTTCC
HH RRDD
TTWWOO NNOOTTCCHH
RRDD
NN BB
EELLTTLLIINNEE BBLLVVDD
HIG
HW
AY 21H
IGH
WAY 21
PERCIVAL RD
PERCIVAL RD
PERCIVAL RD
PERCIVAL RD
PERCIVAL RD
PERCIVAL RD
PERCIVAL RD
PERCIVAL RD
BBLLOOSSSSOOMM SSTT
NN MMAAIINN SSTT
FFOORREESSTT DDRR
FFOORREESSTT DDRR
TTWWOO NNOOTTCCHH
RRDD
TTWWOO NNOOTTCCHH
RRDD
TTWWOO NNOOTTCCHH
RRDD
GGAARRNNEERRSS FFEERRRRYY RRDD
GGAARRNNEERRSS FFEERRRRYY RRDD
GGAARRNNEERRSS FFEERRRRYY RRDD
BLUFF RD
BLUFF RD
BLUFF RD
BLUFF RD
BBLLUUFFFF
RRDD
BLUFF RDBLUFF RD
BLUFF RDBLUFF RD
BLUFF RDBLUFF RD
RROOSSEEWWOOOODD DDRR
WW BBEELLTTLLIINNEE BBLLVVDD
WWIILL
SSOO
NN BB
LLVVDD
WWIILLSSOONN BBLLVVDD
WWIILLSS
OONN BB
LLVVDD
GGAARRNNEERRSS FFEERRRRYY RRDD
LLEEEESSBBUURRGG RRDD
LLEEEESSBBUURRGG RRDD
LEESBURG RDLEESBURG RD
LEESBURG RDLEESBURG RD
LEESBURG RDLEESBURG RD
DEVINE STDEVINE ST
TAYLOR STTAYLOR ST
WWIINN
NNSSBBOO
RROO
RRDD
CCOONNGGAARREEEE RRDD
CONGAREE RD
CONGAREE RD
CCOONN
GGAA
RREE
EE RR
DD
HIG
HW
AY 21H
IGH
WAY 21
MMIILLLLWWOOOODD AAVVEE
SSHHOOPP RRDD
OOLLDD
SSTTAATTEE RROOAADD
OOLLDD SSTTAATTEE
RROOAADD
OOLLDD SSTTAATTEE
RROOAADD
OOLLDD
SSTTAATTEE RROO
AADD
OOLLDD SSTTAATTEE
RROOAADD
HHIIGGHHWWAAYY 11 SS
MMCC
CCOO
RRDD
SS FFEE
RRRR
YY RR
DD
M MC C
C CO O
R RD D
S S F FE ER R
R RY Y
R RD D
M MC C
C CO O
R RD D
S S F FE E
R RR R
Y Y R R
D D
MMCC
CCOO
RRDD
SS FFEERR
RRYY
RRDD
MMCC
CCOO
RRDD
SS FFEERR
RRYY
RRDD
MMCC
CCOO
RRDD
SS FF EE
RRRR
YY RR
DD
CO
LUM
BIA R
OA
DC
OLU
MB
IA RO
AD
COLUMBIA ROAD
COLUMBIA ROAD
FFAARRRR
OOWW
RRDD
FFAARRRROO
WW RR
DD
OOLLDD EEAASSTTOOVVEERR
RRDD
OOLLDD
EEAASSTTOOVVEERR
RRDD
CCOOLLOONNEELL TTHHOOMMSSOONN HHWWYY
CCOO
LLOONN
EELL
TTHHOO
MMSS
OONN
HHWW
YY
BULL ST
BULL ST
BLUFF RDBLUFF RD
BLUFF RD
BLUFF RD
FFOORRTT JJAACCKKSSOONN RRDD
FFOORRTT
JJAACCKKSSOONN
RRDD
CCEENNTTEERR HHIILLLL
RROOAADD
SSHHOOPP RRDD EEXX
SSAAIINNTT MMAATTTTHHEEWWSS RRDD
FFOORRTT
MMOOTTTTEE
RROOAADD
FFOORRTT MMOOTTTTEE
RROOAADD
BBOOYYKKIINN
RRDD
BBOO
YYKKIINN
RRDD
MMCCCCOORRDDSS FFEERRRRYY
RROOAADD
PINEVIEW RD
PINEVIEW RD
NN KK
IINNGG
SS HHWW
YY
VVAANNBB
OOKKLL
EENN RRDD
VANB
OKL
EN R
D
VANB
OKL
EN R
D
OOLLDD EEAASSTTOOVVEERR RR DD
HWY 76/378HWY 76/378ROBERT E GRAHAM FRWYROBERT E GRAHAM FRWY
GERVAIS ST
GERVAIS ST
FFAAIIRR
FFIIEELL
DD RR
DD FFAARRRROOWW
RRDD
FFAAIIRRFFIIEEL LD D R R
D D
BLUFF RD
BLUFF RD
CO
LUM
BIA R
OA
DC
OLU
MB
IA RO
AD
FFAA
RRRROOWW
RRDD
FFAARR
RROO
WW RRDD
Ft JacksonFt Jackson
McEntire Air Guard StaMcEntire Air Guard Sta
CongareeCongareeNationalNational
ParkPark
Lower RichlandHigh School
Horrell HillElementary School
HopkinsMiddle School
HopkinsElementary School
Southeast Middle School
GadsdenElementary School
Webber ElementarySchool
GARNERSGARNERSFERRY SPORTSFERRY SPORTS
COMPLEXCOMPLEXHORRELHORREL
HILL PARKHILL PARK
HOPKINSHOPKINSPARKPARK
EASTOVEREASTOVERPARKPARK
CROSSROADSCROSSROADSPARKPARK
CONGAREECONGAREENATIONALNATIONAL
PARKPARK
EastoverLibrary
CCSSXX
CCSSXX
CCSSXX
RRaaiillrrooaadd
NNoorrffoollkk SSoouutthheerrnn
NNoorrffoollkk SSoouutthheerrnn
NNoorrffoollkk SSoouutthheerrnn
NNoorrffoollkk SSoouutthheerrnn
NNoorrffoollkk SSoouutthheerrnn
NNoorrffoollkk SSoouutthheerrnn
RRaaiillrrooaadd
NNoo rr
ff ooll kk
SS oouu tt
hh eerrnn
NNoorr ff oo
llkk SSoouutthheerrnn
NNoorrffoollkk SSoouutthheerrnnNNoo
rrffoollkk
SSoo uu
tt hhee rr
nn
CCSSXX
NNoorrffoollkk SSoouutthheerrnn
NNoorrffoollkk SSoouutthheerrnn
CCSSXX
CCSSXX
CCSSXX
CCSSXX
CCSSXX
CCSSXX
CCSSXX
CCSSXX
RRaaiillrrooaadd
CCSSXX
NNoo rr
ff ooll kk
SSoo uu
tt hhee rr
nn
NNoorrffool lkk
SSoouutthheerrnn
CCSSXX
CCSSXX
CCSSXX
CCSSXX
CCSSXX
NNoorrffoollkk SSoouutthheerrnn
NNoorr ffoo
ll kk SSoouutthheerrnn
NNoorrffoollkk SSoouutthheerrnn
CCSSXX
CCSSXX
RRaa iill rr
ooaadd
CCSSXX
CCSSXX
UUNN
KKNN
OOWW
NN
RRaaiillrrooaadd
NNoorrffoollkk SSoouutthheerrnn
UUNN
KKNNOO
WWNN
CCSSXX
NNoorrffoollkk SSoouutthheerrnn
KensingtonPlantation House
Kingville/Marker
Mt. NeboBaptist Church
Zion ProtestantEpiscopal Church
St. Thomas ProtestantEpiscopal Church
Good HopeBaptist Church
Laurelwood
Antioch AMEZion Church
J.A. ByrdMercantile Store Eastover Farms
and Merchant Bank
Eastover/Marker
Old RichlandPresbyterian Church
Congaree Baptist Church
Red HillChurch
CongareeNational Park
Mount MoriahBaptist Church
HenryHouse
Henry Clarkson House(aka Henry Floyd House)
MeetingHouse
Zion BenevolentBaptist Church
Elm Savannah(Hopkins)
St. John'sEpiscopal Church
Grovewood
Live Oak (akaWoodville)
MagnoliaPlantation
BeulahCemetery
New Light BeulahBaptist Church
Keziah GoodwynHopkins Brevard House
Morrell'sMillHorrell
Hill
LykeslandPost Office
Hopkins FamilyCemetery Old Hopkins
School
HopkinsPresbyterian Church Minervaville
MarkerFelder House
in Hopkins
ClaytorHouse
Hopkins Turnout/OldPost Office Site
HarrietBarber House
GovernmentCemetery
St. JohnBaptist Church Ephraim DeVeaux-Neal
Property
GoodwynCemetery
St. PhillipSchool
KensingtonMansion
The GoodwillPlantation
Siloam School
Horrell Hill
St. PhillipA.M.E. Church
GadsdenRichland
Presbyterian Church
0 42MilesTRANSPORTATION & RECREATION CONCEPT
Transportation ImprovementsMPO Road Projects
Proposed Intersection Improvements
Bicycle, Pedestrian and Recreational FacilitiesProposed On Road Bike FacilityProposed Off Road GreenwayProposed Sidewalk or Multi-use PathExisting Palmetto TrailExisting Canoe TrailCampgroundVisitor CenterExisting Canoe AccessCongaree National Park TrailsCongaree National Park Boardwalk
Transportation FeaturesRailroadRoad Network
Context Lower Richland Planning AreaSC CountiesMilitary InstallationCongaree National ParkCounty Park
Points Of InterestHistorical MarkerCultural ResourceHistorical Landmark
Disclaimer: This map was created with the best available data, however, it is provided "as is" without warranty of any representation of accuracy, timeliness, reliability or completeness. This map does not represent a legal survey of the land and is for graphical purposes only. Use of this Data for any purpose should be with acknowlegement of the limitations of the Data, including the fact that the Data is dynamic and is in a constant state of maintenance.
Date: 4/23/2013 | LDI # 1011133Data Source: Richland County, USGS, Esri
LOWER RICHLAND PLANNING AREARICHLAND COUNTY, SC
32 : final report lower richland
A PLAn FOR LOwER RIChLAnD
General Recommendationslower rIChland
The following set of recommendations support the goal of the draft land use concept for Lower
Richland. An implementation matrix detailing the recommendations, entities responsible for
implementation, potential costs and supporting funding sources in located in Appendix D of
this document.
governanCe• Examine existing zoning ordinances to determine which districts
correspond to each of the four types of residential land use categories
shown on the Future Land Use Map.
land use• Adopt growth management policies that are consistent with the
findings of the Strategic Community Master Plan for Lower Richland.
• Incorporate the recommendations from the SERN Plan into the Lower
Richland Strategic Community Master Plan.
• Keep residential density very low in areas proximate to military
bases to reduce nuisance conflicts between residents and military
operations.
• Partner with the Conservation Commission, Richland Soil & Water
Conservation District and the Midlands Area Joint Installation
Consortium (MAJIC) to identify and prioritize lands critical to both
mission operability and resource conservation.
• Keep residential density very low where critical natural areas or
agricultural operations exist.

final report lower richland : 33
housIng• Promote a variety of housing options affordable to
a diversity of incomes.
• Ensure housing is safe, energy-efficient and
accessible.
• Offer pre-designed plans to builders for housing
that can withstand noise impact from military
operations.
eConomIC development• Develop a tourism strategy for Lower Richland.
• Create a “Live Well” website for Lower Richland.
• Develop economic development initiatives to
promote and foster agriculture production and
increased food processing and related activities.
• Develop Economic Development initiatives to
promote and foster small and medium sized
businesses focused on marketing to and serving
the military operations in the Midlands.
• Develop Economic Development initiatives to
promote and foster industrial development in
the Shop Road extension area, the Bluff Road/
Pinewood area and the areas near and adjacent to
the paper mill facility
utIlItIes• Develop a new water/sewer Master Plan to
address land use concepts recommended in
the Strategic Community Master Plan for Lower
Richland County.
• Evaluate the need for additional services in the
area. Determine if existing capacity is adequate,
plan for expansion only where projected demand
exceeds supply.
• Establish a joint utility task force with
representatives from the County, Town of Eastover,
City of Columbia and Hopkins Water System to
understand the potential need for future water and
sewer service in Lower Richland.
• Partner with the Town of Eastover to understand
and coordinate any water/sewer extensions in the
areas immediately surrounding the Town.
• Ensure that any new private systems developed
meet established standards.
envIronmental & natural resourCes• Identify and protect critical natural assets.
• Create a Lower Richland Conservation Taskforce
with key partners from the Conservation
Commission, Richland Soil & Water Conservation
District , Military Installations, Congaree National
Park and community stakeholders.
• Partner with the Congaree National Park to educate
residents and visitors on the value of this unique
ecosystem.
• Protect prime farmland soils and soils of statewide
importance.
• Preserve existing farmlands for active agriculture
use.
hIstorIC & Cultural resourCes• Develop a tourism strategy for Lower Richland.
• Identify and protect historic and cultural assets.
• Establish a Lower Richland Heritage Corridor
visitor’s center.
• Develop awareness of Lower Richland’s historic
and cultural resources both locally and regionally.

34 : FINAL REPORT Lower Richland
FINAL REPORT Lower Richland : 35
Appendix A: PLANNING AREA MAPS
lower r ich land countyRICHLAND COUNT Y STRATEGIC COMMUNIT Y MASTER PLAN

FINAL REPORT Lower Richland :: Appendix A : 1
J o r d a n sP o n d
J o r d a n sP o n d
T w i nL a k e s
O l dH e i s e s
P o n d
H a r m o n sP o n d
G w i n n sP o n d
R e v e r e sP o n d
S u nV i e wL a k e
U p p e rL e g i o n
L a k e
M o r r e l l sP o n d
L a k eT r o t w o o d
Cabin Branch
Mil l Creek
Re
ede r P
oint B
ranch
Cedar Creek
Dry Bra nch
Horsepe n Branch
W ildca
t Cre
ek
Goos
e Br
anch
Myers Creek
GGAARRNNEERRSS FFEERRRRYY RRDD
CCOONNGGAARREEEE RRDD
BLUFF RD
BLUFF RD
PPIINNEEVVIIEEWW RRDD
LLEEEESSBBUURRGG RRDD
LEESBURG RDLEESBURG RD
Ft JacksonFt Jackson
GARNERSGARNERSFERRY SPORTSFERRY SPORTS
COMPLEXCOMPLEXHORRELHORREL
HILL PARKHILL PARK
0 0.850.425Miles
LOWER RICHLAND SUBURBAN TRANSITION AREA FUTURE LAND USE
Disclaimer: This map was created with the best available data, however, it is provided "as is" without warranty of any representation of accuracy, timeliness, reliability or completeness. This map does not represent a legal survey of the land and is for graphical purposes only. Use of this Data for any purpose should be with acknowlegement of the limitations of the Data, including the fact that the Data is dynamic and is in a constant state of maintenance.
Date: 4/3/2013 | LDI # 1011133Data Source: Richland County, USGS, Esri RICHLAND COUNTY, SC
1 inch = 1,159 feet
Activity CentersExisting Community Node
Rural Center
Rural Crossroads
Future Land Use ClassTransition Area
Rural Residential
Agriculture
Cowassee Corridor
Military Installation
Military Compatibility Area
Boundary FeaturesLower Richland Planning Area
Municipalities
SC Counties
Floodplain
Conservation Easements
Congaree National Park
County Park
Transportation NetworkInterstates
Primary & Secondary Roads
Rail
Appendix A: PLANNING AREA MAPS
Map 1: Suburban Transition Area highlighted in red.

FINAL REPORT Lower Richland :: Appendix A : 2
Appendix A: PLANNING AREA MAPS
Map 2: Rural Residential Areas highlighted in yellow.
FINAL REPORT Lower Richland :: Appendix A : 3
Appendix A: PLANNING AREA MAPS
Map 3: Military Zones
FINAL REPORT Lower Richland :: Appendix A : 4
Appendix A: PLANNING AREA MAPS
Map 4: Nodes of Activity

FINAL REPORT Lower Richland :: Appendix A : 5
Appendix A: PLANNING AREA MAPS
Map 5: Cowasee Corridor highlighted in light green.

FINAL REPORT Lower Richland :: Appendix A : 6
Appendix A: PLANNING AREA MAPS
Map 6: Agricultural Area highlighted in blue.

36 : FINAL REPORT Lower Richland

FINAL REPORT Lower Richland : 37
Appendix B: SNAPSHOT OF LOWER RICHLAND
lower r ich land countyRICHLAND COUNT Y STRATEGIC COMMUNIT Y MASTER PLAN

38 : FINAL REPORT Lower Richland

JANUARY 2013
Lower Richland Community Profile
RICHLAND COUNTY, SOUTH CAROLINA

Community Profile LOWER RICHLAND COUNTY 2

Community Profile LOWER RICHLAND COUNTY 3
TABLE OF CONTENTS
Introduction ______________________________________________________________________________ 5
Land Use ________________________________________________________________________________ 17
Transportation ___________________________________________________________________________ 23
Community Facilities _____________________________________________________________________ 34
Utilities __________________________________________________________________________________ 39
Natural Resources ________________________________________________________________________ 40
Historic and Cultural Resources ___________________________________________________________ 52

Community Profile LOWER RICHLAND COUNTY 4
LIST OF TABLES, FIGURES & MAPS Table 1: Population Projections ..................................................................................................................... 7 Table 2: Ethnic Composition .......................................................................................................................... 7 Table 3: Population Density ............................................................................................................................ 7 Table 4: Median Household Income .............................................................................................................. 8 Table 5: Income Distribution .......................................................................................................................... 8 Table 6: Business Establishments by Type .................................................................................................. 9 Table 7: Employment by Industry .............................................................................................................. 10 Table 8: Residential Home Values .............................................................................................................. 11 Table 9: Consensus Residential Growth Scenario ................................................................................... 12 Table 10: Higher Growth Residential Scenario ........................................................................................ 13 Table 11: Potential Annual Retail Spending 2030 .................................................................................. 14 Table 12: Existing Land Use (2012) ........................................................................................................... 17 Map 1: Existing Land Use (2012) ............................................................................................................... 18 Map 2: Future Land Use (from 2009 Comp Plan) ................................................................................... 20 Map 3: Richland County Zoning ................................................................................................................ 21 Figure 1: Study Area Traffic Volume Flow (Year 2005) ......................................................................... 24 Figure 2: Study Area Traffic Volume Flow (Year 2035) ......................................................................... 25 Table 13: Major Roadway Traffic Volumes .............................................................................................. 25 Figure 3: LOS Map - Base Year 2005 .......................................................................................................... 26 Figure 4: LOS Map - Base Year 2035 .......................................................................................................... 27 Table 14: Volume-to-Capacity Ratios by Level of Service ................................................................... 27 Table 15: Vehicle-Miles and Vehicle-Hours of Travel (2005) .............................................................. 28 Table 16: Vehicle-Miles and Vehicle-Hours of Travel (2035) .............................................................. 28 Table 17: CMRTA Routes by Day of Week ................................................................................................ 29 Table 18: Route Travel Times and Frequency within Study Area ....................................................... 30 Table 19: 2010 Bike and Pedestrian Pathways Plan - Recommended Lower Richland Facilities . 31 Table 20: Early Action Project ..................................................................................................................... 31 Table 21: Prioritized Roadway Widening Projects .................................................................................. 32 Table 22: Prioritized List of New Location Projects ............................................................................... 32 Table 23: Prioritized Intersection Improvements ................................................................................... 32 Table 24: Community Facilities .................................................................................................................. 35 Map 4: Park and Community Facilities .................................................................................................... 36 Map 5: Land Cover 2006 (Source: NLCD) ................................................................................................ 41 Figure 5: Land Cover 2006 (Source: NLCD) ............................................................................................ 42 Map 6: EPA Level IV Ecoregions ................................................................................................................. 43 Map 7: Percent Slope (Source: USGS NED) .............................................................................................. 45 Map 8: Hydrology .......................................................................................................................................... 46 Map 9: Hydric Soils ....................................................................................................................................... 47 Table 25: Prime Farmland Soil Classification (Source: NRCS) ............................................................ 48 Map 10: Prime Farmland Designations (Source: NRCS) ....................................................................... 49 Table 26: State or Federally Listed Species ............................................................................................. 50 Map 11: Historic and Cultural Resources ................................................................................................ 55

Community Profile LOWER RICHLAND COUNTY 5
INTRODUCTION
The Strategic Community Master Plan for Lower Richland County brings together residents, elected officials, county staff and civic groups in a conversation around how best to ensure that Lower Richland remains a great place to live, work and play.
This plan is an effort coordinated by the Richland County Neighborhood Improvement Program (NIP) to fund master plans and improvement projects in Richland County. The vision of the Richland County Neighborhood Improvement Program is a healthy and happy community of high performing schools, quality infrastructure, parks and trails, and viable thriving neighborhoods and business corridors. Sustaining this quality of life requires coordination between many facets of the community: neighborhood organizations, businesses, schools, local government, etc. Thus NIP’s missions is to coordinate and empower citizens with the resources necessary to achieve and sustain healthy and happy neighborhoods.
PLANNING AREA BOUNDARY
Richland County is located on the eastern edge of the Piedmont Plateau and the Atlantic Coastal Plain. The Lower Richland Study Area is located in the southeast portion of Richland County. The Study Area consists of 326 square miles. It begins southeast of Columbia, SC and is bounded by Leesburg Road, US 601 and the county line to the north, the Wateree River to the east, and the Congaree River on the south.
In 2005, the Southeast Richland Neighborhood Master Plan was completed. The plan’s boundary is generally defined as the one-mile radius from the intersection of Lower Richland Boulevard and Garner’s Ferry Road. While this plan will acknowledge the work and recommendations made in that effort, the Southeast Richland study area is not included in this study.
PURPOSE OF INVENTORY AND ASSESSMENT
The primary purpose of this memo is to detail an inventory and assessment of the characteristics of Lower Richland to gain an understanding of the potential impacts of various factors on future development and redevelopment. By documenting the inventory and assessment in the Existing Conditions report, those involved in the process can identify the potential issues and opportunities, which will be the basis for the Strategic Community Master Plan for Lower Richland County.
Information in this report was gathered through review of plans, reports, policies and regulations. Mapping and analysis was performed to further the team’s understanding of existing conditions. A complete set of maps is found at the conclusion of this memo. Elements examined are further described herein and include demographic, housing and economic conditions, land use, urban design, transportation, environment and natural resources, parks and recreation, cultural and historic resources, community facilities, utilities and stormwater management.

Community Profile LOWER RICHLAND COUNTY 6
DATA COLLECTION AND RESEARCH In addition to data collected for mapping purposes, data was also collected to gain a better understanding of the conditions reflected in the data depicted on maps. Much of this additional data was gathered through a review of relevant documents, interviews of key stakeholders, a study area tour, community meetings, public feedback on the website, and meetings with planning staff and elected officials.
DOCUMENTS REVIEWED In the first phase of the planning effort, various documents were gathered from a variety of sources. Plans, reports, policies and regulations were reviewed to further our understanding of existing conditions. Other documents related to prior or ongoing planning efforts were provided and those documents also were reviewed for pertinent information. The following were among those reviewed prior to the development of the plan:
Richland County Comprehensive Plan (2009) Southeast Richland Neighborhood Master Plan (2005) Richland County Land Development Code Soil Survey of Richland County, South Carolina Richland County Stormwater Best Management Practices Manual Central Midlands Council of Governments Bike and Pedestrian Pathways Plan Columbia Area Transportation Study 2035 Long Range Transportation Plan Fort Jackson McEntire Joint Land Use Study Richland County Soil and Water District Newsletters U.S. Geological Survey Gap Analysis of South Carolina (2010) South Carolina Department of Natural Resources Comprehensive Wildlife Conservation
Strategy African Americans of Lower Richland County (2010) Prized Pieces of Land: The Impact of Reconstruction on African-American Land
Ownership in Lower Richland County, South Carolina Cowasee Basin, The Green Heart of South Carolina Lower Richland Hertiage Corridor
STUDY AREA TOUR The consultant team and planning department staff performed a study area tour. The purpose was to make observations and gather photos throughout the study area. Also, data gathered and information shown on preliminary mapping was verified. Observations made were intended to document the established character of the built environment, including the development pattern and scale of existing buildings. COMMUNITY PARTICIPATION In order to develop a plan that represented the values and viewpoints of the Lower Richland community a number of community engagement opportunities were held over the course of the project including stakeholder interviews and multiple community open houses. In addition, a project website was developed to provide an additional project resource for community members to provide feedback and access project information.

Community Profile LOWER RICHLAND COUNTY 7
ECONOMIC & DEMOGRAPHIC CONDITIONS
Lower Richland is a large area covering almost 327 square miles. It is a predominately rural area with a mix of uses including agriculture, residential, commercial, industrial and military. In 2010, the population of the study area was 21,830 residents. The area has experienced modest population growth during the last decade growing at a pace slightly below that of Richland County as a whole and below that of the State. As seen in Table 1, Lower Richland is projected to continue to grow but at rates below that of the County and State averages. Table 1: Population Projections
2010 2015 2020 2030
Lower Richland 21,830 22,526 23,245 24,752 Annual Average Percent Change n/a .63% .63% .63%
Richland County 384,504 404,400 424,300 456,000 Annual Average Percent Change n/a .86% .86% .86%
South Carolina 4,625,364 4,823,200 5,020,800 5,451,700 Annual Average Percent Change n/a .83% .83% .83%
Source: SC B&CB and ESRI, 2012
The racial mix in Lower Richland is shown in Table 2. The study area is less racially diverse than the County and the State averages.
Table 2: Ethnic Composition
Lower Richland Area Richland County South Carolina
Black 66.1% 46.3% 28.1% White 29.6% 48.9% 68.4% Other 4.3% 4.8% 3.5%
Source: U.S. Bureau of the Census
The population density in the area is shown in Table 3. As seen below in Table 3, Lower Richland is much less densely populated than the County average.
Table 3: Population Density
2010 Population Area in Square Miles Population per Square Mile
Lower Richland 21,830 326.7 66.8
Richland County 384,504 757.1 507.9
South Carolina 4,625,364 30,060.7 153.9 Source: U.S. Bureau of the Census
As seen below in Table 4, the Median Household Income in 2010 in Lower Richland was $38,760. This is only 81% of the County average and 88% of the statewide average Household Income.

Community Profile LOWER RICHLAND COUNTY 8
Table 4: Median Household Income
Lower Richland Richland County South Carolina
Income $38,760 $47,922 $43,939 Source: U.S. Bureau of the Census
As seen below in Table 5, in 2010, 55% of the population had incomes below $50,000.
Table 5: Income Distribution
Lower Richland
<$15,000 14.0% $15,000 - $24,999 10.2% $25,000 - $34,999 12.5% $35,000 - $49,999 17.9% $50,000 - $74,999 21.1% $75,000 - $99,999 15.6% $100,000 - $149,999 6.6% $150,000 - $199,999 1.3% $200,000+ 0.8%
Source: U.S. Bureau of the Census

Community Profile LOWER RICHLAND COUNTY 9
As seen below in Table 6, there are 466 business establishments in Lower Richland. These businesses represent a diverse economic base. However, the majority of these establishments are concentrated in the building related contractors and manufacturing sectors. 54 percent of businesses are not home base. The largest employers in the area are:
Westinghouse Electric Company, LLC- 1,200 employees
International Paper Company - 700 employees
Schneider Electric Square - 530 employees
Table 6: Business Establishments by Type
Industry Group Number of
EstablishmentsEmployment
Agriculture 9 29
Building/Contracting 79 1,425
Manufacturing 18 1,322
Wholesale 11 54
Transportation 71 166
Retail 51 357
Services 56 142
Eating/Drinking/Lodging 23 111
Health Care 34 274
All Other 114 237
Total 466 4,117 Source: U.S. Bureau of the Census
Note: Data in Tables 6 and 7 are not directly comparable. The Establishment data are by place of work and the Census data are by place of residence.

Community Profile LOWER RICHLAND COUNTY 10
As seen below in Table 7, there are an estimated 10,052 persons employed in the area. Employment in Lower Richland is concentrated in the manufacturing, retail trade and services sectors. The majorly of businesses are focused on supplying services to the Columbia Metro area. However the majority of employees are employed to produce export products out of the region. Distribution of employment is weighted to the three large employers in Manufacturing and Construction sectors compared to the distribution of business across the study area which is more balanced, though weighted toward services.
Table 7: Employment by Industry
2010 Employed Population 16+ by Industry
Total 10,052
Agriculture/Mining 1.7% Construction 7.7% Manufacturing 10.3% Wholesale Trade 2.4% Retail Trade 12.2% Transportation/Utilities 5.3% Information 2.2% Finance/Insurance/Real Estate 6.5% Services 42.9% Public Administration 8.8%
Source: U.S. Bureau of the Census, 2010 and ESRI 2012 estimates.
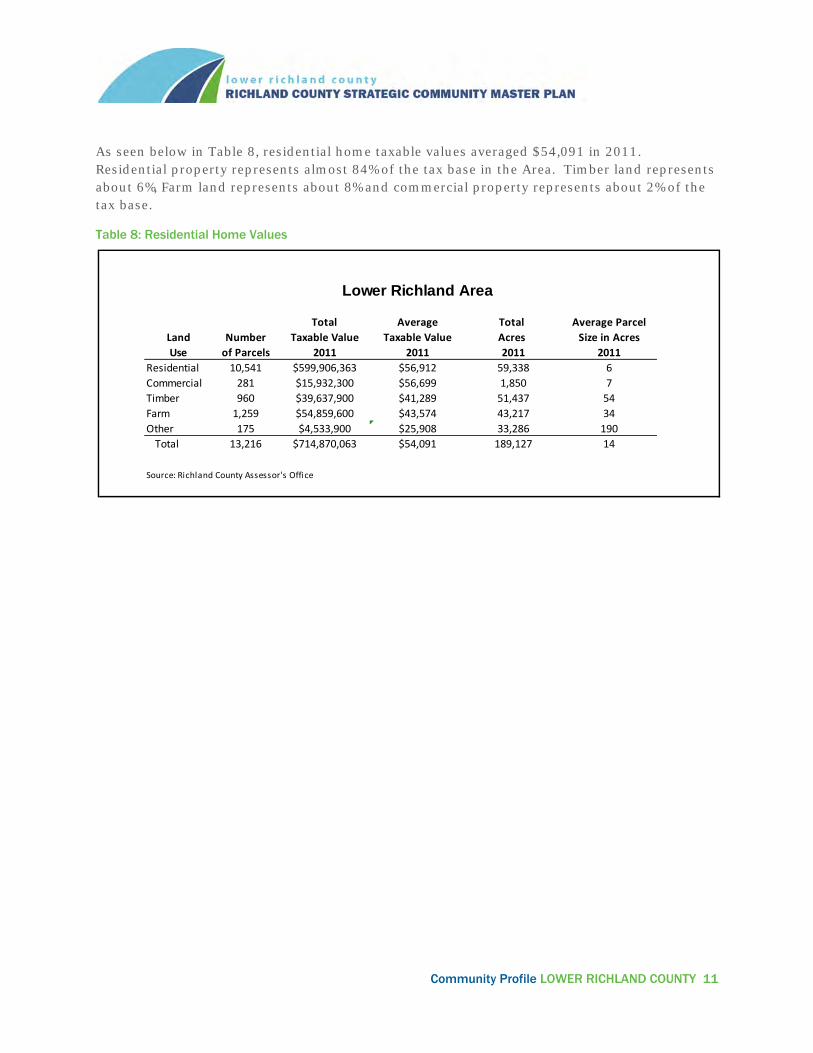
Community Profile LOWER RICHLAND COUNTY 11
As seen below in Table 8, residential home taxable values averaged $54,091 in 2011. Residential property represents almost 84% of the tax base in the Area. Timber land represents about 6%, Farm land represents about 8% and commercial property represents about 2% of the tax base.
Table 8: Residential Home Values
Lower Richland Area
Total Average Total Average ParcelLand Number Taxable Value Taxable Value Acres Size in AcresUse of Parcels 2011 2011 2011 2011
Residential 10,541 $599,906,363 $56,912 59,338 6Commercial 281 $15,932,300 $56,699 1,850 7Timber 960 $39,637,900 $41,289 51,437 54Farm 1,259 $54,859,600 $43,574 43,217 34Other 175 $4,533,900 $25,908 33,286 190 Total 13,216 $714,870,063 $54,091 189,127 14
Source: Richland County Assessor's Office
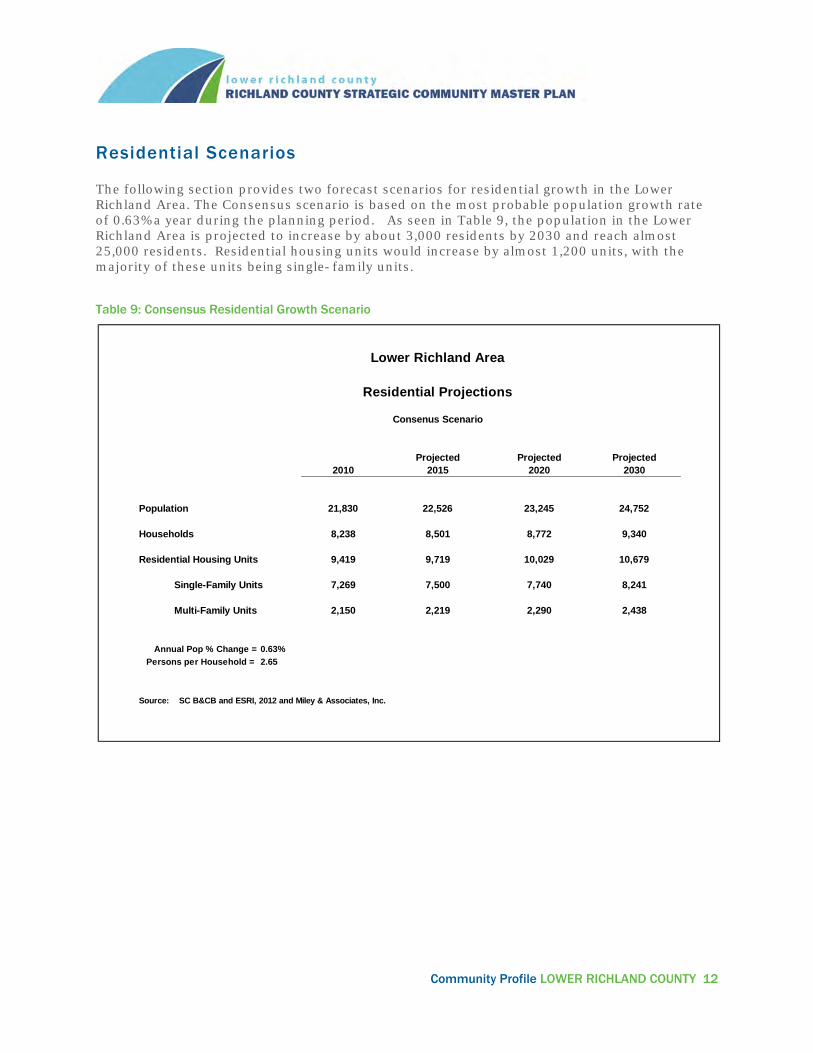
Community Profile LOWER RICHLAND COUNTY 12
Residential Scenarios
The following section provides two forecast scenarios for residential growth in the Lower Richland Area. The Consensus scenario is based on the most probable population growth rate of 0.63% a year during the planning period. As seen in Table 9, the population in the Lower Richland Area is projected to increase by about 3,000 residents by 2030 and reach almost 25,000 residents. Residential housing units would increase by almost 1,200 units, with the majority of these units being single-family units.
Table 9: Consensus Residential Growth Scenario
Lower Richland Area
Residential Projections
Consenus Scenario
Projected Projected Projected2010 2015 2020 2030
Population 21,830 22,526 23,245 24,752
Households 8,238 8,501 8,772 9,340
Residential Housing Units 9,419 9,719 10,029 10,679
Single-Family Units 7,269 7,500 7,740 8,241
Multi-Family Units 2,150 2,219 2,290 2,438
Annual Pop % Change = 0.63%Persons per Household = 2.65
Source: SC B&CB and ESRI, 2012 and Miley & Associates, Inc.
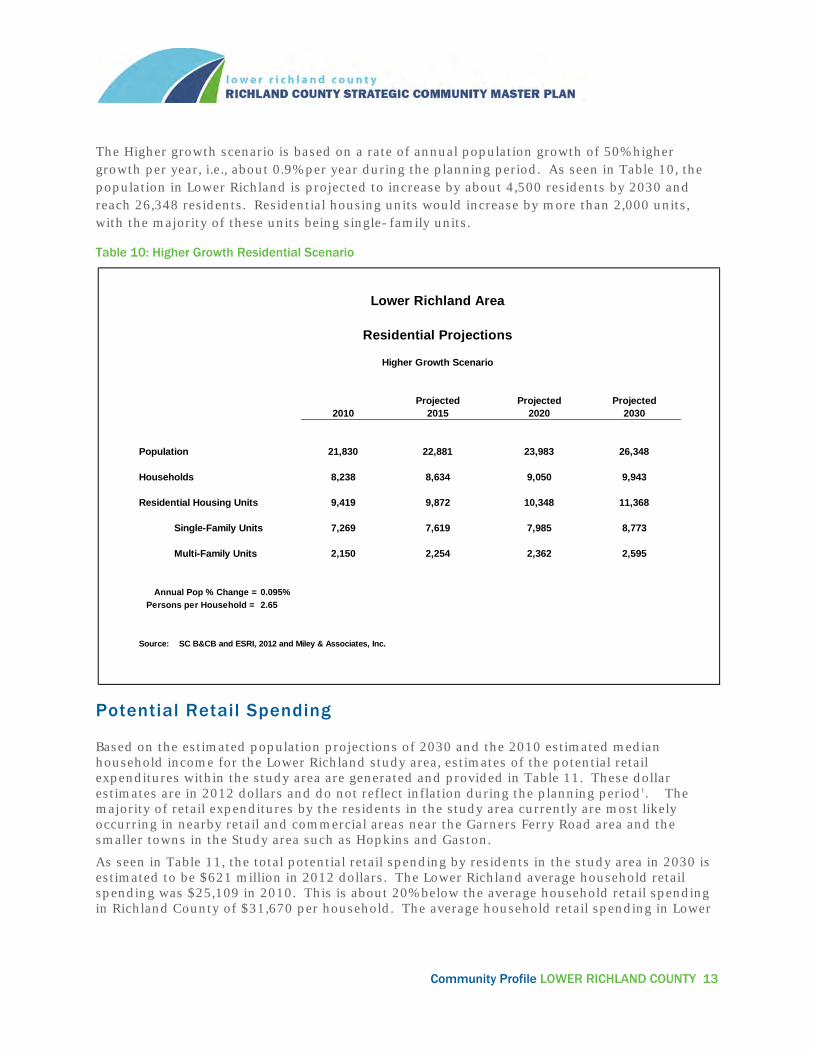
Community Profile LOWER RICHLAND COUNTY 13
The Higher growth scenario is based on a rate of annual population growth of 50% higher growth per year, i.e., about 0.9% per year during the planning period. As seen in Table 10, the population in Lower Richland is projected to increase by about 4,500 residents by 2030 and reach 26,348 residents. Residential housing units would increase by more than 2,000 units, with the majority of these units being single-family units.
Table 10: Higher Growth Residential Scenario
Potential Retail Spending
Based on the estimated population projections of 2030 and the 2010 estimated median household income for the Lower Richland study area, estimates of the potential retail expenditures within the study area are generated and provided in Table 11. These dollar estimates are in 2012 dollars and do not reflect inflation during the planning period1. The majority of retail expenditures by the residents in the study area currently are most likely occurring in nearby retail and commercial areas near the Garners Ferry Road area and the smaller towns in the Study area such as Hopkins and Gaston.
As seen in Table 11, the total potential retail spending by residents in the study area in 2030 is estimated to be $621 million in 2012 dollars. The Lower Richland average household retail spending was $25,109 in 2010. This is about 20% below the average household retail spending in Richland County of $31,670 per household. The average household retail spending in Lower
Lower Richland Area
Residential Projections
Higher Growth Scenario
Projected Projected Projected2010 2015 2020 2030
Population 21,830 22,881 23,983 26,348
Households 8,238 8,634 9,050 9,943
Residential Housing Units 9,419 9,872 10,348 11,368
Single-Family Units 7,269 7,619 7,985 8,773
Multi-Family Units 2,150 2,254 2,362 2,595
Annual Pop % Change = 0.095%Persons per Household = 2.65
Source: SC B&CB and ESRI, 2012 and Miley & Associates, Inc.

Community Profile LOWER RICHLAND COUNTY 14
Richland was 30% above the County average and 60% above that of Lower Richland. However, even though the average is relatively low, the large population base generates substantial spending potential in year 2030 of $621 million. Table 11: Potential Annual Retail Spending 2030
Retail, Office and Industrial Real Estate Outlook
Aggregate Average Dollars Dollars
Appliances and Electronics Stores $16,913,815 $683.34Art Dealers $226,067 $9.13Auto Parts and Accessories $10,363,366 $418.69Book Stores $6,179,950 $249.68Camera and Photography Stores $1,288,503 $52.06Childrens' and Infant's Clothing Stores $2,196,892 $88.76Clothing Accessory Stores $427,212 $17.26Computer Stores $29,963,297 $1,210.56Convenience Stores $5,346,916 $216.02Cosmetics and Beauty Stores $1,049,681 $42.41Department Stores $57,594,885 $2,326.92Drinking Places $1,712,968 $69.21Family Clothing Stores $8,317,382 $336.03Fish and Seafood Markets $270,024 $10.91Floor Covering Stores $2,430,613 $98.20Florists $564,383 $22.80Fruit and Vegetable Markets $533,573 $21.56Fuel Dealers $14,422,957 $582.71Full Service Restaurants $19,014,746 $768.22Furniture Stores $9,161,797 $370.15Gasoline Stations with Convenience Stores $20,626,651 $833.35Gasoline Stations without Convenience Stores $3,448,895 $139.34Gift and Souvenir Stores $1,804,807 $72.92Grocery Stores $111,229,672 $4,493.84Hardware Stores $3,852,166 $155.63Hobby, Toy, and Game Stores $1,087,162 $43.92Home Centers $9,853,735 $398.11Hotels and Other Travel Accommodations $2,826,034 $114.18Jewelry Stores $4,902,828 $198.08Limited Service Restaurants $18,853,046 $761.69Liquor Stores $3,096,647 $125.11Luggage Stores $3,916,532 $158.23Mail Order and Catalog Stores $41,615,166 $1,681.31Meat Markets $1,135,241 $45.87Men's Clothing Stores $1,288,700 $52.07Mobile Home Dealers $16,288 $0.66Motorcycle and Boat Dealers $3,610,596 $145.87Musical Instrument Stores $3,610,596 $145.87New Car Dealers $78,787,685 $3,183.14Nursery and Garden Stores $2,670,809 $107.90Office and Stationary Stores $5,324,153 $215.10Optical Goods Stores $2,339,362 $94.51Other Apparel Stores $1,038,888 $41.97Other Building Materials Stores $9,914,372 $400.55Other Direct Selling Establishments $3,610,989 $145.89Other General Merchandise Stores $6,740,996 $272.35Other Health and Personal Care Stores $1,957,089 $79.07Other Home Furnishing Stores $2,827,800 $114.25Other Miscellaneous Retail Stores $2,674,537 $108.06Other Specialty Food Markets $837,154 $33.82Outdoor Power Equipment Stores $330,858 $13.37Paint and Wallpaper Stores $342,240 $13.83Pet and Pet Supply Stores $1,199,411 $48.46Pharmacy and Drug Stores $24,214,680 $978.31RV Parks $45,920 $1.86Record, Tape, and CD Stores $1,716,304 $69.34Recreational Vehicle Dealers $215,863 $8.72Rooming and Boarding Houses $20,016 $0.81Sewing and Needlecraft Stores $460,768 $18.62Shoe Stores $2,720,065 $109.89Special Food Services and Catering $3,165,330 $127.88Sporting Goods Stores $3,863,155 $156.08Tire Dealers $4,746,230 $191.75Used Merchandise Stores $1,196,860 $48.35User Car Dealers $4,890,465 $197.58Vending Machines $1,693,736 $68.43Warehouse Superstores $23,035,874 $930.68Women's Clothing Stores $4,157,317 $167.96 Total Annual Retail $621,492,714 $25,109.20

Community Profile LOWER RICHLAND COUNTY 15
The Lower Richland study area is a very large and diverse area. The trends in real estate vary widely across the study area. In this section, each segment of the market is analyzed.
RETAIL
The retail market in the Lower Richland study area, like most of the metro Columbia area, is still suffering from the severe impacts of the recent Great Recession. While quantitative data are lacking in other subsections of the study area, many vacant buildings and “For Rent” signs throughout the area indicate a weak market.
According to Colliers International research, the study area has about 1.2 million square feet of retail space. This represents about 9% of the total 12.4 million square feet of retail space in the metro area. While vacancy rates are below that of the metro area, rents are about 12% below the metro average.
Given the high capacity to absorb growth in retail space in the area, it is not anticipated that the study area will experience substantial demand in new retail space during the planning period. While some new retail space will be built during the next 20 years, for the near-term, it is assumed that the excess capacity in the existing market will absorb all of the growth in the potential retail spending growth in the study area.
What new retail and commercial activity is generated during the planning period will most likely be located in the Garners Ferry Road area and the smaller towns in the Study area such as Hopkins and Gaston.
OFFICE
The office market in the Lower Richland study area is not as well developed as other areas of the metro Columbia area. While data is not available for all of the study area, one of the more developed areas adjacent to the study area, the Devine Street area, still has a vacancy rate of 49% according to Colliers International Real Estate Research. The rest of the Columbia office market is suffering as well. The average vacancy rate for the entire Columbia market is over 23%.
There is almost 10.0 million square feet of office space in the metro area. Almost 50% of the space is in the central business district and 85% of all office space is in the downtown, St. Andrews and Northeast areas.
Given the high capacity to absorb any growth in the demand for office space in the area, it is not anticipated that the study area will experience substantial demand in new office space during the planning period.
INDUSTRIAL
The one bright spot for the Lower Richland study area may be the opportunities that may be generated in the industrial sector. Although there is substantial excess capacity as of the second quarter in 2012, (there was more than 600,000 square feet of vacant industrial space in the Southeast Columbia area) the potential for the Lower Richland Area during the planning period may be improving.
Community Profile LOWER RICHLAND COUNTY 16
The recently passed Penny Sales Tax for Transportation plans includes substantial infrastructure improvements in the Shop Road area of the Study Area. One specific improvement is the proposed extension of Shop Road. These road improvements are anticipated to open up major parcels of developable land that could result in substantial economic development projects.
The magnitude of these future economic development projects is difficult to estimate, but the potential for the study area is much greater given the passage of the sales tax and plan than without the plan’s adoption.
References:
ReferenceUSA. (2009). Crawford Textiles Company Inc. profile. Retrieved Nov 29, 2012, from http://www.referenceusa.com/. THE ECONOMIC IMPACT OF THE MILITARY COMMUNITY IN SOUTH CAROLINA, South Carolina Department of Commerce, November 2012. Colliers International, Various Market Research Reports, 3Q 2012, http://www.colliers.com/~/media/Files/MarketResearch/UnitedStates/MARKETS/Columbia/Q22012ColumbiaRetailReport.pdf

Community Profile LOWER RICHLAND COUNTY 17
LAND USE
Existing Land Use Pattern Land Use in Lower Richland varies. In the northwestern portion of the study area, near the Columbia city limits and along Leesburg Road and Garners Ferry Road, there are a number of medium density residential subdivisions. In areas served by water and sewer, quarter acre lots are common. In areas farther east and south, residential development becomes more dispersed and occurs at lower densities. In these areas, typically not served by water and sewer, lots between 1 and 2 acres are common. There are a number of homes located on parcels greater than 10 acres in size. These “Homestead” parcels make up 23% of the land area. Overall average residential density in the study area, for residential parcels, is 1 dwelling unit per 5.6 acres.
Commercial and industrial uses make up 1.5% of the land area. These uses are focused along major road corridors (i.e. Leesburg Road, Garners Ferry Road and Bluff Road) and near rural community centers, including Gadsen, Hopkins, and Eastover.
There are a number of institutional and civic uses in the study area including seven schools, a sheriff’s office, Eastover Library, six fire stations, and 64 churches.
Farms and timber lands make up over 50% of the study area. Public parks, including the Congaree National Park, and other conservation tracts make up 14% of the study area.
A table detailing existing land use in the study area is included below. Map 1 illustrates existing land uses in Lower Richland.
Table 12: Existing Land Use (2012)
Generalized Land Use
Description Parcels Acres %
PARK / CONSERVATION
Public Park or Conservation Land
52 27,183.1 14.4%
TIMBER Timberland 960 51,437.2 27.2%
FARM Farm (Pasture and Cropland) 1,259 43,216.7 22.9%HOMESTEAD Large Lot Residential (1 Home
on > 10 Acres)
646 42,510.1 22.5%
RES Residential (1 Home on < 10 Acres) 9,898 16,827.7 8.9%
COM Commercial or Industrial 280 2,819.1 1.5%
INST Institutional, School, Civic 72 582.2 0.3%
MILITARY Military Uses 3 2,387.2 1.3%
OTHER Miscellaneous Uses 40 2,163.6 1.1%
Total 13,210 189,127 100%
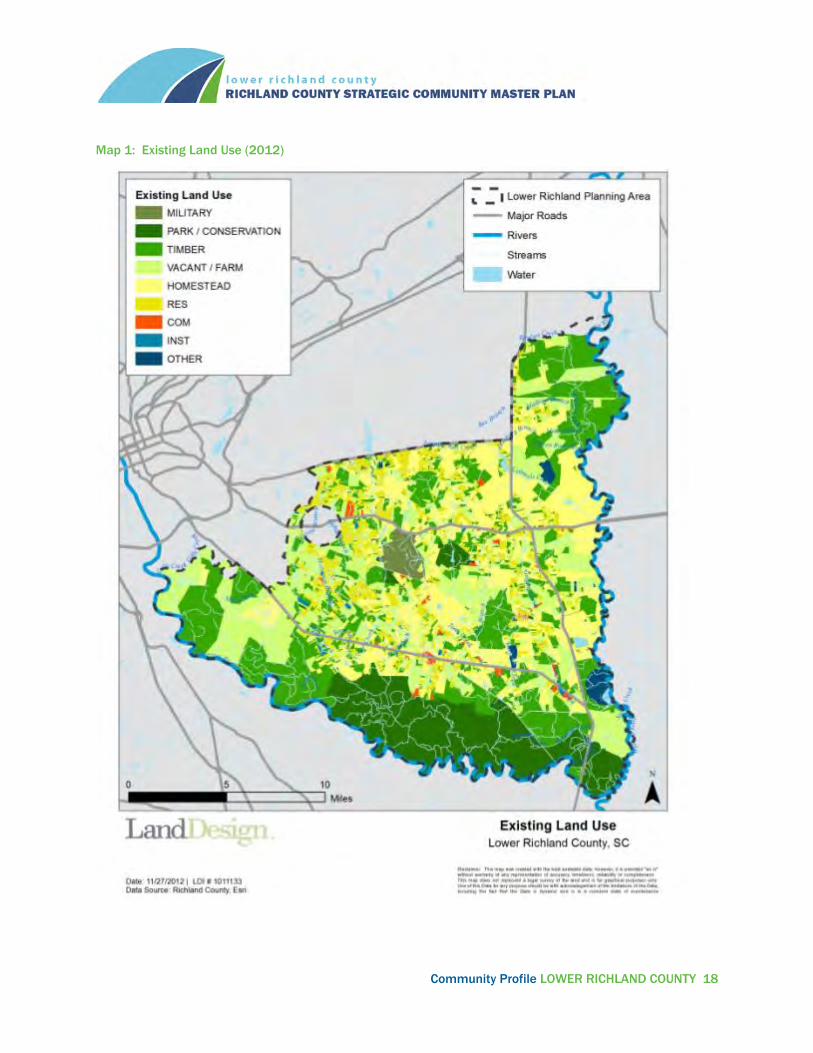
Community Profile LOWER RICHLAND COUNTY 18
Map 1: Existing Land Use (2012)

Community Profile LOWER RICHLAND COUNTY 19
Zoning, Future Land Use, and Development Potential The majority of Lower Richland is designated rural in the adopted Richland County Comprehensive Plan. This designation calls for low density residential development with minimum lot sizes of ¾ of an acre as well as limited commercial, office and industrial at appropriately located and buffered sites. The majority of this area is zoned RU (Rural District), which allows one unit on a lot with a minimum size of 33,000 square feet. There are also isolated commercial and industrial zoning designations, due to existing uses such as Westinghouse Electric on Bluff Road.
There is a small portion of the study area located in the northwestern section that is designated as Suburban in the Comprehensive Plan. These areas roughly correspond with areas zoned RS-MD and RS-HD, which allow for 4-8 dwelling units per acre.
The area around the intersection of Lower Richland Boulevard and Garner’s Ferry Road was identified as a Priority Investment Area and is detailed in the Southeast Richland Master Plan. This area will not be addressed in this report.
There is also a portion of the study area identified as Conservation area in the Comprehensive Plan. This area covers the existing boundaries of the Congaree National Park.
Future land use designations from the Richland County Comprehensive Plan are shown in Map 2. Zoning designations in the study area are shown in Map 3.

Community Profile LOWER RICHLAND COUNTY 20
Map 2: Future Land Use (from 2009 Comp Plan)

Community Profile LOWER RICHLAND COUNTY 21
Map 3: Richland County Zoning
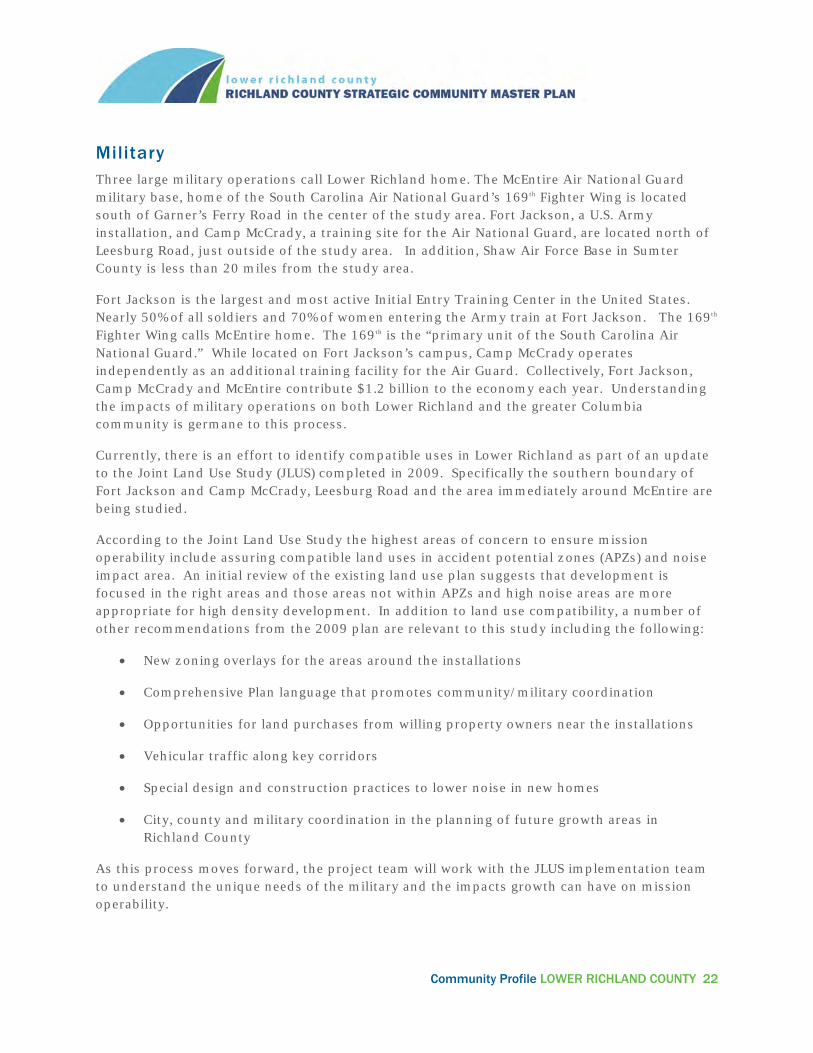
Community Profile LOWER RICHLAND COUNTY 22
Military Three large military operations call Lower Richland home. The McEntire Air National Guard military base, home of the South Carolina Air National Guard’s 169th Fighter Wing is located south of Garner’s Ferry Road in the center of the study area. Fort Jackson, a U.S. Army installation, and Camp McCrady, a training site for the Air National Guard, are located north of Leesburg Road, just outside of the study area. In addition, Shaw Air Force Base in Sumter County is less than 20 miles from the study area.
Fort Jackson is the largest and most active Initial Entry Training Center in the United States. Nearly 50% of all soldiers and 70% of women entering the Army train at Fort Jackson. The 169th Fighter Wing calls McEntire home. The 169th is the “primary unit of the South Carolina Air National Guard.” While located on Fort Jackson’s campus, Camp McCrady operates independently as an additional training facility for the Air Guard. Collectively, Fort Jackson, Camp McCrady and McEntire contribute $1.2 billion to the economy each year. Understanding the impacts of military operations on both Lower Richland and the greater Columbia community is germane to this process.
Currently, there is an effort to identify compatible uses in Lower Richland as part of an update to the Joint Land Use Study (JLUS) completed in 2009. Specifically the southern boundary of Fort Jackson and Camp McCrady, Leesburg Road and the area immediately around McEntire are being studied.
According to the Joint Land Use Study the highest areas of concern to ensure mission operability include assuring compatible land uses in accident potential zones (APZs) and noise impact area. An initial review of the existing land use plan suggests that development is focused in the right areas and those areas not within APZs and high noise areas are more appropriate for high density development. In addition to land use compatibility, a number of other recommendations from the 2009 plan are relevant to this study including the following:
New zoning overlays for the areas around the installations
Comprehensive Plan language that promotes community/military coordination
Opportunities for land purchases from willing property owners near the installations
Vehicular traffic along key corridors
Special design and construction practices to lower noise in new homes
City, county and military coordination in the planning of future growth areas in Richland County
As this process moves forward, the project team will work with the JLUS implementation team to understand the unique needs of the military and the impacts growth can have on mission operability.
Community Profile LOWER RICHLAND COUNTY 23
TRANSPORTATION
Existing Roadway Conditions This section of the report examines the existing roadway conditions in the Lower Richland study area. Roadway traffic volumes, level of service, vehicle-miles of travel, and mileage by functional classification are evaluated using the Columbia Area Transportation Study (COATS) travel demand model. Major intersections and commuter travel behavior are evaluated based on field review and information gathered from residents of the study area. Roadway Classification Roadway classification is a necessary step toward assessing and evaluating the effectiveness of the roadway network. Individual roads depend on surrounding and intersecting roads to create a functioning network. Currently, there are 196.95 miles of roadway within the study area encompassing all road types. The Federal Functional Classification System is used by SCDOT to classify roads in the study area by categorizing a road section based on attributes common to its role and function in the network.
Interstates – Defined as significant highways featuring limited access and continuous, high-speed movements for a wide variety of traffic types. No interstate is located within the Lower Richland study area. Located northwest of the Lower Richland study area, I-77 travels in between the study area and downtown Columbia.
Arterials – Classified as a major or minor, these roads connect activity centers and carry large volumes of traffic at moderate speeds. The arterial system in the Lower Richland study area totals approximately 29.51 miles, consisting of 8.98 miles of divided major arterials, 5.0 miles of undivided major arterials, and 15.53 miles of minor arterials. The two major arterials in the Lower Richland study area are Garners Ferry Road (US 378) and US 601, while Bluff Road (SC 48) is a prominent minor arterial. US 378 and SC 48 provide direct access to downtown Columbia and serve as prime routes for traffic in the morning and evening peak hours. The Annual Average Daily Trips (AADT) on arterial roadways in the study area averages 22,090 Vehicles per Day (VPD) on major divided arterials, 4,360 VPD on major undivided arterials, and 3,435 vpd on minor arterials. Garners Ferry Road (US 378) carries the majority of the traffic with approximately 22,090 vpd on average as it enters the study area.
Collectors – Collectors typically allow access to activity centers from residential areas. Collectors can also be categorized as major and minor, depending on the urbanized or rural setting. Their purpose is to collect traffic from streets in residential and commercial areas and distribute it to the arterial system. The collector system in the Lower Richland study area consists of 86.48 total miles, of which 73.16 miles are major collectors. The AADT on collector roadways averages 1,350 vpd in urban areas and 1,790 vpd in rural portions of the study area.
Local Streets – Local streets feed the collector system from low volume residential and commercial areas. Local streets are usually found in subdivisions and rural areas. Local streets account for 26.21 miles within the study area. SCDOT collects AADT volumes for limited number of local roadways.
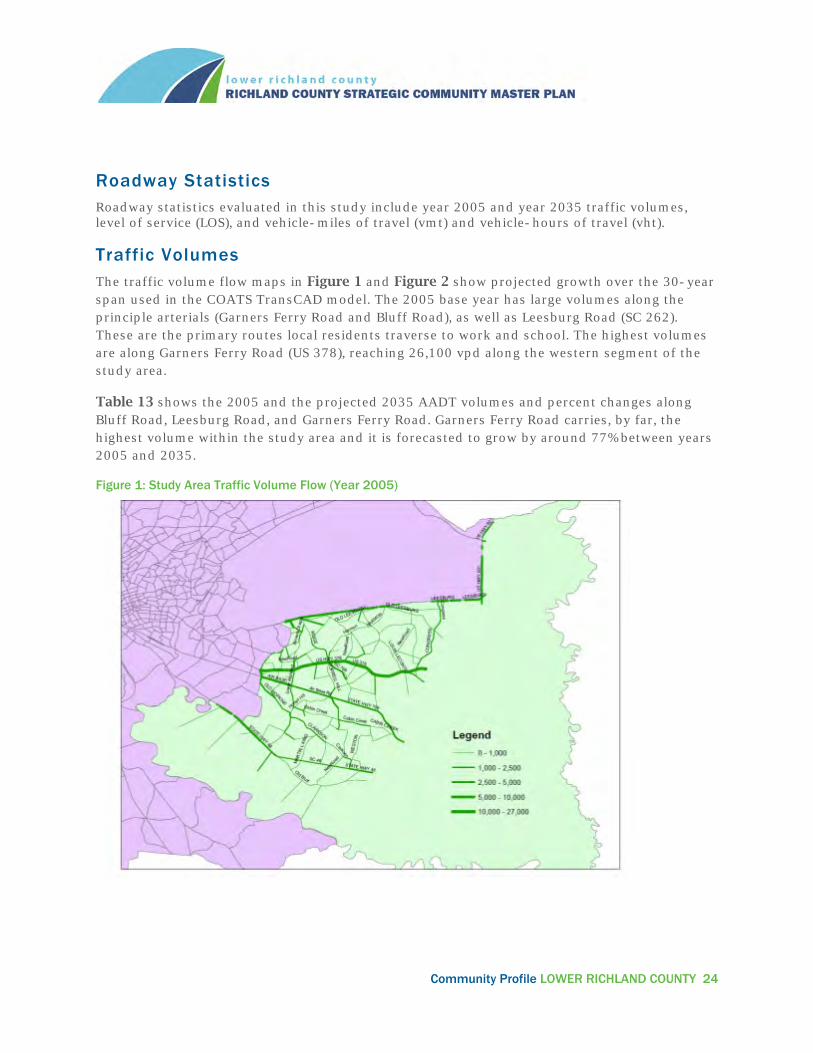
Community Profile LOWER RICHLAND COUNTY 24
Roadway Statistics Roadway statistics evaluated in this study include year 2005 and year 2035 traffic volumes, level of service (LOS), and vehicle-miles of travel (vmt) and vehicle-hours of travel (vht). Traffic Volumes The traffic volume flow maps in Figure 1 and Figure 2 show projected growth over the 30-year span used in the COATS TransCAD model. The 2005 base year has large volumes along the principle arterials (Garners Ferry Road and Bluff Road), as well as Leesburg Road (SC 262). These are the primary routes local residents traverse to work and school. The highest volumes are along Garners Ferry Road (US 378), reaching 26,100 vpd along the western segment of the study area.
Table 13 shows the 2005 and the projected 2035 AADT volumes and percent changes along Bluff Road, Leesburg Road, and Garners Ferry Road. Garners Ferry Road carries, by far, the highest volume within the study area and it is forecasted to grow by around 77% between years 2005 and 2035.
Figure 1: Study Area Traffic Volume Flow (Year 2005)

Community Profile LOWER RICHLAND COUNTY 25
Figure 2: Study Area Traffic Volume Flow (Year 2035)
Table 13: Major Roadway Traffic Volumes
Roadway AADT(1) Percent Change
2005 2035 ’05 to ‘35 Bluff Road
3,686 7,127 93.4%
Leesburg Road
7,240 13,378 84.8%
Garners Ferry Road
22,091 39,086 76.9%
Note: (1) All SCDOT roadway count stations were averaged to provide AADT.

Community Profile LOWER RICHLAND COUNTY 26
Level of Service The COATS travel demand model was used to evaluate the LOS for years 2005 and 2035. The COATS model is a 24-hour model. Therefore, the LOS is a 24-hour LOS, and not a peak-hour LOS. The LOS for the study area is illustrated in Figure 3 and Figure 4 for year 2005 and 2035, respectively. Figure 3: LOS Map - Base Year 2005

Community Profile LOWER RICHLAND COUNTY 27
Figure 4: LOS Map - Base Year 2035
The LOS is based on level “C” capabilities according to the SCDOT. This means that the roadway volume is equal to the roadway capacity (Volume-to-Capacity Ratio equals 1.0) at level “C”. Below LOS “C”, the roadway volume is under capacity and above LOS “C” the roadway volume is over capacity. The range of Volume-to-Capacity ratios by LOS is shown in Table 14.
Table 14: Volume-to-Capacity Ratios by Level of Service
LOS V/C Ratio Range A V/C = 0 – 0.49 B V/C = 0.50 – 0.74 C V/C = 0.75 – 1.00 D V/C = 1.00 – 1.15 E V/C = 1.16 – 1.34 F V/C = 1.35 >

Community Profile LOWER RICHLAND COUNTY 28
Vehicle-Miles and Vehicle-Hours of Travel The COATS travel demand model was used to estimate the vehicle-miles of travel (vmt) and vehicle-hours of travel (vht) by roadway type (functional classification). The model calculates vmt by multiplying the length of the roadway links by the assigned volume. The model calculates vht by multiplying the time [Time = (Length/Speed)*60] of the roadway links by the assigned volume. Table 15 shows the vmt, vht, and congested speed in miles per hour (mph) by roadway type in the study area in year 2005. Table 16 shows the corresponding figures for year 2035. Congested speed is calculated by dividing the VMT by the VHT.
Table 15: Vehicle-Miles and Vehicle-Hours of Travel (2005)
Roadway Type VMT VHT Congested Speed (mph)
Primary Arterial
214421.7 213903.0 60.1
Minor Arterial 59143.9 62009 57.2
Major Collector
102367.7 118468 51.8
Collector 56690.0 61375 55.4
Local 3828.9 5626.4 40.8
Table 16: Vehicle-Miles and Vehicle-Hours of Travel (2035)
Roadway Type VMT VHT Congested Speed (mph)
Primary Arterial
383204 406578 56.6
Minor Arterial 102327 111108 55.3
Major Collector
165258 191952 51.7
Collector 113797 139409 48.9
Local 14975 22439 40.0

Community Profile LOWER RICHLAND COUNTY 29
Existing Transit Services Transit in the Lower Richland study area is serviced by the Central Midlands Regional Transit Authority (CMRTA) and the Santee Wateree Regional Transit Authority (SWRTA). CMRTA provides transit service in the study area between Lower Richland and Columbia, while SWRTA provides transit service in the study area between Lower Richland and Eastover.
CENTRAL MIDLANDS REGIONAL TRANSIT AUTHORITY
CMRTA transit services include fixed routes and paratransit service, Dial-A-Ride (DART), that provide access to jobs, schools, businesses, hospitals, shopping and entertainment throughout the Columbia Metropolitan area. CMRTA has three routes that service the Lower Richland study area with a fixed one-way fare of $1.50. Special needs one-way fares are $0.75 and fares are free for children under the age of five-years old and accompanied by an adult rider. The DART paratransit service has a $3.00 one-way fare.
Existing Routes
As noted above, CMRTA has three fixed routes that operate along in or around the periphery of the Lower Richland study area. Route 4 is the Olympia/Eastway Park fixed route that travels between the Columbia Transit Center and Fort Jackson in the Lower Richland study area. Route 5 is the Fort Jackson Special fixed route that travels between the Columbia Transit Center and the intersection of Bluff and Windy in the Lower Richland study area. The fixed routes focus on weekday travel and Saturday shopping trips to local retail centers in the study area, but no Sunday service is available for this route. Route 20 is the Greenlawn fixed route that travels between the Columbia Transit Center and the intersection of Hazelwood and Fairmount in the Lower Richland study area. The routes operate differently depending on the day. Table 17 lists the CMRTA fixed routes in the study area by day of week. DART hours of service are 5:30 a.m. to 6:30 p.m. Monday through Saturday and no service on Sundays. The areas available for DART service vary by time of day.
Table 17: CMRTA Routes by Day of Week
Route Description
Route #
Monday Tuesday Wednesday Thursday Friday Saturday Sunday
Olympia/Eastway Park
4 X X X X X
Fort Jackson Special
5 X X X X X X
Greenlawn 20 X X X X X X Route Travel Times and Frequency
The three CMRTA routes that serve the study area start service between 7:20 and 7:52 a.m. and end service between 4:23 and 5:10 p.m. Route 4 has a frequency of 33 minutes, route 5 has a frequency of 32 minutes each way and route 20 has a frequency of 41 minutes, and Table 18 shows the route travel times and frequency for the three routes within the study area. Times are the same for both weekday and Saturday service.

Community Profile LOWER RICHLAND COUNTY 30
Table 18: Route Travel Times and Frequency within Study Area
Route # First Bus Arrival Time (Bluff & Windy)
Last Bus Arrival Time (Bluff & Windy)
Route Travel Times to Transit Center (minutes)
Runs per Day
Route 4 6:18 a.m. 6:18 p.m. 33 minutes 10 Route 5 7:52 a.m. 4:22 p.m. 32 minutes 4 Route 20 6:24 a.m. 6:24 p.m. 41 minutes 13
Santee Wateree Regional Transit Authority
SWRTA services include fixed routes and paratransit routes that provide transit services between Sumter, Eastover and Columbia. SWRTA has one fixed route service in the study area called the Eastover Transit Bus Service that serves as a rural commuter service between Eastover Town Hall and Columbia. The one-way fare is $4.00 between Sumter and Columbia, $2.50 between Sumter and Eastover, and $1.50 between Eastover and Columbia. Senior Citizens, persons with disabilities, and children under the age of 12, ride for half-fare on all of these routes.
Existing Routes
SWRTA has a SmartRide commuter service, the Eastover Transit Bus Service, and a SmartRide Vanpool service (paratransit service). The Eastover Transit Bus Service runs three times a weekday within the study area along Garners Ferry Road (US 378). The Santee Wateree Regional Transit Authority (SWRTA) Vanpool services are available for individuals who cannot access one of the Eastover Transit commuter stops. Paratransit passengers must call 24 to 48 hours in advance to be picked up for service.
SWRTA is evaluating an express routes service to the VA Hospital and Super Wal-Mart, adjacent to Garners Ferry Road (US 378), as a recreational route and not a commuter work route. This express route would connect to a CMRTA fixed route service.
EXISTING BICYCLE AND PEDESTRIAN FACILITIES
Bicycle and pedestrian facilities are concentrated at the northwestern part of the study area near downtown Columbia and Leesburg Road (SC 262). A segment of the Palmetto Trail bicycle and pedestrian facility traverses through the study area and a bicycle corridor connection between Bluff Road and Leesburg Road (SC 262) is identified in the study area. There are several sidewalk connections within residential developments and a few school sidewalk connections. Data sources used to evaluate existing bicycle and pedestrian facilities included COATS Bikeway and Pedestrian Plan, Bicycle and Pedestrian System component of the Richland Town and County Plan, Richland County GIS Department, field review, and discussions with study area residents.
Bicycle Facil ities
There are no existing dedicated bicycle lanes within the study area. Additionally, there are no routes in the bicycle and pedestrian plan for Lower Richland County. However, the CMCOG has identified a “Principal Bikeway Corridor” within the study area. The bicycle corridor runs along

Community Profile LOWER RICHLAND COUNTY 31
Bluff Road (SC 48 to Beltline Boulevard, Devine Street (US 378) to Leesburg Road (SC 262), Fairmount Drive to Caughman Road, and ends at Trotter Road.
Pedestrian Facil it ies
Sidewalks within the study area are scattered within residential developments with some connections to schools, parks, and strip shopping developments. Most of the sidewalk facilities are on one side of the road only, except for the two-sided sidewalk facilities in Pine Lake, Lee Hills, and Quail Hills subdivisions.
Greenway Trail Facil it ies
The Palmetto Trail is a greenway trail facility spanning the State of South Carolina from the coastline in Awendaw to the mountains in Oconee. The Palmetto Conservation Foundation developed the Palmetto Trail for pedestrians, bicyclists, and hikers. A section of the Fort Jackson Passage of the Palmetto Trail runs through the study area along Leesburg Road to Fort Jackson’s Gate 5 at Semmes Road.
Suggested Bicycle and Pedestrian Improvements from Existing Studies
Suggested bicycle and pedestrian facilities within the study area from other recent studies include connections to schools, residential developments, shopping developments, recreational sites, etc.
2010 Central Midlands Bicycle & Pedestrian Regional Pathways Plan Table 19: 2010 Bike and Pedestrian Pathways Plan - Recommended Lower Richland Facilities
Facility Name Description # of miles
Bluff Road/Congaree Park Bikeway
USC Stadium –Congaree Swamp
14.16
Lower Richland Bikeway Bluff Road – Fort Jackson 8.72 Fort Jackson (Wildcat) Bikeway Percival Road – Leesburg Road 7.28 Congaree River Greenway Downtown – Congaree Swamp 22.79 Cedar Creek Greenway Bluff Road – Fort Jackson 13.83 Leesburg-Ft. Jackson Trail Gills Creek – Cedar Creek 12.13
Columbia Area Transportation Study (COATS) 2035 Long-Range Transportation Plan
The COATS 2035 Long-Range Transportation Plan has identified sets of recommended transportation improvements for the study areas are shown in Table 20, Table 21, Table 22 and Table 23.
Table 20: Early Action Project
Route Name Project Limits Improvement Garners Ferry Road (US 76/US 378)
Veteran Road and Benson Road
Improve pedestrian conditions

Community Profile LOWER RICHLAND COUNTY 32
Table 21: Prioritized Roadway Widening Projects
Route Name Project Limits Leesburg Road Fairmount Drive (S-404) to Lower Richland Boulevard (S-37) Leesburg Road Lower Richland Boulevard (S-37) to Harmon Road (S-86) Leesburg Road Harmon Road (S-86) to McCords Ferry Road
Table 22: Prioritized List of New Location Projects
Route Name Project Limits Rabbit Run From Trotter Road to Garners Ferry PointShop Road Extension
From Pinewood Road to Garners Ferry Road
Table 23: Prioritized Intersection Improvements
Major Route Name Minor Route Name Proposed Improvement Broad River Road (US 176)
Sid Sites/Hopewell Church Road (S-1150/S-2475)
Realign Sid Sites Road with Bookie Richardson
COATS Bike and Pedestrian Pathways Plan
Southeast Richland Neighborhood Master Plan
Recommended more pedestrian connections between the “strip style developments” toward the intersection of Lower Richland Boulevard and Garners Ferry Road.
Southeast/Lower Richland Sub-Area Transportation Study
Suggest bikeway facilities include:
A bicycle lane connection along Garners Ferry Road (US 378) and Old Eastover Road (SC 764) to connect with the existing bike lane on Mccords Ferry Road (SC 601). This bikeway would connect cyclists to the McEntire Air National Guard Base, Horrel Hill Park, Greenlawn Memorial Park, shopping developments, and residential developments; and,
A bicycle lane connection along Congaree Road (SC 769), Harmon Road (SC 86), and Ridge Road. This bikeway would connect cyclists to the McEntire Air National Guard Base, Horrel Hill Park, Fort Jackson, schools, residential developments, and shopping developments.
Suggested pedestrian facilities at parks and mixed-use developments include:
Sidewalks on Trotter Road to connect residential, commercial, and recreational developments in the area, as well as Caughman Road Park;
Sidewalks on Caughman Road to Leesburg to connect residential, commercial, recreational, and school developments in the area;

Community Profile LOWER RICHLAND COUNTY 33
Fill in the sidewalk gaps on Old Woodlands Road to connect existing sidewalks on Garners Ferry Road;
Fill in the sidewalk gaps on Christie Road to connect to the existing sidewalks on Byron Road;
Fill in the sidewalk gaps on Garners Ferry Road between Rosewood Drive and Pelham Drive;
Extend the sidewalk on Garners Ferry Road at the Southeast Regional Branch of the Richland County Public Library from Greenlawn Drive to Atlas Road;
Extend the existing sidewalk on Bluff Road to the existing sidewalk facility at Atlas Road and to Pineview Road at Bluff Road Park; and,
Add sidewalk facilities at Hopkins Park and Horrell Hill Park to connect to residential developments.
Suggested pedestrian facilities at schools include:
Lower Richland High School connection to Rabbit Run;
Hopkins Elementary School connection to Cabin Creek Road;
Caughman Elementary School connection to Caughman Road;
Horrell Hill Elementary School connection to Horrell Hill Road and Eagle Road; and,
Southeast Middle School connection to Horrell Hill Road.

Community Profile LOWER RICHLAND COUNTY 34
COMMUNITY FACILITIES
Parks, Recreation and Greenways The Richland County Recreation Commission, the only nationally accredited parks and recreation agency in the state of South Carolina, operates all public recreational and park facilities in the Lower Richland area.
Currently there are seven facilities in or adjacent to the study area. Table 24 provides details on each of the seven facilities. Map 4 provides the location of each of these facilities.
In September of 2008, the Richland County Council approved $50 million in recreation bonds to buy land for current and future development, update existing facilities and construct new parks
around the county.2 Phase I of bond projects are near completion, Phase II is currently underway. Many of the facilities in the Lower Richland area will be improved as a result of the bond including improvements to Bluff Road Park, a new senior and technology center at Garners Ferry Road and a pool for Eastover Park.
In addition to existing facilities, four neighborhood parks are planned for the Lower Richland area. The locations of these facilities have yet to be determined.
In community meetings, stakeholders indicated the need for improved access to facilities and a growing demand for facilities with water features such as pools and splash pads. Specifically it was noted that a traffic light is needed at the entrance to the Garner’s Ferry Road Complex and an alternative entrance along Rabbit Run Road.
Currently, the County does not maintain any formal greenways in Lower Richland. However, the Palmetto Trail, a statewide trail system, does traverse the study area. The Fort Jackson Passage, pictured right, is a 14-mile section through the installation and along Leesburg Road, connects the Capital City Passage with the yet to be completed Wateree Passage into Sumter County.
2 Richland County Recreation Department

Community Profile LOWER RICHLAND COUNTY 35
Table 24: Community Facilities
Name of Facility
Facility Address
Acres Gyms Activity Rooms
Tennis Courts
Base-ball Fields
Racquetball Courts
Soft-ball Fields
Football/ Soccer Fields
Basket-ball Courts
Play Grounds
Pools Trails/Tracks
Picnic Shelters
Bluff Road Park 148 Carswell Drive 18.24
Caughman Road Park and Tennis Center
2800 Trotter Rd. 29.99
Eastover Park 1031 Main Street 24.26
Cross Roads Park
2750 McCords Ferry Rd. 5.81
Gadsden Community Center
1660 South Goodwin Circle 14.51
Garners Ferry Complex
8620 Garners Ferry Rd. 42
Hopkins Park 150 Hopkins Park Rd. 30

Community Profile LOWER RICHLAND COUNTY 36
Map 4: Park and Community Facilities
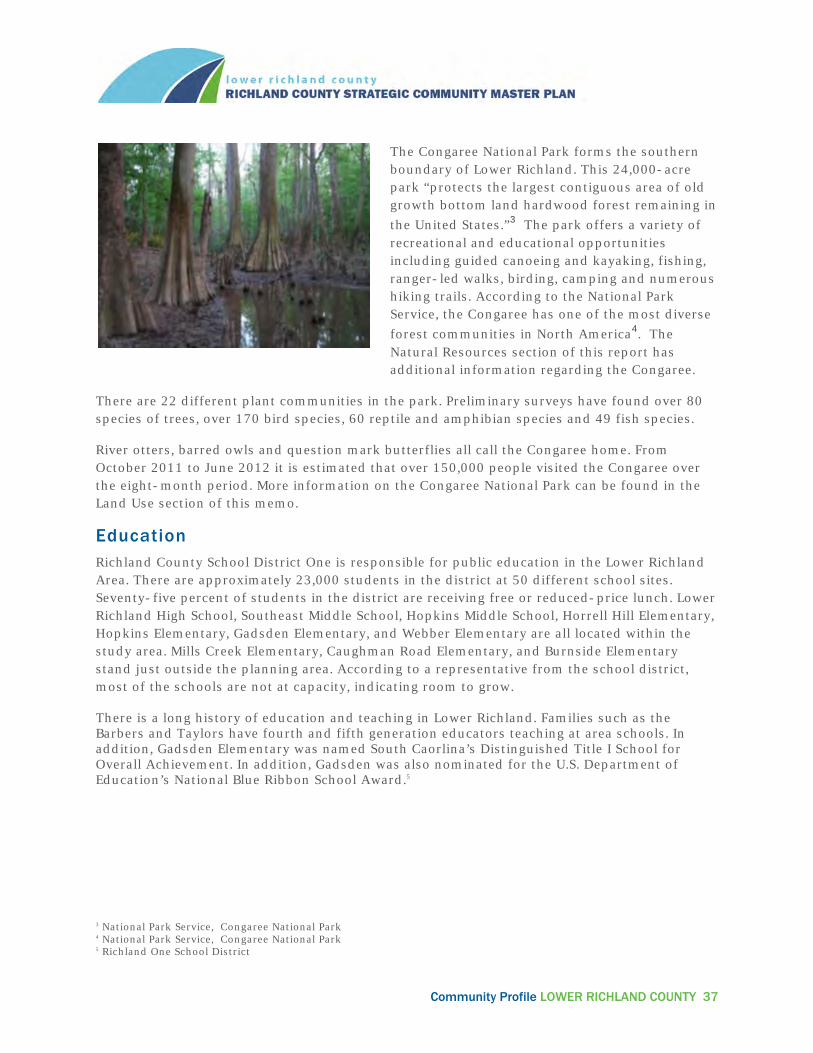
Community Profile LOWER RICHLAND COUNTY 37
The Congaree National Park forms the southern boundary of Lower Richland. This 24,000-acre park “protects the largest contiguous area of old growth bottom land hardwood forest remaining in
the United States.”3 The park offers a variety of recreational and educational opportunities including guided canoeing and kayaking, fishing, ranger-led walks, birding, camping and numerous hiking trails. According to the National Park Service, the Congaree has one of the most diverse
forest communities in North America4. The Natural Resources section of this report has additional information regarding the Congaree.
There are 22 different plant communities in the park. Preliminary surveys have found over 80 species of trees, over 170 bird species, 60 reptile and amphibian species and 49 fish species.
River otters, barred owls and question mark butterflies all call the Congaree home. From October 2011 to June 2012 it is estimated that over 150,000 people visited the Congaree over the eight-month period. More information on the Congaree National Park can be found in the Land Use section of this memo.
Education Richland County School District One is responsible for public education in the Lower Richland Area. There are approximately 23,000 students in the district at 50 different school sites. Seventy-five percent of students in the district are receiving free or reduced-price lunch. Lower Richland High School, Southeast Middle School, Hopkins Middle School, Horrell Hill Elementary, Hopkins Elementary, Gadsden Elementary, and Webber Elementary are all located within the study area. Mills Creek Elementary, Caughman Road Elementary, and Burnside Elementary stand just outside the planning area. According to a representative from the school district, most of the schools are not at capacity, indicating room to grow.
There is a long history of education and teaching in Lower Richland. Families such as the Barbers and Taylors have fourth and fifth generation educators teaching at area schools. In addition, Gadsden Elementary was named South Caorlina’s Distinguished Title I School for Overall Achievement. In addition, Gadsden was also nominated for the U.S. Department of Education’s National Blue Ribbon School Award.5
3 National Park Service, Congaree National Park 4 National Park Service, Congaree National Park 5 Richland One School District

Community Profile LOWER RICHLAND COUNTY 38
Public Safety RICHLAND COUNTY SHERIFF’S DEPARTMENT
Police services for Lower Richland are provided by the Sheriff's Office Region One of Richland County. An analysis of recent sheriff’s data indicates burglaries, vehicle theft and sexual offences are the most common crimes in the study area.
RICHLAND COUNTY FIRE DEPARTMENT
There are six fire stations located in Lower Richland. In addition, representatives from both Fort Jackson and McEntire ANG indicate that on-base first responders also provide emergency services to the area.
LIBRARY
Located in Eastover, there is one public library in Lower Richland. The library is currently being renovated with plans to double the space for a total of 5,000 square feet. Facilities include meeting rooms, enlarged area for the children’s collection, technology center, history of Eastover exhibit and traditional book loan and literacy programs. When completed, the library will be the first LEED certified county-owned municipal building. The renovation is being funded by a grant from the U.S. Department of Agriculture with matching funds from Richland County.
SOLID WASTE COLLECTION AND DISPOSAL
Solid waste collection and disposal is managed by the county’s Solid Waste and Recycling Department. There is one landfill located in the study area near the intersection of Leesburg Road and McCord’s Ferry Road. In addition, there is a manned drop-off site located at 10531 Ganer’s Ferry Road in Lower Richland.
A map of all community facilities can be found on page 36 of this document.

Community Profile LOWER RICHLAND COUNTY 39
UTILITIES
Public Water Supply, Treatment and Distribution SUPPLY
The City of Columbia’s Canal Water Plant serves portions of Lower Richland County from the City limits to Lower Richland Boulevard. There is a separate system that serves Hopkins and the surrounding area. Beyond these two systems, the majority of Lower Richland’s water comes from wells.
New demand for water service is allocated on a first come, first served basis. There are no additional allocations in place for Lower Richland County. If a major subdivision were planned in the area the existing water distribution system would not have enough capacity.
WASTEWATER
There is limited sewer service in the study area. The Town of Eastover is served by a small plant along the Wateree River. Currently that plant does have room to expand but would need additional permits to run at capacity.
The County has planned for a sewer line to run from Hopkins to the Town of Eastover. But that improvement is currently unfunded.
BROADBAND
According to Connect South Carolina, the State’s broadband initiative, most of Lower Richland is served by broadband service. Hopkins, Horrel Hill and Eastover all have cable broadband access. Gadsden and areas south of Hopkins and Eastover have access to mobile wireless service. Only the area within the Congaree National Park boundaries is unserved.

Community Profile LOWER RICHLAND COUNTY 40
NATURAL RESOURCES
Context Richland County is located on the eastern edge of the Piedmont Plateau and the Atlantic Coastal Plain. The Lower Richland Study Area is located in the southeast portion of Richland County. The Study Area consists of 326 square miles. It begins southeast of Columbia, SC and is bounded by Leesburg Road, US 601 and the county line to the north, the Wateree River to the east, and the Congaree River on the south. The natural environment in this area of Richland County is quite diverse. There are uplands and bluffs, distinct streamside riparian areas running south and east to the Congaree and Wataree rivers, and swampy bottomland forest adjacent to the rivers.
Land Cover and Ecoregions According to the 2006 National Land Cover Dataset, the majority of the land area in Lower Richland is forested. Different classes of forest (Woody wetlands, Evergreen, Deciduous, and Mixed forest) covers a total of 141,312 acres (66% of total land area). Cultivated land and pasture comprises 7% and 3.6% of the land area, respectively. Though dispersed residential development exists throughout the Study Area, significantly developed areas make up only 6% of the land area (13,006 acres). The figure below details land cover in the Study Area. Map 5 shows land cover in the Study Area.

Community Profile LOWER RICHLAND COUNTY 41
Map 5: Land Cover 2006 (Source: NLCD)
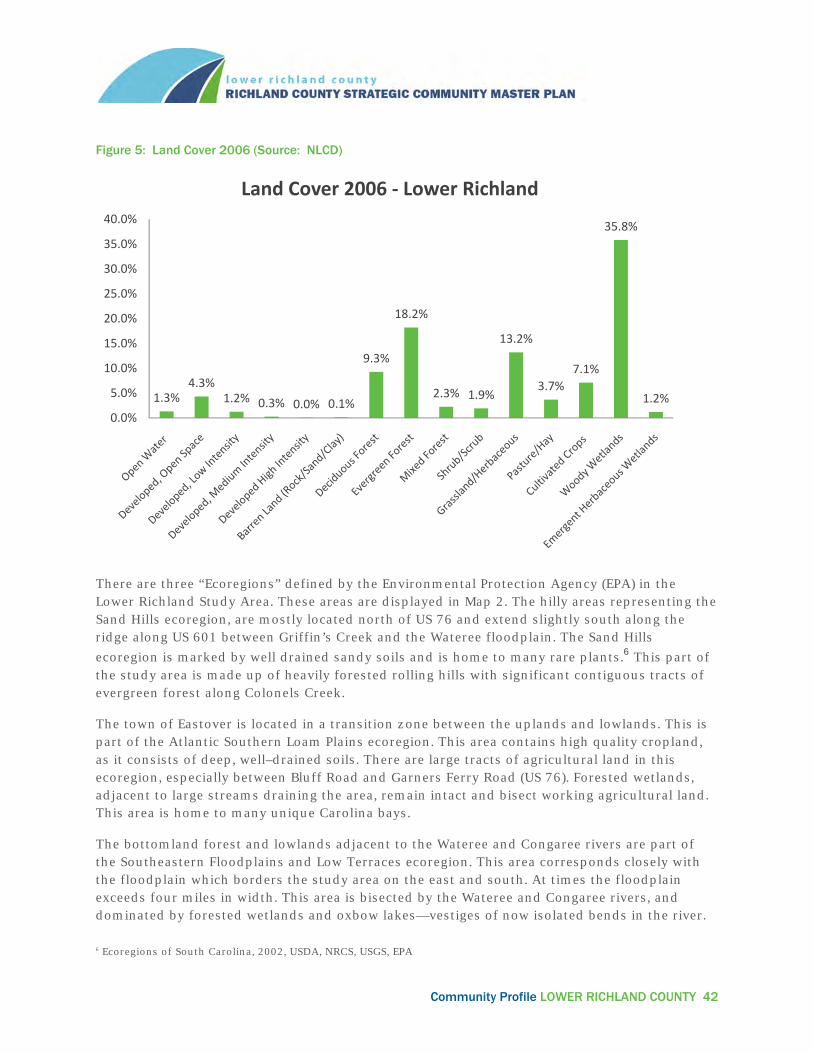
Community Profile LOWER RICHLAND COUNTY 42
Figure 5: Land Cover 2006 (Source: NLCD)
There are three “Ecoregions” defined by the Environmental Protection Agency (EPA) in the Lower Richland Study Area. These areas are displayed in Map 2. The hilly areas representing the Sand Hills ecoregion, are mostly located north of US 76 and extend slightly south along the ridge along US 601 between Griffin’s Creek and the Wateree floodplain. The Sand Hills
ecoregion is marked by well drained sandy soils and is home to many rare plants.6 This part of the study area is made up of heavily forested rolling hills with significant contiguous tracts of evergreen forest along Colonels Creek.
The town of Eastover is located in a transition zone between the uplands and lowlands. This is part of the Atlantic Southern Loam Plains ecoregion. This area contains high quality cropland, as it consists of deep, well–drained soils. There are large tracts of agricultural land in this ecoregion, especially between Bluff Road and Garners Ferry Road (US 76). Forested wetlands, adjacent to large streams draining the area, remain intact and bisect working agricultural land. This area is home to many unique Carolina bays.
The bottomland forest and lowlands adjacent to the Wateree and Congaree rivers are part of the Southeastern Floodplains and Low Terraces ecoregion. This area corresponds closely with the floodplain which borders the study area on the east and south. At times the floodplain exceeds four miles in width. This area is bisected by the Wateree and Congaree rivers, and dominated by forested wetlands and oxbow lakes—vestiges of now isolated bends in the river.
6 Ecoregions of South Carolina, 2002, USDA, NRCS, USGS, EPA
1.3%4.3%
1.2% 0.3% 0.0% 0.1%
9.3%
18.2%
2.3% 1.9%
13.2%
3.7%7.1%
35.8%
1.2%0.0%
5.0%
10.0%
15.0%
20.0%
25.0%
30.0%
35.0%
40.0%
Land Cover 2006 - Lower Richland

Community Profile LOWER RICHLAND COUNTY 43
Map 6: EPA Level IV Ecoregions

Community Profile LOWER RICHLAND COUNTY 44
Topography The northern part of the Study Area consists of rolling hills and bluffs. Many areas exceed 10% slope. Some bluffs even exceed 25% slope. The majority of the remainder of the Study Area consists of gently sloping lands of less than 5% slope. Map 7 illustrates the percent slope in the study area.
Hydrology and Soils The Lower Richland Study Area is divided into two main watersheds. The Northern and Eastern part of the study area drains eastward towards the Wateree River joining water from the Catawba River basin to the north which receives water from the South Carolina cities of Lancaster, Rock Hill, Fort Mill as well as Charlotte, North Carolina. Parts of the study area west of US 601 drain southward and enter the Congaree River which begins just west of Columbia at the confluence of the Saluda and Broad rivers. The Congaree watershed drains much of Upstate of South Carolina. At the Southeast corner of the Study Area the Congaree River and the Wateree River meet to form the Santee River which flows into Lake Marion, Lake Moultrie and eventually entering Charleston Harbor and the Atlantic Ocean.
The Lower Richland area is marked by a significant amount of surface water. There are 540 miles of streams in the study area. There are 61,358 acres of wetlands in Lower Richland. Wetlands constitute nearly 30% of the land area. Floodplain makes up 21% of the land area with the majority located along the Congaree River.
There are a few water bodies that are classified as 303d Impaired Waters. These include parts of the Congaree River (PathogenFecal Coliform), Cedar Creek (Impaired Macroinvertebrate Biota), Tom’s Creek (Fecal Coliform). Map 8 illustrates the hydrologic features in the study area.
HYDRIC SOILS
Hydric soils are those that under natural conditions are either saturated or inundated during the growing season. Typically occurring in wet, low lying areas, these soils can be an indication of hydrophytic vegetation and wetlands. Accordingly these areas are not ideal for building. Over half of the study area has soils that are considered Partially Hydric or All Hydric as illustrated in Map 9.

Community Profile LOWER RICHLAND COUNTY 45
Map 7: Percent Slope (Source: USGS NED)

Community Profile LOWER RICHLAND COUNTY 46
Map 8: Hydrology

Community Profile LOWER RICHLAND COUNTY 47
Map 9: Hydric Soils
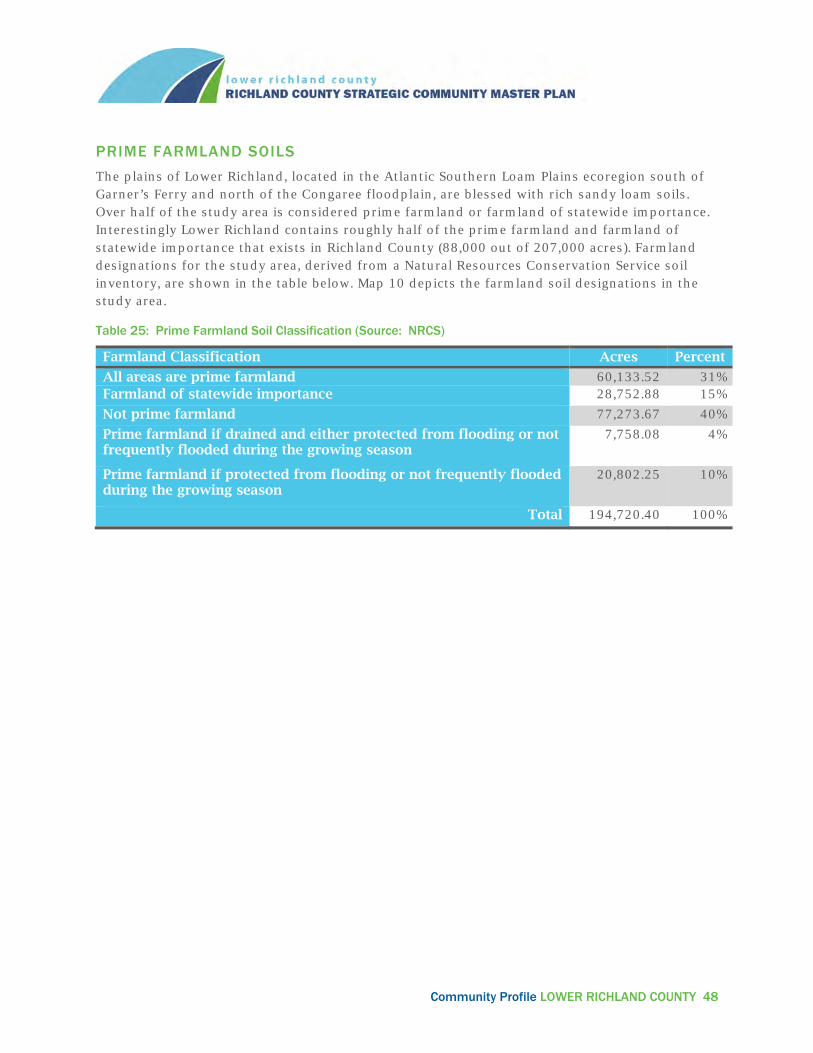
Community Profile LOWER RICHLAND COUNTY 48
PRIME FARMLAND SOILS
The plains of Lower Richland, located in the Atlantic Southern Loam Plains ecoregion south of Garner’s Ferry and north of the Congaree floodplain, are blessed with rich sandy loam soils. Over half of the study area is considered prime farmland or farmland of statewide importance. Interestingly Lower Richland contains roughly half of the prime farmland and farmland of statewide importance that exists in Richland County (88,000 out of 207,000 acres). Farmland designations for the study area, derived from a Natural Resources Conservation Service soil inventory, are shown in the table below. Map 10 depicts the farmland soil designations in the study area.
Table 25: Prime Farmland Soil Classification (Source: NRCS)
Farmland Classification Acres Percent
All areas are prime farmland 60,133.52 31%Farmland of statewide importance 28,752.88 15%
Not prime farmland 77,273.67 40%
Prime farmland if drained and either protected from flooding or not frequently flooded during the growing season
7,758.08 4%
Prime farmland if protected from flooding or not frequently flooded during the growing season
20,802.25 10%
Total 194,720.40 100%

Community Profile LOWER RICHLAND COUNTY 49
Map 10: Prime Farmland Designations (Source: NRCS)

Community Profile LOWER RICHLAND COUNTY 50
Unique Features & Habitats The Atlantic Southern Loam Plains ecoregion is home to a unique geological feature. Carolina bays, which are isolated oval depressions, dot the landscape. These bays often contain wetlands, though some have been drained for agricultural production. Where intact bays exist
they provide a unique habitat and may contain endangered or rare flora and fauna.7
The Congaree National Park is located in the study area. It encompasses 25,800 acres of wetlands and forest between Bluff Road and the Congaree River. It contains the largest
contiguous area of old-growth bottomland hardwood forest remaining in the United States.8 Most of the park is a federally designated wilderness area and offers visitors hiking, canoeing, and fishing opportunities. The park provides a refuge for a variety of terrestrial and aquatic species. These species also benefit from relatively intact forests and riparian corridors along major creeks draining farmland and forested habitats upstream.
The South Carolina GAP habitat model predicts a number of threatened and endangered species could be present in the study area. The following table lists these species.
Table 26: State or Federally Listed Species
Scientific Name Common Name Federally Listed Status
SC State Listed
Ambystoma cingulatum
Flatwoods Salamander Threatened Endangered
Rana capito Gopher Frog Endangered
Picoides borealis Red-cockaded Woodpecker
Endangered Endangered
Corynorhinus rafinesquii
Rafinesque's Big-eared Bat
Endangered
Hyla andersonii Pine Barrens Treefrog Threatened
Haliaeetus leucocephalus
Bald Eagle Threatened
Columbina passerina Common Ground-Dove Threatened
Clemmys guttata Spotted Turtle Threatened
7 Ecoregions of South Carolina, 2002, USDA, NRCS, USGS, EPA 8 National Park Service, U.S. Department of the Interior
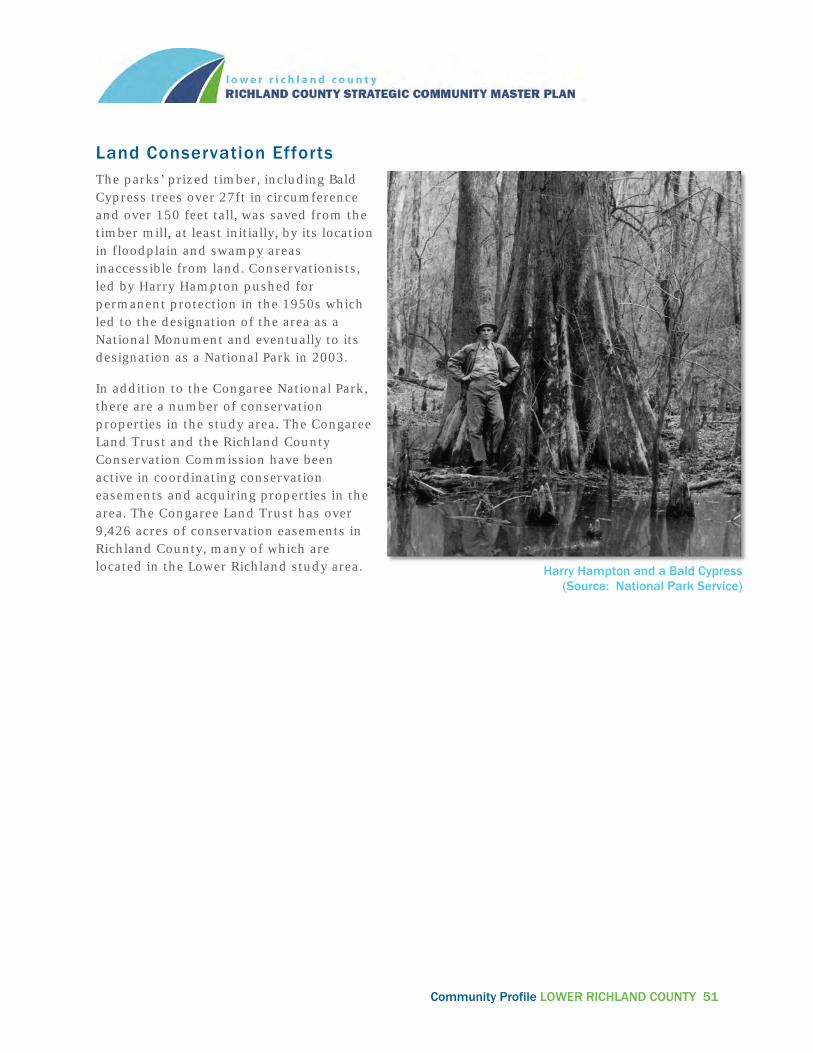
Community Profile LOWER RICHLAND COUNTY 51
Land Conservation Efforts The parks’ prized timber, including Bald Cypress trees over 27ft in circumference and over 150 feet tall, was saved from the timber mill, at least initially, by its location in floodplain and swampy areas inaccessible from land. Conservationists, led by Harry Hampton pushed for permanent protection in the 1950s which led to the designation of the area as a National Monument and eventually to its designation as a National Park in 2003.
In addition to the Congaree National Park, there are a number of conservation properties in the study area. The Congaree Land Trust and the Richland County Conservation Commission have been active in coordinating conservation easements and acquiring properties in the area. The Congaree Land Trust has over 9,426 acres of conservation easements in Richland County, many of which are located in the Lower Richland study area.
Harry Hampton and a Bald Cypress (Source: National Park Service)

Community Profile LOWER RICHLAND COUNTY 52
HISTORIC AND CULTURAL RESOURCES
There have been many reports, studies and books written on the history of the Lower Richland Area. It is a place with a rich heritage closely tied to the land. Today, efforts continue to preserve and protect the unique historic resources to educate future generations on the heritage and culture of Lower Richland.
Following the Civil War and Reconstruction, the State of South Carolina, “would become the only southern state to promote the redistribution of land for the benefit of freed men and women, as well as landless whites.” 9 This program, generally known as the Land Commission program, purchased over 9,000 acres of land from plantation owners in Richland County and redistributed lots ranging in size from 6 to 108 acres at an average price of $333.71.10 Today in Lower Richland, seven tracts of land remain in the families of the original purchasers. These include the Adams, Black Swamp, Diseker, Hickory Hill, Hopkins Hunt and O’Hanlon tracts.
With newly acquired lands, black families quickly established themselves and grew in terms of both influence and affluence. During the late 1800s, Lower Richland had the most population in the County second to Columbia.11 Along with the new farms, more families began to settle around the existing rail line connecting Columbia to the coast. Kingville, Acton, Eastover, Gadsden, Hopkins and Wateree all become centers of activity complete with post offices, merchants, schools, churches and other small agriculture based operations. Kingville, by far, was the most prominent and prosperous of the Lower Richland communities12. Schools and churches were the centers of community life. This tradition continues as many of the original families of Lower Richland are fourth and fifth generation teachers and pastors.
The Southeast Rural Community Outreach (SERCO) organization has identified and documented many of the historic buildings and landmarks in the study area. Map 11 illustrates the historic and cultural resources of Richland County.
Two of the most celebrated buildings in Lower Richland County are the Harriet Barber House and Kensington Mansion. A brief description of each follows:
9 Prized Pieces of Land: The Impact of Reconstruction on African-American Land Ownership in Lower Richland County, South Carolina 10 Prized Pieces of Land: The Impact of Reconstruction on African-American Land Ownership in Lower Richland County, South Carolina 11 Prized Pieces of Land: The Impact of Reconstruction on African-American Land Ownership in Lower Richland County, South Carolina 12 Adams, Marie Barber and Brooks, Deborah Scott, African Americans of Lower Richland County.

Community Profile LOWER RICHLAND COUNTY 53
Kensington Mansion- (excerpt from the website)
Matthew Richard Singleton (1817-1854) completed Kensington Mansion in 1854. The house stands on what was known as Headquarters Plantation on the Wateree River in Richland County, directly across the river from the Singleton family seat in Sumter County.
Charleston architects Edward C. Jones and Francis D. Lee designed Kensington Mansion. It has 29 rooms and 12,000 square feet of floor space. The raised basement contains a massive cistern that held 10,000 gallons of water for household use. The original kitchen building stands beside the main house. Jacob Stroyer (1848-1909), who was enslaved on the plantation, documented antebellum life here in his memoir My Life in the South, first published in 1879.
Robert Pickett Hamer (1863-1911) purchased Kensington Plantation in 1910. His son, Robert Cochrane Hamer, and his family lived here until 1941 when the U. S. government purchased the property. After World War II, the government sold the land and it eventually became a dairy farm.
During the middle part of the twentieth century, the house fell into disrepair. It was unoccupied for many years and was finally used as a storage building for grain and farm supplies.
International Paper, formerly Union Camp, acquired the Kensington Mansion in 1981 and restored the house to its former glory. The Scarborough-Hamer Foundation furnished the mansion in 1996 with antiques from the Scarborough, Hamer, and related families.
Source: www.kensingtonmansion.org/history

Community Profile LOWER RICHLAND COUNTY 54
Harriet Barber House-(excerpt from the website)
The Barber House, according to family tradition, was constructed ca. 1880 and expanded in the early twentieth century. It is significant for its association during the late nineteenth century with the South Carolina Land Commission, a unique attempt by a southern state to give freedmen the opportunity to own land. Although many freedmen eventually lost their land, the land on which the Barber House is located has remained in the same family since 1872. The numerous additions made to the house in the early twentieth century reflect the growing prosperity of this black family in the years after the Civil War.
In 1872 Samuel Barber, a former slave, purchased lot number 35, which contained forty-two and one-half acres of the Hopkins Tract, one of six tracts in Lower Richland County purchased by the South Carolina Land Commission for redistribution. In 1879 his wife, Harriet, also a former slave, made the final payment and received title to the property. According to the 1880 census, the family was farming approximately twenty-four acres of the land; two acres were planted in Indian corn and twenty-two were planted in cotton. The farm included one mule and one working ox. According to family tradition, Samuel Barber founded St. John's Baptist Church near Hopkins.
After the deaths of Samuel Barber in 1891 and Harriet Barber in 1899, their son John and his wife Mamie Holly lived in the house, where they raised eleven children. In addition to farming the property, John Barber was a public school teacher for approximately forty-five years and a Baptist preacher for over sixty-years. Since John Barber's death in 1957, the house has remained in the possession of the Barber family and is currently used as a teaching tool to show groups a glimpse from the past.
Source: www.harrietbarberhouse.org

Community Profile LOWER RICHLAND COUNTY 55
Map 11: Historic and Cultural Resources
Community Profile LOWER RICHLAND COUNTY 56
Appendix 2: Methodology Table 1: Population Projections, Source: ESRI 2012 Table 2: Ethnic Composition, Source: U.S. Bureau of the Census, 2010 Census of Population and Housing. Table 3: Population Density, Source: U.S. Bureau of the Census, 2010 Census of Population and Housing. Table 4: Median Household Income, Source: U.S. Bureau of the Census, 2010 Census of Population and Housing. Table 5: Income Distribution, Source: U.S. Bureau of the Census, 2010 Census of Population and Housing. Table 6: Establishments by type, Source: ReferenceUSA. (2009). Crawford Textiles Company Inc. profile. Retrieved Nov 29, 2012, from http://www.referenceusa.com/. Table 7: Employment by Industry, Source: ESRI 2012 Table 8: Residential Home Values, Source: Richland County Assessor’s Office, 2012 Table 9: Residential Scenarios Population Growth -- Source: ESRI 2012 Household Size -- Source: ESRI 2012 Residential Units estimated by dividing population by household size Number of Single-family units estimated based on % Owner-Occupied in study area -- Source: ESRI 2012 Number of Multi-family units estimated based on % Renter-Occupied in study area -- Source: ESRI 2012 Table 10: Residential Scenarios High Growth Population Growth -- Source: Miley & Associates, Inc. (50% above that of ESRI) Household Size -- Source: ESRI 2012 Residential Units estimated by dividing population by household size Number of Single-family units estimated based on % Owner-Occupied in study area -- Source: ESRI 2012 Number of Multi-family units estimated based on % Renter-Occupied in study area -- Source: ESRI 2012 Table 11: Potential Annual Retail Spending 2030 Richland County Retail spending from DemographicsNOW was adjusted to Lower Richland area based on relative median income relationship in the study area vs. Richland County median income. Richland County retail spending of $31,670 per household was adjusted downward by

Community Profile LOWER RICHLAND COUNTY 57
21% to reflect the lower income in the study area resulting in an average household retail spending in the Lower Richland area of $25,109. Source: Retail spending data are from DemongraphicsNow. See http://libguides.bentley.edu/content.php?pid=176859&sid=1491141

40 : FINAL REPORT Lower Richland

FINAL REPORT Lower Richland : 39
Appendix C: NOTES FROM COMMUNITY MEETINGS
lower r ich land countyRICHLAND COUNT Y STRATEGIC COMMUNIT Y MASTER PLAN

1
MEETING NOTES
DATE Tuesday, January 29, 2013
PURPOSE Meeting for the Strategic Community Master Plan for Lower Richland
LOCATION Crossroads Community Center GENERAL COMMENTS:
Amusement park/petting zoo/farmer's market Swamp (create a swan lake) Water transportation/Ferry Botanical Garden/Clemson Extension- Working together Visitor's Center--Transportation Bicycle Riding Trails- create jobs; something for kids to do Horse Academy- trail riding Congaree Park--paddle boats; Clean-up park; picnic tables; nature trails Camp Site Area: Boy Scouts; Boys/Girls Clubs; Schools Bed and Breakfasts Connections to the river Trail along 601 (Palmetto Trail) Testing for ore along 601 (whole stretch)---Any results?----Community does not know of any Old building near Kingsville Mansion and the railroad track right off of 601
o Is it used? Can we utilize it? Precdent: Germantown in Georgia= kept habitat and history Blue Johnson is right before Harron Hill (next to Huntington Club) Time frame for utilities (sewer, street lights) Trash (Litter) big issue (possible signage) Signage/Monumentation for smaller neighborhoods Increase Patrol- (Burglaries in daytime) Hospitals (Beds/Full Service) Sewer & Water (very important) Sub/Stations- Police and Fire-Closer Road Maintenance Need shoulders on roads(no room to pull over car) may be utilized by bike's/walking, etc. (does
not need to be paved) Farmer's Market-permanent stand FYI-Duke has a community health program oriented toward rural health communities--need to
have one here. Sidewalks on Rabbit Run to Lower Richland Boulevard at High School (need lighting) Developers need to be monitored and meet standards Architects and Landscaper's don't cut trees Low Income Housing plans--heard some were coming Concern: Lower property value Need medical facilities- Not just urgent care at Lowe's; at Gardner's Ferry Park -Playground; Tot Area; Wood Chips & Sand Problem Need padded foam, or if not, rubber mulch Playground w/ facilities for under 5 yrs. old--Tots Park Area- (i.e. "soft crete") Upgrade to SE Park (more facilities & Rehab)

2
Check on future landfill What is allowed in rural residential?
-shooting ranges allowed (CWP training) -times ? (10pm)---is there a noise ordinance? -Restrictions on shooting in certain proximity to residential -Mobile homes
ACUZ? '95 Small scale farming vs. large, mass productive Farming not viable Want to sell land for residential development Need more industrial sites Lower Richland is NOT dumping ground for Low Income Developments Ramps/Storage for boats/Kayaks near Congaree Restaurants for park visitors Improve and/or maintenance South Cedar Creek Stay rural from Cate Road to Gardner's Ferry Road PROMOTE AG- Get Clemson more involved; AG production Quality of education system---parental involvements Appropriate Water & Sewar to accommodate housing County needs to be more proactive with developers
- sidewalk to school - aesthetic standard - preserve as much resources (trees) in development - safe routes for kids to walk to school
Need more community facility (i.e. business, restaurants, senior activities) What is going on with the green diamond? What is going on with Walgreen's/CVS (Burnside Farms) ?? What is happening on McGregor property? MUNGO owns it? More police service ----Thompson Harris Cable service provision
TRANSPORTATION
What about widening Lower Richland Boulevard? What about sidewalks on Lower Richland Boulevard? What about bus transportation coming out further near Lower Richland School TRAFFIC SPEED --Calm it down Widening of Gardner's Ferry Road to include turning lanes(appropriate) and/or U-TURN lanes Wildcat Road to be re-open to address the traffic on Leesburg Road Bus stops & extension of service for the Lower Richland area & Seniors Increase public transportation (i.e. rail service) Within 20 years, public transportation should be regular to downtown, shopping centers, and the
eateries Preston--wider lane (dirt road) direction to golf facility (www.goldenpinesgolf.com) Shuttle service to local recreation sites Lower speed limit is needed on Lower Richland between Leesburg and Gardner's Ferry Road Sidewalk would be help for students from Lower Richland who practice running on Lower
Richland from Leesburg Public Transportation is needed (especially in the convenience of seniors who no longer drive)

40 : FINAL REPORT Lower Richland

FINAL REPORT Lower Richland : 41
Appendix D: IMPLEMENTATION MATRIX
lower r ich land countyRICHLAND COUNT Y STRATEGIC COMMUNIT Y MASTER PLAN

1
Community Profile lower richland County
Subu
rban
Are
a
Incorporate the recommendations from the Southeast Richland Neighborhood Master Plan (SERN) into the Lower Richland Strategic Community Master Plan.
Richland County Planning & Development Services
Short term
Invest in projects that improve driver awareness along Garners Ferry. Richland County Public Works Richland County Planning & Development, Services SCDOT
Short term
Identify and prioritize sidewalk and greenway connections to existing community facilities such as the Lower Richland High School and Garners Ferry Sports Complex.
Richland County Public Works Richland County Planning & Development Services, RCCC, SCDOT
Short term
Promote a variety of housing types including townhomes and apartments. Richland County Planning & Development
Mid term
Provide additional utility service to increase service reliability and capacity. Richland County Utilities Department Richland County Planning & Development Services, City of Columbia
Mid term
Promote development that is respectful of existing neighborhoods, as well as natural, agri-cultural and historic resources.
Richland County Planning & Development
Richland County Conservation Commission, Richland Soil & Water Con-servation District
Short term
Rura
l Res
iden
tial A
reas
Improve intersections to enhance mobility and safety along main corridors. Richland County Public Works Richland County Planning & Development Services
Mid term
Identify and prioritize sidewalk and greenway connections to existing community facilities such as schools and parks.
Richland County Public Works Richland County Planning & Development Services
Short term
Ensure housing is safe, energy-efficient and accessible. Richland County Planning & Development Services
Richland County Office of Sustainability Mid term
Identify and protect critical natural assets and wetlands including Carolina Bays. Richland County Planning & Development Services
Richland County Conservation Commission, Richland Soil & Water Con-servation District
Short term
Consider developing buffers around key historic and cultural assets to protect the integrity of the site.
Richland County Planning & Development Services
Richland County Conservation Commission
Short term
Identify vacant and blighted structures and determine appropriate courses of action to ensure community health and safety.
Richland County Planning & Development Services
Mid term
Mili
tary
Zon
es
Partner with the JLUS Implementation Team to develop Comprehensive Plan language to promote community/military coordination.
Richland County Planning & Development Services
Midlands Area Joint Installation Consortium (MAJIC)
Short term
Incorporate JLUS Implementation Plan recommendations for the identified areas of concern around Fort Jackson, Camp McCrady and McEntire JNGB.
Richland County Planning & Development Services
Midlands Area Joint Installation Consortium (MAJIC)
Short term
Incorporate JLUS Implementation Plan recommendations for the areas of concern around Fort Jackson
Richland County Planning & Development Services
Midlands Area Joint Installation Consortium (MAJIC)
Short term
Keep residential density very low in these areas to reduce nuisance conflicts between neighborhood residents and military operations.
Richland County Planning & Development Services
Midlands Area Joint Installation Consortium (MAJIC)
Short term
Implementation Matrix
Milestones Lead Group Other Partners Timeline
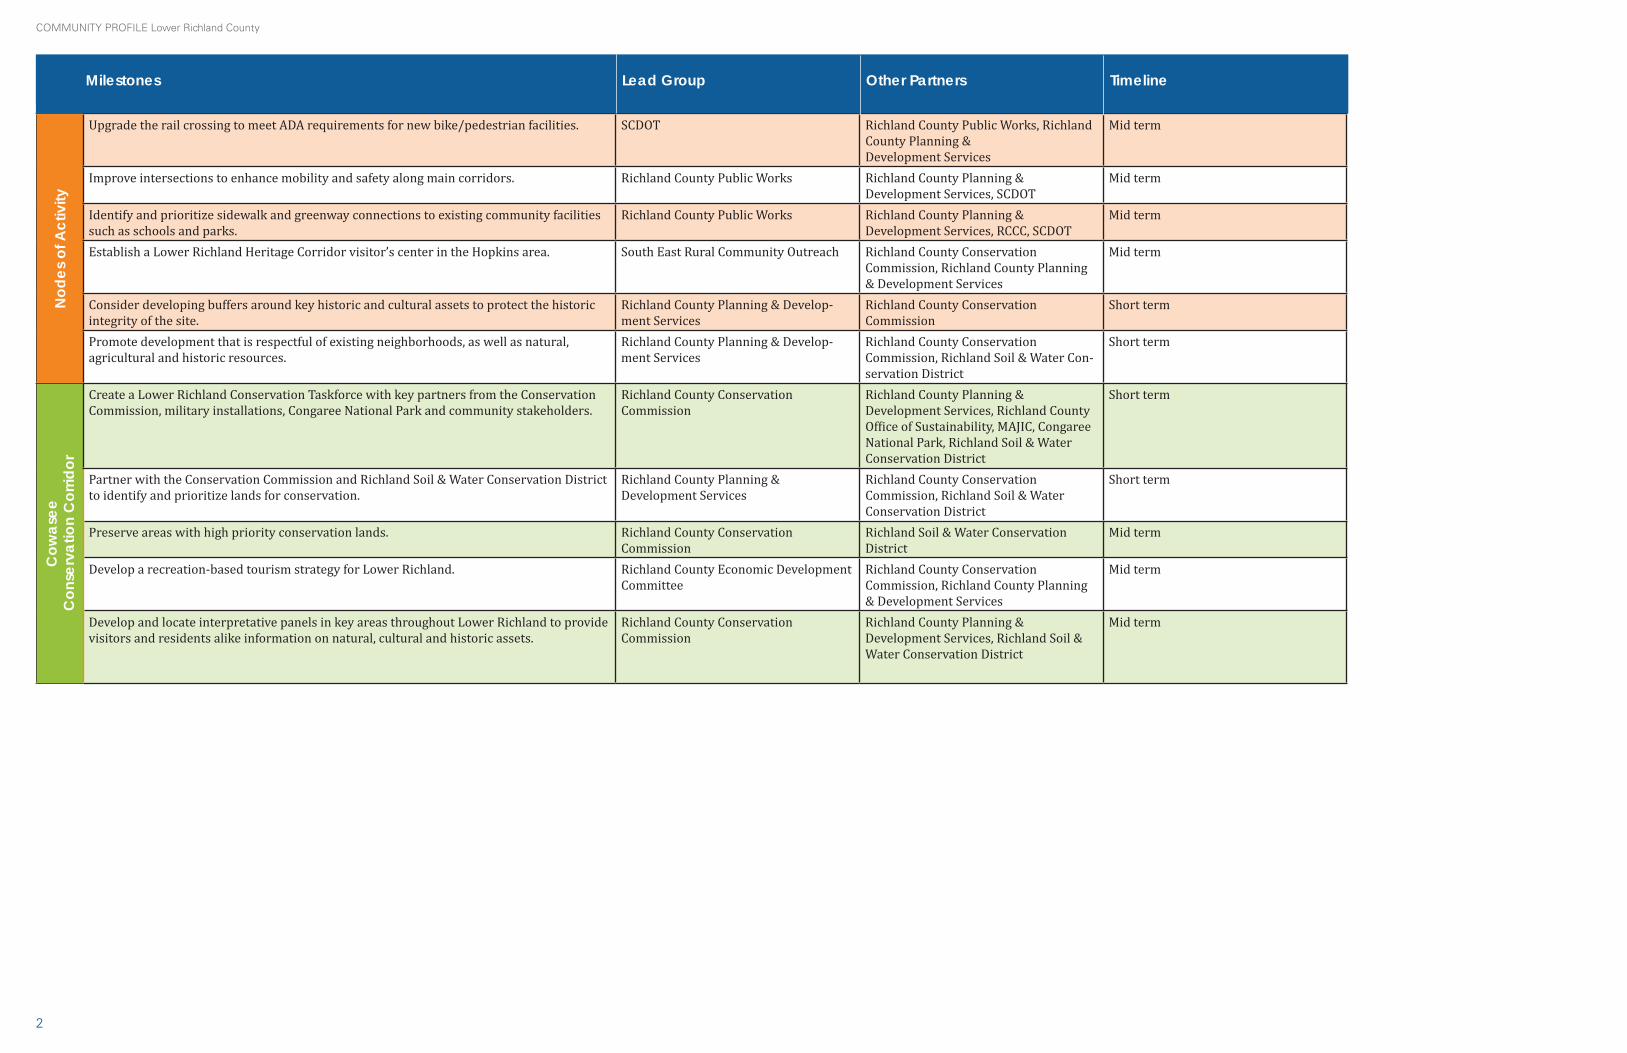
2
Community Profile lower richland County
Nod
es o
f Act
ivity
Upgrade the rail crossing to meet ADA requirements for new bike/pedestrian facilities. SCDOT Richland County Public Works, Richland County Planning & Development Services
Mid term
Improve intersections to enhance mobility and safety along main corridors. Richland County Public Works Richland County Planning & Development Services, SCDOT
Mid term
Identify and prioritize sidewalk and greenway connections to existing community facilities such as schools and parks.
Richland County Public Works Richland County Planning & Development Services, RCCC, SCDOT
Mid term
Establish a Lower Richland Heritage Corridor visitor’s center in the Hopkins area. South East Rural Community Outreach Richland County Conservation Commission, Richland County Planning & Development Services
Mid term
Consider developing buffers around key historic and cultural assets to protect the historic integrity of the site.
Richland County Planning & Develop-ment Services
Richland County Conservation Commission
Short term
Promote development that is respectful of existing neighborhoods, as well as natural, agricultural and historic resources.
Richland County Planning & Develop-ment Services
Richland County Conservation Commission, Richland Soil & Water Con-servation District
Short term
Cow
asee
C
onse
rvat
ion
Cor
ridor
Create a Lower Richland Conservation Taskforce with key partners from the Conservation Commission, military installations, Congaree National Park and community stakeholders.
Richland County Conservation Commission
Richland County Planning & Development Services, Richland County Office of Sustainability, MAJIC, Congaree National Park, Richland Soil & Water Conservation District
Short term
Partner with the Conservation Commission and Richland Soil & Water Conservation District to identify and prioritize lands for conservation.
Richland County Planning & Development Services
Richland County Conservation Commission, Richland Soil & Water Conservation District
Short term
Preserve areas with high priority conservation lands. Richland County Conservation Commission
Richland Soil & Water Conservation District
Mid term
Develop a recreation-based tourism strategy for Lower Richland. Richland County Economic Development Committee
Richland County Conservation Commission, Richland County Planning & Development Services
Mid term
Develop and locate interpretative panels in key areas throughout Lower Richland to provide visitors and residents alike information on natural, cultural and historic assets.
Richland County Conservation Commission
Richland County Planning & Development Services, Richland Soil & Water Conservation District
Mid term
Milestones Lead Group Other Partners Timeline

3
Community Profile lower richland County
Agr
icul
tura
l Are
a
Protect prime farmland soils and soils of statewide importance. Richland Soil & Water Conservation District
Clemson Cooperative Extension , Richland County Planning & Development Services, Richland County Office of Sustainability, NRCS
Short term
Preserve existing farmlands for active agriculture use. Richland Soil & Water Conservation District
Clemson Cooperative Extension, Richland County Planning & Development Services, Richland County Office of Sustainability, NRCS
Mid term
Promote farming as a viable occupation and way of life for current and future generations. Richland Soil & Water Conservation District
Clemson Cooperative Extension, Richland County Planning & Development Services, Richland Soil & Water Conservation District , Richland County Office of Sustainability, NRCS
Mid term
Host a Lower Richland Heritage Farm Tour Day. Richland Soil & Water Conservation District
Clemson Cooperative Extension, Richland County Conservation Commission, NRCS
Short term
Expand the market for locally-grown, locally-produced goods. Richland Soil & Water Conservation District
Clemson Cooperative Extension, Richland County Planning & Development Services, SC Department of Agriculture, Richland County Office of Sustainability
Mid term
Consider creating a Lower Richland brand for locally-grown, locally-produced goods. Richland Soil & Water Conservation District
Clemson Cooperative Extension, Richland County Planning & Development Services, Richland County Office of Sustainability, SCDA
Mid term
Partner with City Roots to promote a local Community Supported Agriculture Program (CSA) in area communities.
Richland Soil & Water Conservation District
Richland County Planning & Development Services, Clemson Cooperative Extension, SC Department of Agriculture
Short term
Tran
spor
tatio
n
Provide more transit options in Lower Richland. Central Midlands Regional Transit Authority (CMRTA)
Richland County Public Works , Richland County Planning & Development Ser-vices
Long term
Provide safe bicycle and pedestrian connections. Richland County Public Works Richland County Planning & Development Services, SCDOT
Mid term
Improve intersections along key east-west corridors. Richland County Public Works Richland County Planning & Development Services, SCDOT
Mid term
Evaluate and prioritize paving of county-maintained roads. Richland County Public Works Richland County Planning & Development Services
Short term
Improve driver’s awareness. Richland County Public Works Richland County Planning & Develop-ment Services & Development, SCDOT
Mid term
Improve safety at rail crossings. SCDOT Richland County Planning & Development Services
Mid term
Milestones Lead Group Other Partners Timeline
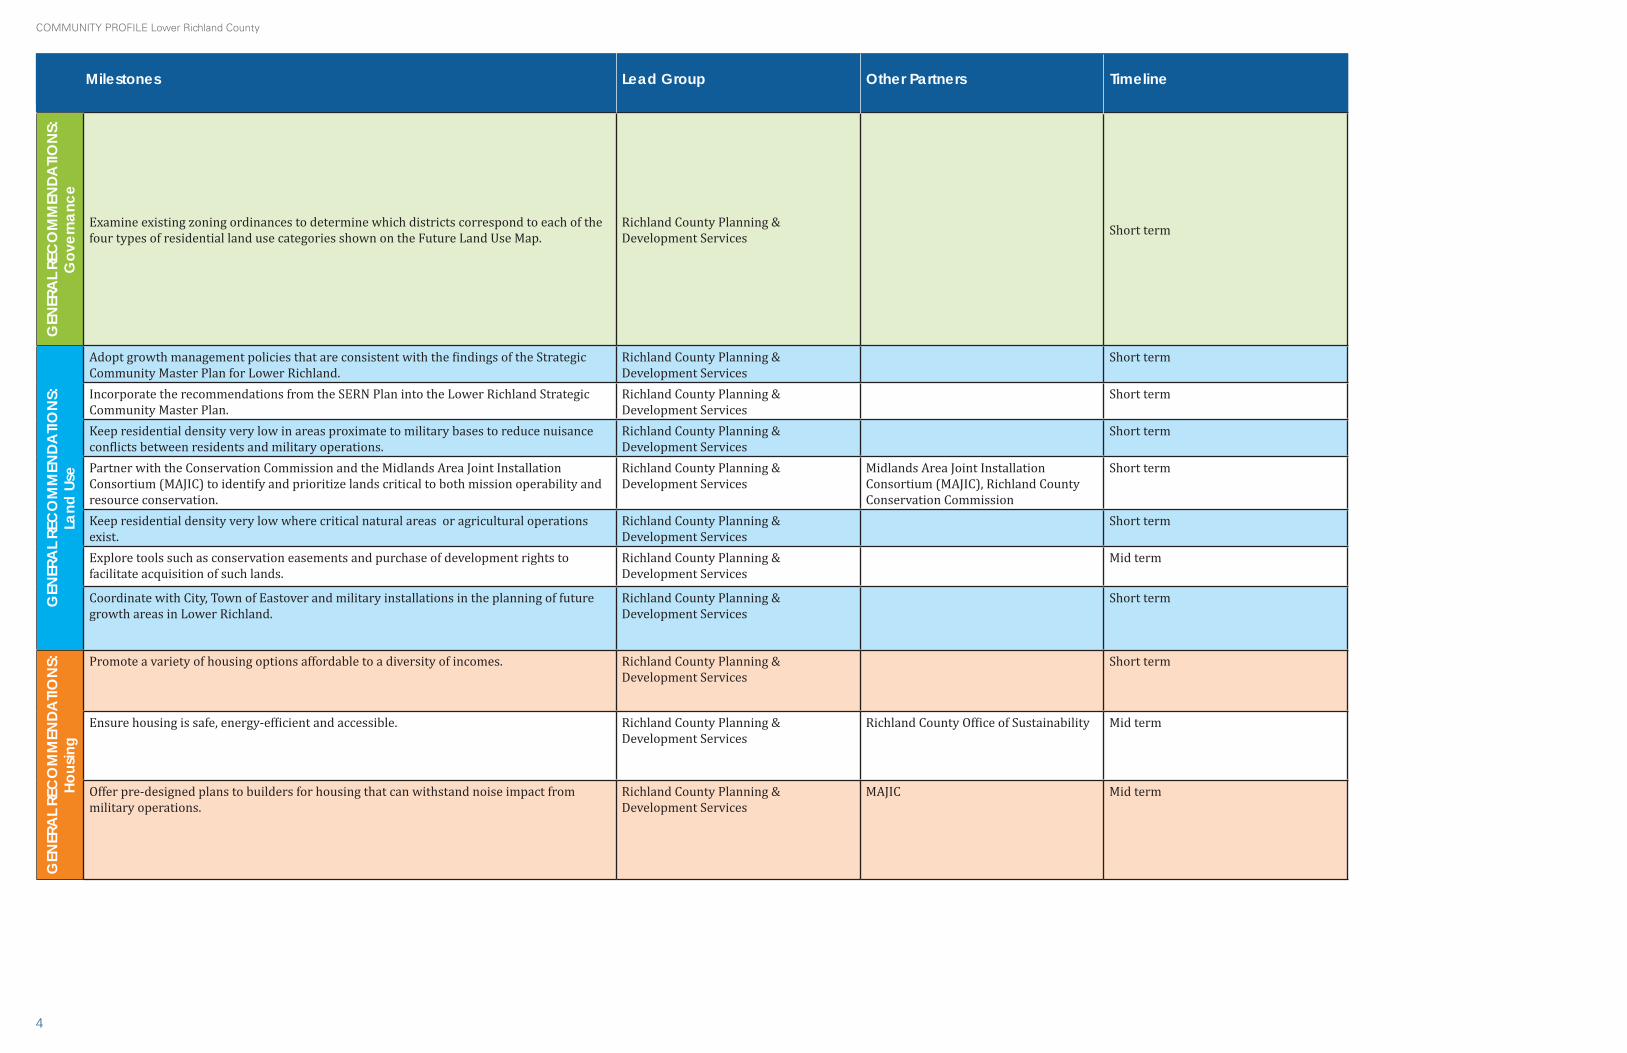
4
Community Profile lower richland County
GEN
ERA
L REC
OM
MEN
DATIO
NS:
G
over
nanc
e
Examine existing zoning ordinances to determine which districts correspond to each of the four types of residential land use categories shown on the Future Land Use Map.
Richland County Planning & Development Services Short term
GEN
ERA
L RE
CO
MM
ENDA
TION
S:
Land
Use
Adopt growth management policies that are consistent with the findings of the Strategic Community Master Plan for Lower Richland.
Richland County Planning & Development Services
Short term
Incorporate the recommendations from the SERN Plan into the Lower Richland Strategic Community Master Plan.
Richland County Planning & Development Services
Short term
Keep residential density very low in areas proximate to military bases to reduce nuisance conflicts between residents and military operations.
Richland County Planning & Development Services
Short term
Partner with the Conservation Commission and the Midlands Area Joint Installation Consortium (MAJIC) to identify and prioritize lands critical to both mission operability and resource conservation.
Richland County Planning & Development Services
Midlands Area Joint Installation Consortium (MAJIC), Richland County Conservation Commission
Short term
Keep residential density very low where critical natural areas or agricultural operations exist.
Richland County Planning & Development Services
Short term
Explore tools such as conservation easements and purchase of development rights to facilitate acquisition of such lands.
Richland County Planning & Development Services
Mid term
Coordinate with City, Town of Eastover and military installations in the planning of future growth areas in Lower Richland.
Richland County Planning & Development Services
Short term
GEN
ERA
L RE
CO
MM
ENDA
TION
S:
Hous
ing
Promote a variety of housing options affordable to a diversity of incomes. Richland County Planning & Development Services
Short term
Ensure housing is safe, energy-efficient and accessible. Richland County Planning & Development Services
Richland County Office of Sustainability Mid term
Offer pre-designed plans to builders for housing that can withstand noise impact from military operations.
Richland County Planning & Development Services
MAJIC Mid term
Milestones Lead Group Other Partners Timeline

42 : FINAL REPORT Lower Richland

FINAL REPORT Lower Richland : 43
Appendix E: LIST OF INTERSECTION IMPROVEMENTS
lower r ich land countyRICHLAND COUNT Y STRATEGIC COMMUNIT Y MASTER PLAN

Intersection Improvements: Intersection improvements have been identified along the main east‐west corridors within the study area. Improvements to these intersections will improve mobility and safety along these corridors. The lanes will assist in reducing the chances of rear‐end traffic crashes by separating turning vehicles and through traffic with dedicated turning lanes. Along with the addition of dedicated turn lanes, the use of pavement messaging identify turn lanes will increase the safety awareness along the corridor. Intersection improvements for each corridor include: Bluff Road –
Lower Richland Blvd o Eastbound left turn lane o Westbound right turn lane
Old Bluff Rd o Eastbound right turn lane o Westbound left turn lane
Martin Luther King Blvd o Eastbound left turn lane o Westbound left turn lane
Clarkson Rd o Eastbound left turn lane o Westbound left turn lane
Congaree Rd o Eastbound left turn lane o Westbound right turn lane
Griffin Creek Rd o Eastbound left turn lane o Westbound left turn lane
Kingville Rd o Eastbound right turn lane o Westbound left turn lane
Poultry Ln o Eastbound right turn lane o Westbound left turn lane
Joe Collins Rd o Eastbound right turn lane o Westbound left turn lane
Reynolds Rd/Jennie Collins o Eastbound left turn lane o Westbound left turn lane
Garners Ferry –
Garners Ferry Sports Complex o Eastbound left turn lane o Westbound right turn lane
Lower Richland Road o Road messaging for left turn lane o Right turn lane
Harmon Road (SR 86)

o Right turn lane (westbound)
Congaree Road (SR 40) o Road messaging for right turn lane (eastbound) o Lengthen the median cut to the east to o Add left turn lane (westbound)
Blue Johnson Road o Road messaging for left turn lane (eastbound) o Right turn lane (westbound)
Fox Run Dr o Road messaging for left turn lane (eastbound) o Right turn lane (westbound)
Crossing Creek Road o Road messaging for left turn lane (westbound)
Arnold Road o Right turn lane (westbound)
Old Congaree Run ‐ Need to coordinate with R L Coward Road o Right turn lane (eastbound) o Left turn lane (westbound)
R L Coward Road ‐ Need to coordinate with Old Congaree o Right turn lane (westbound) o Left turn lane (eastbound)
Leesburg Road
Lower Richland Blvd o Right turn lane (eastbound) o Left turn lane (westbound)
James Bowden/Greenlake Drive o Right turn lane (eastbound) o Left turn lane (westbound)
Mt. Elon Church Road o Right turn lane (eastbound) o Left turn lane (westbound)
Harmon Road (SR 86) o Right turn lane (eastbound) o Left turn lane (westbound)
Congress Road o Right turn lane (eastbound) o Left turn lane (westbound)