location selection and plant layout - darshan.ac.in institute of engineering & technology,...
TRANSCRIPT

Department of Mechanical Engineering Prepared By: Hardik B. Joshi Darshan Institute of Engineering & Technology, Rajkot Page 1.1
1 Location Selection and Plant Layout
Course Contents
1.1 Nature of Location Decision
1.2 Importance of Location 1.3 Dynamic Nature of Plant
Location 1.4 Choice of Site For Location 1.5 Urban, Suburban and Rural
Location 1.6 Plant Layout
1.7 Principles of Plant Layout 1.8 Factors Influencing Layout
1.9 Types of Layout 1.10 Plant Layout Procedure
1.11 Material Flow Patterns 1.12 Tools And Techniques For Plant
Layout
1.13 Different Plant Layouts 1.14 Computerized Package For
Layout Analysis
1. Location Selection and Plant Layout Industrial Engineering (2161907)
Prepared by: Hardik B. Joshi Department of Mechanical Engineering Page 1.2 Darshan Institute of Engineering & Technology, Rajkot
1.1 Nature of Location Decision Plant location is an important decision which decides the fate of the business. In the
past, much importance was not given to the selection of appropriate location and the
decisions in this regard were mainly governed by the individual preferences of the entrepreneurs and social customs. This resulted in failure of many organisations which
otherwise could have been successful.
Government also became instrumental in the selection of location for various industries in undeveloped areas by providing various investment benefits and other incentives with the objective of industrialists to follow a more scientific and logical
approach towards the selection of site for establishing their industries.
The degree of significance for the selection of location for any enterprise mainly depends on its size and nature. Sometimes, the nature of the product itself suggests some suitable location.
A small scale industry mainly selects the site where in accordance with its capacity, the local market is available for its products. It can easily shift to other place when there is any change in the market. But for large scale industries requiring huge amount of investment there are many considerations other than the local demand in the selection of proper plant location. These plants cannot be easily shifted to other place and an error of judgment in the selection of site can be very expensive to the organisation.
1.2 Importance of Location The selection of location is an important activity for the success of the business and
requires careful analysis. The selection of location is of prime importance both for new and already established enterprises.
The choice of location is vital for any new firm for its success. Because fundamental objective of an enterprise is to maximize its profit which can be done either by
increasing sales or by reducing cost of production.
Selection of appropriate location is important due to the following reasons : 1) Natural or climatic conditions. 2) Availability and nearness to the sources of raw material. 3) Transport costs-in obtaining raw material and also distribution or marketing
finished products to the ultimate users. 4) Access to market: small businesses in retail or wholesale or services should be
located within the vicinity of densely populated areas. 5) Availability of Infrastructural facilities such as developed industrial sheds or
sites, link roads, nearness to railway stations, airports or sea ports, availability of electricity, water, public utilities, civil amenities and means of
communication are important, especially for small scale businesses. 6) Availability of skilled and non-skilled labour and technically qualified and
trained managers. 7) Banking and financial institutions are located nearby. 8) Locations with links: to develop industrial areas or business centers result in
savings and cost reductions in transport overheads, miscellaneous expenses.
9) Strategic considerations of safety and security should be given due importance.

Industrial Engineering (2161907) 1. Location Selection and Plant Layout
Department of Mechanical Engineering Prepared by: Hardik B. Joshi Darshan Institute of Engineering & Technology, Rajkot Page 1.3
10) Government influences: Both positive and negative incentives to motivate an
entrepreneur to choose a particular location are made available. Positive includes cheap overhead facilities like electricity, banking transport, tax relief, subsidies and liberalization. Negative incentives are in form of restrictions for setting up industries in urban areas for reasons of pollution control and
decentralization of industries. 11) Residence of small business entrepreneurs want to set up nearby their
homelands. The need for selection of suitable site or location to house the factory/plant may arise
in the following: a) While starting a new factory/enterprise.
b) During the expansion of the existing plant. c) When the existing plant is to be relocated at some other place to remove its draw
back or to gain the benefits of still better location.
1.3 Dynamic Nature of Plant Location There is nothing like permanent good location. In reality no location can be considered
unique and can remain good for ever.
The business uncertainty and dynamism may convert a good location of today into an
inferior one of tomorrow and vice versa. Location study thus requires constant monitoring.
Thus the problem of decision to move or to stay at a particular location is always before the management specially when some expansion programme is undertaken.
The shift of the location of plant to some other place is known as relocation. The relocation of plant may be necessary dug to following reasons :
1) Shift in the structure of the market or movement of markets. 2) Changes in the nature and costs of transportation.
3) Changes in the costs and availability of raw-materials. 4) Change in the pricing policy of the enterprise.
5) Undesirable labour situation. 6) Non-availability of labour, rise in labour costs, changes in other factors etc.
7) Demolition, compulsory purchase of premises or national legislation. 8) Relocation of various associated industries and plants.
9) Scientific discoveries/developments, new field of technology, increasing competition etc.
1.4 Choice of Site For Location The problem of site selection of a factory can be solved in the following three stages:
1) Selection of the region.
2) Selection of the locality, 3) Selection of actual site.
1) Selection of the region Generally, the geographical area is divided on the basis of natural regions or political
boundaries within the nation (for example, Maharashtra State, Gujarat State, U.P. State etc.). The suitability of various regions are considered on the basis of
comparative cost advantages available out of the possible regions. Some of the major considerations in selecting the region.
a) Availability and proximity of raw-materials,

1. Location Selection and Plant Layout Industrial Engineering (2161907)
Prepared by: Hardik B. Joshi Department of Mechanical Engineering Page 1.4 Darshan Institute of Engineering & Technology, Rajkot
b) Vicinity of the market,
c) Labour supply d) Climatic conditions
2) Selection of the Locality.
After selecting the region, the specific locality within the region is considered. Generally, following alternatives are open in selecting the locality. a) Urban area. b) Rural area.
c) Suburban area in the vicinity of the urban area. The comparative advantages of each locality are considered at this stage.
The following factors must be considered while selecting the location of the factory : 1. Availability of Raw-materials. 2. Proximity to markets. 3. Availability of labour.
4. Transport and communication facilities. 5. Availability of power and fuel.
6. Climatic conditions. 7. Availability of water.
8. Ancillary Industries. 9. Financial and other aids.
10. Business and commercial facilities.
1. Availability of Raw-Material. (Nearness to supply of raw-material).
As far as possible the site selected should be near the source of raw-materials, so that the cost of transportation can be minimized and the storing cost can be reduced due to shorter lead time.
If the raw-materials are heavy and bulky or cheap but looses a good amount of weight during processing, it becomes essential to select a site near to the source of raw-material. For example, most of the iron and steel industries are situated in Orissa and Bihar. Again, if the raw-material is perishable nearness to source of raw-material is an advantage. For example sugarcane is both weight loosing (weight of the sugar is about 10% of weight of sugarcane) and perishable. Hence most of the sugar-cane industries in Maharashtra and U.P. are concentrated in those areas where sugarcane is cultivated. If the material cost forms bulk cost of finished product, this factor needs careful consideration.
2. Proximity to markets.
The cost of transporting finished goods, advertising and distribution etc. will be greatly reduced if the factory is located near the market. Nearness to market is an important factor in the following cases : a) Industries using light raw-materials of high value. b) Industries producing perishable, fragile or heavy products. c) For the industries providing technical advice and services (such as tool and die
companies) this will help in ensuring prompt service to customers. If the product enjoys scattered market then nearness of the market is not a deciding
factor in the selection of site.

Industrial Engineering (2161907) 1. Location Selection and Plant Layout
Department of Mechanical Engineering Prepared by: Hardik B. Joshi Darshan Institute of Engineering & Technology, Rajkot Page 1.5
3. Availability of labour.
Availability of right kind of labour force in required numbers at reasonable rates is also a deciding factor in selection of site. Unskilled labour is amply available at major industrial centres and rural areas. However, the firms requiring skilled labour should be situated near the urban areas.
The glass and bangle industries in Ferozabad, woollen carpets in Mirzapur, Silk sarees at Kanziwaram etc. are mainly due to highly skilled labour for that particular industry being available at the place.
4. Transport and communication facilities.
Transport facilities are needed for transporting raw materials, parts and finished goods. Generally industries have a tendency to locate the industrial units near the railway station, highway or port areas.
Railways are cheaper but involve delays. Road transport is quick, it is convenient for door to door service, but it is costlier. So a balance should be achieved between the two according to the need of the unit. Generally long distances are covered by Railway transport and short distances by road transport. Communication facilities like mail, telephone, telegraph etc. must be adequate. Regularity of service, safety, speed and low cost are essential both for transport and for communication. Mumbai exhibited the largest concentration of textile mills although away from cotton growing regions
and market, soley, because of existence of adequate, quick transport and communication facilities.
5. Availability of power and fuel.
Coal, electricity, oil and natural gas are the important sources of power in the industries. The availability of reliable and cheap power supply is an important factor
in the location of electro-chemical industries, iron and steel industries, glass, pulp and paper industries etc. for example, Tata iron and steel industry is established near the coal mines of Bihar.
However, because of the development of long distance transmission of electric power this has not remained a deciding factor for plant location.
6. Climatic conditions.
Climatic conditions largely affect certain production proces ses also the efficiency of the employees. For example, textile mills require moist climate that is why most of the
textile mills are situated at Bombay and Ahmedabad. For agro-base industries like tea and coffee or rubber plantations, climatic conditions play a decisive role in the
selection of the site.
However, with the development of air-conditioning techniques, it is possible to control the temperature as well as humidity in the factory according to the requirements, though at the additional costs.
7. Availability of water.
Water is used in industries for processing as in paper in chemical industries, for generation of power in hydroelectric power plants and is also required for drinking sanitary purposes etc. Depending upon the nature of plant water should be available in adequate quantity and should be proper quality (clean and pure).
8. Ancillary Industries. The existence of ancillary industries in the nearby area may avail certain economic
advantages. Many industries such as processing and assembly industries are not producing all the parts of their product but purchase some of the parts from ancillary

1. Location Selection and Plant Layout Industrial Engineering (2161907)
Prepared by: Hardik B. Joshi Department of Mechanical Engineering Page 1.6 Darshan Institute of Engineering & Technology, Rajkot
industries producing it. The products produced by ancillary industries then forms a
raw-material for such industries. 9. Financial and other aids.
For the development of backward regions central as well as Stale Government provide certain incentives and facilities such as cash-subsidy, concessional financial assistance,
land, power and other facilities at cheaper rates, tax concessions etc. 10. Business and commercial facilities.
For day-to-day management of finance and working capital needs, banking services are considered highly desirable. Facilities for depositing surplus cash, discounting of bills, sending outstation cheques for collection and withdrawals, for meeting the cash shortages nearness to banking facilities is essential.
1.5 Urban, Suburban and Rural Location
A. URBAN AREA
Advantages 1. Excellent communication network. 2. Good transportation facilities for material and people. 3. Availability of skilled and trained manpower. 4. Factory in the vicinity of the market hence high local demand. 5. Excellent sourcing (subcontracting) facilities. 6. Good educational, recreational and medical facilities.
7. Availability of service of consultants, training institutes and trainers. Disadvantages
1. High cost of land compared to rural area. 2. Sufficient land is not available for expansion.
3. Labour cost is high due to high cost of living. 4. Industrial unrest due to trade union activities.
5. Management labour relations are much influenced by union activities. 6. Municipal and other authority restrictions on buildings etc. 7. High labour turnover.
B. RURAL AREA
Advantages
1. Cheaper and ample availability of site. 2. Cheaper labour rates. 3. Less turnover of labours because of limited mobility. 4. No municipal restrictions. 5. Good industrial relations. 6. Scope for expansion and diversification. 7. No slums and environmental pollution.
Disadvantages 1. Poor transportation network. 2. No good communication facilities.
3. Sourcing of components and materials should be from outside.
4. Far away from market. 5. High absenteeism during harvest season.
6. No educational, medical and recreational facilities.
Industrial Engineering (2161907) 1. Location Selection and Plant Layout
Department of Mechanical Engineering Prepared by: Hardik B. Joshi Darshan Institute of Engineering & Technology, Rajkot Page 1.7
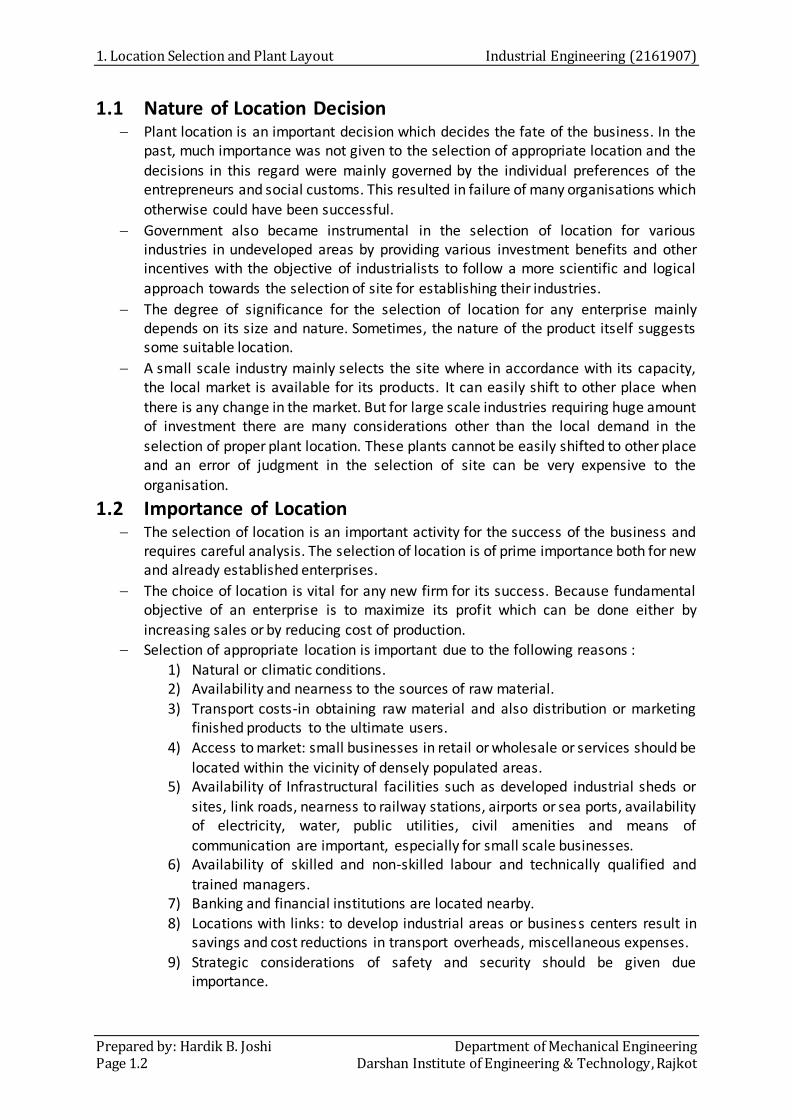
C. SUBURBAN AREA
Advantages 1. Land available at cheaper rate compared to urban location.
2. Infrastructure facilities are developed by promotional agencies. 3. Because of nearness to city availability of skilled manpower.
4. Educational, medical facilities are available because of nearness to city.
Limitations 1. Due to concentration the suburban area will become crowdy and will become
urban in turn within short period. 2. High mobility of workers and hence higher labour turnover. 3. Government incentive and subsides to promote industry.
Table 1.1 Comparison between urban and rural locations
Sr
no. Factor Urban Location Rural Location
1 Market
Local demand is high so less
distribution and transportation cost
Market far away which
increase the distribution and transportation cost
2 Labour Adequate availability of skilled
labour
Difficult to get the skilled
labour
3
Cost and
availability of land
Cost of land will be high and
difficult to get land for future expansion
Adequate land will be available
at the lower cost
4 Transport Good transport facility is available
Non-availability of good transport system
5 Communication
facilities Availability of good communication network
Communication facilities are not available
6
Municipal and
other civil amenities
Available Not available
7 Pollution control Strictly measures are to be taken to control pollution
Lower efforts are required for control of pollution measures
8 Labour turnover
Higher labour turnover due to better opportunities in the
vicinity of the area Low labour turnover
9 Union activities High union activities resulting in strikes
Least disturbances due to strikes and lockouts
10
Community services (School,
hospital)
Community services like schools services and
recreation facilities are available
Not available. It is to be
created by the firm on its own
11 Cost of living High Low
12 Storage facilities Adequate storage facilities
including cold storages
Warehouse and storage
facilities are not available

1. Location Selection and Plant Layout Industrial Engineering (2161907)
Prepared by: Hardik B. Joshi Department of Mechanical Engineering Page 1.8 Darshan Institute of Engineering & Technology, Rajkot
1.6 Plant Layout A plant layout is an arrangement of facilities and services in the plant. It outlines
relationship between production centers and departments.
Plant layout can be defined as an optimum arrangement of industrial facilities, including personnel, equipments, storage space, material handling equipments and all
other supporting services, in an existing or proposed plants. Plants layout can also be defined as: “A technique of locating machines, processes and plant services within the
factory in order to secure the greatest possible output of high quality at the lowest possible total cost of production.”
Plant layout provides a broad framework within which production and many administrative activities have to take place. All facilities like equipment, raw-materials,
machinery, tools, fixtures, finished goods, in process inventories, workers, material handling equipments etc. are given a proper place in the plant layout. Therefore, the
plant layout has an important bearing on utilization of facilities, on manufacturing
methods, on control mechanisms, and on production costs. An efficient plant layout is one that can be instrumental in achieving the following
Objectives: 1) Proper and efficient utilization of available floor space
2) To ensure that work proceeds from one point to another point without any delay
3) Provide enough production capacity. 4) Reduce material handling costs
5) Reduce hazards to personnel 6) Utilize labour efficiently
7) Increase employee morale 8) Reduce accidents
9) Provide for volume and product flexibility 10) Provide ease of supervision and control
11) Provide for employee safety and health 12) Allow ease of maintenance
13) Allow high machine or equipment utilization 14) Improve productivity
Situations in Which Layout Problem May Arise
A layout problem may arise in any one of the following situations: 1) When starting a new plant
2) Changes in the product design 3) Necessity of introducing a new product
4) Necessity of changes in the volume of production 5) Poor working conditions
6) Frequent accidents 7) Changes in location of the industry.
1.7 Principles of Plant Layout 1) Principle of integration: A good layout is one that integrates men, materials, machines
and supporting services and others in order to get the optimum utilisation of resources
and maximum effectiveness.

Industrial Engineering (2161907) 1. Location Selection and Plant Layout
Department of Mechanical Engineering Prepared by: Hardik B. Joshi Darshan Institute of Engineering & Technology, Rajkot Page 1.9
2) Principle of minimum distance: This principle is concerned with the minimum travel
(or movement) of man and materials. The facilities should be arranged such that, the total distance travelled by the men and materials should be minimum and as far as possible straight line movement should be preferred.
3) Principle of cubic space utilisation: The good layout is one that utilise both horizontal
and vertical space. It is not only enough if only the floor space is utilised optimally but the third dimension, i.e., the height is also to be utilised effectively.
4) Principle of flow: A good layout is one that makes the materials to move in forward direction towards the completion stage, i.e., there should not be any backtracking.
5) Principle of maximum flexibility: The good layout is one that can be altered without much cost and time, i.e., future requirements should be taken into account while designing the present layout.
6) Principle of safety and security and satisfaction: A good layout is one that gives due
consideration to workers safety and satisfaction and safeguards the plant and machinery against fire, theft, etc.
7) Principle of minimum handling: A good layout is one that reduces the material handling to the minimum.
1.8 Factors Influencing Layout While choosing the layout for a factory, the following factors should be taken into
consideration :
1) Management Policy. Management has to decide on many matters, e.g. nature and quality of products, size of the plant, integration of production process, plans for expansion, amount of inventory in stock, employee facilities etc.
2) Manufacturing Process. The type of manufacturing process, e.g. synthetic/analytical, continuous/ intermittent and repetitive/non-repetitive, will govern the type of plant layout.
3) Nature of Product. The type of product to be manufactured affects plant layout in several ways. Small and light products can be moved easily to the machines whereas for heavy and bulky products the machines may have to be moved. Large and heavy equipment requires assembly bays. One or a few standardised products can better be produced through product layout while process layout is more useful for producing a large variety of non-standardized products. Quality and fragility of the product also influences the layout.
4) Volume of Production. The plant layout and material handling equipment in the large scale organisation will be different from the same in the small scale manufacturing industry.
5) Type of Equipment. The use of single purpose and multi-purpose machines substantially affects the plant layout. Similarly, noisy and vibrating machines require
special attention in the plant layout decision. 6) Type of building. The plant layout in a single storey building will be different from that
in a multi¬storey building. The covered area, the number of storeys, elevators and stairs, parking and storage area all affect the layout.
7) Availability of total floor area. The allocation of space for machines, work-benches, sub-store, aisles, etc. is made on the basis of the available floor area. Use of overhead space is made in case of shortage of space.
8) Arrangement of material handling equipment. The plant layout and material handling services are closely related and the latter has a decisive effect on the arrangement of

1. Location Selection and Plant Layout Industrial Engineering (2161907)
Prepared by: Hardik B. Joshi Department of Mechanical Engineering Page 1.10 Darshan Institute of Engineering & Technology, Rajkot
production process and plant services. It is necessary to provide adequate aisles for
free movement of material handling equipment such as hand truck, fork truck etc. 9) Service facilities. The layout of factory must include proper service facilities required
for the comfort and welfare of workers. These include canteen, lockers, drinking water, first aid etc.
10) Possibility of future expansion. Plant layout is made in the light of future requirements and installations of additional facilities.
1.9 Types of Layout Plant layout may be of four types:
1) Product or line layout 2) Process or functional layout 3) Fixed position or location layout 4) Combined or group layout
1) Product or line layout:
Under this, machines and equipment’s are arranged in one line depending upon the sequence of operations required for the product. The materials move from one
workstation to another sequentially without any backtracking or deviation. Under this, machines are grouped in one sequence. Therefore materials are fed into the first
machine and finished goods travel automatically from machine to machine, the output of one machine becoming input of the next, e.g. in a paper mill, bamboos are fed into
the machine at one end and paper comes out at the other end. The raw material moves very fast from one workstation to other stations with a minimum work in progress storage and material handling.
The grouping of machines should be done keeping in mind the following general principles.
a) All the machine tools or other items of equipment’s must be placed at the
point demanded by the sequence of operations b) There should no points where one line crossed another line. c) Materials may be fed where they are required for assembly but not necessarily
at one point. d) All the operations including assembly, testing packing must be included in the
line.
A line layout for two products is given below:
Fig.1.1 Product layout
Advantages: a) Low cost of material handling, due to straight and short route and absence of
backtracking b) Smooth and uninterrupted operations c) Continuous flow of work

Industrial Engineering (2161907) 1. Location Selection and Plant Layout
Department of Mechanical Engineering Prepared by: Hardik B. Joshi Darshan Institute of Engineering & Technology, Rajkot Page 1.11
d) Lesser investment in inventory and work in progress
e) Optimum use of floor space f) Shorter processing time or quicker output g) Less congestion of work in the process h) Simple and effective inspection of work and simplified production control
i) Lower cost of manufacturing per unit Disadvantages:
a) High initial capital investment in special purpose machine b) Heavy overhead charges
c) Breakdown of one machine will hamper the whole production process d) Lesser flexibility as specially laid out for particular product.
Suitability: a) Mass production of standardized products
b) Simple and repetitive manufacturing process c) Operation time for different process is more or less equal
d) Reasonably stable demand for the product e) Continuous supply of materials
2) Process layout:
In this type of layout machines of a similar type are arranged together at one place. E.g. Machines performing drilling operations are arranged in the drilling department, machines performing casting operations be grouped in the casting department.
Therefore the machines are installed in the plants, which follow the process layout.
Hence, such layouts typically have drilling department, milling department, welding department, heating department and painting department etc. The process or functional layout is followed from historical period. It evolved from the handicraft method of production. The work has to be allocated to each department in such a way
that no machines are chosen to do as many different job as possible i.e. the emphasis is on general purpose machine.
The work, which has to be done, is allocated to the machines according to loading schedules with the object of ensuring that each machine is fully loaded. Process layout is shown in the following diagram.
Fig.1.2 Process layout
Advantages:
1. Location Selection and Plant Layout Industrial Engineering (2161907)
Prepared by: Hardik B. Joshi Department of Mechanical Engineering Page 1.12 Darshan Institute of Engineering & Technology, Rajkot
a) Lower initial capital investment in machines and equipment’s. There is high
degree of machine utilization, as a machine is not blocked for a single product b) The overhead costs are relatively low c) Change in output design and volume can be more easily adapted to the output
of variety of products
d) Breakdown of one machine does not result in complete work stoppage e) Supervision can be more effective and specialized
f) There is a greater flexibility of scope for expansion. Disadvantages:
a) Material handling costs are high due to backtracking b) More skilled labour is required resulting in higher cost. c) Time gap or lag in production is higher d) Work in progress inventory is high needing greater storage space
e) More frequent inspection is needed which results in costly supervision Suitability:
a) Products are not standardized b) Quantity produced is small c) There are frequent changes in design and style of product d) Job shop type of work is done e) Machines are very expensive
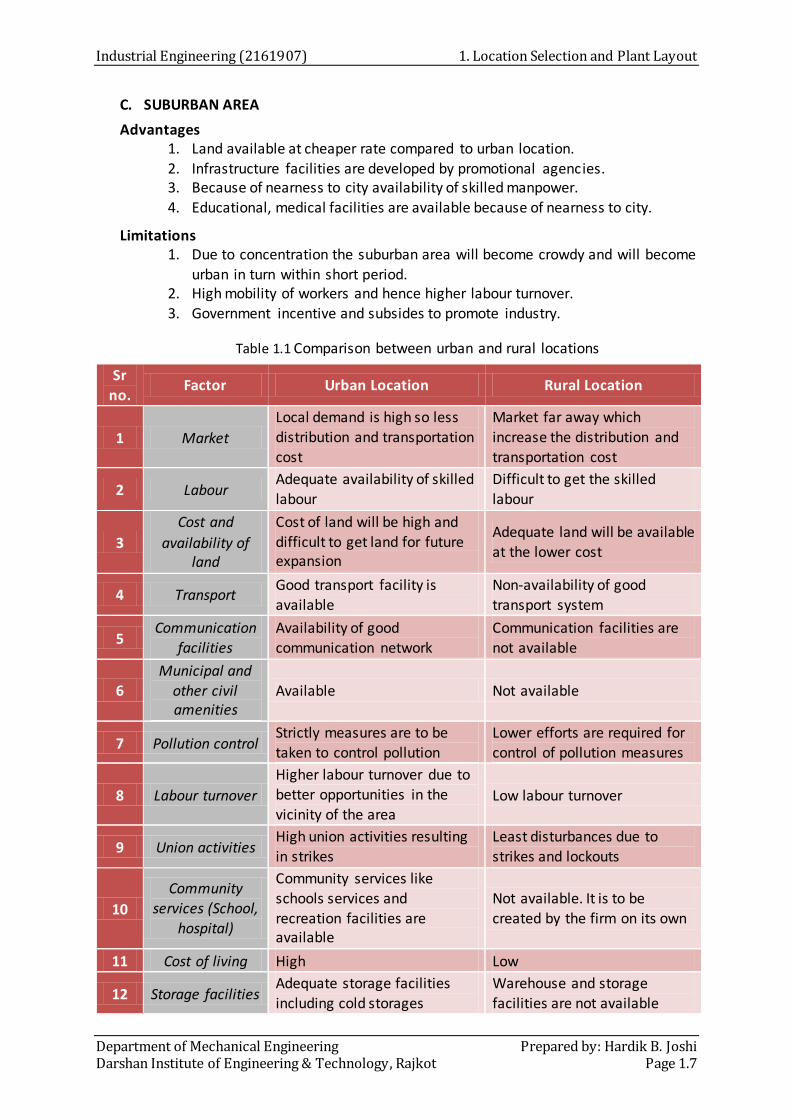
3) Fixed Position or Location Layout:
In this type of layout, the major product being produced is fixed at one location. Equipment labour and components are moved to that location. All facilities are brought and arranged around one work center. This type of layout is not relevant for
small scale entrepreneur. The following figure shows a fixed position layout regarding shipbuilding.
Fig.1.3 Product layout
Advantages: a) It saves time and cost involved on the movement of work from one
workstation to another. b) The layout is flexible as change in job design and operation sequence can be
easily incorporated. c) It is more economical when several orders in different stages of progress are
being executed simultaneously. d) Adjustments can be made to meet shortage of materials or absence of workers
by changing the sequence of operations. Disadvantages:
a) Production period being very long, capital investment is very heavy

Industrial Engineering (2161907) 1. Location Selection and Plant Layout
Department of Mechanical Engineering Prepared by: Hardik B. Joshi Darshan Institute of Engineering & Technology, Rajkot Page 1.13
b) Very large space is required for storage of material and equipment near the
product. c) As several operations are often carried out simultaneously, there is possibility
of confusion and conflicts among different workgroups. Suitability:
a) Manufacture of bulky and heavy products such as locomotives, ships, boilers, generators, wagon building, aircraft manufacturing, etc.
b) Construction of building, flyovers, dams. c) Hospital, the medicines, doctors and nurses are taken to the patient (product).
4) Combined layout: Certain manufacturing units may require all three processes namely intermittent
process (job shops), the continuous process (mass production shops) and the representative process combined process [i.e. miscellaneous shops].
In most of industries, only a product layout or process layout or fixed location layout does not exist. Thus, in manufacturing concerns where several products are produced
in repeated numbers with no likelihood of continuous production, combined layout is followed. Generally, a combination of the product and process layout or other
combination are found, in practice, e.g. for industries involving the fabrication of parts and assembly, fabrication tends to employ the process layout, while the assembly
areas often employ the product layout. In soap, manufacturing plant, the machinery manufacturing soap is arranged on the product line principle, but ancillary services
such as heating, the manufacturing of glycerin, the power house, the water treatment plant etc. are arranged on a functional basis.
1.10 Plant Layout Procedure 1. Collect the information about the product, process, etc. and record the data
systematically.
2. Analyse the data using various techniques of analysis. 3. Select the general flow pattern for the materials. 4. Design the individual work stations. 5. Assemble the individual layout into total layout in accordance with the general
flow pattern and the building facilities. 6. Coordinate the plan with plan for handling materials. 7. Complete the plant layout. 8. Convent the plant layout into floor plans that is to be used by the plant engineer
for installation of equipment.
1.11 Material Flow Patterns In order to achieve the production targets, the layout of plant is decided. Except, in
case of fixed plant layout, the material moves from one machine to another machine. So, the movement of material is more in the plant in any kind of layout. Hence, it is necessary to have effective flow of materials in the plant. Naturally, the minimum movement of material can reduce the material handling cost as well as it reduces the chances of damage of the material. To achieve, above objectives, the flow of material in the plant called flow pattern is decided. Flow pattern starts from the entry of raw material in the plant and it ends at when the raw material is converted into finished product.

1. Location Selection and Plant Layout Industrial Engineering (2161907)
Prepared by: Hardik B. Joshi Department of Mechanical Engineering Page 1.14 Darshan Institute of Engineering & Technology, Rajkot
The flow pattern of materials helps in eliminating bottle-necks, rushing and backtracking and ensures good supervision and control. Characteristics of good flow pattern:
Flow pattern must be short, smooth and easy to understand.
Flow pattern must be designed according to plant layout.
Flow pattern should involve minimum movement of flow.
Flow pattern should avoid repetitive path for the material, if unnecessary. Flow pattern should be such that the material flow is easily visible.
The material flow systems can be classified on the basis of the availability of floor
space as. 1. Horizontal flow system: Usually devised for a single story building when the
flat floor area is available. 2. Vertical flow system: This system is used in case of multi-storey buildings
and limited' area is available. Following are different types of flow pattern which are mostly used in the plant layout.
Straight line
Shortest route and must have roads on both sides.
Plant area has long length and narrow width.
Unsuitable for longer production lines.
U-type
Less difficulty in returning empty containers.
Suitable for longer production lines.
Requires square like floor area.
One side road link will be required.
L-type:
It is used when buildings are wide compared to its
length
Serpentine (Inverted S-Shape)
Requires roads on both
sides.
Suitable for longer production lines.
Difficulty in returning empty containers.
Requires square like floor area.

Industrial Engineering (2161907) 1. Location Selection and Plant Layout
Department of Mechanical Engineering Prepared by: Hardik B. Joshi Darshan Institute of Engineering & Technology, Rajkot Page 1.15
Comb or dendrite arrangement
Combination of flow pattern
O type flow
Used when the table is rotary type
Used for electrical system production
Fig.1.4 Horizontal type flow system
There also vertical type flow systems exists in multi-storey buildings. Following are the various types of vertical flow patterns.
Fig.1.5 Vertical type flow system

1. Location Selection and Plant Layout Industrial Engineering (2161907)
Prepared by: Hardik B. Joshi Department of Mechanical Engineering Page 1.16 Darshan Institute of Engineering & Technology, Rajkot
Factors governing flow pattern:
Type of product to be manufactured. Number of varieties of product to be manufactured. Number of operations on each product.
Number of sub-assemblies made up ahead of assembly line.
Quantities of products to be manufactured.
1.12 Tools And Techniques For Plant Layout The quality and quantity of the data on various factors is required to develop a good
layout. The data is to be collected regarding the various process es, sequence of operations, material flow, frequency of travel, space requirements, activities and their relationships. Following are the various tools used for checking the effectiveness of the plant.
1. Process charts—(operation process charts, flow process charts) 2. Travel Chart 3. Diagrams—(flow diagrams and string diagrams) 4. REL—(Relationship chart) 5. Templates 6. Scaled models
The process charts and diagrams are discussed in chapter on method study- chapter 3. 1. TRAVEL CHART
The flow of material between functional areas of the plant is recorded on a From-To chart. It records the distance and frequency of movements between various pairs of departments. This chart is used to determine the degree of closeness between the departments. It forms the basis for layout design that seeks to minimise the total material handling costs.
The advantages of travel charts are: i. It is a useful tool for movement analysis. ii. It is helpful to locate the activities and backtracking. iii. Useful for comparing alternative flows. iv. Can be easily computerized as quantitative data is involved.
Procedure to draw the Travel Chart
Departments or work centres are listed both row wise and column wise, in the same sequence. Each intersecting square (cell) is used to record data from one department
to another. The entries in the chart are scattered on both sides of the diagonal. A typical travel chart is shown in Fig.
Fig.1.6 Travel Chart
MBC represents number of moves from B to C.
Industrial Engineering (2161907) 1. Location Selection and Plant Layout
Department of Mechanical Engineering Prepared by: Hardik B. Joshi Darshan Institute of Engineering & Technology, Rajkot Page 1.17
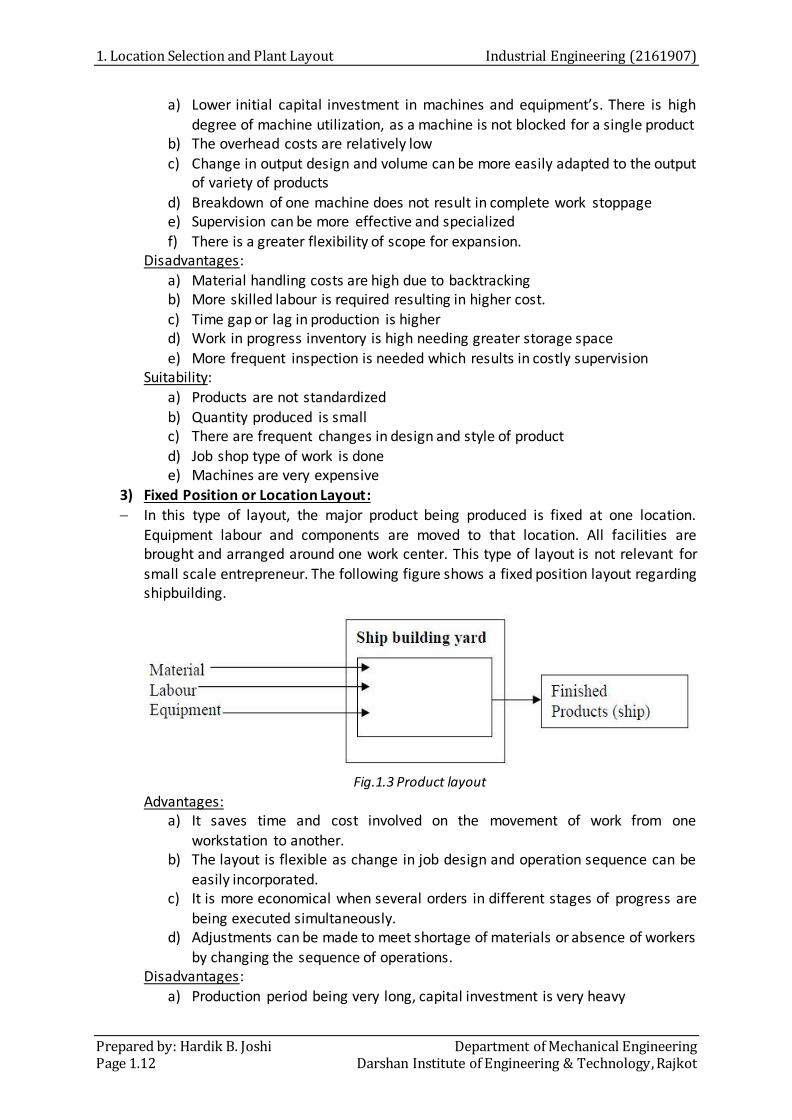
The entries below the diagonal represent backtracking. 2. REL (RELATIONSHIP CHART)
The relative importance of having one department near another is displayed in Relationship chart. Robert Muther developed the REL chart. Each diamond-shaped cell in the chart shows the relationship if any between two functional plant areas. Two entries come into the cells. The top entry is a letter that indicates the degree of closeness of the relationship and the number below represents the important reason for relationship.
The relationship diagrams recognise the need for exploring “Relationship” rather than calculating exact flows and costs. The requirements of closeness are expressed on a scale.
These pair-wise interdepartmental “closeness requirement ratings” are then used to develop a suitable layout which satisfies as many pairwise relationship as pos sible and to the extent possible.
The relationship charts is shown in the Fig.
Fig.1.6 Relationship Chart
3. TEMPLATES
This is the most common method of presenting the plant layout. These are two-dimensional cut outs prepared by cardboard, coloured papers, etc. They are made to
scale and are placed on the scaled plan of the building drawn on the board. The templates depict the plan of various activities like machine tools, work benches,
storages, etc. Advantages
Cheaper compared to model layout. Congestion, backtracking can be better visualised. Easy for interpretation.
They can be conveniently moved on the board providing flexibility to evaluate various feasible arrangements.
Limitations

1. Location Selection and Plant Layout Industrial Engineering (2161907)
Prepared by: Hardik B. Joshi Department of Mechanical Engineering Page 1.18 Darshan Institute of Engineering & Technology, Rajkot
Interpretation is difficult for non-technical persons.
It is difficult to visualise the impact of overhead facilities on the plant and process. 4. SCALE MODELS Three-dimensional models are the scaled models of the facilities. The models of the
plant and equipment with their appropriate scale are used in preparing the model layout. They are usually made up of wood or plastic. These are costly.
Advantages Easy to visualise and explain. It facilitates the study of overhead structures and devices
like lighting, ventilation, safety features, etc.
1.13 Different Plant Layouts There different types of plant layout according the requirement and available space.
Following are the different plant layouts. This layouts are for references and the position of various operations may change according to requirement.
Fig.1.6 Manufacturing shop layout
Fig.1.7 Automobile repair and service shop layout

Industrial Engineering (2161907) 1. Location Selection and Plant Layout
Department of Mechanical Engineering Prepared by: Hardik B. Joshi Darshan Institute of Engineering & Technology, Rajkot Page 1.19
Fig.1.8 Thermal power plant layout
1.14 Computerized Package For Layout Analysis 1. Computerized Relative Allocation of Facilities Technique (CRAFT)
Computerized Relative Allocation of Facilities Technique (CRAFT) is one of the plant
layout improvisation technique which was originally developed by Armour and Buffa. The main aim of CRAFT is to reduce the transportation cost by interchanging of the
departments. Interchanging process is applicable to those departments which are either have
common border area or have equal space requirement. This interchanging process continues till the transportation cost is minimum. Though method does not give the
layout which can give optimum cost but CRAFT output gives the good and close layout in major aspects.
Following are the pre-requisites for CRAFT: i. Initial layout showing total number of departments
ii. Area of each departments iii. Cost matrix showing cost per unit distance iv. Flow matrix
v. Number and location of fixed departments (if any)
Calculate transportation cost using flow matrix, distance matrix and cost matrix.
Transportation cost = 𝑖=1
𝑚𝑗=1
𝑚 𝑓𝑖𝑗 . 𝑐𝑖𝑗 . 𝑑𝑖𝑗
Limitation of CRAFT analysis: It gives locally optimal solution only. Since CRAFT depends on initial layout, different
initial layout should be used as input to the CRAFT procedure.
CRAFT may lead to irregular shapes of departments. So, manual finishing is necessary
before finalizing the layout.
It is not always possible to exchange the department of common border having unequal size without splitting the larger one.

1. Location Selection and Plant Layout Industrial Engineering (2161907)
Prepared by: Hardik B. Joshi Department of Mechanical Engineering Page 1.20 Darshan Institute of Engineering & Technology, Rajkot

Industrial Engineering (2161907) 1. Location Selection and Plant Layout
Department of Mechanical Engineering Prepared by: Hardik B. Joshi Darshan Institute of Engineering & Technology, Rajkot Page 1.21
2. Computerized Relationship Layout Planning (C0RELAP)
It is one of the other method which is develops systematic layout using computer algorithm. Initially it was developed by Muther and computer algorithm was developed by R. C. Lee.
Computerized Relationship Layout Planning (CORELAP) uses the A-E, I, O, U closeness ratings, space requirements and maximum building length to width ratio to develop a layout.
Following are the pre-requisites for CO RELAP: i. Number of departments ii. Area of each departments iii. Closeness relationship as given by REL - Chart iv. Weighted ratings for REL — Chart
Procedure to solve plant layout CORELAP:
Step 1: Collect the pre-requisite plant layout data as mentioned above.
Step 2: Rearrange REL - chart for each department in terms of matrix.
Step 3: Calculate TCR as shown above.
Step 4: The first department placed in the layout is the one with the highest TCR
value. If there is a tie, then choose the one with more A’s (E’s etc.) Step 5: If a department has ‘X’ relationship with the first one, it is placed last in the
layout and not considered. If a tie exists, choose the one with the lowest TCR value.
Step 6: The second department is the one with an A (or E, I... etc.) relationships with the first one. If a tie exists, select the one with the greatest TCR value.
Step 7: If a department has ‘X’ relationship with the second one, it is placed next to the last or last in the layout. If a tie exists, choose the one with" the lowest
TCR value. Step 8: The next department is the one with an A (or E, I... etc.) relationship with the
already placed departments. If a tie exists, choose the one with the greatest TCR value.
Step 9: The procedure continues until all departments have been placed.
Step 10: First selected department is placed in the middle. To place the other department, placing rating is considered. Placing Rating (PR) is the sum of
the weighted closeness ratings between the department to enter the layout and its neighbors.
Step 11: The department which has greatest PR value is selected till the final placement is done.
Step 12: After placement total score is calculated based on each department’s distance and closeness with each other.

Department of Mechanical Engineering Prepared By: Hardik B. Joshi Darshan Institute of Engineering & Technology, Rajkot Page 2.1
2 Production Planning and Control
Course Contents
2.1 Introduction to PPC 2.2 What is PPC?
2.3 Need of PPC
2.4 Objectives of PPC
2.5 Factors affecting on PPC
2.6 Functions of PPC
2.7 Types of Production system
2.8 Forecasting
2.9 Applications of Forecasting
2.10 Techniques in Forecasting
2.11 Error in forecasting
2.12 Line balancing
2.13 Process Planning
2.14 MRP
2.15 Standardization
2.16 Work simplification
2. Production Planning & Control Industrial Engineering (2161907)
Prepared by: Hardik B. Joshi Department of Mechanical Engineering Page 2.2 Darshan Institute of Engineering & Technology, Rajkot
2.1 Introduction
Production planning and control can be viewed as nervous system of the production
operation.
This function aims at efficient utilization of material resources, people and facilities
in any undertaking through planning, coordinating and controlling the production
activities that transform the raw material into finished products or components as a
most optimal manner.
All the activities in manufacturing or production cycle must be planned, coordinated,
organized and controlling to its objectives.
Production planning and control as a department plays a vital role in manufacturing
organizations.
It is clear from name that it is something about planning. Planning is defined as
setting goals. Production planning and control provides different kinds of
information to different departments.
It provides information about available manufacturing resources to marketing
department. Marketing department receives orders according to that information.
Similarly, it coordinates with other departments and provides relevant information.
2.2 What is PPC?
Production planning and control may be defined as the direction and co-ordination
of the firm's material and physical facilities towards the attainment of pre-specified
production goals, in the most efficient and economical manner.
According to Samuel Elion: “The highest efficiency in production is obtained by
manufacturing the required quantity of the product, of the required quality, at the
required time, by the best and cheapest method.”
To attain this target, management employs production planning and control, the tool
that co-ordinates all manufacturing activities.
The four factors mentioned above—namely: quantity, quality, time and price-
encompass the production system, of which production planning and control is the
brain.
Production control will be in action when production activity begins.
It can comprise the following activities
1) Determination of the required product mix and factory load to satisfy
customer’s needs.
2) Matching the required level of production to the existing resources.
3) Scheduling (Scheduling is the process of arranging, controlling and optimizing
work and workloads in a production process or manufacturing process.
Scheduling is used to allocate plant and machinery resources, plan human
resources, plan production processes and purchase materials) and choosing
the actual work to be started in the manufacturing facility"
4) Setting up and delivering production orders to production facilities.

Industrial Engineering (2161907) 2. Production Planning & Control
Department of Mechanical Engineering Prepared by: Hardik B. Joshi Darshan Institute of Engineering & Technology, Rajkot Page 2.3
Relations between Production Planning and Control
There exists a very close inter-relationship among the phases and functions of the
production planning and control and they are mutually supporting. For instance,
relistic planning is quite dependent upon the data which is compiled during the
function phase. Action, in turn, is dependent upon continuous planning of the work
to be performed by the activity. Follow-up is the comparison of the work that was
originally planned against the work actually done. It must be understood, that if the
plans are lacking, or not stated properly or are recorded inadequately in terms of
objectives, starting and completion dates and utilisation of resources, there will not
be a basis for a comprehensive follow up phase.
Relation between production planning and production control
The planning and control is an integral part of the system and it is very diff icult to
isolate one from the other. They are so inter-related that one is always identified
with the other. This can be better explained by control cycle as shown in Fig.
Planning concerns with the formulation of production strategies and targets for the
enterprise whereas control is vested with actual implementation and execution of
planned Objectives. Production planning determines the operations required to
manufacture the product and control regulates and supervises these operations.
Through production control information the organisation can locate shortcomings in
the planning process and the necessary modifications can be done at the time of
planning in future. Similarly, production control operations can be improved to
adjust with the planning requirements.
2.3 Need of PPC
PPC is needed to achieve:
1) Effective utilization of firm’s resources.
2) To achieve the production objective with respect to quality, quantity, cost
and timeliness of delivery.
3) To obtain the uninterrupted production flow in order to meet the customer
demands with respect to quality and committed delivery schedule.
4) To help the company to supply a good quality product to the customer on the
continuous basis at company rates.
2.4 Objectives of PPC
There are three M's of production viz, Men, Materials and Machines without which
production cannot be carried out.
The production planning and control (P.P.C.) system integrates and coordinates the
use of manpower, machines and materials for the efficient production to meet the
sales requirements.
Objectives of PPC are discussed below:

2. Production Planning & Control Industrial Engineering (2161907)
Prepared by: Hardik B. Joshi Department of Mechanical Engineering Page 2.4 Darshan Institute of Engineering & Technology, Rajkot
1. To design a system and plan, by which production may be carried out with a view
to meet promised delivery date consistent with minimum cost and quality
standard.
2. To ensure efficient utilization of production facilities.
3. To coordinate the production activities of different departments.
4. To maintain adequate but not excessive stock of raw materials, work in process
and of finished goods to meet production requirements and delivery schedules at
the most economical level.
5. To ensure production of right product in right quality at the right time.
6. To maintain flexibility in manufacturing operations, to accommodate rush jobs or
to meet contingencies.
7. To co-ordinate labour, machines and equipment in the most effective and
economic manner.
8. Ensuring smooth flow of materials by eliminating bottlenecks if any, in
production.
9. Establishing targets and checking it against performance.
10. To provide alternative production strategies in case of emergencies.
11. To determine the nature and magnitude of various input factors to manufacture
the desired output
12. The PPC department guides production by preparing and issuing manufacturing
orders which direct the use of facilities and material and allocate labour to the
output of the required quantity of products of the required quality.
2.5 Factors affecting on PPC
PPC is affected by the different factors, which all are discussed below:
1) Use of Computers:
Modern factories are using office automation equipment like PC, punch cards
etc. It helps accurate computation of required of men and machine.
2) Seasonal Variations:
Demand of certain products is affected by seasons, for instance umbrellas and
raincoats during the monsoons and outputs. Production planning and control
must take such changes into consideration while planning and control activities
of inputs and outputs.
3) Test Marketing:
In an aggressive marketing strategy new products are to be test marketed in
order to know the trends. This is a short- cycle operation, intermittent in nature
and often upsets regular production.
4) After Sales Service:
This has become an important parameter for success. In after sales services,
many items are returned for repair. These are unscheduled work and also
overload the production line.

Industrial Engineering (2161907) 2. Production Planning & Control
Department of Mechanical Engineering Prepared by: Hardik B. Joshi Darshan Institute of Engineering & Technology, Rajkot Page 2.5
5) Losses due to Unpredictable Factors:
Losses occur due to accidents, fire and theft of production inputs, mainly
materials and components. These are unpredictable. Shortage of input due to
such factors upset the planned production schedule in time and quantity.
6) Losses due to Predictable Factors:
There are losses of inputs, due to natural engineering phenomena like
production losses and changes in consumption of materials and occurrence of
defectives.
7) Production of Order:
There are occasions when last minute prioritization of existing orders due to
external pressure takes place. These changes in priority are often decided by
sufficiently high level of management.
8) Design Changes:
Design changes are issued by R & D and the engineering department. This will
necessarily force production planning control change the input materials and
process.
9) Rejection and Replacement:
There are occasions when sub-assemblies or finished goods are rejected during
stage or final inspection. Production planning and control must cater for
contingent plans to take care of rework without affecting scheduled quality.
2.6 Functions of PPC
Three main phases of PPC:
1. Planning phase
2. Action phase
3. Follow up or control phase

2. Production Planning & Control Industrial Engineering (2161907)
Prepared by: Hardik B. Joshi Department of Mechanical Engineering Page 2.6 Darshan Institute of Engineering & Technology, Rajkot
These three phases as mentioned above make up the main body of functions of PPC.
There are other secondary functions which are essential contributors to the efficient
performance of production, planning and control. In addition there are other
functions which are supported by these three phases which are not generally
considered to be direct functions of production planning and control. These include
quality control- cost control and so on.
Prior Planning:
Prior planning implies that a course of action is established in advance. The
whole activity must be planned and exists on paper before the very first action
takes place
1. Fore-canting (Estimation of future work): Fore-casting is defined as the
estimation of future activities i.e. the estimation of type, quantity and quality of
future work. These estimates provide the basis for establishing the future
requirement for men, materials, machines, time and money.
2. Order writing (Preparation of work authorisation): If the work is to be controlled,
it must begin with a specified documents authorising it. So it means giving the
authority to one or more persons to do a particular job.
3. Product design (Preparation of specifications): After the work authorisation has
been prepared the next step is to collect the information necessary to describe
the work in details. This includes blue prints or drawings, a list of specification, a
bill of material and so on.
Action Planning:
In any type of work activity the following steps are necessary for planning details
of the work to be done:
1. Process planning: The determination of most economical method of performing
an activity, all factors being considered.
Routing. The arrangement of work stations is determined by the route.
2. Material control: Determination of material requirements and control of material
(inventory control).
3. Tool control: Tool control may be subdivided into two categories :
(a) Design and procurement of new tools.
(b) Control storage and maintenance of tools after procurement.
4. Loading: Determination and control of equipment and manpower requirements.
Loading may be defined as the assignment of work to the facility. The facility may
be equipment, manpower or both.
5. Scheduling: Determination when the work is to be done. Scheduling consists of
time phasing of loading (workload) i.e., setting both, starting and ending time for
the work to be done.
The common practice dictates that routing, loading and scheduling be performed
simultaneously.

Industrial Engineering (2161907) 2. Production Planning & Control
Department of Mechanical Engineering Prepared by: Hardik B. Joshi Darshan Institute of Engineering & Technology, Rajkot Page 2.7
Action Phase:
The work is started in the action phase. There is only one production planning
activity in action phase i.e., dispatching. Dispatching is the transition from the
planning phase to action phase.
It consists of actual release of detailed work authorisation to the work centres.
Follow up or Control Phase:
Once the work is started in an activity it is necessary to evaluate continuously the
progress in terms of plan so that deviations can be detected and corrected as quickly
as possible. The control phase accordingly consists of two parts:
Progress report:
1. Progress reporting: (Data collection). The first step in progress reporting is to
collect data for what is actually happening in the activity (Progress of work).
2. Data interpretation. After the data has been collected, then it is necessary to
interpret it by comparing the actual performance against the plan.
Corrective Action:
1. Expediting. If the data collected from the production unit indicates that there is
significant deviation from the plan and the plan cannot be changed, then some
action must be taken to get back on plan.
2. Replanning. It should be emphasised that the plan is not to be changed but to be
followed, however, if after expediting to correct deviation it is found that, it is
impossible to perform according to plan. It would be necessary to replan the
whole affair. It may also be found that there were errors made while developing
the original plan. In all such cases replanning is necessary.
2.7 Types of Production system
Broadly one can think of three types of production systems which are mentioned
here under:
2.7.1 Job production:
It involves production as per customer's specification each batch or order consists of
a small lot of identical products and is different from other batches. It also refers as
the unit production. The system requires comparatively smaller investment in
machines and equipment. It is flexible and can be adapted to changes in product
design and order size without much inconvenience. This system is most suitable
where heterogeneous products are produced against specific orders.
Characteristics:
1) Material are purchased based on order.
2) Standard tools are stocked and special tools are made or purchased from
outside.
3) Process planning activity does not exist. Based on drawing and specification
work method will be deciding.

2. Production Planning & Control Industrial Engineering (2161907)
Prepared by: Hardik B. Joshi Department of Mechanical Engineering Page 2.8 Darshan Institute of Engineering & Technology, Rajkot
4) The day to day scheduling and progressing is through the meeting with the
supervisor.
2.7.2 Batch production:
It refers to a form of production of the job passes through the production
department in batch or lot and each may have different routing. This system
produces a limited number of products at regular intervals.
Characteristics:
1) Material and tools control are more important and systematic stocks is
required.
2) Process sheet are prepared.
3) Loading and scheduling are to be worked out with greater details.
4) Progressing details is to be collected based on the progression of the work.
2.7.3 Continuous production:
It refers to the production of standardized products with a standard set of process
and operation sequence in anticipation of demand. It is also known as mass flow
production. This system ensures less work in process inventory and high product
quality but involves large investment in machinery and equipment. The system is
suitable in 117 plants involving large volume and small variety of output e.g. oil
refineries reform cement manufacturing etc.
Characteristics:
1) Material function is critical.
2) No process planning activity.
3) No tools control due to nature of the plant.
4) Scheduling is restricted to final quantity required.
5) Progressing is required only recording of final production quantity.
2.8 FORECASTING
The growing competition, frequent changes in customer's demand and the trend
towards automation demand that decisions in business should not be based purely
on guesses rather on a careful analysis of data concerning the future course of
events. More time and attention should be given to the future than to the past, and
the question 'what is likely to happen?' should take precedence over 'what has
happened?' though no attempt to answer the first can be made without the facts
and figures being available to answer the second.
Definition: “When estimates of future conditions are made on a systematic basis, the
process is called forecasting and the figure or statement thus obtained is defined as
forecast.”
Forecasting aims at reducing the area of uncertainty that surrounds management
decision-making with respect to costs, profit, sales, production, pricing, capital
investment.
Forecasting is a process of estimating a future event by casting forward past data.
The past data are systematically combined in a predetermined way to obtain the

Industrial Engineering (2161907) 2. Production Planning & Control
Department of Mechanical Engineering Prepared by: Hardik B. Joshi Darshan Institute of Engineering & Technology, Rajkot Page 2.9
estimate of the future. Prediction is a process of estimating a future event based on
subjective considerations other than just past data; these subjective considerations
need not be combined in a predetermined way.
The following are the main functions of forecasting:
1) The creation of plans of action.
2) The general use of forecasting is to be found in monitoring the continuing
progress of plans based on forecasts.
3) The forecast provides a warning system of the critical factors to be monitored
regularly because they might drastically affect the performance of the plan.
There are two basic reasons for the need for forecast in any field.
1) Purpose: Any action devised in the PRESENT to take care of some
contingency accruing out of a situation or set of conditions set in future.
These future conditions offer a purpose / target to be achieved so as to take
advantage of or to minimize the impact of (if the foreseen conditions are
adverse in nature) these future conditions.
2) Time: To prepare plan, to organize resources for its implementation, to
implement; and complete the plan; all these need time as a resource. Some
situations need very little time; some other situations need several years of
time. Therefore, if future forecast is available in advance, appropriate actions
can be planned and implemented ‘in time’.
2.9 Applications of Forecasting
We now will discuss some areas in which forecasting is widely used.
1) Sales Forecasting:
Any company in selling goods needs to forecast the demand for those goods.
Manufactures need to know how much to produce. Wholesalers and retailers
need to know now much to stock.
Substantially understanding demand is likely to lead to many lost sales,
unhappy customers, and perhaps allowing the competition to gain the upper
hand in the marketplace. On the other hand, significantly overestimating
demand also is very costly due to (1) excessive inventory costs, (2) forced
price reductions, (3) unneeded production or storage capacity, and (4) lost
opportunities to market more profitable goods.
Successful marketing and production managers understand very well the
importance of obtaining good sales forecasts.
For the production managers these sales forecast is essential to help trigger
the forecast for production which in turn triggers the forecasting of the raw
materials needed for production.
Forecasting the need for raw materials and spare parts
Although effective sales forecasting is a key for virtually any company, some organizations must rely on other types of forecasts as well. A prime example
involves forecasts of the need for raw materials and spare parts.

2. Production Planning & Control Industrial Engineering (2161907)
Prepared by: Hardik B. Joshi Department of Mechanical Engineering Page 2.10 Darshan Institute of Engineering & Technology, Rajkot
Many companies need to maintain an inventory of spare parts to enable
them to quickly repair either own equipment or their products sold or leased to customers.
Forecasting Economic Trends
With the possible exception of sales forecasting, the most extensive
forecasting effort is devoted to forecasting economic trends on a regional, national, or even international level.
Forecasting Staffing Needs For economically developed countries there is a shifting emphasis from
manufacturing to services. Goods are being produced outside the country (where labor is chapter) and then imported. At the same time, an increasing number of business firms are specializing in providing a service of some kind (e.g., travel, tourism, entertainment, legal aid, health services, financial,
educational, design, maintenance, etc.). For such a company forecasting “sales” becomes forecasting the demand for services, which then translates
into forecasting staffing needs to provide those services. 2) Forecasting in education environment
A good education institute typically plans its activities and areas concentration for the coming years based on the forecasted demand for its different activities. The institute may come out with a forecast that the future requirements of its students who graduate may be more in particular sector. This may call for the reorientation of the syllabus and faculty, development of suitable teaching materials/cases, recruitment of new faculty with specific sector-oriented background, experience and teaching skills. Alternatively, the management may decide that the future is more secure
with the conventional areas of operation and it may continue with the original syllabus, etc.
3) Forecasting in a rural setting Cooperative milk producers’, union operates in a certain district. The
products it manufactures, the production capacities it creates, the manpower it recruits, and many more decisions are closely linked with the forecasts of
the milk it may procure and the different milk products it may see. Milk being a product which has a ready market, is not difficult to sell. Thus demand forecasting for products may not be a very dominant issue for the organization. However, the forecast of milk procurement is a crucial issue as raw milk is a highly perishable commodity and building up of adequate processing capacity is important for the dairy. The milk procurement forecast also forms an important input to the production planning process which includes making decisions on what to produce, how much and when to produce.
4) Ministry of Petroleum The officials of this crucial ministry have to make decisions on the quantum of purchase to be made for various types of crude oils and petroleum products from different sources across the oil-exporting nations for the next few years. They also have to decide as to how much money has to be spent on development of indigenous sources.

Industrial Engineering (2161907) 2. Production Planning & Control
Department of Mechanical Engineering Prepared by: Hardik B. Joshi Darshan Institute of Engineering & Technology, Rajkot Page 2.11
These decisions involve/need information on the future demand of different
types of petroleum products and the likely change in the prices and the availability of crude oil and petroleum products in the country and the oil -exporting nations. This takes us back to the field of forecasting.
5) Department of Technology
The top officials of this department want to make decisions on the type of information technology to recommend to the union government for the next
decade. But they are not very clear on the directions which will be taken by this year rapidly changing field. They decided to entrust this task to the
information system group of a national management institute. The team leader decided to forecast the changing technology in this area with the help of a team of information technology experts throughout the country. This is again a forecasting problem although of a much different type. This field of
forecasting is known as technological forecasting.
2.10 Techniques in Forecasting
The following figure illustrates various methods of forecasting.
General Steps in The Forecasting Process
The general steps in the forecasting process are as follows:
1) Identify the general need
2) Select the Period (Time Horizon) of Forecast
3) Select Forecast Model to be used: For this, knowledge of various forecasting models,
in which situations these are applicable, how reliable each one of them is; what type
of data is required. On these considerations; one or more models can be selected.
4) Data Collection: With reference to various indicators identified-collect data from
various appropriate sources-data which is compatible with the model(s) selected in
above step. Data should also go back that much in past, which meets the
requirements of the model.
Qualitative
Methods
Grass Roots
Market Research
Panel Consensus
Historical Analogy
Delphi Method
Time Series Methods
Naïve Methods
Moving Average
Exponential Smoothing
Trend Projections
Causal Methods
Regression Analysis
2. Production Planning & Control Industrial Engineering (2161907)
Prepared by: Hardik B. Joshi Department of Mechanical Engineering Page 2.12 Darshan Institute of Engineering & Technology, Rajkot
5) Prepare forecast: Apply the model using the data collected and calculate the value of
the forecast.
6) Evaluate: The forecast obtained through any of the model should not be used, as it
is, blindly. It should be evaluated in terms of ‘confidence interval’ – usually all good
forecast models have methods of calculating upper value and the lower value within
which the given forecast is expected to remain with certain specified level of
probability. It can also be evaluated from logical point of view whether the value
obtained is logically feasible? It can also be evaluated against some related variable
or phenomenon. Thus, it is possible, sometimes advisable to modify the statistically
forecasted’ value based on evaluation.
2.10.1 Qualitative Techniques in Forecasting
1) Grass Roots
Grass roots forecasting builds the forecast by adding successively from the
bottom. The assumption here is that the person closest to the customer or
end use of the product knows its future needs best. Though this is not always
true, in many instances it is a valid assumption, and it is the basis for this
method.
Forecasts at this bottom level are summed and given to the next higher level.
This is usually a district warehouse, which then adds in safely stocks and any
effects of ordering quantity sizes. This amount is then fed to the next level,
which may be a regional warehouse. The procedure repeat until it becomes
an input at the top level, which, in the case of a manufacturing firm, would be
the input to the production system.
2) Market Research
Firms often hire outside companies that specialize in market research to
conduct this type of forecasting. You may have been involved in market
surveys through a marketing class. Certainly you have not escaped telephone
calls asking you about product preferences, your income, habits, and so on.
Market research is used mostly for product research in the sense of looking
for new product ideas, likes and dislikes about existing products, which
competitive products within a particular class are preferred, and so on. Again,
the data collection methods are primarily surveys and interviews.
3) Panel Consensus
In a panel consensus, the idea that two heads are better than one is
extrapolated to the idea that a panel of people from a variety of positions can
develop a more reliable forecast than a narrower group. Panel forecasts are
developed through open meetings with free exchange of ideas form all levels
of management and individuals. The difficulty with this open style is that
lower employee levels are intimidated by higher levels of management. For
example, a salesperson in a particular product line may have a good estimate
of future product demand but may not speak up to refute a much different

Industrial Engineering (2161907) 2. Production Planning & Control
Department of Mechanical Engineering Prepared by: Hardik B. Joshi Darshan Institute of Engineering & Technology, Rajkot Page 2.13
estimate given by the vice president of marketing. The Delphi technique
(which we discuss shortly) was developed to try to correct this impairment to
free exchange.
When decisions in forecasting are at a broader, higher level (as when
introducing a new product line or concerning strategic product decisions such
as new marketing areas) the term executive judgment is generally used. The
term is self-explanatory: a higher level of management is involved.
4) Historical Analogy
The historical analogy method is used for forecasting the demand for a
product or service under the circumstances that no past demand data are
available. This may specially be true if the product happens to be new for the
organization. However, the organization may have marketed product(s)
earlier which may be similar in some features to the new product. In such
circumstances, the marketing personnel use the historical analogy between
the two products and derive the demand for the new product using the
historical data of the earlier product. The limitations of this method are quite
apparent. They include the questionable assumption of the similarity of
demand behaviors, the changed marketing conditions, and the impact of the
substitutability factor on the demand.
5) Delphi Method
As we mentioned under panel consensus, a statement or opinion of a higher-
level person will likely be weighted more than that of a lower-level person.
The worst case in where lower level people feel threatened and do not
contribute their true beliefs. To prevent this problem, the Delphi method
conceals the identity of the individuals participating in the study. Everyone
has the same weight. A moderator creates a questionnaire and distributes it
to participants. Their responses are summed and given back to the entire
group along with a new set of questions.
The step-by-step procedure is
1) Choose the experts to participate. There should be a variety of
knowledgeable people in different areas.
2) Through a questionnaire (or e-mail), obtain forecasts (and any premises or
qualification captions for the forecasts) from all participants.
3) Summarize the results and redistribute them to the participants along with
appropriate new questions.
4) Summarize again, refining forecasts and conditions, and again develop new
questions.
5) Repeat Step (4) if necessary. Distribute the final results to all participants.
2.10.2 Time-Series Methods
A time series refers to the past recorded values of the variables under consideration.
The values of the variables under consideration in a time-series are measured at

2. Production Planning & Control Industrial Engineering (2161907)
Prepared by: Hardik B. Joshi Department of Mechanical Engineering Page 2.14 Darshan Institute of Engineering & Technology, Rajkot
specified intervals of time. These intervals may be minutes, hours, days, weeks,
months, etc. In the analysis of a time series the following four time-related factors
are important.
1) Trends:
These relate to the long-term persistent movements/tendencies/changes in
data like price increases, population growth, and decline in market shares. An
example of a decreasing linear trend is shown in Fig. 2.1.
2) Seasonal variations:
There could be periodic, repetitive variations in time-series which occur
because of buying or consuming patterns and social habits, during different
times of a year. The demand for products like soft drinks, woolens and
refrigerators, also exhibits seasonal variations. An illustration of seasonal
variations is provided in Fig. 2.2.
Fig. 2.1. Trend
Fig. 2.2. Seasonal variations
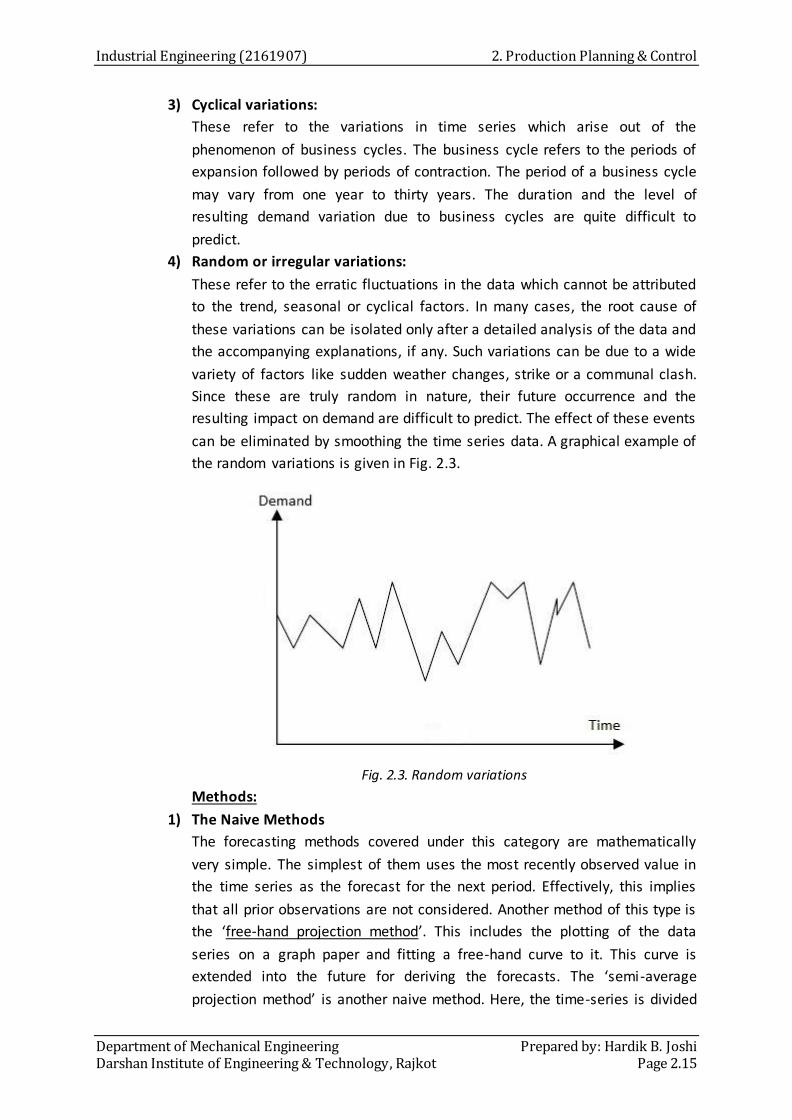
Industrial Engineering (2161907) 2. Production Planning & Control
Department of Mechanical Engineering Prepared by: Hardik B. Joshi Darshan Institute of Engineering & Technology, Rajkot Page 2.15
3) Cyclical variations:
These refer to the variations in time series which arise out of the
phenomenon of business cycles. The business cycle refers to the periods of
expansion followed by periods of contraction. The period of a business cycle
may vary from one year to thirty years. The duration and the level of
resulting demand variation due to business cycles are quite difficult to
predict.
4) Random or irregular variations:
These refer to the erratic fluctuations in the data which cannot be attributed
to the trend, seasonal or cyclical factors. In many cases, the root cause of
these variations can be isolated only after a detailed analysis of the data and
the accompanying explanations, if any. Such variations can be due to a wide
variety of factors like sudden weather changes, strike or a communal clash.
Since these are truly random in nature, their future occurrence and the
resulting impact on demand are difficult to predict. The effect of these events
can be eliminated by smoothing the time series data. A graphical example of
the random variations is given in Fig. 2.3.
Fig. 2.3. Random variations
Methods:
1) The Naive Methods
The forecasting methods covered under this category are mathematically
very simple. The simplest of them uses the most recently observed value in
the time series as the forecast for the next period. Effectively, this implies
that all prior observations are not considered. Another method of this type is
the ‘free-hand projection method’. This includes the plotting of the data
series on a graph paper and fitting a free-hand curve to it. This curve is
extended into the future for deriving the forecasts. The ‘semi-average
projection method’ is another naive method. Here, the time-series is divided
2. Production Planning & Control Industrial Engineering (2161907)
Prepared by: Hardik B. Joshi Department of Mechanical Engineering Page 2.16 Darshan Institute of Engineering & Technology, Rajkot
into two equal halves, averages calculated for both, and a line drawn
connecting the two semi averages. This line is projected into the future and
the forecasts are developed.
2) Simple Moving Average Method
When demand for a product is neither growing nor declining rapidly, and if it
does not have seasonal characteristics, a moving average can be useful can
be useful in removing the random fluctuations for forecasting. Although
moving averages are frequently centered, it is more convenient to use pas t
data to predict the following period directly.
To illustrate, a centered five-month average of January, February, March,
April and May gives an average centered on March. However, all five months
of data must already exist. If our objective is to forecast for June, we must
project our moving average- by some means- from March to June. If the
average is not centered but is at forward end, we can forecast more easily,
though we may lose some accuracy. Thus, if we want to forecast June with a
five-month moving average, we can take the average of January, February,
March, April and May. When June passes, the forecast for July would be the
average of February, March, April, May and June.
Although it is important to select the best period for the moving average,
there are several conflicting effects of different period lengths. The longer
the moving average period, the more the random elements are smoothed
(which may be desirable in many cases). But if there is a trend in the data-
either increasing or decreasing-the moving average has the adverse
characteristic of lagging the trend. Therefore, while a shorter time span
produces more oscillation, there is a closer following of the trend.
Conversely, a longer time span gives a smoother response but lags the trend.
The formula for a simple moving average is
𝐹𝑡 =𝐴𝑡−1 + 𝐴𝑡−2 + 𝐴𝑡−3+. … … … . +𝐴𝑡−𝑛
𝑛
where, 𝐹𝑡 = Forecast for the coming period, 𝑛 = Number of period to be
averaged and 𝐴𝑡−1 , 𝐴𝑡−2, 𝐴𝑡−3 and so on are the actual occurrences in the in
the past period, two periods ago, three periods ago and so on respectively.
Characteristics of moving averages
1) The different moving averages produce different forecasts.
2) The greater the number of periods in the moving average, the greater the
smoothing effect.
3) If the underlying trend of the past data is thought to be fairly constant with
substantial randomness, then a greater number of periods should be chosen.
4) Alternatively, if there is thought to be some change in the underlying state of
the data, more responsiveness is needed, therefore fewer periods should be
included in the moving average.

Industrial Engineering (2161907) 2. Production Planning & Control
Department of Mechanical Engineering Prepared by: Hardik B. Joshi Darshan Institute of Engineering & Technology, Rajkot Page 2.17
Limitations of moving averages
1) Equal weighting is given to each of the values used in the moving average
calculation, whereas it is reasonable to suppose that the most recent data is
more relevant to current conditions.
2) An n period moving average requires the storage of n – 1 values to which is
added the latest observation. This may not seem much of a limitation when
only a few items are considered, but it becomes a significant factor when, for
example, a company carries 25,000 stock items each of which requires a
moving average calculation involving say 6 months’ usage data to be
recorded.
3) The moving average calculation takes no account of data outside the period
of average, so full use is not made of all the data available.
4) The use of the unadjusted moving average as a forecast can cause misleading
results when there is an underlying seasonal variation.
3) Weighted Moving Average
Whereas the simple moving average gives equal weight to each component
of the moving average database, a weighted moving average allows any
weights to be placed on each element, providing, of course, that the sum of
all weights equals 1.
The formula for a weighted moving average is
𝐹𝑡 = 𝑤1𝐴𝑡−1 + 𝑤2 𝐴𝑡−2 + 𝑤3 𝐴𝑡−3+. … … … . +𝑤𝑛𝐴𝑡−𝑛
Choosing Weights
Experience and trial and error are the simplest ways to choose weights. As a
general rule, the most recent past is the most important indicator of what to
expect in the future, and, therefore, it should get higher weighting. The past
month's revenue or plant capacity, for example, would be a better estimate
for the coming month than the revenue or plant capacity of several months
ago.
However, if the data are seasonal, for example, weights should be
established accordingly. For example, sales of air conditioners in May of last
year should be weighted more heavily than sales of air conditioners in
December.
The weighted moving average has a definite advantage over the simple
moving average in being able to vary the effects of past data. However, it is
more inconvenient and costly to use than the exponential smoothing
method, which we examine next.
4) Exponential Smoothing
In the previous methods of forecasting (simple and weighted moving
average), the major drawback is the need to continually carry a large amount
of historical data. (This is also true for regression analysis techniques, which

2. Production Planning & Control Industrial Engineering (2161907)
Prepared by: Hardik B. Joshi Department of Mechanical Engineering Page 2.18 Darshan Institute of Engineering & Technology, Rajkot
we soon will cover) As each new piece of data is added in these methods, the
oldest observation is dropped, and the new forecast is calculated. In many
applications (perhaps in most), the most recent occurrences are more
indicative of the future than those in the more distant past. If this premise is
valid – “that the importance of data diminishes as the past becomes more
distant” - then exponential smoothing may be the most logical and easiest
method to use.
The reason this is called exponential smoothing is that each increment in the
past is decreased by (1-α).
The simplest formula is
New forecast = Old forecast + α (Latest Observation – Old Forecast)
where α (alpha) is the smoothing constant.
Or Mathematically,
𝐹𝑡 = 𝐹𝑡 −1 + 𝛼(𝐴𝑡−1 − 𝐹𝑡−1 )
𝐹𝑡 = 𝛼𝐴𝑡−1 + (1 − 𝛼)𝐹𝑡−1
Where
𝐹𝑡 = The exponentially smoothed forecast for period t
𝐹𝑡−1 = The exponentially smoothed forecast made for the prior period
𝐴𝑡−1 = The actual demand in the prior periods
α = The desired response rate, or smoothing constant
Exponential smoothing techniques have become well accepted for six major
reasons:
1) Exponential models are surprisingly accurate
2) Formulating an exponential model is relatively easy
3) The user can understand how the model works
4) Little computation is required to use the model
5) Computer storage requirement are small because of the limited use of
historical data
6) Tests for accuracy as to how well the model is performing are easy to
compute
2.10.3 Causal Methods
Casual methods try to identify the factors which causes the variation of demand and
try to establish a relationship between the demand and these factors.
In the method, the analyst tries to identify those forecast that best explain the level
of sales of the product. This process is called econometric forecasting.
Objective of the method: To establish a cause and effective relationship between the
changes in the sales level of the product and set of relevant explanatory variable.
Methods:
1) Regression Analysis (Least square method)
Regression can be defined as a functional relationship between two or more
correlated variables. It is used to predict one variable given the other. The

Industrial Engineering (2161907) 2. Production Planning & Control
Department of Mechanical Engineering Prepared by: Hardik B. Joshi Darshan Institute of Engineering & Technology, Rajkot Page 2.19
relationship is usually developed from observed data. The data should be
plotted first to see if they appear linear or if at least parts of the data are
linear. Linear regression refers to the special class of regression where the
relationship between variables forms a straight line (Least square method is
use for the solution).
The linear regression line is of the form 𝑌 = 𝑚 ∙ 𝑋 + 𝑐, where 𝑌 is the value
of the dependent variable that we are solving for, a is the Y intercept, b is the
slope, and 𝑋 is the independent variable. (In time series analysis, X is units of
time)
The value of the 𝑎 and 𝑏 are determined by the two simultaneous equations.
Ʃ𝑌 = 𝑚 ∙ Ʃ𝑋 + 𝑛 ∙ 𝑐
Ʃ𝑋𝑌 = 𝑚 ∙ Ʃ𝑋2 + 𝑐 ∙ Ʃ𝑋
Above two equations are called normal equations.
To compute the value of 𝑚 and 𝑐
1) Calculate the Ʃ𝑋 𝑎𝑛𝑑 Ʃ𝑌
2) Find the value of Ʃ𝑋2
3) Find the value of Ʃ𝑋𝑌
4) Calculate the value of 𝑚 and 𝑐
Linear regression is useful for long-term forecasting of major occurrences and
aggregate planning. For example, linear regression would be very useful to
forecast demands for product families. Even though demand for individual
products within a family may vary widely during a time period, demand for
the total product family is surprisingly smooth.
The major restriction in using linear regression forecasting is, as the name
implies, that past data and future projections are assumed to fall about a
straight line. Although this does limit its application, sometimes, if we use a
shorter period of time, linear regression analysis can still be used. For
example, there may be short segments of the longer period that are
approximately linear.
2.11 Forecast Error
The demand for the product is forecasted using many forecasting methods. It is
essential to have a good measure of effectiveness of the methods. Forecasting error is the numerical difference between the forecasted demand and
the actual demand. The error should be minimum as far as possible. Types of Error:
1) MAD (Mean Absolute deviation): It is a measure of forecast error and it measure the average forecast error
without direction.
𝑀𝐴𝐷 = ∑𝐹𝑜𝑟𝑒𝑐𝑎𝑠𝑡𝑒𝑑 𝑑𝑒𝑚𝑎𝑛𝑑 − 𝐴𝑐𝑡𝑢𝑎𝑙 𝑑𝑒𝑚𝑎𝑛𝑑
𝑛
𝑛
𝑗 =1
2. Production Planning & Control Industrial Engineering (2161907)
Prepared by: Hardik B. Joshi Department of Mechanical Engineering Page 2.20 Darshan Institute of Engineering & Technology, Rajkot
Where, n=number of periods
(Note: In MAD, errors are measured without considering a sign)
Thus it expresses the magnitude but not the direction of error. This absolute
value referred as Mean Absolute Deviation.
2) BIAS:
It is a measure of forecast error and it measure the average forecast error
with direction.
This is also calculated as sum of forecast error for all period divided by the
total number of periods.
𝐵𝐼𝐴𝑆 = ∑𝐹𝑜𝑟𝑒𝑐𝑎𝑠𝑡𝑒𝑑 𝑑𝑒𝑚𝑎𝑛𝑑 − 𝐴𝑐𝑡𝑢𝑎𝑙 𝑑𝑒𝑚𝑎𝑛𝑑
𝑛
𝑛
𝑗=1
Where, n=number of periods
Bias indicates the directional tendency of forecast errors.
(Note: In Bias, errors are measured with considering a sign)
Bias indicates the directional tendency of forecast error. If the forecast
repeatedly overestimates actual demand Bias will have positive value and
underestimation will be indicated by a negative Bias.
2.12 Line Balancing
Line balancing is an effective tool to improve the throughput of assembly line while reducing nonvalue-added activities, cycle time.
LB is the problem of assigning operation to workstation along an assembly line, in such a way that assignment is optimal in some sense. The methodology adopted includes calculation of cycle time of process, identifying the non-value-added activities, calculating total work load on station and distribution of work load on each
workstation by line balancing, in order to improve the efficiency of line. Need of LB
We use line balancing technique to achieve 1) The minimization of the number of workstations;
2) The minimization of cycle time; 3) The maximization of workload smoothness;
4) The maximization of work relatedness. Line balancing primary focus is on minimizing waste related to over production,
inventory, defects, transportation, motion, waiting. Assembly Line Balancing (ALB) is one way to achieve that.
An assembly line balancing can be considered as a “Production Sequence” where the part is assembled together to form the end product. The operation is carried out at
different work stations situated along the line. Advantages of assembly line (Flow line)
1) Uniform rate of production 2) Less material handling
3) Less work-in-progress 4) Easy production control
5) Effective use of facilities/labor

Industrial Engineering (2161907) 2. Production Planning & Control
Department of Mechanical Engineering Prepared by: Hardik B. Joshi Darshan Institute of Engineering & Technology, Rajkot Page 2.21
6) Less congestion
Disadvantages of assembly line (Flow line) 1) More capital investment 2) Low flexibility 3) Monotony work for operators
Methodology adopted for line balancing as follows Removing non value added activities
1) Value Adding: Any process that changes the nature, shape or characteristics of the product, in line with customer requirements. ex: machining, assembly.
2) Non-Value adding: Any work carried out that does not increase product value ex. inspection, part movement, tool changing, and maintenance.
3) Waste: All other meaningless, non-essential activities that do not add value to the product you can eliminate immediately e.g. looking for tools, waiting
time.
Fig.2.4. Flowchart for line balancing
2.11.1 Terms in Line Balancing Technique
In assembly line balancing system, there is various term normally used. 1) Cycle Time: Cycle time is the Maximum amount of time allowed at each
station. This can be found by dividing required units to production time available per day.
𝐶𝑦𝑐𝑙𝑒 𝑡𝑖𝑚𝑒 =𝑃𝑟𝑜𝑑𝑢𝑐𝑡𝑖𝑜𝑛 𝑡𝑖𝑚𝑒 𝑝𝑒𝑟 𝑑𝑎𝑦
𝑈𝑛𝑖𝑡 𝑟𝑒𝑞𝑢𝑖𝑟𝑒𝑑 𝑝𝑒𝑟 𝑑𝑎𝑦
2) Lead Time: Summation of production times along the assembly line. 𝐿𝑒𝑎𝑑 𝑡𝑖𝑚𝑒 = Ʃ (𝑃𝑟𝑜𝑑𝑢𝑐𝑡𝑖𝑜𝑛 𝑡𝑖𝑚𝑒 𝑎𝑙𝑜𝑛𝑔 𝑡ℎ𝑒 𝑎𝑠𝑠𝑒𝑚𝑏𝑙𝑦 𝑙𝑖𝑛𝑒)
3) Bottleneck: Delay in transmission that slow down the production rate. This can be overcome by balancing the line.
Re-allocate work and re-balance
Update calculation
Reduce Non-value-added and Eliminate Waste
Cycle time
Can this be
improved?
Complete work instruction & implement
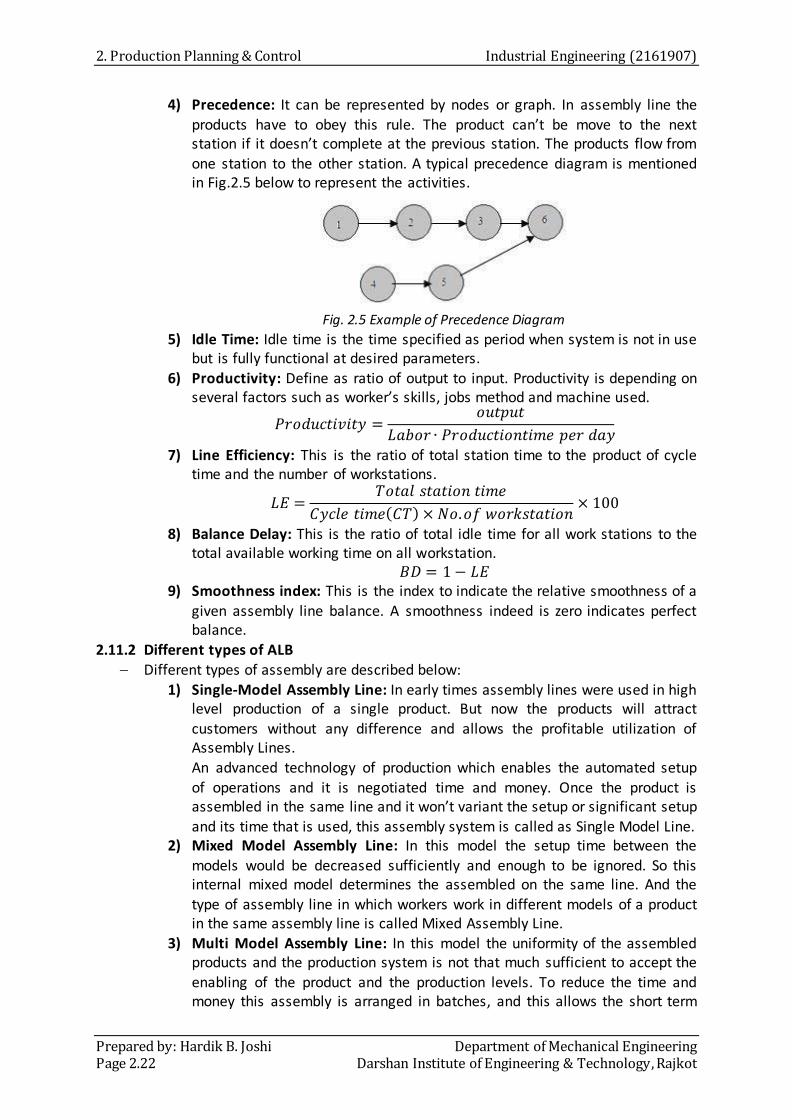
2. Production Planning & Control Industrial Engineering (2161907)
Prepared by: Hardik B. Joshi Department of Mechanical Engineering Page 2.22 Darshan Institute of Engineering & Technology, Rajkot
4) Precedence: It can be represented by nodes or graph. In assembly line the
products have to obey this rule. The product can’t be move to the next station if it doesn’t complete at the previous station. The products flow from one station to the other station. A typical precedence diagram is mentioned in Fig.2.5 below to represent the activities.
Fig. 2.5 Example of Precedence Diagram
5) Idle Time: Idle time is the time specified as period when system is not in use but is fully functional at desired parameters.
6) Productivity: Define as ratio of output to input. Productivity is depending on several factors such as worker’s skills, jobs method and machine used.
𝑃𝑟𝑜𝑑𝑢𝑐𝑡𝑖𝑣𝑖𝑡𝑦 =𝑜𝑢𝑡𝑝𝑢𝑡
𝐿𝑎𝑏𝑜𝑟 ∙ 𝑃𝑟𝑜𝑑𝑢𝑐𝑡𝑖𝑜𝑛𝑡𝑖𝑚𝑒 𝑝𝑒𝑟 𝑑𝑎𝑦
7) Line Efficiency: This is the ratio of total station time to the product of cycle time and the number of workstations.
𝐿𝐸 =𝑇𝑜𝑡𝑎𝑙 𝑠𝑡𝑎𝑡𝑖𝑜𝑛 𝑡𝑖𝑚𝑒
𝐶𝑦𝑐𝑙𝑒 𝑡𝑖𝑚𝑒(𝐶𝑇) × 𝑁𝑜.𝑜𝑓 𝑤𝑜𝑟𝑘𝑠𝑡𝑎𝑡𝑖𝑜𝑛× 100
8) Balance Delay: This is the ratio of total idle time for all work stations to the total available working time on all workstation.
𝐵𝐷 = 1 − 𝐿𝐸 9) Smoothness index: This is the index to indicate the relative smoothness of a
given assembly line balance. A smoothness indeed is zero indicates perfect balance.
2.11.2 Different types of ALB Different types of assembly are described below:
1) Single-Model Assembly Line: In early times assembly lines were used in high level production of a single product. But now the products will attract
customers without any difference and allows the profitable utilization of Assembly Lines.
An advanced technology of production which enables the automated setup of operations and it is negotiated time and money. Once the product is assembled in the same line and it won’t variant the setup or significant setup and its time that is used, this assembly system is called as Single Model Line.
2) Mixed Model Assembly Line: In this model the setup time between the models would be decreased sufficiently and enough to be ignored. So this internal mixed model determines the assembled on the same line. And the type of assembly line in which workers work in different models of a product in the same assembly line is called Mixed Assembly Line.
3) Multi Model Assembly Line: In this model the uniformity of the assembled products and the production system is not that much sufficient to accept the enabling of the product and the production levels. To reduce the time and money this assembly is arranged in batches, and this allows the short term

Industrial Engineering (2161907) 2. Production Planning & Control
Department of Mechanical Engineering Prepared by: Hardik B. Joshi Darshan Institute of Engineering & Technology, Rajkot Page 2.23
lot-sizing issues which made in groups of the models to batches and the
result will be on the assembly levels. The model of different assembly lines and levels of activities are presented
below in Fig. 2.6, Fig. 2.7 and Fig. 2.8.
Fig. 2.6. Assembly lines for single and multiple products
Fig. 2.7. Investigated kinds of Assembly Line Balancing [ALB]
Fig. 2.8. Production levels in a typical manufacturing environment

2. Production Planning & Control Industrial Engineering (2161907)
Prepared by: Hardik B. Joshi Department of Mechanical Engineering Page 2.24 Darshan Institute of Engineering & Technology, Rajkot
2.13 Process Planning
Process planning established the shortest route that is followed from raw material
stage till it leaves as a finished product.
The activities that are associated with process planning are:
1) List of operation to be performed and their sequence
2) Specification of machine and equipment required
3) Necessary tooling jigs and fixtures
4) Give the manufacturing details with respect to feed, speed and depth of cut
for each operation to be performed
5) It gives the processing time of operations
The information required for process planning
1) Assembly, component drawings and bill of materials
The details give the information regarding the general description of part to
be manufactured, raw material specification, dimensions and tolerances
required, the surface finish and treatment required.
2) Machine or equipment details with respect to ___
The various possible operations that can be performed.
The dimension (max or min) that can be machined on the machines.
The accuracy of the dimensions that can be obtained.
Available feed and speed on the machines.
3) The standard time for operation and details of set up time for each job
This helps to compute the standard time of the operation and hence
production rate.
4) Availability of tooling (both standard and special purpose tooling)
Factors affecting on the process planning
1) Volume (Quantity) of product
2) Delivery dates of product
3) Accuracy and process capability of machines
4) The skill and expertise of manpower
5) Material specification
6) Accuracy requirement of product
Steps in process planning
1) Detailed study of component drawing.
2) List the surfaces to be machined.
3) The surfaces to be machined are combined into basic operations. This step
helps in selection of machine for operations.
4) Determine the work centre, tools cutting tools, jigs and fixtures and
inspection stages and equipment.
5) Determine the speed, feed and depth of cut for each operation.
6) Estimate the operation time.

Industrial Engineering (2161907) 2. Production Planning & Control
Department of Mechanical Engineering Prepared by: Hardik B. Joshi Darshan Institute of Engineering & Technology, Rajkot Page 2.25
7) Find the total time to complete the job taking in to account and loading and
unloading times, handling times and other allowances.
8) Represent the details on process sheet.
2.14 Material Requirement Planning (MRP)
It was discussed in demand forecasting that in the dependent demand situation, i f the demand for an item is known, the demand for other related items can be deduced. For example, if the demand of an automobile is known, the demand of its sub-assemblies and sub components can easily be deduced. For dependent demand situations, normal reactive inventory control systems (i.e. EOQ etc.) are not suitable because they result in high inventory costs and unreliable delivery schedules. More recently, managers have realized that inventory planning systems (such as materials requirements planning) are better suited for dependent demand items.
Definition: “MRP is a simple system of calculating arithmetically the requirements of the input materials at different points of time based on actual production plan. MRP can also be defined as a planning and scheduling system to meet time-phased materials requirements for production operations.”
MRP always tries to meet the delivery schedule of end products as specified in the master production schedule. MRP Objectives:
MRP has several objectives, such as: 1) Reduction in Inventory Cost: By providing the right quantity of material at
right time to meet master production schedule, MRP tries to avoid the cost of excessive inventory.
2) Meeting Delivery Schedule: By minimizing the delays in materials procurement, production decision making, MRP helps avoid delays in
production thereby meeting delivery schedules more consistently. 3) Improved Performance: By stream lining the production operations and
minimizing the unplanned interruptions, MRP focuses on having all components available at right place in right quantity at right time.
MRP System
A simple sketch of an MRP system is shown in figure 2.9. It can be seen from the figure that an MRP system has three major input components:
Fig. 2.9. MRP System

2. Production Planning & Control Industrial Engineering (2161907)
Prepared by: Hardik B. Joshi Department of Mechanical Engineering Page 2.26 Darshan Institute of Engineering & Technology, Rajkot
1) Master Production Schedule (MPS): MPS is designed to meet the market
demand (both the firm orders and forecasted demand) in future in the taken planning horizon. MPS mainly depicts the detailed delivery schedule of the end products. However, orders for replacement components can also be included in it to make it more comprehensive.
2) Bill of Materials (BOM) File: BOM represents the product structure. It encompasses information about all sub components needed, their quantity,
and their sequence of buildup in the end product. Information about the work centers performing buildup operations is also included in it.
3) Inventory Status File: Inventory status file keeps an up-to-date record of each item in the inventory. Information such as, item identification number, quantity on hand, safety stock level, quantity already allocated and the procurement lead time of each item is recorded in this file.
After getting input from these sources, MRP logic processes the available information and gives information about the following:
1) Planned Orders Receipts: This is the order quantity of an item that is planned to be ordered so that it is received at the beginning of the period under
consideration to meet the net requirements of that period. This order has not yet been placed and will be placed in future.
2) Planned Order Release: This is the order quantity of an item that is planned to be ordered in the planned time period for this order that will ensure that
the item is received when needed. Planned order release is determined by offsetting the planned order receipt by procurement lead time of that item.
2.15 Standardization
Standardization is the process of implementing and developing technical standards. Standardization can help to maximize compatibility, interoperability, safety,
repeatability, or quality. It can also facilitate commoditization of formerly custom processes.
A standard is a document which provides, requirements, rules, and guidelines for a process, product or service. These requirements are sometimes complemented by a
description of the process, products or services. Standards are the result of a consensus and are approved by a recognized body.
Standards aim at achieving the optimum degree of order in a given context.
The process of formulating, issuing and implementing standards is called standardization. Aims of standardization:
1) Interchangeability: The suitability for a process, product or service to be used in place of another to fulfil a relevant requirement is called interchangeability. Through a deliberate standardization process, it is possible to make processes, products or services interchangeable, even if they are created in different countries. For example, shaving blades of different brands may be designed to be used in the same razor, injection needles of different sizes and brands may be designed to fit the same hypodermic syringe.
2) Variety reduction: It is popularly believed that variety is the spice of life. While a large number of varieties for a particular process, product or service

Industrial Engineering (2161907) 2. Production Planning & Control
Department of Mechanical Engineering Prepared by: Hardik B. Joshi Darshan Institute of Engineering & Technology, Rajkot Page 2.27
may be helpful to consumers and enable them to select the most
appropriate, this large number of varieties requires large inventories, resulting in high costs to manufacturers. Variety reduction is one of the aims of standardization for the selection, inter alia, of the optimum number of sizes, ratings, grades, compositions and practices to meet prevailing needs.
Balancing between too many and too few varieties is in the best interest of both manufacturers and consumers.
3) Compatibility: Parallel developments of processes, products or services, which are required to be used in combination, pose problems if they are not
compatible. One of the aims of standardization is compatibility, namely, suitability of processes, products or services to be used together under specific conditions to fulfil the relevant requirements, without causing unnecessary interaction. For example, in electronic data processing,
information has to be coded for storage, transmission and retrieval in the form of electronic pulses. To make the code recognizable for any machine
and all times, it has to be standardized. Such standardization helps to establish compatibility between various machines or subsystems and permits expansion features and information exchange amongst different systems.
4) Guarding against factors that affect the health and safety of consumers: Safety of the process, product or service is of great importance if, under certain conditions, the use of the process, product or service may pose a threat to human life or property. Therefore, identification of processes, products or services and them safety parameters, not only under normal use but under possible misuse, is one of the important requirements of standardization. For example, items for human consumption should be free from poisonous substances: if food colors are used in candy or sweets, they
should be free from poisonous substances like lead or arsenic. If an electrical appliance is manufactured, it should be well insulated to be free from
electrical hazards: electric irons, for example, should be designed so as to guard their user against electrical shock from any part of the iron. Safety
standards also broadly cover the requirements to ensure the safety of equipment (e.g. a dustproof enclosure for equipment) and that of people and
the environment (e.g. flameproof enclosures for equipment used in mines). 5) Environmental protection: Environmental protection is an important aim of
standardization: the focus here is on preserving nature from damage that may be caused during the manufacture of a product or during its use or disposal after use. For example, the domestic use of a washing machine should generate only a minimum of pollutants.
6) Better utilization of resources: Achievement of maximum overall economy through better utilization of resources such as capital, human effort and materials is an important aim of standardization. In manufacturing organizations, it is this aspect of standardization of materials, components and production methods that makes it possible to reduce waste and to carry out mass production in an economic way. For example, in construction and civil engineering, the use of the appropriate quantities of cement and steel to achieve a required strength are recommended in building standards and codes of practices.

2. Production Planning & Control Industrial Engineering (2161907)
Prepared by: Hardik B. Joshi Department of Mechanical Engineering Page 2.28 Darshan Institute of Engineering & Technology, Rajkot
7) Better communication and understanding: Whenever the transfer of goods
and services is involved, standards spell out what means of communication are to be used between different parties. Since standards contain information that is recorded in a precise and documented form, they contribute towards better communication and understanding in a large
variety of settings. In public places such as airports, railway stations and highways for instance, standardized signs play an important role.
8) Transfer of technology: Standards act as a good vehicle for technology transfer. Since standards incorporate the results of advances in science,
technology and experience, they reflect the state of the art in technical development. As standardization is a dynamic process, standards are updated as new technologies are developed.
Benefits of standardization:
By its very definition, standardization is aimed at achieving maximum overall economy. Standards provide benefits to different sectors of society. Some of the
benefits of standardization are as follows: 1) For manufacturers, standards:
Rationalize the manufacturing process. Eliminate or reduce wasteful material or labour.
Reduce inventories of both raw material and finished products. Reduce the cost of manufacture.
2) For customers, standards: Assure the quality of goods purchased and services received. Provide better value for money.
Are convenient for settling disputes, if any, with suppliers. 3) For traders, standards:
Provide a workable basis for acceptance or rejection of goods or consequential disputes, if any.
Minimize delays, correspondence, etc., resulting from inaccurate or incomplete specification of materials or products.
4) For technologists, standards: Provide starting points for research and development for further
improvement of goods and services. Advantages of standardization:
1) Simplify decision making. 2) Helps in improving decisions.
3) Makes mass production possible. 4) Increases efficiency of both machines and men. 5) Reduces time of manufacture.
6) Reduces manpower requirements. 7) Reduces cost of production. 8) Standard testing methods improve quality of products. 9) Increases durability and life of products.
10) Makes interchangeability possible for worn out and damaged parts. Disadvantages of standardization:
1) Small scale industry suffers. 2) Loss of motivation

Industrial Engineering (2161907) 2. Production Planning & Control
Department of Mechanical Engineering Prepared by: Hardik B. Joshi Darshan Institute of Engineering & Technology, Rajkot Page 2.29
3) Loss of morale
4) For small scale industry standardization may not be advantageous.
2.16 Work simplification
Performance of the steps comprising a work in a manner that is least expensive (in
terms of effort, money, and time) and consistent with the objective of the work.
Work simplification is in the HR, Teams & Training and Industries, Manufacturing &
Technology.
All aspects of the should be analyzed by applying the following four principles of
work simplification:
1) Elimination: A 100% saving can be accomplished by elimination of
unnecessary equipment, instruments, steps in procedures and movements.
2) Combination: If the functions performed by two instruments or pieces of
equipment can be combined into one instrument or a piece of equipment, or
if two steps in a procedure can be combined to accomplished in one step, a
50% saving can be realized.
3) Rearrangement: It may be possible to rearrange equipment’s and materials in
the operatory, scheduling or steps in process procedures to take better
advantage of available space and time.
4) Simplification: Every effort should be made to simplify equipment and
process procedures in order to introduce a minimum number of variables and
permit the team to function most effectively.
Advantages of simplification:
1) Financial advantages to simplification in improved efficiency, reductions in
customer and staff error, fewer complaints and fewer appeals.
2) It reduces inventory and thus better inventory control.
3) It provides fast delivery and better service after sales.
4) Less overhead and handling expenditures.
5) It helps in simplifying planning and production of parts.
6) It also helps in simplifying in inspection and control.
7) It facilities repairs, services and maintenance of the product.

Department of Mechanical Engineering Prepared By: Jainik Makwana Darshan Institute of Engineering & Technology, Rajkot Page 3.1
3
Productivity and Work Study
Course Contents
3.1 Definitions of productivity
3.2 Reasons for increase or decrease in
productivity
3.3 Productivity improvement tools
3.4 Reaction of management and
workers work study
3.5 Objectives of method analysis
3.6 Procedure of method study
3.7 Recording techniques
3.8 Macro and micro motion Study
3.9 Normal working Area and work
place Design
3.10 Objectives of Work Measurement
3.11 Time Study
3.12 Work Sampling
3.13 Pre-determined motion and time
systems (PMTS)
3.14 Method-Time Measurement (M-T-
M)
3.15 Types of allowances
3.16 Ergonomics

3. Productivity and Work Study Industrial Engineering (2161907)
Prepared by: Jainik Makwana Department of Mechanical Engineering Page 3.2 Darshan Institute of Engineering & Technology, Rajkot
SECTION – I - PRODUCTIVITY
Productivity is directly linked with the performance of the organization. Productivity
is an important factor in improvement of organization's performance.
If the firm has higher productivity, the performance of the organization increases
undoubtedly. For an organization productivity can be termed as reduction in wastage
of, resources such as men, machines and material. If the wastage from the raw
material is reduced from existing conditions, the output will definitely increase
without change in any input so, the ratio of output to the input will increase. This ratio
is termed as productivity.
Productivity is analogues to the efficiency of machine from the definition, it is clear
that if the output is higher at same input, and the productivity will be increased.
Productivity is a quantitative measure of performance. It is the optimized utilization
of all available resources to generate output.
3.1 Definitions of productivity
Many researchers have defined productivity in various terms. Following are some of the
definitions of productivity:
Productivity is about how efficiently a firm can increase its output without increase in
inputs. Inputs include men, machine and materials.
Productivity is a function of producing more and more output with less and less
consumption of resources.
In volumetric measures, productivity is the ratio of output volume to the input volume.
According to Peter Drucker, "Productivity means a balance between all factors of
production that will give the maximum output with the smallest effort."
Productivity is measured for different types of input. Productivity can be measured in terms
of different types of input such as
Material productivity
Labor productivity
Capital productivity
Machine productivity
Aggregate productivity.
Each productivity can defined as the ratio of respective input to the respective output.
3.1.1 Advantages of increased productivity
Advantages of increased productivity is not only limited to the organization which successfully
increases its productivity. Increase in productivity is very fruitful to the whole society. Society
includes organization, employees of the organization, customers of organization as well as to
the nation. Higher productivity leads to:
Better utilization of available resources.
Increase in sales of the organization and it can increase its profit.
It also reduces the cost.

Industrial Engineering (2161907) 3. Productivity and Work Study
Department of Mechanical Engineering Prepared by: Jainik Makwana Darshan Institute of Engineering & Technology, Rajkot Page 3.3
It can help in increase the reputation of the organization.
Living standards of the employees increases.
Employees earn higher salaries as profit is increased.
Customers are highly satisfied. Customers get good qualitative products at lower rate.
Nation gets more revenue as taxation.
Per capita income increases.
GDP of the nation increases.
3.2 Reasons for increase or decrease in productivity
Productivity is the ratio of output to the input for the organization. If the organization is facing
the problem of decrease in productivity, then either the output is decreased or the amount
of input is increased and vice versa. So, reason behind the increase (or decrease) in
productivity is nothing but the increase in output (or decrease) and decrease (or increase) in
input. Broad classification divides the reasons into following categories:
1. Lack of strong managerial capability
2. Lack of attitude of workers
3. Unavailability of qualitative resources
4. Improper financial planning
5. Lack of technological up gradation with time
6. Unfavorable rules and regulations of governing authority
1. Lack of strong managerial capability
Managerial capability represents the ability of the managers to manage their departments in
co-ordination with other departments of the organization. Since productivity is related to the
output of organization, elements related to it are affecting factors for increase or decrease in
productivity. Shop floor management is crucial for affecting the productivity. So, the shop
floor manager must have higher capability in managing the shop floor very well. Poor
management of shop floor can lead to decrease in productivity. Following are the probable
loop holes in managerial capability due to which productivity can be reduced:
Unclear and repetitive changes in instructions to workers are shows poor planning and
scheduling of mangers, leads to reduction in productivity.
Inability of managers to motivate the workers results into degrade action of
productivity. .
Undue promotion to the some workers may demotivate the other workers which
ultimately results into loss of productivity.
If manager fails to adjust the staff size during peak load (or in slack period) results into
working stress results into decrease in productivity.
Efforts from half-heartedly devoted manager’s results into loss or productivity.
From design point of view, frequent changes in design or adoption of nonstandard
design reduce the productivity.
3. Productivity and Work Study Industrial Engineering (2161907)
Prepared by: Jainik Makwana Department of Mechanical Engineering Page 3.4 Darshan Institute of Engineering & Technology, Rajkot
2. Lack of attitude of workers
In spite of good managerial capability, the organization may have low productivity due to the
attitude of the workers. Since the raw materials is converted into finished products by
workers, the behavior and attitude of workers always matters in increase or decrease in
productivity. Following are the unsupportive kind of attitude of workers may result into
reduction of productivity:
Adoption of non-standard working methods reduces productivity.
Higher level of absenteeism of workers without prior information disturbs the
schedule and also effects productivity.
Lack of ethics in workers results into tendency of not doing allotted work results into
reduction of productivity.
Lateness, carelessness or idleness workmanship results into loss of production
ultimately reduce productivity.
Interference of union of workers adversely affects the productivity.
Sometime workers are suffering of wrong belief that higher productivity will lead to
unemployment. So, they have tendency to delay the production which results into loss
of productivity.
3. Unavailability of qualitative resources
Even if the attitude of workers is to increase the productivity; productivity may be reduced
due to qualitative and timely availability of resources. Resources include men, materials and
machines. Improper management of resources results into loss productivity.
Non-standard equipment's and tools results into loss of production.
Unavailability or delay in availability of right tools and items results into loss of
production time.
Old and outdated machines consume more time in repairing and set up. So,
production is lost. Poor quality of raw material results into lower productivity.
Low skilled workers decrease overall productivity of organizations.
Poorly designed plant layout results into unnecessary movements of materials and
workers reduce productivity.
4. Improper financial planning
Improper financial planning is the result of poor management of governing body of the
organizations. Improper financial planning may be due to allocation of money in lower rate
of returns. Also, if company is unable to recover money from clients lead to improper financial
planning.
Due to improper financial planning, the fund may not be available at the time of requirement.
So, organization is not able to meet the need of organization which ultimately leads to erosion
of reputation and ultimately leads to lower productivity.
5. Lack of technological up gradation with time
If organization fails to upgrade the technology, then organization is thrown out of competition
in the market. Today technological advancement is changing the market conditions. So,
lagging in adoption of new technology leads to ultimate failure of the organization.
Industrial Engineering (2161907) 3. Productivity and Work Study
Department of Mechanical Engineering Prepared by: Jainik Makwana Darshan Institute of Engineering & Technology, Rajkot Page 3.5
6. Unfavorable rules and regulations of governing authority
This factor is not within the control of the organization. Any change in policy of governing
authority affects the productivity of the organization. Change in taxation policy and other
changes in rules affect the procurement as well as production schedule of organization.
Prohibition on production of the items may cause even closure of the business.
3.3 Productivity improvement tools Productivity can be improved in three ways:
1. By increasing the output using same input
The output can be improved using same input by improving the current method of production
using method study. It also requires support and rewards from the top management.
2. By producing same output from reduced input
If inputs are reduced and output is same, then the wastage is to be minimized. So, waste
minimization method is applied.
3. By a small increase in input, achieving a substantial increase in output
In this method, existing system is upgrade by small investment and huge rise in productivity
is achieved.
As shown below, following are the different areas where tools and techniques arc needed to
apply to improve the productivity.
Table 3.1 – Productivity Improvement Tools
Management Approach tools and
techniques
Support of management in applying
productivity improving methods.
Development of supportive culture
Application of different motivational
techniques
Improvement in cornmunication
methods to avoid communication gaps.
Promote teamwork attitude
Appropriate salary and wage increment
policy
Change in product design suitable to
production facility
Resource based tools and techniques
Proper planning and control of material
Purchase of high quality material
Replacement of old machines
Application of waste elimination
methods
Employee related tools and techniques
Recognition and appreciation of
employee by financial and non-financial
incentives.
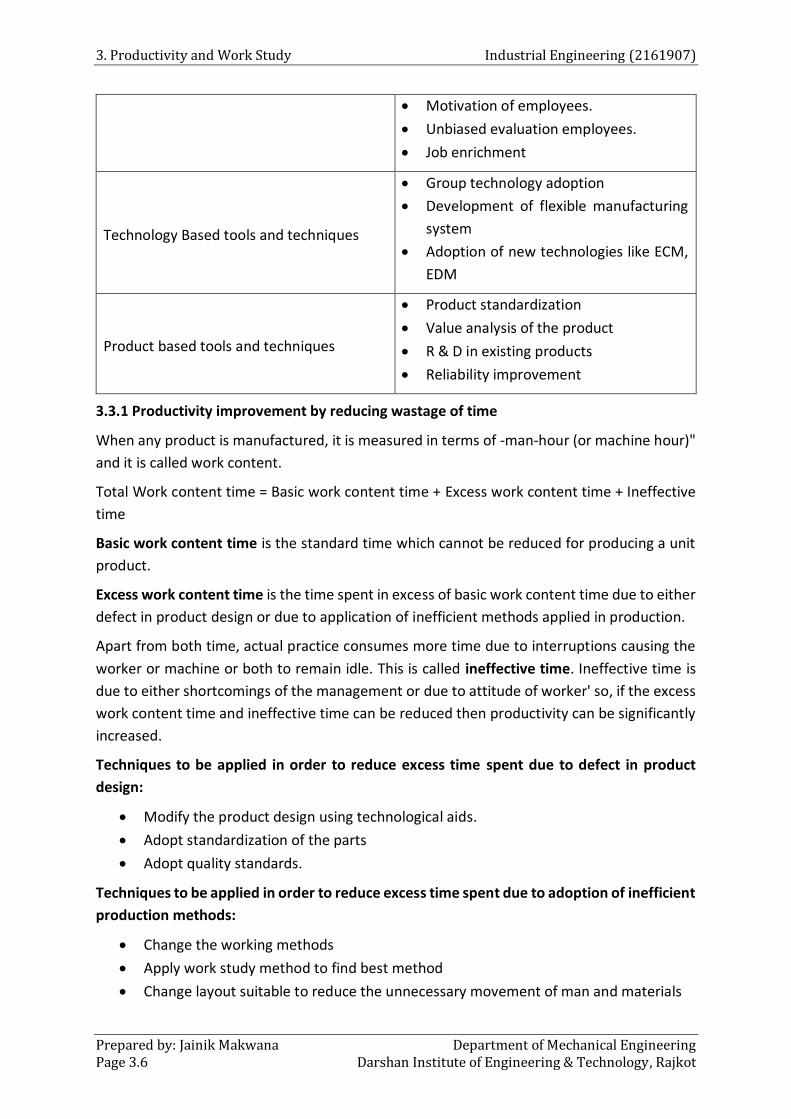
3. Productivity and Work Study Industrial Engineering (2161907)
Prepared by: Jainik Makwana Department of Mechanical Engineering Page 3.6 Darshan Institute of Engineering & Technology, Rajkot
Motivation of employees.
Unbiased evaluation employees.
Job enrichment
Technology Based tools and techniques
Group technology adoption
Development of flexible manufacturing
system
Adoption of new technologies like ECM,
EDM
Product based tools and techniques
Product standardization
Value analysis of the product
R & D in existing products
Reliability improvement
3.3.1 Productivity improvement by reducing wastage of time
When any product is manufactured, it is measured in terms of -man-hour (or machine hour)"
and it is called work content.
Total Work content time = Basic work content time + Excess work content time + Ineffective
time
Basic work content time is the standard time which cannot be reduced for producing a unit
product.
Excess work content time is the time spent in excess of basic work content time due to either
defect in product design or due to application of inefficient methods applied in production.
Apart from both time, actual practice consumes more time due to interruptions causing the
worker or machine or both to remain idle. This is called ineffective time. Ineffective time is
due to either shortcomings of the management or due to attitude of worker' so, if the excess
work content time and ineffective time can be reduced then productivity can be significantly
increased.
Techniques to be applied in order to reduce excess time spent due to defect in product
design:
Modify the product design using technological aids.
Adopt standardization of the parts
Adopt quality standards.
Techniques to be applied in order to reduce excess time spent due to adoption of inefficient
production methods:
Change the working methods
Apply work study method to find best method
Change layout suitable to reduce the unnecessary movement of man and materials

Industrial Engineering (2161907) 3. Productivity and Work Study
Department of Mechanical Engineering Prepared by: Jainik Makwana Darshan Institute of Engineering & Technology, Rajkot Page 3.7
Avoid use of wrong tools and old machines
Techniques to be applied in order to reduce ineffective time due to short comings of the
management:
Poor working conditions causes reduction in productivity. So, change in working
conditions can increase the productivity.
Poor production planning & frequent change in work orders reduces productivity. So,
proper production planning and scheduling is necessary to increase productivity.
More product variety consumes more set up time. So, standardization can reduce this
time.
Poor quality of raw material causes rework as well as loss of material. So, it increases
unit time of the product. In order to reduce it high quality of raw material is to be
purchased.
Poor inventory control causes waiting of the raw material or tool to the worker cause
wastage of time, so, proper inventory control is necessary to increase productivity.
Inadequate safety measures cause more accidents results into loss of productivity.
Techniques to be applied in order to reduce ineffective time due to attitude of worker:
Carless workmanship increase scrap and rework of the product.
Careless workmanship increases accidents'
High irregularities at work disturb the production schedule and reduces the
productivity.
Lateness and idleness adds ineffective time.
3.3.2 Relation between productivity and work study
The important functions of management are setting up the most effective method for
performing the operation and control on utilization of resources.
Work study comprises of method study and work measurement Work study comprises
of method study and work of performing the job and work measurement aims to
determine the of performing least possible time.
By work study the organization can find best method of doing the job and the
minimum time to do the job. So, it can increase the productivity of the organization.
So, in increasing the productivity work study plays major role.

3. Productivity and Work Study Industrial Engineering (2161907)
Prepared by: Jainik Makwana Department of Mechanical Engineering Page 3.8 Darshan Institute of Engineering & Technology, Rajkot
SECTION – 2 - INTRODUCTION TO WORK STUDY
Every organization wants to achieve higher production from less material
consumption. So, for that it is required to increase the productivity. Work study is the
tool which is being used by the industry in order to find out the best and most efficient
way of doing work using available resources.
Work study is consisting of two major areas: First one is the method study and second
one is the work measurement.
Method study is systematic investigation of existing methods of doing job and from
that the aim is to develop and install an easy and efficient procedure for doing the
same job. In this method study, the whole job manufacturing processes are recorded
and based on critical evaluation unnecessary action are eliminated. So, this leads to
less fatigue to worker and this also consumes less time.
Work measurement is the technique in which the measurement of time required to
complete job is carried out by qualified worked at pre-defined level of performance.
Based on that standard time is decided and after calculating the other timings and
allowances normal time is calculating. This helps in rating the workers. It is also called
time study.
3.4 Reaction of management and workers work study
Work study involves analysis of work done by the workers on shop floor and the aim of it is
to find out the best method which reduces the overall time, reduces waste and increases
overall productivity. So, overall profit of the organization will rise. Despite of having many
benefits to both (labours as well as to the management) it is difficult to have favour from both
(tabors as well as to the management).
3.4.1 Workers and Work study
Following are disbelieved threats of work study in mind of workers:
Workers believe that higher productivity will lead to unemployment. Therefore labour
always initially resists the work study implementation.
As a tendency of human being, labour will always resist the change in the existing
system.
So, before applying work study following steps is advised:
Proper consulting of labour has to be done such that they do not fear about
unemployment.
The representatives must be fully taken in confidence about what is going to happen.
They must be clearly taken into faith that due to work study no harmful actions will
be adopted. If they are taken in confidence, then they wiII also explain to the workers.
Workers should have knowledge that ultimate implementation will result in higher
earnings.

Industrial Engineering (2161907) 3. Productivity and Work Study
Department of Mechanical Engineering Prepared by: Jainik Makwana Darshan Institute of Engineering & Technology, Rajkot Page 3.9
As a tendency that workers will always have opposed to the change, so they are
required to be properly explained about its advantages. Even after that the old
workers have resistance, and then they should be left out of change.
When any worker is observed for his work by stop watch, he will be under pressure.
So, his performance will be affected. To avoid this pressure, worker must be clearly
informed that he must not be disturbed.
3.4.2 Management and Work study
On the part of management, there two main difficulties:
Same as to labour, the management will also have the same resistance to change. So,
they are also required to be taken into confidence.
When work study experts arc active in the shop floor, they are directly instructing the
workers. So, the mangers of the organization feel that their positions are being taken
by other persons. So, they are not ready to support the work study.
So, before applying work study following steps is advised to the management:
Work study man must not directly deal with workers. They should give instructions to
the workers through manager.
The work study experts must not discuss any other matters with the workers.
The work study man must also seek help from the foremen and foremen should
support.

3. Productivity and Work Study Industrial Engineering (2161907)
Prepared by: Jainik Makwana Department of Mechanical Engineering Page 3.10 Darshan Institute of Engineering & Technology, Rajkot
Section 2.1 - Method Study
3.5 Objectives of method analysis
Method study is systematic investigation of existing methods of doing job and from that the
aim is to develop and install an easy and efficient procedure for doing the same job. So, we
can summarize the objectives of method study as follows:
1. To improve the present method of doing the job'
2. To reduce unnecessary movements of men, machines and materials.
3. To change the plant layout in order to change the method of doing the job and so
plant layout will be improved'
4. To improve utility of men, machines and materials'
5. To improve overall working environment'
6. Economy in human effort and the reduction of unnecessary fatigue.
7. Improvement in quality of products.
3.6 Procedure of method study
Method study involves investigation of the existing methods of performing the job and critical
evaluation of factors affecting the job. Then after it develops new methods of performing the
job. Once new method is developed, it is required to implement the method and then
maintain the new method. This whole procedure can be subdivided as steps as explained
below:
1. Selection of the job
2. Record all the activities of that job
3. critical investigation of activities related to the job
4. Development of alternatives methods & selection of most economical method
5. Implementation of new method
6. Maintain the new method
These are explained below.
1. Selection of the job
For studying is very crucial aspect. Since industries has number of jobs to be
performed, it is very important is select which job is required to be taken for study.
Following are the criteria for selecting a particular job for study:
o Clear evidence of potential cost reduction
o Jobs having high level of scrap and reprocessing cost
o Jobs having high level of bottleneck
o Jobs having more rejection or complaints from customers
o Jobs having inconsistency in quality
Jobs manufactured by conventional methods
Jobs which causing high level of fatigue to the workers
2. Record all the activities that job

Industrial Engineering (2161907) 3. Productivity and Work Study
Department of Mechanical Engineering Prepared by: Jainik Makwana Darshan Institute of Engineering & Technology, Rajkot Page 3.11
Once the job is selected by authorities considering all criteria, the next step is to study
that job thoroughly. For studying the job, it is required to gather all the information
related to the job such as input data, different process to be performed on the job,
record of activities involved in performing the job etc.
Here, the important is to record of all activities involved in the job- for recording the
job various tools and techniques are used. These tools and techniques involves motion
of men, material and machines. Once all input information are collected than critical
examination of the activities are carried out.
3. Critical investigation of activities related to the job
The success of investigation depends on the perfection of input data and recording of
activities on tools and techniques. If the input data and information is perfect, than
investigation can give better results.
The objective of critical examination of recorded facts of an existing method is to
determine the true reasons behind each events. Critical examination involves two
types of questions: Primary questions and
Secondary questions. Primary questions are generally asked for as follows:
o Purpose of the job (Whether it is essential or not)
o Means of doing job (Are device, tools, material for doing the job is right?)
o Sequence of doing job (Is the sequence followed is right?)
o Place of doing job (Is the place of doing job is right?)
o Men doing the job (Is person doing the job is perfect?)
In secondary questions, using brainstorming activity is carried out in order to find out
the alternates of present scenario which can improve the present method of doing
the job.
4. Development of alternatives methods &i selection of most economical method
Based, on brainstorming arid examination of alternatives several alternative methods
arc selected for examination. Those selected methods arc critically evaluated by
higher authorities and based on considering various factors the most economical
method is selected for implementation as replacement of the current method of doing
job.
5. Implementation of new method
Once the alternative method is selected, the plan of implementing that new method
in It may require to do necessary modification or changes of tool place of current
changes of tools, prepare method devices, rnaterials, plant implementation plant
layout.
Once all arrangements and changes are made, few trials are carried out in order to
check that whether new method is fulfilling the objective or not. If required the
alternate may be slightly modified after trials. After adopting the new method it is
implemented in full flange by concerned persons.
6. Maintain the new method

3. Productivity and Work Study Industrial Engineering (2161907)
Prepared by: Jainik Makwana Department of Mechanical Engineering Page 3.12 Darshan Institute of Engineering & Technology, Rajkot
Once the new method is implemented, it is necessary to keep watch that whether new
method is followed by the worker or not. Since workers arc adequate with old methods of
doing the job, they have tendency to slip back into previous method. Also, the results related
to change in method should be measured in order to confirm the success of method analysis.
So, continuous inspection of new method is required in initial period after the
implementation.
3.7 Recording techniques
As mentioned in the second step of method analysis, certain tools and techniques are used
to record the activities. Following are different kinds of charts and diagrams are used as
recording techniques as shown in table.
Table 3.2 - Different process symbols
Activity Symbol Meaning
Operation
Operation represents that
any process is carried out on
the material. So, there is
change in the condition of
the material. Here, the
material is not idle.
Inspection
Inspection represents that
the produced item is
checked for its quality in
terms of specification and
end users.
Final outcome of inspection
either Ieads to acceptance or
rejection of the product (or
part).
Transport
Transportation indicates the
movement of workers,
materials or equipment from
place to place. Any
movements of raw material
or machines or men is
represented using this
symbol.

Industrial Engineering (2161907) 3. Productivity and Work Study
Department of Mechanical Engineering Prepared by: Jainik Makwana Darshan Institute of Engineering & Technology, Rajkot Page 3.13
Delay
Delay indicates that the
schedule of the product is
disturbed due to any reason
such as absent of worker,
due to not availability of
machine or due to any other
reason, the product is kept in
its previous condition. It is
sometime also termed as
temporary storage
Storage
Storage is done either for
raw materials or finished
products. Any form of
products is only processed
after getting any authorized
orders. No further action is
taken it any order comes.
Inspection and operation
When two activities are
carried out simultaneously
on the raw material, symbols
for those activities are
combined.
Here, the symbol represents
combined inspection with
operation.
Operation and
transport
Here, two activities are
combined: operation and
transport of raw materials.
3.7.1 Outline/ operation process chart
Outline process chart is the essential, requirement for critical evaluation and
investigation of the present method. By this chart it is clear that whether any
information is further needed or not.
This process chart is a chart which only shows the overview of the product using only
two symbols: operation and inspection. This kind of chart ensure the sequence of the
product.
This chart show time taken by each operation is shown on the left hand side of the
symbols. On right hand side of the symbol, description of operation is written.

3. Productivity and Work Study Industrial Engineering (2161907)
Prepared by: Jainik Makwana Department of Mechanical Engineering Page 3.14 Darshan Institute of Engineering & Technology, Rajkot
This chart is represented for each small products. So, when the outline process chart
is prepared for any product, different outline process chart are joined using horizontal
line, where it is assembled in real production method.
Figure 3.1 – Outline process chart
3.7.2 Flow Process Chart
After getting the outline process chart, it is required to further analyse it. Flow process
chart is detailed version of outline process chart. Here, more details are mentioned in
the chart using all types of process symbols along with additional information as per
the type of flow process chart.
3.7.2.1 Material type flow process chart
In material type flow process chart the movement of material is tracked throughout
the completion of job. Here every action performed on material is tracked as
represented in the diagram.
Example
A lathe operator wants to prepare a job using lathe so first of all he take raw material
from store using work order. Then he transport the raw material from store to the
lathe machine. He inspect the raw material size in order to finalize the material
required to be removed. He fixes the raw material on the chuck and inspect the
tightness of chuck. Then he starts the lathe machine and does the cutting operation.
Again, cross checking of the job is done. After completing all jobs, he waits for trolley
to be free. Finally he transport the jobs to the assembly department. The diagram or
all activities of worker is as shown in figure:

Industrial Engineering (2161907) 3. Productivity and Work Study
Department of Mechanical Engineering Prepared by: Jainik Makwana Darshan Institute of Engineering & Technology, Rajkot Page 3.15
Figure 3.2 - Flow diagram for Material type
3.7.2.2 Man type flow process chart
In this type of flow process chart, each activity of operator is tracked and recorded on
the diagram. From this diagram, it is easy to find, out the possibility of reducing the
total, time and so to improve the whole process. Take same example of material type
flow process chart, we get the following man type flow process chart.
No. of operation: 2
No. of inspection: 3
No. of transportation: 2
No. of delay: 1
No. of store: 2

3. Productivity and Work Study Industrial Engineering (2161907)
Prepared by: Jainik Makwana Department of Mechanical Engineering Page 3.16 Darshan Institute of Engineering & Technology, Rajkot
Figure 3.3 - Flow diagram for Man type
3.7.3 Two-handed process Chart
In this type of chart, the movements of both hands are shown. Here, first of all left (or
right) hand is observed and then its motions are recorded. Then after other hand is
observed and then its0 motions are recorded. The main aim is to reduce the cycle time
by avoiding unnecessary actions of the hands. The remaining actions and simplified in
order to achieve better performance and also to reduce the fatigue of worker.
Figure 3.4 - Two Handed Process Chart
3.7.4 Multiple activity chart
Multiple activity chart is prepared to record the activities of men and/or machines
when one man is operating more than one machine or when one job is being

Industrial Engineering (2161907) 3. Productivity and Work Study
Department of Mechanical Engineering Prepared by: Jainik Makwana Darshan Institute of Engineering & Technology, Rajkot Page 3.17
processed by more than one person. Here the activity is plotted on common time
scale.
Multiple activity charts arc prepared with the following objectives:
o To detect idle time on machines or on the part of workers.
o Based on tracking idle time, this chart helps in calculating the number of
workers required in a group to perform the job.
o Also, from calculation of idle time, it is possible to calculate number of jobs
that can be performed by a single operator.
o Finally, improved method is developed for doing the job.
Multiple activity chart is following types based on the combination of man and
machine:
1. Man Machine chart
2. Man- Multi-machine chart
3. Multi-man chart on a single job (Gang Chart)
4. Multi-man- single Machine chart
Steps for constructing the multiple activity chart as follows:
1. In multiple activity chart common time scale is prepared all man and/ or
machine.
2. In multiple activity chart, each number of man and machine is calculated as
one subject. For each subject, a single vertical column is prepared.
3. For Each subject respective activities are divided into number of small
elements. For each small element time is calculated using stop watch.
4. Here the activity is either termed as working or idle. The working activities is
shown as hatched area and for the idle tirne it is kept as blank.
5. On the column, of each subject, activities related to corresponding subject is
recorded on a common time scale.
6. A brief description of each activity is mentioned in the chart.
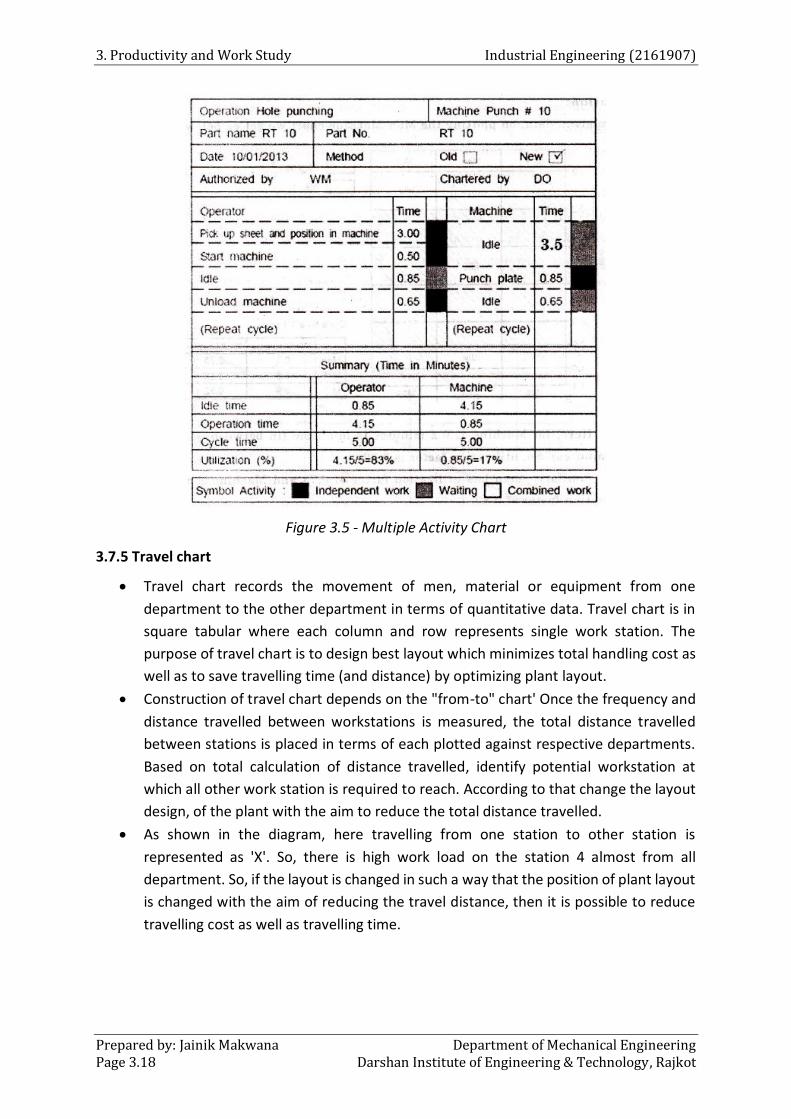
3. Productivity and Work Study Industrial Engineering (2161907)
Prepared by: Jainik Makwana Department of Mechanical Engineering Page 3.18 Darshan Institute of Engineering & Technology, Rajkot
Figure 3.5 - Multiple Activity Chart
3.7.5 Travel chart
Travel chart records the movement of men, material or equipment from one
department to the other department in terms of quantitative data. Travel chart is in
square tabular where each column and row represents single work station. The
purpose of travel chart is to design best layout which minimizes total handling cost as
well as to save travelling time (and distance) by optimizing plant layout.
Construction of travel chart depends on the "from-to" chart' Once the frequency and
distance travelled between workstations is measured, the total distance travelled
between stations is placed in terms of each plotted against respective departments.
Based on total calculation of distance travelled, identify potential workstation at
which all other work station is required to reach. According to that change the layout
design, of the plant with the aim to reduce the total distance travelled.
As shown in the diagram, here travelling from one station to other station is
represented as 'X'. So, there is high work load on the station 4 almost from all
department. So, if the layout is changed in such a way that the position of plant layout
is changed with the aim of reducing the travel distance, then it is possible to reduce
travelling cost as well as travelling time.

Industrial Engineering (2161907) 3. Productivity and Work Study
Department of Mechanical Engineering Prepared by: Jainik Makwana Darshan Institute of Engineering & Technology, Rajkot Page 3.19
Figure 3.6 - Travel Chart
3.7.6 Flow diagram
Flow diagram is a diagram showing the movement of men (or materials) in the plant
layout which is drawn in scale. Here the position of equipment’s, jigs and fixtures are
kept as it is and the movement of men (or materials) is tracked by drawing the actual
path tracked by them. So, it shows real movement of men (or materials) in the plant.
Flow diagram helps in improving the plant layout by analysing the movements of men
(or materials).
3.7.6.1 String diagram
In industry, the worker has to move between numbers of station respectively. If string
diagram is drawn for that movements it becomes too much congested. So in order to
avoid such diagram, string diagram is drawn.
Figure 3.7 – String diagram
First of all, in string diagram, a plant layout is drawn according to the suitable scale.
Then each work station is plotted according to its position and is struck with a pin. A
common thread is taken and it is started to wound from starting point to the next

3. Productivity and Work Study Industrial Engineering (2161907)
Prepared by: Jainik Makwana Department of Mechanical Engineering Page 3.20 Darshan Institute of Engineering & Technology, Rajkot
work station. Using thread, a complete path is plotted among the work stations. The
thread when measured give approximately the total distance travelled between work
stations.
Advantages
Since it gives a clear picture about the movement of the material or man without
complicated diagram.
String diagram is able to posturizes back tracking, bottlenecks and congestion clearly.
It helps in modifying the existing plant layout with the aim to reduce the total distance
moved.
It also gives us the most commonly used work station. So, it gives indication that
location of commonly used work station should be at centre in order to reduce the
travelling distance.
3.7.7 Cycle graph and chrono cycle graph
This is a recording technique related to motion study. This method was developed by
Gilberth. By this method, the track of the path followed by hand of workers is traced
out. Especially, when the movements of hands are very fast, this graph method is
applied. Two recording methods were introduced as discussed below:
3.7.7.1 Cyclograph
It records the path of moving part of the body of the worker when he performing the
job. Small light bulbs are fixed on the moving part of the worker and as the movement
of the moving part occurs, it is traced on photographic plate. So, continuous line of
movement is traced on the photographic plate. This diagram has some drawbacks as
follows:
Figure 3.8 – Cyclograph
It is not showing direction of the movements
Each movement of the moving part is at different speeds. So, from cycle graph it is not
the speed of activities involved.

Industrial Engineering (2161907) 3. Productivity and Work Study
Department of Mechanical Engineering Prepared by: Jainik Makwana Darshan Institute of Engineering & Technology, Rajkot Page 3.21
3.7.7.2 Chrono cycle graph
To overcome the drawback of cycle graph, chrono cycle graph is prepared. Here, light
source is interrupted (at predetermined rate) instead of recording the path of
movements as continuous path. Due to interruption in light source on photographic
plate, line is recorded in pear shaped spot on photographic plate.
Figure 3.9 – Chrono cycle graph
Here, the pointed end of the pear shows direction of movement and the length of pear
represents the speed. Here, the spacing between pear shapes indicates the speed is
increasing or decreasing.
Advantages and limitations
Both kind of graphs help in tracking the complex movements
Both methods can track fast motions
Since, it requires initial cost this method is not preferred
Number of sufficient photographic plate is needed to track many activities
Lights lamps arc mounted on moving part of body. so, it is difficult to manage the work.
3.8 Macro and micro motion Study
Motion study is carried out in the organizations in order to improve the current
working methods. So, based on the improves method fatigue of labour can be reduced
as well as overall quality of the product can be increased
This motion study performed is of two types:
1. Macro motion study and
2. Micro motion study
When any motion study is conducted by normal human eye speed and no further
detail analysis is carried using technological aids, is termed as Macro motion study. In
macro motion study, analysis covers overall operations and detail analysis is not
carried.
In micro motion study, detailed analysis of the recorded methods of production
carried out. Here, using various techniques (such as film analysis), detailed analysis is
done and based on that the decision is taken for removing the unnecessary and
wasteful movements of operator. In micro motion study, each labour activity is
divided into small movements. Each small movement is observed minutely and. based
on that improved method is developed by eliminating unproductive movements of
limbs.

3. Productivity and Work Study Industrial Engineering (2161907)
Prepared by: Jainik Makwana Department of Mechanical Engineering Page 3.22 Darshan Institute of Engineering & Technology, Rajkot
3.8.1 Therbligs
Frank and Lillian Gilberth developed the concept of "Therbligs" to improve production
methods. Therbligs comprise a system for analysing the motions involved in
performing a task. The identification of individual motions, as well as moments of
delay in the process was designed to find unnecessary or inefficient motions and to
utilize or eliminate even split-seconds of wasted time.
Each Therbligs has fixed symbol, colour and explanation of each. Therbligs are used
along with SIMO chart in order to find out that which motion is taking long time along
with reason. Based on that, the ways of reducing the time taking process is applied on
the lengthy activity. Following are different types of Therbligs.
Table 3.3 – Therbligs
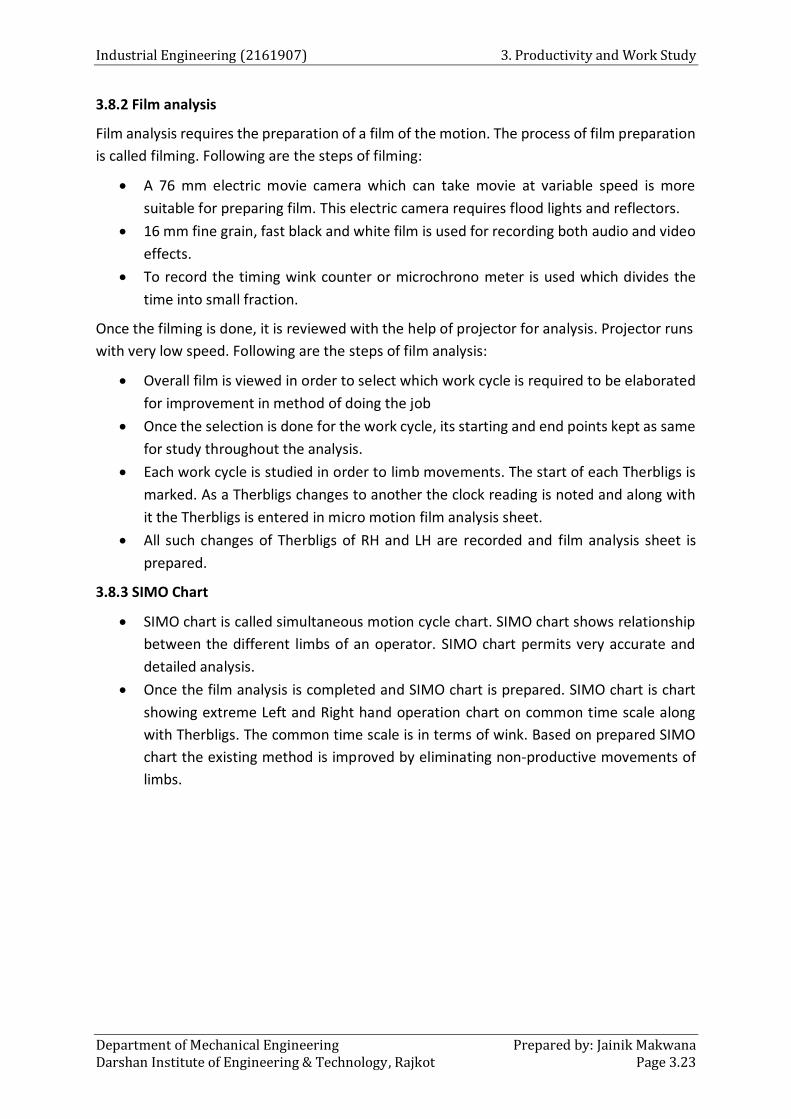
Industrial Engineering (2161907) 3. Productivity and Work Study
Department of Mechanical Engineering Prepared by: Jainik Makwana Darshan Institute of Engineering & Technology, Rajkot Page 3.23
3.8.2 Film analysis
Film analysis requires the preparation of a film of the motion. The process of film preparation
is called filming. Following are the steps of filming:
A 76 mm electric movie camera which can take movie at variable speed is more
suitable for preparing film. This electric camera requires flood lights and reflectors.
16 mm fine grain, fast black and white film is used for recording both audio and video
effects.
To record the timing wink counter or microchrono meter is used which divides the
time into small fraction.
Once the filming is done, it is reviewed with the help of projector for analysis. Projector runs
with very low speed. Following are the steps of film analysis:
Overall film is viewed in order to select which work cycle is required to be elaborated
for improvement in method of doing the job
Once the selection is done for the work cycle, its starting and end points kept as same
for study throughout the analysis.
Each work cycle is studied in order to limb movements. The start of each Therbligs is
marked. As a Therbligs changes to another the clock reading is noted and along with
it the Therbligs is entered in micro motion film analysis sheet.
All such changes of Therbligs of RH and LH are recorded and film analysis sheet is
prepared.
3.8.3 SIMO Chart
SIMO chart is called simultaneous motion cycle chart. SIMO chart shows relationship
between the different limbs of an operator. SIMO chart permits very accurate and
detailed analysis.
Once the film analysis is completed and SIMO chart is prepared. SIMO chart is chart
showing extreme Left and Right hand operation chart on common time scale along
with Therbligs. The common time scale is in terms of wink. Based on prepared SIMO
chart the existing method is improved by eliminating non-productive movements of
limbs.

3. Productivity and Work Study Industrial Engineering (2161907)
Prepared by: Jainik Makwana Department of Mechanical Engineering Page 3.24 Darshan Institute of Engineering & Technology, Rajkot
Figure 3.10 – SIMO chart
3.9 Normal working Area and work place Design
When any person is doing work, his area of work can be divided into three areas:
1. Effective working area
2. Normal working area
3. Maximum working area
Effective working area is the area which is the most convenient area of working.
Generally effective area is a common area nearer to work place and worker.
Normal working area is the area that is within the easy reach of the operator. It is
generally radius of hand movement from elbow. As shown in figure the normal
working are is on the two sides of both hands.
Maximum working area which is accessible, with full arm stretching. This is the
maximum area which can be utilized by shoulder movement.
Figure 3.11 - Normal working Area and Maximum working area

Industrial Engineering (2161907) 3. Productivity and Work Study
Department of Mechanical Engineering Prepared by: Jainik Makwana Darshan Institute of Engineering & Technology, Rajkot Page 3.25
Based on the above discussed areas, the work place should be designed in such a
manner that maximum area should be utilized by the worker. Following are certain
care has to be taken while designing the workplace.
1. Adequate seating and positioned chair should be permitted in order to adjust the chair
with working height and the person's height. Also, proper lighting should be provided
at the work place.
2. In order to eye fatigue, proper contrasting colour should be on the walls of work place.
3. Tools and materials must have mounting positions in order to habituate the worker to
place the right tools at right places. This will also make easy for him to find the
particular tool and it avoids searching
4. Material and tools should have sequence as per the usage and motion of the material
if any.
5. Tools, materials and other operating controls must be within the maximum working
area or as possible as nearer to the worker.
6. For delivering the materials, gravity feed, bins or container should be used. Also, for
finished products, drop deliveries should be available. This leads to avoid the wastage
of time in disposing the material.
Section 2.2 – Work measurement
Work measurement is the application of techniques designed to establish the time for
a qualified worker to carry out specified jobs at a defined level of performance.
Work measurement (WM) is concerned with investigating, reducing and eliminating
ineffective time, whatever may be the cause.
WM is the means of measuring the time taken in the performance of an operation or
series of operations in such a way that the ineffective time is shown up and can be
separated out.
Work measurement is also called by the name ‘time study’. Work measurement is
absolutely essential for both the planning and control of operations. Without
measurement data, we cannot determine the capacity of facilities or it is not possible
to quote delivery dates or costs. We are not in a position to determine the rate of
production and also labor utilization and efficiency.
3.10 Objectives of Work Measurement
The use of work measurement as a basis for incentives is only a small part of its total
application.
The objectives of work measurement are to provide a sound basis for:
1. Comparing alternative methods.
2. Assessing the correct initial manning (manpower requirement planning).
3. Planning and control.
4. Realistic costing.
5. Financial incentive schemes.

3. Productivity and Work Study Industrial Engineering (2161907)
Prepared by: Jainik Makwana Department of Mechanical Engineering Page 3.26 Darshan Institute of Engineering & Technology, Rajkot
6. Delivery date of goods.
7. Cost reduction and cost control.
8. Identifying substandard workers and training new employees.
Various techniques of work measurement are:
1. Time study (stop watch technique),
2. Synthesis,
3. Work sampling,
4. Predetermined motion and time study,
5. Analytical estimating.
3.11 Time Study
The time study is a classical stopwatch study involves timing a sample of a worker's
performance and using it to set a standard. The standard time is the time required by
an average worker to perform a job once.
Time study was proposed by Frederick W. Taylor in 1881.
It requires trained and experienced observers to measure the time because the
standard time cannot be set before the work is performed.
More appropriate when the task is repetitive in nature.
Applications of Time Study
Example 1: When we give car to a repair shop, we always like to know how much time
it will take to get the car serviced. The estimate of time taken to service a car is
provided by the service personnel based on the standard set after performing time
study on various instances of car repair and servicing.
Example 2: In services, time study is performed to measure and simplify work which
can help in reducing cost. For example, customers seeking standard queries from
banks can be directed to customer service representative or a call center executive in
place of entertaining these customers in the bank branches. It will help in saving the
branch employee's time.
Steps to perform Time Study
1. Define the task or objective to be studied
2. Decide how many times to measure the task. Time study is a sampling process. It is
important to decide the number of cycles or samples needed and the required level
of confidence in the estimated time standards to set standard time
3. Divide the task into precise elements
4. Time and record each element time a worker would take to complete the task
element. Rate the performance of worker. Let the experienced analyst record the
time.
5. Complete the average cycle time for each task element as given below:

Industrial Engineering (2161907) 3. Productivity and Work Study
Department of Mechanical Engineering Prepared by: Jainik Makwana Darshan Institute of Engineering & Technology, Rajkot Page 3.27
6. Determine the performance rating and normal time for each task element as given
below:
Normal time= [Average observed time] x [Performance rating factor]
Performance rating factor:
Rating is the process during which the time study observer or analyst compares the
performance of the worker observed with analyst’s own concept of normal
performance. The performance in terms of speed of the worker is rated as a
percentage with normal performance equal to 100 percent which is adjusted to the
observed time.
7. Add the normal times for each element to develop a total time for the job.
8. Compute the standard time as given below.
Time Study Equipment
Mainly a timing device and an observation board. The timing devices used are:
1. Stop watch or electronic timer.
2. Motion picture camera with constant-speed motor drive or with a micro
chronometer in the picture to indicate time.
3. Electronic data collector and computer.
Use of Time Study
It is used for many purposes including:
1. Determining schedules and planning work.
2. Determining standard costs and as an aid in preparing budgets.
3. Estimating the cost of a product before manufacturing it.
4. Determining machine effectiveness, the number of machines which one person
can operate, and as an aid in balancing assembly lines a work done on a conveyor.
5. Determining time standards to be used as a basis for a wage incentive to direct
and indirect labour.
6. Determining time standards to be used as a basis for labour cost control.
3.12 Work Sampling
Estimates the percentage of time that worker spends on various activities.
Developed by L. Tippet in 1930s.
Used to analyse the jobs that have non-repetitive elements.

3. Productivity and Work Study Industrial Engineering (2161907)
Prepared by: Jainik Makwana Department of Mechanical Engineering Page 3.28 Darshan Institute of Engineering & Technology, Rajkot
Also used to determine ratio delay which is the percentage of time a worker is delayed
or idle.
Work sampling involves random observations to record the activity that the worker is
performing.
Work sampling helps in determining how employees allocate their time. So, the study
can be utilized to set staffing levels, reassign duties, estimate various costs and set
delay allowances.
Easier approach and less expensive than time study.
Example: An IT manager takes 400 instantaneous observations at random intervals on a
coder over few weeks to find out that the coder was doing coding job in 270 observations
whereas the coder was idle for 130 observations due to miscellaneous reasons. So, we
can see that the coder remains idle for (130/400) x 100 = 32.5% of the time. No doubt the
accuracy of such results depends on the number of observations.
Steps of work sampling procedure
1. Take a Preliminary sample to obtain estimates of the parameter values.
2. Compute the sample size required.
3. Prepare a schedule for random observations at appropriate times.
4. Observe and record employee activities
5. Record the performance indicator like number of units produced or any other
services rendered during the study.
6. Compute the normal time and standard time per service.
Sample size for Work Sampling
1. Parameter to be estimated can be the percentage of time a worker is busy or a
worker is idle.
2. Determine the number of observations or sample size, n, considering desired
confidence level and accuracy as given below
, where
Z = Standard normal deviate for the desired confidence level (derived from normal
form)
P = Estimated value of sample proportion
h = Acceptable error level in percent
Even though the large number of observations will give more accuracy, there should
be some limit beyond which accuracy is not worthwhile economically. It incurs a good
percentage of cost in conducting the work sampling study with large number of
observations.

Industrial Engineering (2161907) 3. Productivity and Work Study
Department of Mechanical Engineering Prepared by: Jainik Makwana Darshan Institute of Engineering & Technology, Rajkot Page 3.29
In work sampling it is determined that whether the employee is busy or idle during
the observation, a ratio is given to the employee, and the units produced are totalled
in order to produce an average.
This data can be used to determine the normal time and standard time as mentioned
below.
The standard time can be determined by considering allowances and the normal time
as determined in Time study.
Application of work sampling
1. Estimation of the percentage of time consumed by various job activities on the part
of, supervisor, engineer, inspector, office personnel etc.
2. Estimation of percentage utilization of machine tools, crane3, in the heavy machine
shop, fork lift tuck in a warehouse which will be helpful in the economic analysis of
equipment’s needed.
3. To compare the efficiency of two departments.
4. To provide more equitable distribution of work in a group.
5. To aid in job evaluation.
6. For appraisal of safety performance.
7. For appraisal of organisational efficiency
8. To determine the nature and extent of 'cycles' and 'peak load' variations in observable
activity.
Advantages of Work Sampling
1. The activities which are impractical or costly to measure by time-study can be
measured readily by work sampling.
2. A single observer can make work sampling study of several operators or machines.
3. The cost and time involved in work sampling study is quite less as compared to that
required for continuous time study.
4. A work sampling study may be interrupted at any time without affecting the results.
5. There is less chance of obtaining misleading results as the operators are not under
close observations.
6. Work sampling studies are less tedious and cause less fatigue to the observer.
7. It is not necessary to use trained time study observer.
8. Stop watch or other timing devices are not required for work sampling studies.
Disadvantages of work sampling
1. Work sampling does not permit finer breakdown of activities and delays. It can't
provide much detailed information.

3. Productivity and Work Study Industrial Engineering (2161907)
Prepared by: Jainik Makwana Department of Mechanical Engineering Page 3.30 Darshan Institute of Engineering & Technology, Rajkot
2. It is economical and practicable only when a large number of operators are observed,
or for studying operators or machines located over wide areas.
3. In certain kinds of work sampling studies, the record of method used by the operators
is not made.
4. Therefore, whenever a method change occurs in any element an entirely new study
must be made.
5. Management and workers may not understand statistical work sampling as readily as
they do time study.
3.13 Pre-determined motion and time systems (PMTS)
PMTS is one of work measurement method of finding out the standard data for doing
the job at a defined level. There are two types of standard data: Macro Data and Micro
Data. Macro data is type of standard data in which the macroscopic method is used to
calculate standard time for doing the job, while in case of micro data microscopic
method is used to calculate standard time.
Generally, .in any industry there are too many jobs which are similar in nature (for
example, drilling a hole in material). So, it is necessary to develop the standard data
for the same repeating the job.
Standard data is catalogue of 'normal time' values for different elements of jobs. This
standard data is compilation of time of required standard elements of job. Standard
data is calculated by two ways:
Macro data and Micro data. Synthetic data is method of macro data and Method-
Time-Measurement (M-T-M) and work factor system are major methods of micro data
for PMTS.
Following is the procedure for PMTS:
1. Select large number of workers doing varieties of jobs under normal working
condition in industries. Here, jobs are so selected that they, are involving most of
the common basic motions.
2. Record the job operations on a movie film.
3. Analyse the film, note down the time taken to complete each element and compile
the data in form of chart.
Now, when it is required to calculate the time for any job, we divide that job into small
most commonly used element. From that chart, we add corresponding elements of
time of doing the job. The objectives of PMTS are as follows:
1. To set the standard time for doing the job.
2. To assist in constructing time formulate.
3. To pre-balance the manufacturing line.
4. To identify need for training of workers and supervisors.
5. To determine wage plans for workers

Industrial Engineering (2161907) 3. Productivity and Work Study
Department of Mechanical Engineering Prepared by: Jainik Makwana Darshan Institute of Engineering & Technology, Rajkot Page 3.31
3.14 Method-Time Measurement (M-T-M)
One of the method of PMTS is MTM. In this method, for each motion certain
predetermined value is assigned and when that particular method is in the job,
predetermined time value is calculated as standard value of doing that motion. So, for
calculating the time for doing the job, job is broken down into number of motions and
predetermined time values are added. MTM has 19 fundamental motions as given
below:
A. Basic Movements
Reach – R Move – M Apply Pressure – AP Position –
P
Grasp – G Release – RL Turn – T Disengage
– D
B. Pedal movements
Walk Turn body Bend Kneel on one leg
Kneel on both legs Stoop Sit Foot motions
C. Two- eye movements
Basic movements
In MTM, all movements have predetermined time and based on its classes of hardness
of particular time is considered for calculation of standard tirne.
1. Reach (B): In reach, hand moves to destination with a predefine objectives. The time
for reach depends- upon the nature moved, nature of destination and also on type of
reach.
2. Move (M): Move involves transporting an object to a definite location.
3. Apply pressure (AP): Apply pressure involves the requirement of effort for overcoming
any resistance for doing work.
4. Position (P): Position means to align, orient or engage an object with another object.
5. Grasp (G): Grasp means picking up an object.
6. Release load (RL): It occurs when the fingers do not have control on an object.
7. Disengage (D): It means to bleak the contact between two objects.
8. Turn (T): Turn is a motion employed to turn hand either empty or loaded about the
axis of forearm
3.15 Types of allowances
Generally allowances are classified in major three categories:
1. Personnel allowances/ Relaxation allowances: In order to meet his personal needs,
workers are visit the drinking water areas and wash rooms. So, depending upon the
working conditions personnel allowances are added in normal time. Generally up to

3. Productivity and Work Study Industrial Engineering (2161907)
Prepared by: Jainik Makwana Department of Mechanical Engineering Page 3.32 Darshan Institute of Engineering & Technology, Rajkot
5o/o of normal time is added at personnel allowance. Where working conditions are
tardier, more allowance is added.
2. Fatigue allowances: As the day passes, weariness of person is increases in both ways,
mentally and physically. It adversely affects the pace of doing work. Hence, as the day
progresses, the time required for doing the same job compared morning is increasing.
This may be due to unhealthy working conditions, physical exertion etc. So, fatigue
allowances are added considering the nature of work, working conditions and
worker's general ability of doing work.
3. Delay allowances/ Contingency allowances: Delays can be of two types: Intentional
delays and unintentional delays. Intentional delays is due to the attitude of the worker
of doing the work or not. Unintentional delays are beyond the control of the operator.
Since intentional delays are causing loss of production to the organization, it is not
calculated in the allowances.
4. Special Allowances: These allowances are given under certain special circumstances.
Some of these allowances and the conditions under which they are given are:
Policy Allowance: Some companies, as a policy, give an allowance to provide a
satisfactory level of earnings for a specified level of performance under exceptional
circumstance. This may be allowed to new employees, handicap employees, workers
on night shift, etc. The value of the allowance is typically decided by management.
Small Lot Allowance: This allowance is given when the actual production period is too
short to allow the worker to come out of the initial learning period. When an operator
completes several small-lot jobs on different setups during the day, an allowance as
high as 15 percent may be given to allow the operator to make normal earnings.
Training Allowance: This allowance is provided when work is done by trainee to allow
him to make reasonable earnings. It may be a sliding allowance, which progressively
decreases to zero over certain length of time. If the effect of learning on the job is
known, the rate of decrease of the training allowance can be set accordingly.
Rework Allowance: This allowance is provided on certain operation when it is known
that some percent of parts made are spoiled due to factors beyond the operator's
control. The time in which these spoiled parts may be reworked is converted into
allowance.
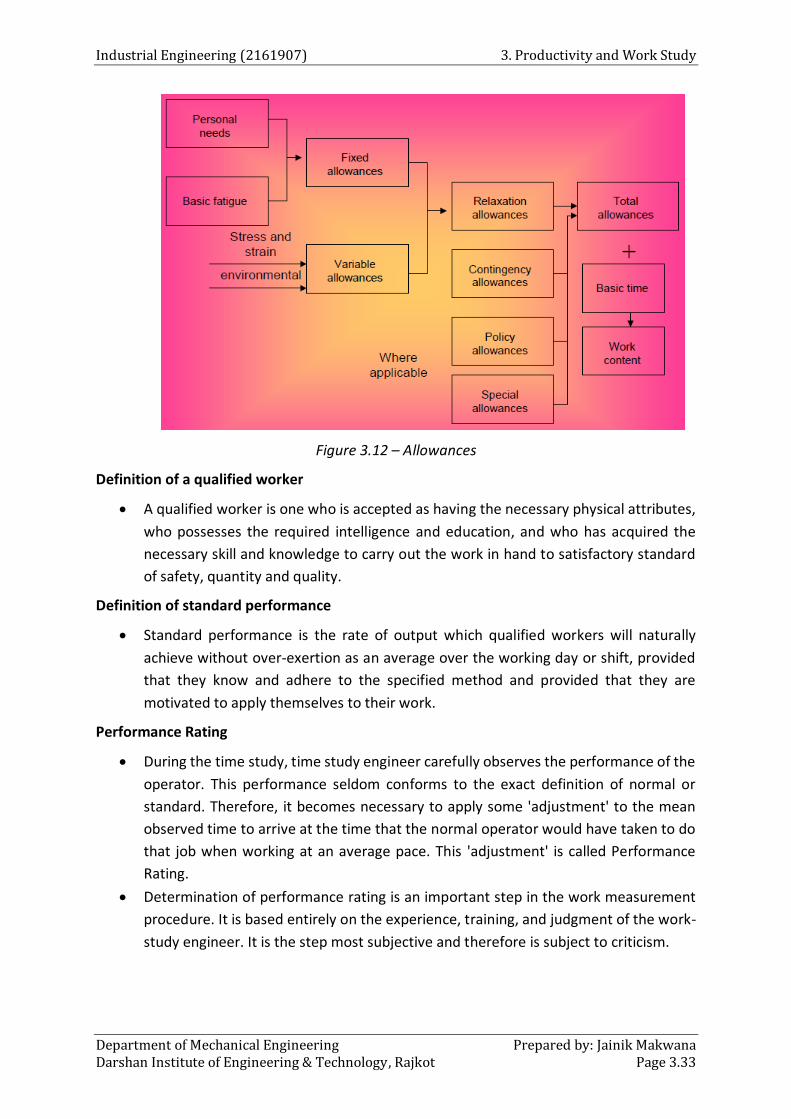
Industrial Engineering (2161907) 3. Productivity and Work Study
Department of Mechanical Engineering Prepared by: Jainik Makwana Darshan Institute of Engineering & Technology, Rajkot Page 3.33
Figure 3.12 – Allowances
Definition of a qualified worker
A qualified worker is one who is accepted as having the necessary physical attributes,
who possesses the required intelligence and education, and who has acquired the
necessary skill and knowledge to carry out the work in hand to satisfactory standard
of safety, quantity and quality.
Definition of standard performance
Standard performance is the rate of output which qualified workers will naturally
achieve without over-exertion as an average over the working day or shift, provided
that they know and adhere to the specified method and provided that they are
motivated to apply themselves to their work.
Performance Rating
During the time study, time study engineer carefully observes the performance of the
operator. This performance seldom conforms to the exact definition of normal or
standard. Therefore, it becomes necessary to apply some 'adjustment' to the mean
observed time to arrive at the time that the normal operator would have taken to do
that job when working at an average pace. This 'adjustment' is called Performance
Rating.
Determination of performance rating is an important step in the work measurement
procedure. It is based entirely on the experience, training, and judgment of the work-
study engineer. It is the step most subjective and therefore is subject to criticism.

3. Productivity and Work Study Industrial Engineering (2161907)
Prepared by: Jainik Makwana Department of Mechanical Engineering Page 3.34 Darshan Institute of Engineering & Technology, Rajkot
Performance Rating can be defined as the procedure in which the time study engineer
compares the performance of operator(s) under observation to the Normal
Performance and determines a factor called Rating Factor.
Cycle Time/ Observed Time
Cycle time is defined as the time duration from starting point of a job to the starting
point of the next job. This time is established from the observation data of an operator
while working at a certain pace.
Example: In a sewing operation, pick up of first piece to pick up of second pieces is
cycle time. In cycle time, material handling time is included with actual work time in a
machine.
Cycle time = Machine Time + Material handling time.
Cycle time is also known as Observed Time.
Basic Time
Basic time of a job is determined by multiplying rating factor to the observed time
(cycle time). Basic time is also expressed as Normal time.
Basic time = (Observed time X Performance Rating)/100
or
Basic Time = (Standard Time - Allowances)
In Basic Time no allowances are included.
Standard Time
Standard time is the time allowed to an operator to carry out the specified task under
specified condition and defined level of performance. This is a standard definition for
standard time.
Some additional time is added to basic time to arrive standard time of a task. In
practice none can work throughout the day without taking rest. Operators need time
for relaxation from fatigue. Various allowances are relaxation allowance, contingency
allowance.
3.16 Ergonomics
Ergonomics is the science which deals with human and his working environment.
Ergonomics considers the effect of working environment on the performance of doing
that job. Ergonomics is also termed as industrial psychology. It combines knowledge
of psychologist, physiologist, engineer, anthropologist and bio-metrician. In general
sense, ergonomics studies the effect of health and safety on worker. Obviously, bad
working conditions will lead to poor performance of the worker and hence
productivity of the worker is reduced. On the other hand, if the working conditions

Industrial Engineering (2161907) 3. Productivity and Work Study
Department of Mechanical Engineering Prepared by: Jainik Makwana Darshan Institute of Engineering & Technology, Rajkot Page 3.35
are pleasant then it will automatically create interest of person in doing the job and
hence the productivity increases.
Objectives of ergonomics
1. To optimize the integration of man and machine in order to improve productivity and
accuracy.
2. To develop work place which fits with the needs of worker.
3. Arrangement of tools and equipment's such that it minimizes mental and physical
strain on the worker by increasing the efficiency.
4. To reduce the fatigue of human while doing the job.
5. To attempt the minimization of risk of injury, illness and accidents without losing
productivity.
If organization wants to develop better working conditions and wants to improve
productivity of the worker, the application of ergonomics is necessary. Following are
the advantages that can be achieved through ergonomics:
a. Higher productivity
b. Increased safety of workers
c. Letter integration of man-machine system
d. Reduced employee turnover
e. Less fatigue to operator
f. Reduce unnecessary movements of operators
g. Higher employee satisfaction

Department of Mechanical Engineering Prepared By: Hardik B. Joshi Darshan Institute of Engineering & Technology, Rajkot Page 4.1
4
Job Evaluation and Wage Plan
Course Contents
4.1 Introduction
4.2 Concept and terminologies of job
evaluation
4.3 Objectives and principles
4.4 The Job Evaluation Factor
4.5 Job Evaluation Process
4.6 Job evaluation methods
4.7 Advantages and limitations of job
evaluation
4.8 Concept of Performance Appraisal
4.9 Objectives of performance appraisal
4.10 Performance Appraisal Process
4.11 Traditional Methods
4.12 Benefits of Performance Appraisals
4.13 Wage/salary differentials
4.14 Methods of wage payment
4.15 Incentives
4.16 Time-based Individual Incentive
Plans
4.17 Output-based individual incentive
plans
4.18 Group incentive plans

4. Job Evaluation and Wage Plan Industrial Engineering (2161907)
Prepared by: Jainik Makwana Department of Mechanical Engineering Page 4.2 Darshan Institute of Engineering & Technology, Rajkot
SECTION - I
JOB EVALUATION
4.1 Introduction
Once a right candidate is placed on a right job, the person needs to be duly
compensated for the job he/she performs. In the pursuit of equal payment, there
should be established a consistent and systematic relationship among base
compensation rates for all the jobs within the organizations. The process of such
establishment is termed „job evaluation‟.
Different jobs in an organization need to be valued to ascertain their relative worth so
that jobs are compensated accordingly and an equitable wage and salary structure is
designed in the organization. This is necessary for sustaining cordial relations within
and between employees and employer. Hence, there is a need for appreciation of
intricacies of the job evaluation in the modern organizations.
4.2 Concept and related terminologies of job evaluation
In the area of job evaluation study, a certain amount of technical terminology is used
in order to facilitate communication. It is therefore desirable to list and understand
allied terms in the job evaluation, as well as some terms that are related to and often
confused with job evaluation
Position: A position is a group of tasks assigned to one individual. There are as many
positions in a firm as there are personnel.
Job: Edwin B. Flippo describes job as a group of positions that are similar as to kind
and level of work. In some instances only one position may be involved, simply
because no other similar position exists. For example, in the typical firm the position
of human resource manager also constitute a job since there is only one human
resource manager in the organizing.
Job Analysis: It is the process of studying and collecting information relating to the
operations and responsibilities of a specific job. The immediate products of this
analysis are job descriptions and job specifications.
Motion study: This also involves study of the job. Motions study is one of the ways of
studying job. It is a process of analysing a job to find the easiest, most effective, and
most economical method of doing it. As such, motion study is a part of the job design
function.
Job description: It is an organized, factual statement of the duties and responsibilities
of a specific job. In brief, it should tell what is to be done, how it is to be done, and
why. It is a standard of function, in that it defines the appropriate and authorized
content of a job.

Industrial Engineering (2161907) 4. Job Evaluation and Wage Plan
Department of Mechanical Engineering Prepared by: Jainik Makwana Darshan Institute of Engineering & Technology, Rajkot Page 4.3
Job specification: It is a statement of the minimum acceptable human qualities
necessary to perform a job properly. It is a standard of personnel and designates the
qualities required for acceptable performance.
Evaluation: Wigley explains evaluation as a data reduction process that involves the
collection of large amounts of data which are analysed and synthesized into an overall
judgment of worth or merit. The implication here is that the judgment of worth can
be supported by the data. In her review, Foxon found similar definitions referring to
judgments of value or worth.
Job Evaluation: It is a systematic and orderly process of determining the worth of a
job in relation to other jobs. The objective of this process is to determine the correct
rate of pay. It is therefore not the same as job analysis. Rather it follows the job
analysis process, which provides the basic data to be evaluated.
Job evaluation is the rating of jobs in an organization. This is the process establishing the
value or worth of jobs in a job hierarchy and compares the relative intrinsic value or worth
of jobs within an organization.
Figure 4.1 – Process of job evaluation
4.3 Objectives and principles
The objectives of job evaluation, to put in a more systematic manner are to:
1. Establish a standard procedure for determining the relative worth of each job in an
organization;
2. Ensure equitable wage for a job and reasonable wage differentials between different
jobs in a hierarchical organization;

4. Job Evaluation and Wage Plan Industrial Engineering (2161907)
Prepared by: Jainik Makwana Department of Mechanical Engineering Page 4.4 Darshan Institute of Engineering & Technology, Rajkot
3. Determine the rate of pay for each job which is fair and equitable with relation to
other jobs in the plant, community or industry;
4. Eliminate wage inequalities;
5. Use as a basis for fixing incentives and different bonus plans;
6. Promote a fair and accurate consideration of all employees for advancement and
transfer;
7. Provide information for work organization, employees‟ selection, placement, training
and other similar purposes;
8. Provide a benchmark for making career planning for the employees in the organization
and;
9. Ensure that like wages are paid to all qualified employees for like work.
Principles of job evaluation
The job evaluation has certain principles. These principles are supposed to be kept in
the mind of the job evaluators. These principles are not only directives of proper job
evaluation but also provide clarity in the process of evaluation. According to Kress,
these principles are:
1. Rate the job and the jobber. Each element should be rated on the basis of what the
job itself requires
2. The elements selected for rating purposes should be easily explainable in terms and a
few in numbers as will cover the necessary requisites for every job without any
overlapping;
3. The elements should be clearly defined and properly selected;
4. Any job rating plan must be sold to foremen and employees. The success in selling it
will depend on a clear-cut explanation and illustration of the plan;
5. Foreman should participate in the rating of jobs in their own departments;
6. Maxim mum co-operation can be obtained from employees when they themselves
have an opportunity to discuss job ratings and;
7. Too many occupational wages should not be established. It would be unwise to adopt
an occupational wage for each total of point values.
4.4 The Job Evaluation Factor
The job evaluation system comprises the following factors: In some cases minor
changes to the wording are used to define factors and levels made in order to better
align the methodology with the client’s culture and environment. Where this is done,
great care is taken to ensure inter-organisation consistency is not compromised. The
primary factor in determining compensation is an evaluation of work performed. The
internal worth of a job is evaluated based upon factor like - Know-How, Problem

Industrial Engineering (2161907) 4. Job Evaluation and Wage Plan
Department of Mechanical Engineering Prepared by: Jainik Makwana Darshan Institute of Engineering & Technology, Rajkot Page 4.5
Solving, and Accountability, Education, Experience, Complexity involved in the job,
Scope of job, Supervision received and, Authority Exercised.
4.5 Job Evaluation Process
Job Evaluation is a technique to rank jobs in an organization on the basis of the duties
and responsibilities assigned to the job. The job evaluation process results in a job
being assigned to a pay grade. The pay grade is associated with a pay range that is
defined by a minimum and a maximum pay rate. A model of job evaluation process
with the following steps is presented bellow
Step One - Job Description - The position supervisor assigns duties and writes the job
description. If there is an incumbent employee, s/he reviews it, and they both sign it.
Instructions and additional assistance are available from Human Resources, if needed. The
job description is a snapshot of the job as it presently exists, reflecting the current duties
and responsibilities of the job and/or the incumbent.
Step Two – Approval - The vice president reviews job descriptions and, if s/he concurs,
approves the responsibilities, requirements, and depart-mental organization contained
within a job description presented for new evaluation, and signs it. If the vice president
does not concur with the contents of the description, it is returned to the supervisor for
changes.
Step Three – Review- Human Resources reviews the job description as submitted with the
supervisor prior to evaluation by the Job Evaluation Committee (Step 4). Human
Resources help ensure that there is consistency and equity in the job descriptions and
titles by editing them for clarity and format. If the Human Resources Office makes
changes, the job description is returned to the supervisor and vice president for signature
prior to being presented to the Job Evaluation Committee (Step 4).
Step Four – Evaluation - The Job Evaluation Committee (JEC) is a multi-member
committee, the members of which are appointed by the Staff Salary Administration
Committee (SSAC), representing employees throughout organization. JEC ensures equity
among jobs through the use of established, consistent criteria for evaluation and prevents
escalation of the job evaluation grades by validating changes in job content presented for
review. Members of JEC receive in-depth training on job evaluation and utilize a
consistently applied point system for the evaluations.
Step Five – Confirmation - SSAC confirms all job evaluations and titles recommended by
JEC. This committee is com-posed of the SLCC Vice Presidents, the human resources
director, and other relevant co-opted experts. After confirmation of the evaluation job
description, SSAC advises the supervisor of the results of the evaluation and the title. The
supervisor then advises the employee of the results of the job evaluation.

4. Job Evaluation and Wage Plan Industrial Engineering (2161907)
Prepared by: Jainik Makwana Department of Mechanical Engineering Page 4.6 Darshan Institute of Engineering & Technology, Rajkot
4.6 Job evaluation methods
A number of job evaluation methods have been developed since the 1920‟s, and
many, if not most, of them are still used. They all have the same final objective –
ranking jobs in terms of their relative worth to the organization so that an equitable
rate of pay can be determined for each job.
As the job evaluation is mostly a judgemental process that would probably use one of
the job evaluation methods, which are commonly grouped into two major categories:
quantitative and non-quantitative.
The basic difference between these two methods lies in the sense that, under non-
quantitative methods, a job is compared as a whole with other jobs in the
organization, whereas in case of quantitative methods, the key factors of a job are
selected and, then measured.
The most commonly used non-quantitative methods are ranking and job classification
or grading method, while the most common quantitative methods are factor
comparison and point rating. The starting point for all job evaluation methods is a
current job description and job specifications.
4.6.1 Non-quantitative methods
Non-quantitative methods call for the evaluation of a whole job relative to other jobs
or to general descriptions of jobs within an organization. For instance, a job
description of a customer service representative may be compared to the job
description of a word processing specialist. The main role of the evaluator is to
determine which of the jobs is more important or worth more to the organization. The
major types of non-quantitative job evaluation procedures are ranking and job
classification.
Ranking Method of job evaluation
This is simplest form of job evaluation method. The method involves ranking each job
relative to all other jobs, usually based on some overall factor like „job difficulty‟. Each
job as a whole is compared with other and this comparison of jobs goes on until all the
jobs have been evaluated and ranked. All jobs are ranked in the order of their
importance from the simplest to the hardest or from the highest the lowest. The
importance of order of job is judged in terms of duties, responsibilities sand demands
on the job holder.
Merits – Ranking method has the following merits in terms of its procedure, resources
involvement and operational mechanisms.
1. It is the simplest method
2. It is quite economical to put it into effect
3. It is less time consuming and involves little paper work.
Industrial Engineering (2161907) 4. Job Evaluation and Wage Plan
Department of Mechanical Engineering Prepared by: Jainik Makwana Darshan Institute of Engineering & Technology, Rajkot Page 4.7
Demerits – The ranking method has the following demerits in terms of validity and
reliability.
1. The main demerit of the ranking method is that there are no definite standards of
judgement and also there is no way of measuring the differences between jobs.
2. It suffers from its sheer unmanageability when there are a large number of jobs.
Job Classification or Grading Method
This is a simple, widely used method. This method of job evaluation was made popular
by the U.S. Civil Service Commission. In the ranking system there is no re-determined
yardstick of values.
In the job grading approach there is one such yardstick constituting of job classes or
grades. Jobs are measured as whole jobs. Under this method job grades or classes are
established by an authorised body or committee appointed for this purpose.
A job grade is defined as a group of different jobs of similar difficulty or requiring
similar skills to perform them. Job grades are determined on the basis of information
derived from job analysis.
The example of job grades may include, depending on the type of jobs the organization
offers, skilled, unskilled, account clerk, clerk-cum typist, steno-typist, office
superintendent, and laboratory assistant and so on.
There are several ways to categorize jobs. One is to draw up „class description‟ and
place jobs into classes based on their correspondence to these descriptions.
Another is to draw up a set of classifying rules for each class and then categorise the
jobs according to these rules.
The usual procedure is to choose compensable factors and then develop class or grade
descriptions that describe each class in terms of amount or level of compensable
factor(s) in jobs. Such factors are:
1. Difficultly and variety of work,
2. Supervision received and exercised,
3. Judgement exercised,
4. Originality required,
5. Nature and purpose of interpersonal work relationships,
6. Responsibility,
7. Experience and,
8. Knowledge required
The following five steps are generally involved in the process of job classification.
1. Prepare job description for basic information about the job

4. Job Evaluation and Wage Plan Industrial Engineering (2161907)
Prepared by: Jainik Makwana Department of Mechanical Engineering Page 4.8 Darshan Institute of Engineering & Technology, Rajkot
2. Prepare job grading description for identification of different levels of jobs. Each
grade level must be distinct from the grade level adjacent to it. After establishing
the grade level, each job is assigned to an appropriate grade level on the basis of
the complexity of duties, non-supervisory responsibilities and supervisory
responsibilities
3. Select grades and key jobs about 10 to 20 jobs, which include all the major
departments and functions and cover all the grades
4. Grade the key jobs. Key jobs are assigned to an appropriate grade level and their
relationship to each other studied.
5. Classify all the jobs on the basis of grade definitions. All the jobs in the same grade
receive the same wage or range of rate. For instance, menials may be put into one
class; clerks in another; junior officers in a higher class; and the top executives in
the top class.
Merits - The job classification method has several advantages. The major merits of the
method are:
1. This method is easy to understand and simple to operate.
2. It is economical and therefore, suitable for small organizations.
3. The grouping of jobs into classifications makes pay determination problems easy
to administer.
Demerits - The job classification method also has some disadvantages. The major demerits
of the method are:
1. The method suffers from personal bias of the committee members.
2. It cannot deal with complex jobs which will not fit neatly into one grade.
3. This method is rarely used in industries.
4. It is difficult to know how much of a job’s rank is influenced by the man on the job.
5. The system is rather rigid and unsuitable for a large organizations or for very varied
work.
4.6.2 Quantitative Methods
Quantitative methods divide jobs into component parts and require absolute or
relative value judgements about how much of a component part a particular job
requires. The two most popular types of quantitative systems are the point rating and
factor comparison methods.
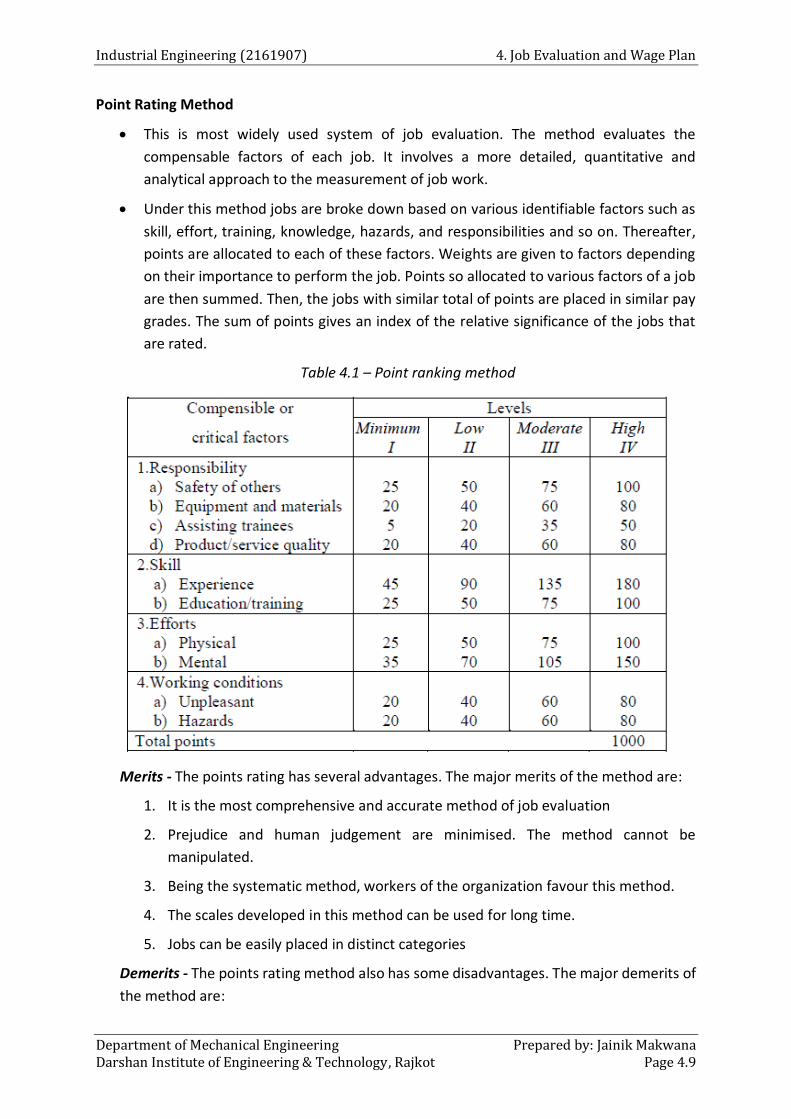
Industrial Engineering (2161907) 4. Job Evaluation and Wage Plan
Department of Mechanical Engineering Prepared by: Jainik Makwana Darshan Institute of Engineering & Technology, Rajkot Page 4.9
Point Rating Method
This is most widely used system of job evaluation. The method evaluates the
compensable factors of each job. It involves a more detailed, quantitative and
analytical approach to the measurement of job work.
Under this method jobs are broke down based on various identifiable factors such as
skill, effort, training, knowledge, hazards, and responsibilities and so on. Thereafter,
points are allocated to each of these factors. Weights are given to factors depending
on their importance to perform the job. Points so allocated to various factors of a job
are then summed. Then, the jobs with similar total of points are placed in similar pay
grades. The sum of points gives an index of the relative significance of the jobs that
are rated.
Table 4.1 – Point ranking method
Merits - The points rating has several advantages. The major merits of the method are:
1. It is the most comprehensive and accurate method of job evaluation
2. Prejudice and human judgement are minimised. The method cannot be
manipulated.
3. Being the systematic method, workers of the organization favour this method.
4. The scales developed in this method can be used for long time.
5. Jobs can be easily placed in distinct categories
Demerits - The points rating method also has some disadvantages. The major demerits of
the method are:

4. Job Evaluation and Wage Plan Industrial Engineering (2161907)
Prepared by: Jainik Makwana Department of Mechanical Engineering Page 4.10 Darshan Institute of Engineering & Technology, Rajkot
1. It is both time-consuming and expensive method.
2. It is difficult to understand for an average worker.
3. A lot of clerical work is involved in recording rating scales.
4. It is not suitable for managerial jobs wherein the work content is not measurable
in quantitative terms.
Factors Comparison Method
This is a combination of both rating and point rating methods. It means rates jobs by
comparing them and makes analysis by breaking jobs into compensable factors. This
system is usually used to evaluate white collar, professional and managerial positions.
Merits - The factors comparison has several advantages. The major merits are:
1. It is more objective method of job evaluation
2. The method is flexible as there is no upper limit on the rating.
3. It is fairly easy method to explain to employees.
4. The use of limited number of factors (usually five) ensures less chances of
overlapping and over-weighting of factors.
5. It facilitates determining the relative worth of different jobs.
Demerits - The factors comparison method also has some disadvantages. The major
demerits of the method are:
1. It is expensive and time consuming method.
2. Using the same five factors for evaluating jobs may not always be appropriate
because jobs differ across and within organization.
3. It is difficult to understand and operate.
Table 4.2 – Factor caparison method
Method Useful to Steps involved Advantages Disadvantages
Job Ranking Small firm
1. Develop brief job
descriptions for each
job
2. Appoint a cross-
functional committee
to select top and
bottom most job
benchmarks
1. Simple
2. Inexpensive
1. Crude
method
2. Subjectivit
y
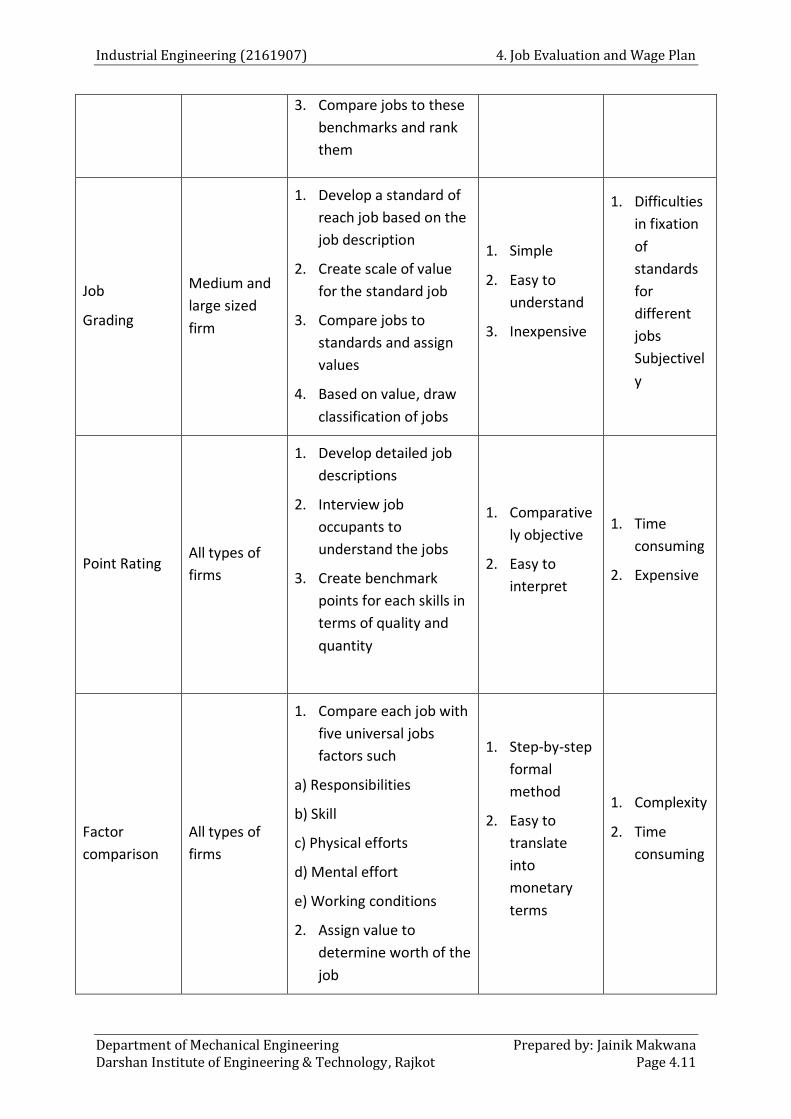
Industrial Engineering (2161907) 4. Job Evaluation and Wage Plan
Department of Mechanical Engineering Prepared by: Jainik Makwana Darshan Institute of Engineering & Technology, Rajkot Page 4.11
3. Compare jobs to these
benchmarks and rank
them
Job
Grading
Medium and
large sized
firm
1. Develop a standard of
reach job based on the
job description
2. Create scale of value
for the standard job
3. Compare jobs to
standards and assign
values
4. Based on value, draw
classification of jobs
1. Simple
2. Easy to
understand
3. Inexpensive
1. Difficulties
in fixation
of
standards
for
different
jobs
Subjectivel
y
Point Rating All types of
firms
1. Develop detailed job
descriptions
2. Interview job
occupants to
understand the jobs
3. Create benchmark
points for each skills in
terms of quality and
quantity
1. Comparative
ly objective
2. Easy to
interpret
1. Time
consuming
2. Expensive
Factor
comparison
All types of
firms
1. Compare each job with
five universal jobs
factors such
a) Responsibilities
b) Skill
c) Physical efforts
d) Mental effort
e) Working conditions
2. Assign value to
determine worth of the
job
1. Step-by-step
formal
method
2. Easy to
translate
into
monetary
terms
1. Complexity
2. Time
consuming

4. Job Evaluation and Wage Plan Industrial Engineering (2161907)
Prepared by: Jainik Makwana Department of Mechanical Engineering Page 4.12 Darshan Institute of Engineering & Technology, Rajkot
4.7 Advantages and limitations of job evaluation
4.7.1 Advantages
1. Job evaluation being a logical process and objective technique helps in developing a
equitable and consistent wage and salary structure based on the relative worth of jobs
in an organization.
2. By eliminating wage differentials within the organization, job evaluation helps in
minimizing conflict between labour unions and management and, in turn, helps in
promoting harmonious relations between them.
3. Job evaluation simplifies wage administration by establishing uniformity in wage rates.
4. It provides a logical basis for wage negotiations and collective bargaining.
5. In the case new jobs, job evaluation facilitates spotting them into the existing wage
and salary structure.
6. In the modern times of mechanisation, performance depends much on the machines
than on the worker himself/herself. In such cases, job evaluation provides the realistic
basis for determination of wages.
7. The information generated by job evaluation may also be used for improvement of
selection, transfer and promotion procedures on the basis of comparative job
requirements.
8. Job evaluation rates the job, mot the workers. Organizations have large number of
jobs with specialisations. It is job evaluation here again which helps in rating all these
jobs and determining the wages and salary and also removing ambiguity in them.
4.7.2 Limitations/Drawbacks
1. Job evaluation is susceptible because of human error and subjective judgement. .
While there is no standard list of factors to be considered for job evaluation, there are
some factors that cannot be measured accurately.
2. There is a variation between wages fixated through job evaluation and market forces.
Say Kerr and Fisher, the jobs which tend to rate high as compared with the market are
those of junior, nurse and typist, while craft rates are relatively low. Weaker groups
are better served by an evaluation plan then by the market, the former places the
emphasis not on force but on equity.
3. When job evaluation is applied for the first time in an organization, it creates doubts
in the minds of workers whose jobs are evaluated and trade unions that it may do
away with collective bargaining for fixing wage rates.
4. Job evaluation methods being lacking in scientific basis are often looked upon as
suspicious about the efficacy of methods of job evaluation.

Industrial Engineering (2161907) 4. Job Evaluation and Wage Plan
Department of Mechanical Engineering Prepared by: Jainik Makwana Darshan Institute of Engineering & Technology, Rajkot Page 4.13
5. Job evaluation is a time-consuming process requiring specialised technical personnel
to undertake it and, thus, is likely to be costly also.
6. Job evaluation is not found suitable for establishing the relative worth of the
managerial jobs which are skill-oriented. But, these skills cannot be measured in
quantitative terms.
7. Given the changes in job contents and work conditions, frequent evaluation of jobs is
essential. This is not always so easy and simple.
8. Job evaluation leads to frequent and substantial changes in wage and salary
structures. This, in turn, creates financial burden on organization.

4. Job Evaluation and Wage Plan Industrial Engineering (2161907)
Prepared by: Jainik Makwana Department of Mechanical Engineering Page 4.14 Darshan Institute of Engineering & Technology, Rajkot
SECTION - II
MARIT RATING/ PERFORMANCE APPRAISAL
4.8 Concept of Performance Appraisal
In the context of an industrial organization, performance appraisal is a systematic
evaluation of personnel by supervisors or those familiar with their performance. In
other words, performance appraisal is a systematic and objective way of judging the
relative worth or ability of an employee in performing his/her task.
Many authors described and some of them were tried to define the concept of
performance appraisal in their own way. According to Gary Dessler, performance
appraisal is an evaluation of employee’s current or past performance relative to
his/her performance standards. Further he mentioned that the appraisal process
involves three steps;
1. Setting work standards,
2. Assessing the employee’s actual performance relative to these standards, and
3. Providing feedback to the employee with the aim of motivating that person to
eliminate performance deficiencies or to continue to perform above par.
Performance appraisal may be defined as a structured formal interaction between a
subordinate and supervisor, that usually takes the form of a periodic interview (annual
or semi-annual), in which the work performance of the subordinate is examined and
discussed, with a view to identifying weaknesses and strengths as well as
opportunities for improvement and skills development.
Appraising the performance is method of evaluating the behaviour of employees in
the work spot, normally including both the quantitative and qualitative aspects of job
performance. Performance refers to the degree of accomplishment of the tasks that
make up an individual’s job.
It includes how well an individual is fulfilling the job demands. In order to find out
whether an employee is worthy of continued employment or not, and if so, whether
he should receive a bounds, a pay rise or promotion, performance needs to be
evaluated form time to time.
It is by and large useful for not only for the different payments purpose but also to
make aware of once strengths and weaknesses. So that employees can able to
understand that in which area they are supposed to improve their performance.
Under this exercise evaluation is not only the performance of worker on the job but
also employee potential for development for future expecting job roles. Moreover
performance appraisals should focus on wok planning and continuous review for
development. They should also focus on quality to survive in the current environment.

Industrial Engineering (2161907) 4. Job Evaluation and Wage Plan
Department of Mechanical Engineering Prepared by: Jainik Makwana Darshan Institute of Engineering & Technology, Rajkot Page 4.15
4.9 Objectives of performance appraisal
Performance appraisals consist of a systematic, face-to-face discussion of an
employee's work performance, training and development needs, future job goals and
job aspirations. It looks backwards, reviewing the employee's performance during the
period under review, and forwards, helping the employee prepare and set goals for
the up-coming review period. To be effective, performance appraisals programmes
must be linked closely to corporate goals and objectives, including departmental
business plans. As Rao, discussed, primary objectives are:
1. Performance review,
2. Identification of training and development needs,
3. Setting work objectives,
4. Employee performance counselling,
5. Employee career planning, and
6. Employee remuneration/ recognition reviews.
Performance appraisal serves the following management objectives:
1. Providing basis for promotion/transfer/termination
2. Enhancing employees’ effectiveness
3. Identifying employees’ training and developmental needs
4. Removing work alienation
5. Developing interpersonal relationship
6. Removing discontent
7. Removing worker alienation
Purpose of Performance Appraisal
Across-examination of organizational practices reveals that performance appraisal is
undertaken for variety of purposes. Performance appraisal is broadly used for meeting
the following purposes:
1. To identify employees for salary increases, promotion, transfer and lay-off or
termination of services.
2. To determine training and development needs of the employees.
3. To motivate employees by providing feedback on their performance
4. To establish a basis for research and reference for personnel decisions in future.

4. Job Evaluation and Wage Plan Industrial Engineering (2161907)
Prepared by: Jainik Makwana Department of Mechanical Engineering Page 4.16 Darshan Institute of Engineering & Technology, Rajkot
4.10 Performance Appraisal Process
The performance appraisal process starts with employee planning and ends with an
evaluation of employee progress. The performance appraisal process consists broadly
two steps. First, complete the performance appraisal form; secondly, participate in a
performance appraisal interview and discussion. These two sages comprise the
following levels in the appraising performance of the staff.
1. Establish performance standards or Goals - The appraisal process begins with the
establishment of performance standards. The Officers must determine what outputs,
accomplishments and job description. These performance standards should be clear
and objectives are to be understood and measured.
2. Communicate Performance Expectations to Employees - Once the performance
standards are established, these need to be communicated to the respective
employees so that they come to know what expected of them. Past experience
indicates that not communicating standards to the employees compounds the
appraisal problems. Here, it must be noted that mere transference of information
form the Medial Officer to the staff is not communication. It became communication
only when the transference of information has taken place and has been received and
understood by the staff. The feedback form the staff on the standards communicated
to them must be obtained. If required, the standards may be modified or revised in
the light of feedback obtained from the employees. It is important to note that
communication is a two-way street.
3. Measure Actual Performance - This is the third step involved in the appraisal process.
In this stage, the actual performance of the employees is measured on the basis of
information available from various sources such as personal observation, statistical
reports, oral reports, and written reports. The evaluator’s feeling should not influence
the performance measurements of the staff. Measurement must be objective based
on facts and findings. This is because what we measure is more critical and important
to the evaluation process than bow we measure.
4. Compare Actual Performance with Standards - In this stage, the actual performance
is compared with the predetermined standards. Such a comparison may reveal the
deviation between standard performance and actual performance and will enable the
evaluator to proceed to the fifth step on the process i.e. Review and discussion of the
appraisal with the concerned staff.
5. Discuss and Review the Appraisal with the Staff - The fifth step in the appraisal
process is to communicate to and discuss with the employees the results of the
appraisal. This is one of the most challenging tasks the Officers face to present an
accurate appraisal to the staff and then make them accept the appraisal in a
constructive manner. A discussion on appraisal enables employees to know their
strengths and weaknesses. This has, in turn, impact on their future performance. The
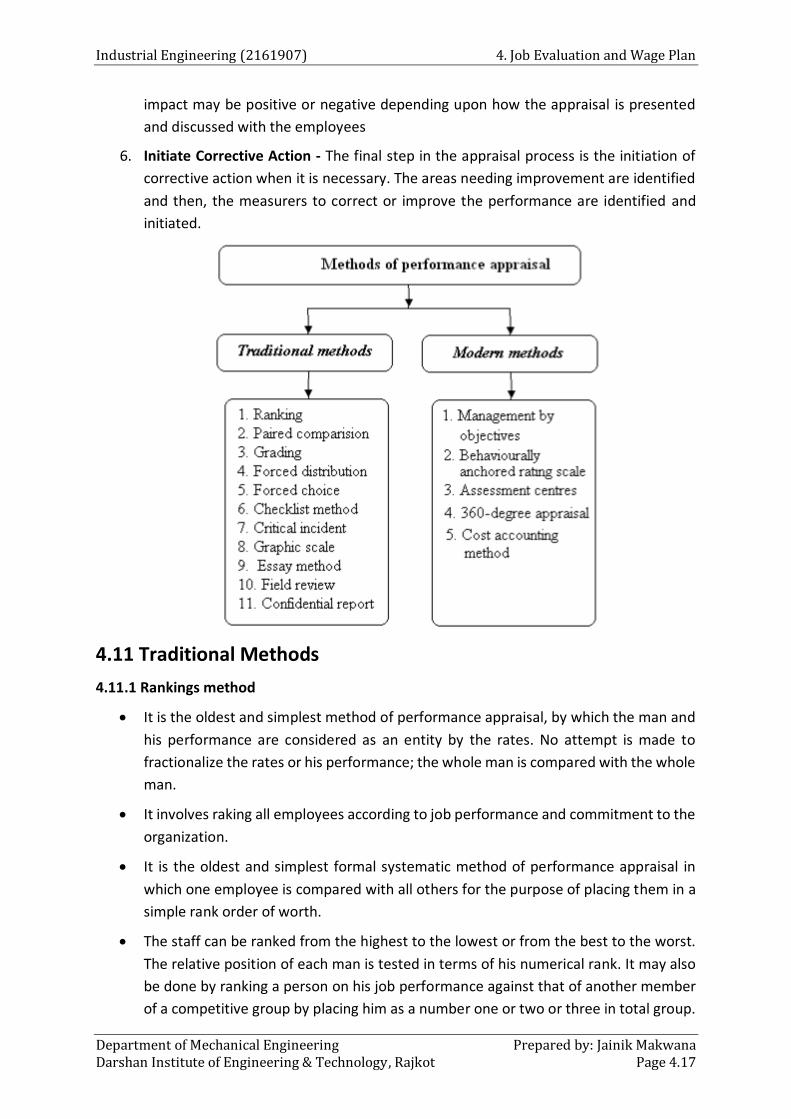
Industrial Engineering (2161907) 4. Job Evaluation and Wage Plan
Department of Mechanical Engineering Prepared by: Jainik Makwana Darshan Institute of Engineering & Technology, Rajkot Page 4.17
impact may be positive or negative depending upon how the appraisal is presented
and discussed with the employees
6. Initiate Corrective Action - The final step in the appraisal process is the initiation of
corrective action when it is necessary. The areas needing improvement are identified
and then, the measurers to correct or improve the performance are identified and
initiated.
4.11 Traditional Methods
4.11.1 Rankings method
It is the oldest and simplest method of performance appraisal, by which the man and
his performance are considered as an entity by the rates. No attempt is made to
fractionalize the rates or his performance; the whole man is compared with the whole
man.
It involves raking all employees according to job performance and commitment to the
organization.
It is the oldest and simplest formal systematic method of performance appraisal in
which one employee is compared with all others for the purpose of placing them in a
simple rank order of worth.
The staff can be ranked from the highest to the lowest or from the best to the worst.
The relative position of each man is tested in terms of his numerical rank. It may also
be done by ranking a person on his job performance against that of another member
of a competitive group by placing him as a number one or two or three in total group.
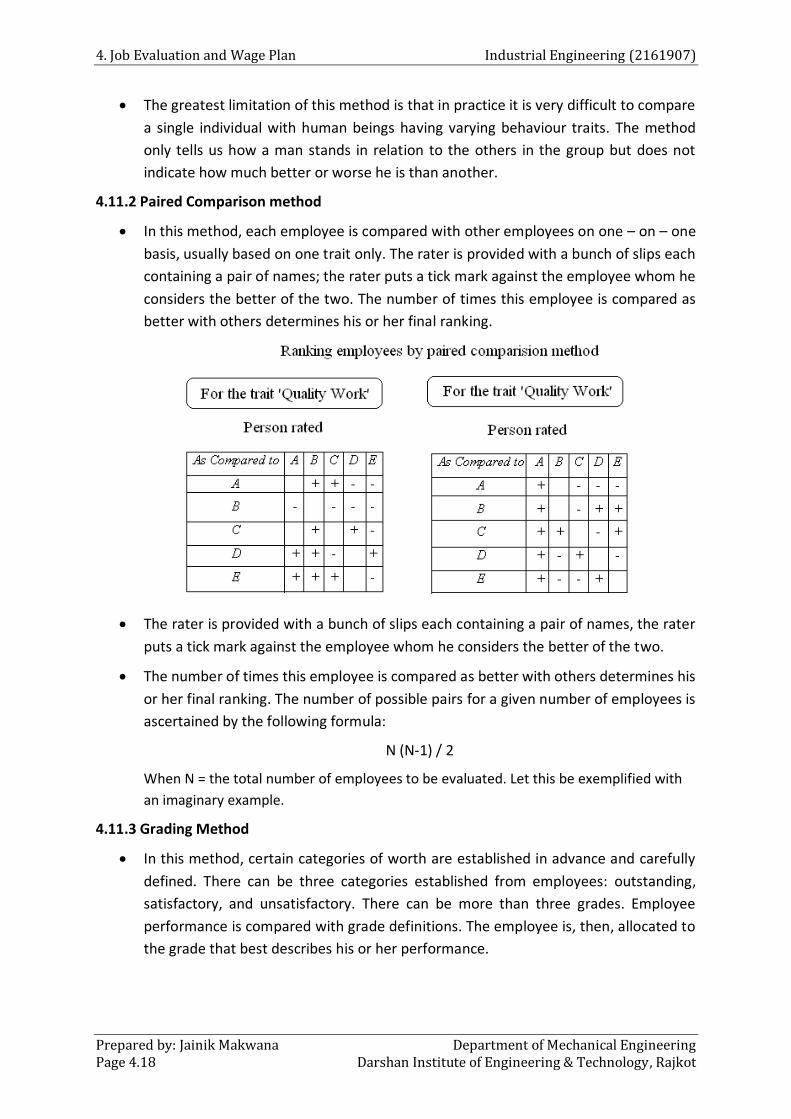
4. Job Evaluation and Wage Plan Industrial Engineering (2161907)
Prepared by: Jainik Makwana Department of Mechanical Engineering Page 4.18 Darshan Institute of Engineering & Technology, Rajkot
The greatest limitation of this method is that in practice it is very difficult to compare
a single individual with human beings having varying behaviour traits. The method
only tells us how a man stands in relation to the others in the group but does not
indicate how much better or worse he is than another.
4.11.2 Paired Comparison method
In this method, each employee is compared with other employees on one – on – one
basis, usually based on one trait only. The rater is provided with a bunch of slips each
containing a pair of names; the rater puts a tick mark against the employee whom he
considers the better of the two. The number of times this employee is compared as
better with others determines his or her final ranking.
The rater is provided with a bunch of slips each containing a pair of names, the rater
puts a tick mark against the employee whom he considers the better of the two.
The number of times this employee is compared as better with others determines his
or her final ranking. The number of possible pairs for a given number of employees is
ascertained by the following formula:
N (N-1) / 2
When N = the total number of employees to be evaluated. Let this be exemplified with
an imaginary example.
4.11.3 Grading Method
In this method, certain categories of worth are established in advance and carefully
defined. There can be three categories established from employees: outstanding,
satisfactory, and unsatisfactory. There can be more than three grades. Employee
performance is compared with grade definitions. The employee is, then, allocated to
the grade that best describes his or her performance.
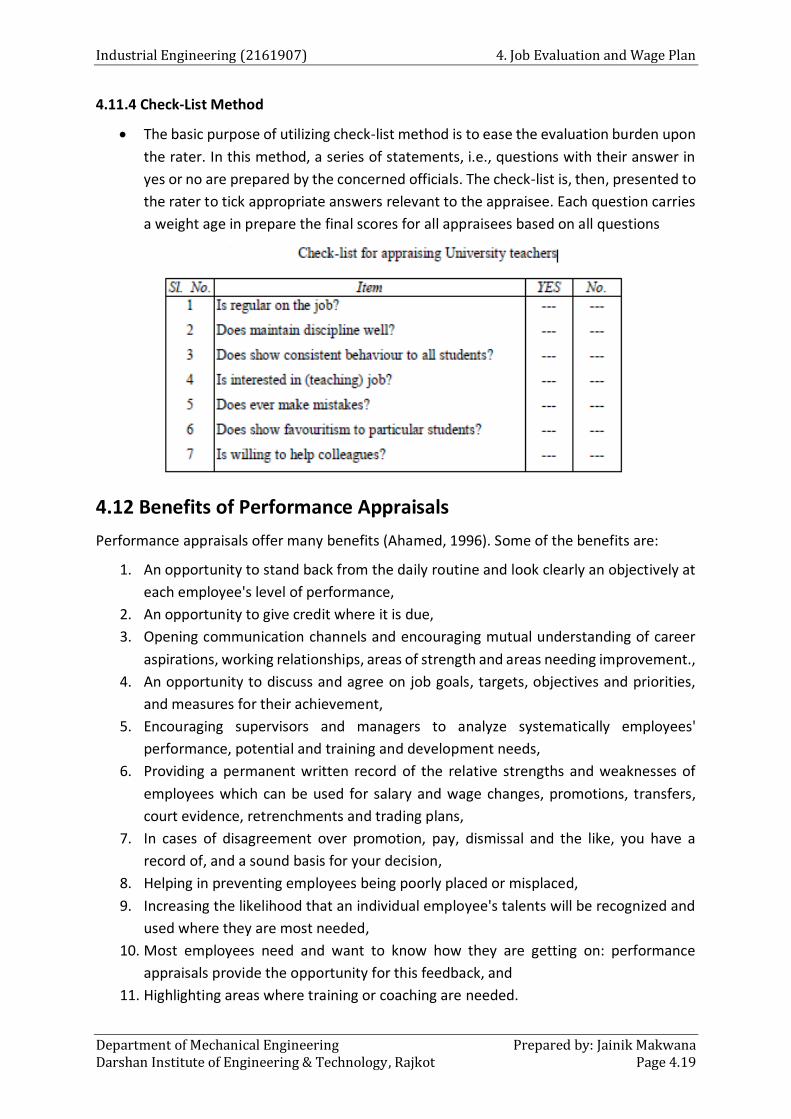
Industrial Engineering (2161907) 4. Job Evaluation and Wage Plan
Department of Mechanical Engineering Prepared by: Jainik Makwana Darshan Institute of Engineering & Technology, Rajkot Page 4.19
4.11.4 Check-List Method
The basic purpose of utilizing check-list method is to ease the evaluation burden upon
the rater. In this method, a series of statements, i.e., questions with their answer in
yes or no are prepared by the concerned officials. The check-list is, then, presented to
the rater to tick appropriate answers relevant to the appraisee. Each question carries
a weight age in prepare the final scores for all appraisees based on all questions
4.12 Benefits of Performance Appraisals
Performance appraisals offer many benefits (Ahamed, 1996). Some of the benefits are:
1. An opportunity to stand back from the daily routine and look clearly an objectively at
each employee's level of performance,
2. An opportunity to give credit where it is due,
3. Opening communication channels and encouraging mutual understanding of career
aspirations, working relationships, areas of strength and areas needing improvement.,
4. An opportunity to discuss and agree on job goals, targets, objectives and priorities,
and measures for their achievement,
5. Encouraging supervisors and managers to analyze systematically employees'
performance, potential and training and development needs,
6. Providing a permanent written record of the relative strengths and weaknesses of
employees which can be used for salary and wage changes, promotions, transfers,
court evidence, retrenchments and trading plans,
7. In cases of disagreement over promotion, pay, dismissal and the like, you have a
record of, and a sound basis for your decision,
8. Helping in preventing employees being poorly placed or misplaced,
9. Increasing the likelihood that an individual employee's talents will be recognized and
used where they are most needed,
10. Most employees need and want to know how they are getting on: performance
appraisals provide the opportunity for this feedback, and
11. Highlighting areas where training or coaching are needed.

4. Job Evaluation and Wage Plan Industrial Engineering (2161907)
Prepared by: Jainik Makwana Department of Mechanical Engineering Page 4.20 Darshan Institute of Engineering & Technology, Rajkot
SECTION - II
WAGE AND WAGE INCENTIVE PLANS
4.13 Wage/salary differentials
If we take various contingent factors into account, we find that there may be
differences in wage and salary structures. These differentials may be industrial and
occupational, regional, organisational and personal.
According to economic theory, wages are defined broadly as any economic
compensation paid by the employer to his labourers under some contract for the services
rendered by them.
4.13.1 Minimum Wage
A minimum wage is one which has to be paid by an employer to his workers
irrespective of his ability to pay. According to the above committee,
"Minimum wage is the wage which must provide not only for the bare sustenance of life,
but for the preservation of the efficiency of the workers. For this purpose, minimum wage
must provide some measure of education, medical requirements and amenities. "
For the calculation of wages, the Conference suggested the following guidelines:
1. The standard working class family should be taken to consist of three consumption
units for the earner; the earnings of women, children and adolescents should be
disregarded.
2. The minimum food requirements should be calculated on the basis of the net intake
of2.700 calories per adult.
3. The clothing requirements should be estimated at a per capita consumption of 18
yards per annum per person.
4. In respect of housing the norms should be the minimum rent charged by the
Government in any area for houses provided under subsidised housing scheme for
low-income groups.
5. Fuel lighting and other miscellaneous items of expenditure should constitute 20 per
cent of the total minimum wage.
4.13.2 Living Wage
Along with the minimum wage the Committee on Fair Wages has given the concept of
living wage which has been defined as follows:
"A living wage is one which should enable the earner to provide for himself and his family
not only the bare essentials of food, clothing and shelter but a measure of frugal comfort
including education for his children, protection against ill-health, requirements of essential

Industrial Engineering (2161907) 4. Job Evaluation and Wage Plan
Department of Mechanical Engineering Prepared by: Jainik Makwana Darshan Institute of Engineering & Technology, Rajkot Page 4.21
social needs and a measure of insurance against the more important misfortunes including
old age. "
Living wage is more than the concept of minimum wage. Such a wage is determined
keeping in view the national income and paying capacity of industrial sector. The
Committee also observed that since the national income did not support the payment
of living wage. It should be implemented in three phases. In the initial stage the wages
to be paid to the entire working class were to be established and stabilised. In the
second phase fair wages were to be established in the community and industry. In the
final phase the working class was to be paid the living wage.
4.13.3 Fair Wage
The concept of fair wage is linked with the capacity of the industry to pay. The
Committee has defined fair wage as follows:
"Fair wage is the wage which is above the minimum wage but below the living wage. The
lower limit of the fair wage is obviously the minimum wage: the upper limit is to be set by
the capacity of the industry to pay. "
Thus, fair wage depends on different variables affecting wage determination. Such
factors are labour productivity prevailing wage rates, the level of national income and
its distribution and the capacity of industry to pay. At present, the concept of fair
wages is followed by the most business organisations.
4.14 Methods of wage payment
In devising system of wage determination, the critical question that emerges is
whether the wage will be linked to time spent on the workplace or output achieved
during a specified period. This results into two types of wages-time wage and piece
wage. These two basic systems have their own relative merits and demerits.
Sometimes, in order to avoid hardship to employees, a combination of these two
methods is followed to ensure the payment of minimum wages. This method is known
as balance method. Let us see how these methods work.
4.14.1 Time Wage Method
In time wage method, the wage is determined on the basis of time worked which may
be hourly, daily, weekly, monthly or any other time base. A worker is paid wage for
the time worked irrespective of his output during that time. Perhaps, this is the oldest
and most prevalent system of wage payment.
Merits of Time Wage:
This method is applied more commonly because it has certain inherent merits which
are as under:

4. Job Evaluation and Wage Plan Industrial Engineering (2161907)
Prepared by: Jainik Makwana Department of Mechanical Engineering Page 4.22 Darshan Institute of Engineering & Technology, Rajkot
1. There are certain jobs in which output within a specified period is not easily
measurable. For example, the job of a peon. In such a case wage payment is linked to
time.
2. It is quite easy to understand and calculate the amount of wages to be paid. Thus,
even an illiterate worker can understand it.
3. Both employers and workers know well in advance the amount of wages payable and
they can adjust their budgets accordingly.
4. It ensures the payment of regular and specific wages which is beneficial from social
point of view.
5. Product/service quality tends to be high as workers are not in hurry to produce more
without regard to quality.
Demerits of Time Wage:
1. Though adopted more commonly time wage system suffers from a number of
drawbacks and if the workers are not adequately motivated for higher performance.
This system can generate inefficiency in the following ways:
2. Since there is no direct linkage between performance and wages. Employees tend to
take easy approach.
3. This system does not differentiate between efficient and inefficient workers:
gradually, inefficiency percolates to efficient workers too.
4. It demotivates efficient workers for more output as they are put at par with inefficient
ones.
5. Labour cost of production becomes difficult to determine in advance because wages
are not linked to output.
6. Since productivity is not a criterion for fixing wages. There is a possibility that wrong
employees are placed on the job.
This system is more suitable in the following situations:
1. Where units of output are not measurable precisely like office work.
2. Where individual employees do not have direct control on their outputs like assembly
work.
3. Where quality of work is more pronounced and requires creative imagination like
artistic work.
4. Where machinery and raw materials are quite sophisticated which require handling
with utmost care like processing of precious metals.
5. Where work is of highly varied nature and standards of outputs cannot be ascertained
like research work.
6. Where workers' unions oppose the introduction of piece rate system.
7. Where supervision is good and the supervisors can estimate a fair day’s work.
Industrial Engineering (2161907) 4. Job Evaluation and Wage Plan
Department of Mechanical Engineering Prepared by: Jainik Makwana Darshan Institute of Engineering & Technology, Rajkot Page 4.23
4.14.2 Piece Wage Method
In piece wage method workers are paid wages according to the quantity of output
during a specified period. This may be calculated on the basis of number of units
produced or the completion of a job where output is not measurable in terms of
individual units. Piece wage method too has its own merits and demerits.
Merits of Piece Wage:
1. There is a direct relationship between output and wages which works as a motivating
factor to workers to produce more.
2. It differentiates efficient and inefficient workers and provides incentives to inefficient
workers to become efficient.
3. This is fair and equitable so far as utilisation of human resources is concerned.
4. It. requires less supervision if there is in-built system for product quality control.
5. The organisation can estimate its cost of production well in advance because wage
cost is directly proportional to output.
Demerits of Piece Wage:
1. There is a problem in fixing piece rate in the absence of any standardised procedure.
2. There is a tendency on the part of the employers to cut piece rate if workers' earnings
are quite high.
3. The method does not ensure minimum wages as output may be adversely affected by
factors beyond control.
4. The product quality and machinery conditions are likely to suffer because workers
concentrate more on quantity rather than quality.
5. There may be jealousy and interpersonal conflict among workers because of their
uneven earnings at the same workplace.
6. Trade unions generally oppose this system because of the fear of discrimination
among workers based on their working.
Various merits and demerits of piece wage system indicate that this system is not
suitable for all conditions but only to specific conditions which are as follows:
1. Where the output of each individual worker can be measured precisely.
2. Where the quantity of output is a direct result of skills and efforts of individual
workers.
3. When the flow of work is regular and work interruptions do not occur.
4. Where production methods are standardised and job is of repetitive nature.
5. Where workmanship is not required.
4.14.3 Balance Method
Balance method also known as debt method, is essentially a combination of time wage
and piece wage methods. Under this method, a worker is guaranteed a fixed wage
based on time rate with a provision of piece wage method. Thus, if a worker produces
more quantity in a period, usually on weekly or monthly basis, and earns more than
4. Job Evaluation and Wage Plan Industrial Engineering (2161907)
Prepared by: Jainik Makwana Department of Mechanical Engineering Page 4.24 Darshan Institute of Engineering & Technology, Rajkot
his time wage, he is given credit for additional output which is compensated in another
period in which production quantity falls below the time wage.
This method provides a sense of security to a worker so far as his wage earning is
concerned. At the same time, he is also motivated to produce more because of
inclusion of piece wage system. This method has its relevance in a workplace where
the work flow is irregular like docks.
4.15 Incentives
Incentive may be defined as any reward of benefit given to the employee over and
above his wage or salary with a view to motivating him to excel in his work. Incentives
include both monetary as well as non-monetary rewards. A scheme of incentive is a
plan to motivate individual or group performance.
It refers to all the plans that provide extra pay for extra performance in addition to
regular wages for a job
4.15.1 Classification of incentives
All forms of incentives can be broadly classified into two kinds namely, (i) Financial
Incentives, and (ii) Non-financial Incentives. These incentives can be further sub-
divided into various kinds. These kinds can be explained with the help of the figure
below:
Financial Incentives
Financial incentives or pecuniary incentives are the most original of all the incentives.
It is given in the form of money.
The financial incentives still form the most important influencing and motivating
factor up to a certain limit. Because it is only by virtue of the monetary compensation
that the workers can satisfy their fundamental needs such as food, clothing, shelter
etc.
The financial incentives may be either direct or indirect. Direct incentives include
wages, bonus and other incentives directly given to the workers in the form of cash.
Indirect financial incentives include subsistence allowance expenses, medical
expenses etc.

Industrial Engineering (2161907) 4. Job Evaluation and Wage Plan
Department of Mechanical Engineering Prepared by: Jainik Makwana Darshan Institute of Engineering & Technology, Rajkot Page 4.25
Non-financial Incentives
Non-financial or non-pecuniary incentives include all other influences planned or
unplanned, which stimulate exertion. Mere monetary incentive cannot help the
management in solving all the problems of industrial unrest.
Further additional cash wage may also tempt the workers to misuse the money in vices
like gambling, drinking etc. Under such circumstances, the non-financial incentives
have a significant role to play. Such incentives create a healthy atmosphere and
change the mental outlook of the workers. They make the working class more
stabilized and economically sound.
Thus, in short, the workers by virtue of the non-financial incentives are enabled to
enjoy a richer and fuller life. Experiences of foreign countries particularly countries
like Britain, America and Japan have shown that there is a high degree of positive
correlation between non-financial benefit schemes and labour productivity.
Merits of Incentives
1. Higher output
2. Greater profits
3. No problem of idle time
4. Supervision does not pose any problem
5. Efficient workers are able to earn more
6. Possible to identify inefficient and dull workers
7. Rate of labour turnover is bound to be low
8. Reduction in complaints and grievances
Problems arising out of incentives
1. Quality of work may suffer
2. Inter-personnel relationships may suffer
3. Wear and tear of machines may be more
4. Health of the workers may get affected

4. Job Evaluation and Wage Plan Industrial Engineering (2161907)
Prepared by: Jainik Makwana Department of Mechanical Engineering Page 4.26 Darshan Institute of Engineering & Technology, Rajkot
5. Increase in accidents
6. Increase in paper work
4.15.2 Categories of Incentive Plans
Incentive plans fall under two categories:
1. Individual incentive plans and
2. Group incentive plans
In the case of individual incentive plans, an individual worker is rewarded for achieving
a certain level of performance. Such plans may be further divided into:
1. Time-based incentive plans and
2. Output-based incentive plans
In the case of time-based plans, a standard time is determined for the job and the
worker gets his incentive only when he completes the work in less than the standard
time. Under the output-based plans, standard output is determined and the worker
gets his incentive only when he produces more than the standard output.
Under the group incentive plans, incentive is determined based on the collective
output of a group of workers whose work is inter-dependent. Such an amount is
apportioned among the group members on an agreed basis.

Industrial Engineering (2161907) 4. Job Evaluation and Wage Plan
Department of Mechanical Engineering Prepared by: Jainik Makwana Darshan Institute of Engineering & Technology, Rajkot Page 4.27
4.16 Time-based Individual Incentive Plans
4.16.1 Halsey's Plan
F.A.Halsey, an American engineer, introduced this plan. Under this plan, standard time
is determined for each job. A worker who completes the job by taking the standard
time or even exceeding it is paid normal wages calculated at the time rate. In case, he
completes the job in less than the standard time, he is given bonus equal to 50% of
the money value of the time saved.
The bonus payable to the worker and his total earnings, under the Halsey's plan, are
calculated as follows:
Bonus = 50% (Time Saved x Time Rate)
Total Earnings = Time Rate x Time Taken + Bonus
Merits
1. It is simple to understand.
2. The workers are assured of a minimum wage.
3. The employer and the worker share equally the benefit resulting from savings in
time.
4. The plan encourages workers to be more efficient in their work.
Demerits
1. The efficiency of the worker is rewarded to the extent of50% only.
2. The time saved is wholly due to the efficiency of the worker but the management
grabs 50% of the resulting benefit.
3. The plan does not say anything about, the quality of the work done.
4.16.2 Rowan's Plan
Under Rowan's plan, the manner of calculating bonus is slightly different from that
under the Halsey's plan. Bonus, under Rowan's plan is calculated as follows:
Total Earnings of the worker = Time Wage + Bonus
Merits
1. Minimum wage is guaranteed to all workers.
2. When compared with Halsey's plan, bonus under Rowan's plan is more although the
basic time wage is the same under both the plans.
3. The plan provides a check against over-speeding by workers. As the worker saves
more time, his bonus and total earnings only begin to decline. In the above
illustration, suppose, the worker completes his task within one hour, i.e. he saves 4
4. Job Evaluation and Wage Plan Industrial Engineering (2161907)
Prepared by: Jainik Makwana Department of Mechanical Engineering Page 4.28 Darshan Institute of Engineering & Technology, Rajkot
hours, his bonus will only be Rs.16. He earns the same bonus of Rs.16 by completing
the task in 4 hours, saving just one hour.
Demerits
1. It is not as easy as Halsey's plan is.
2. The earnings of the worker become less as he saves more time. This discourages
efficient workers.
4.16.3 Emerson's Efficiency Plan
Under Emerson's plan too minimum wage is guaranteed to all workers. Payment of
bonus, however, is related to the efficiency of the workers. Efficiency is determined
by the ratio of time taken to standard time. Usually, a worker is given bonus only
when his level of efficiency, in terms of percentage, is above 66.67%.
Merits
1. Minimum wage is guaranteed.
2. It pays bonus to workers based on their level of efficiency.
3. The 66.67% or two-third efficiency criterion is within the reach of many workers.
Demerits
1. It is not a straight-forward approach to determining bonus.
2. If the standard time allowed itself is low, it may not be possible for many workers to
fulfil the efficiency criterion laid down under the plan.
4.16.4 Bedeaux's Plan
Under this plan, the standard time and time taken for each job is reduced to
minutes, and each minute is referred to as "B", i.e., one hour is the same as 60 B's.
The bonus and total earnings of the worker, under the plan, are calculated as
follows:
Bonus = 75% (Standard Time - Time Taken) x Time Rate
Total Earnings = Time Wage + Bonus
Merits
1. It guarantees minimum wages to the workers.
2. It enables efficient workers to earn more.
3. The benefit of three-fourth of the time saved is given to the worker.
Demerits
1. The unit name of 'B' in place of the 'minute' does not make the plan altogether
different.
2. The entire benefit of time saved by the worker is not passed on to him.
Industrial Engineering (2161907) 4. Job Evaluation and Wage Plan
Department of Mechanical Engineering Prepared by: Jainik Makwana Darshan Institute of Engineering & Technology, Rajkot Page 4.29
4.17 Output-based individual incentive plans
4.17.1 Taylor's Differential Piece Rate Plan
F. W.Taylor, who is known as the Father of Scientific Management, developed the
differential piece rate plan. Under the plan, two piece rates are laid down –
i. A lower rate for those workers who are not able to attain the standard output
within the standard time; and
ii. A higher rate for those who are in a position to produce the standard output within
or less than the standard time.
iii. Under the plan, minimum daily wage is not guaranteed.
Taylor's differential piece rate plan has the following components:
i. Standard Output.
ii. Standard Time
iii. A Lower Piece Rate and
iv. A higher Piece Rate
Merits
1. It is easy to understand and simple to operate.
2. It enables efficient workers to earn more.
3. Workers not reaching the standard are paid at a lower rate. Such people, thus, are
punished for their inefficiency. This protects the interests of the organisation.
Demerits
1. It does not guarantee minimum wage. This creates a sense of insecurity for the
workers.
2. There may be ill-feelings among workers in view of the differential piece rates.
3. The quality of the output is ignored.
4.17.2 Merrick's Multiple Piece Rate Plan
Under this plan too a standard task is set for the workers. But unlike Taylor's plan that
provides for two differential rates, Merrick's plan contemplates three rates as shown
below:
i. Workers producing less than 83% of the standard output are paid at a basic rate.
ii. Workers producing between 83 % and 100% of the standard output will be paid
110% of the basic piece rate.
iii. Those producing more than the standard output will be paid at 120% of the basic
piece rate.
Merits
1. It is an improvement over Taylor's plan.
2. It has greater flexibility.
3. It offers greater scope for efficient workers to earn more.

4. Job Evaluation and Wage Plan Industrial Engineering (2161907)
Prepared by: Jainik Makwana Department of Mechanical Engineering Page 4.30 Darshan Institute of Engineering & Technology, Rajkot
Demerits
1. It is a complicated plan.
2. Even a worker achieving 83% target is branded as a poor performer.
4.17.3 Gantt's Task Plan
This plan guarantees minimum daily wage. Its special feature is that it combines time
rate, piece rate and bonus. A worker who is unable to produce the standard output
receives only the time wage. He becomes eligible for bonus only when he attains or
exceeds the standard output within the standard time. The rate of bonus varies
between 20% to 50% of his wages.
Merits
1. It has, as mentioned above, time wage, piece rate and bonus. It is, therefore, a three-
in-one scheme.
2. It guarantees daily minimum wage.
3. It provides enough opportunities for efficient workers to earn more.
Demerits
1. It is not easy to understand.
2. The fluctuations in the output levels, of different workers not attaining the standard,
are ignored and they all receive the same daily minimum wage. In the illustration given
above, if two workers produce 6 units and 8 units respectively (against standard
output of 10), each is assured a daily wage of Rs.50.
4.18 Group incentive plans
4.18.1 Profit sharing
Profit sharing is the most popular method rewarding the employees. Under it, the
employees are paid in addition to the regular wage, a particular share of the net profits
of the business as incentive.
Characteristics of Profit Sharing
1. It is based on an agreement between the employer and the employees.
2. It is a payment made after ascertaining the net profits of the business. It is not
therefore, a charge on profits.
3. The amount paid to the employees is over and above their normal pay.
4. The amount to the paid is determined based on some agreed formulas.
5. The payments based on seniority and wage level of individual workers.
Merits
1. Better employer-employee relations
2. Increase in productivity

Industrial Engineering (2161907) 4. Job Evaluation and Wage Plan
Department of Mechanical Engineering Prepared by: Jainik Makwana Darshan Institute of Engineering & Technology, Rajkot Page 4.31
3. Better living standards
4. Reduced costs of supervision
5. Promotion of team spirit
6. Limitations of Profit Sharing
Demerits
1. Regular income not assured
2. Suppression of profits
3. No inducement
4. All workers paid alike
Department of Mechanical Engineering Prepared By: Hardik B. Joshi Darshan Institute of Engineering & Technology, Rajkot Page 5.1
5 Industrial Legislations
Course Contents
5.1 Introduction
5.2 Necessity of Industrial Acts
5.3 Principles of Industrial
Legislation
5.4 The Indian Factories Act, 1948
5.5 The Industrial Dispute Act, 1947
5.6 The Indian Trade Unions Act,
1926
5.7 Industrial Employment (Standing
Orders) Act,1946
5.8 Payment of Wage Act, 1936
5.9 Workmen Compensation Act,
1923
5.10 Payment of Bonus Act, 1965
5.11 Employees Provident Fund
Scheme, 1952

5. Industrial Legislations Industrial Engineering (2161907)
Prepared by: Hardik B. Joshi Department of Mechanical Engineering Page 5.2 Darshan Institute of Engineering & Technology, Rajkot
5.1. Introduction
Industrial legislations (Acts) are the laws enacted by the Government to provide
economic and social justice to the workers in industries. These laws provide guidelines
to the industrialists in dealing with the matters of wages, incentives, facilities and
other working conditions of the workers. Mr. V.V. Giri explained industrial legislation
as, “A provision for equitable distribution of profits and benefits occurring from
industry, between industrialists and workers and affording protection to the workers
against harmful effects of their health safety and morality.”
Industrial legislation may be classified into two categories :
(a) General legislation and (b) Specific legislation.
General legislation looks after the general labour problems like social welfare,
insurance and industrial disputes, while specific legislation looks after the work of
specific industries, transport mines, electricity, waste disposal, boilers etc.
5.2. Necessity of Industrial Acts 1. Provide job security to workers.
2. Minimizes unfair treatments to workers.
3. Reduces conflicts with management.
4. Create healthy working environment for work.
5. Fix the standard wages for the different kind of work.
6. Specify the working hours and rest hours etc.
7. Protect the worker’s interest.
8. To provide fair compensation to the worker in case of accident.
9. Helps to protect the largest interest of society.
10. Improves industrial relations and minimizes industrial disputes.
11. Provide fair compensation to the workers who suffered from industrial accidents.
5.3. Principles of Industrial Legislation
Industrial/labour legislation is based upon the following principles :
1. Social justice.
2. Social equality.
3. National economy.
4. International uniformity and solidarity.
1. Social Justice: Industrial laws provide social justice to the employees by ensuring
suitable distribution of profits and benefits between the employer and employees. It
also ensures better working conditions in industry. Industrial acts based on social
justice are :
Factories Act
Minimum Wage Act
Workmen’s Compensation Act, etc.
2. Social Equality: Another objective of industrial legislation is to ensure social equality
or social welfare of workers. These laws make the employers to improve social status

Industrial Engineering (2161907) 5. Industrial Legislations
Department of Mechanical Engineering Prepared by: Hardik B. Joshi Darshan Institute of Engineering & Technology, Rajkot Page 2.3
i.e. material and morale conditions of the workers by ensuring adequate wages,
working hours, health and safety of the workers.
3. National Economy: It ensures normal growth of industry for the development of
nation. It satisfies the workers' need and increases their efficiency. Efficient industry
finally contributes a lot to improve national economy and makes the country self-
sufficient.
4. International Uniformity: international Labour Organisation (ILO) has been set up to
safeguard the interest of labour. The main objective of ILO is to secure minimum
standards on uniform basis in respect of all labour matters. Uniformity of standards
can be maintained only by enforcing various industrial laws.
5.4. The Indian Factories Act, 1948
The Factories Act was passed by the Governor General of India on 23rd Sept. 1948 and
it came into force on 1st April 1949. The Act was further amended in 1950, 1951, 1954
and 1976 which came into force on 26th November 1976. This act is applicable to any
factory in India that employees 10 or more than 10 workers.
Aims and objectives:
The major objectives of the factories act are :
The main object of the act is to provide protection to the workers employed in
factories against industrial hazards and to ensure sale and better working conditions,
It regulates and properly maintains various safety health and welfare activities m the
factories,
It also regulates and properly maintains working hours and rest hours of workers,
employment of children and adolescents, employment of women, annual leave with
wages etc.
Some Important Definitions
1. Factory. A working place under one management wherein 10 or more than 10 persons
are normally working with power aid or 20 or more persons working without power
aid.
2. Manufacturing process. A manufacturing process is a process for:
Making, altering, repairing, ornamenting, finishing, packing, oiling, washing, cleaning,
breaking up, demolishing, or otherwise treating or adopting any article or substance
with a view to its use, sale, transport, delivery, disposal etc.
Pumping oil, water or sewage or any other substance, or
Generating, transforming or transmitting power, or
Composing types of printing, printing by letter press, lithography, photography or
other similar process or bookbinding, or
Constructing, reconstructing, repairing, refitting, finishing or breaking up ships or
vessels or
Preserving or storing any article in cold storage.
3. Adult. A person who has completed 18th year of age is called adult.

5. Industrial Legislations Industrial Engineering (2161907)
Prepared by: Hardik B. Joshi Department of Mechanical Engineering Page 5.4 Darshan Institute of Engineering & Technology, Rajkot
4. Child. A person who has not completed 15th year of age.
5. Adolescent. A person who has completed 15th year, hut has not completed 18th year
of age.
6. Worker. Any person employed directly or through any agency for any manufacturing
process or for cleaning any part of machinery, or premises, or other identical work
connected with manufacturing process is called worker.
7. Machinery. Machinery means different appliances used in a factory like prime movers,
plants, machines, transmission machinery or any other appliances whereby power is
generated, transformed or transmitted.
8. Occupier. A person who has ultimate control over the affairs of factory.
9. Hazardous Process. Hazardous process means any process or activity in relation to an
industry where, unless special care is taken, raw-materials therein or the intermediate
or finished products, by products, wastes or effluents thereof would:
(a) Cause material impairment to the health of the persons engaged in or
connected therewith or
(b) Result in the pollution of the general environment.
Approval, Licensing and Registration of Factories
The act specifies that before starting a factory:
(1) It is necessary to take permission of the state government or chief inspector for
the site on which the factory is to be situated or for the construction or extension of
the factory.
(2) The plans and specifications have to be approved by the factory inspector.
(3) The factory has to be registered and the license obtained after paying the
necessary fees.
The application for permission should be sent to the Chief Inspector, it should contain
name and address of occupier, and factory, nature of manufacturing process, nature
of power to be used, name of factory manager, number of workers required etc.
If after submitting the application to the State Govt. or the Chief Inspector, nothing is
communicated to the applicant within 3 months, the permission is deemed to have
been granted.
If a State Govt. or a Chief Inspector refuses to grant permission to use a particular site,
the applicant may appeal to Central Govt. in this connection with 30 days from the
date of refusal.
Inspection Staff
The act permits the State Govt. to appoint a Chief Inspector and other inspectors who:
(a) may enter the factory and
(b) may make examination of premises, plant, machinery and any documents
related to factory.

Industrial Engineering (2161907) 5. Industrial Legislations
Department of Mechanical Engineering Prepared by: Hardik B. Joshi Darshan Institute of Engineering & Technology, Rajkot Page 2.5
Certifying Surgeons
The act also permits the State Govt. to appoint qualified medical practioners as
qualifying surgeons for
(a) The examination and certification of young workers and
(b) The examination of workers engaged in dangerous occupation or processes.
The factories act makes detailed provisions in respect of the following:
1. Health
2. Safety
3. Welfare
4. Working hours of adults
5. Employment of young persons
6. Employment of women
7. Leave with wages
8. Special provisions
(a) Dangerous Operations
(b) Accidents and Diseases
(c) Penalties and Procedure.
Health Provisions
The factories act makes the following provisions for maintaining the health of workers
and for reducing the possibilities of injuries:
(1) Cleanliness:
All dirt and refuse from floors, benches, etc. should be removed daily.
The floors of the work-room should be washed at least every week, using
disinfectant
All inside walls, partitions, ceiling, sides and tops of' passages and staircases should
be whitewashed or varnished at least once in every 14 months. If they are painted,
they should he repainted at least once in 5 years.
Effective means of drainage should he provided to avoid collection of water etc.
on the work, floor.
(2) Disposal of Wastes and Effluents:
Effective and suitable arrangements should be made for the disposal of wastes
and effluents due to manufacturing process.
(3) Ventilation and Temperature:
Effective and suitable provisions should be made for securing and maintaining in
every workroom:
(a) Adequate ventilation by fresh air circulation.
(b) Suitable temperature to provide conditions of comfort and prevent injury to
the health of workers.

5. Industrial Legislations Industrial Engineering (2161907)
Prepared by: Hardik B. Joshi Department of Mechanical Engineering Page 5.6 Darshan Institute of Engineering & Technology, Rajkot
(4) Dust and Fumes:
Effective measures should be taken for the prevention of inhalation or
accumulation of dust and fumes in the work-room.
(5) Artificial Humidification:
In factories (e.g. textile) where artificial humidification is used:
(a) Prescribed method should be used for achieving humidification and the
artificial humidification should be maintained within the prescribed limits.
(b) The water employed for humidification should be from a source of drinking
water.
(6) Over-Crowding:
(a) No work-room should be over-crowded so as to be injurious to the health of
the workers.
(b) The minimum space provided for a worker should be 14 m3. To arrive at this
figure a height above 4.2672 meter from floor level should not be taken into
consideration.
(7) Lighting:
(a) Light whether artificial or natural or both, should be sufficient and suitable in
all work places.
(b) Sky lights and glazed windows for lighting the workplaces should be kept clean
and unobstructed.
(c) Glares and shadows which may cause eye strain and increase the chances of
accidents should be prevented.
(8) Drinking Water:
Drinking water should be made available at suitable points. All such points should
be legibly marked “Drinking Water”. No such points should be located within 3.5
meters of urinal or latrine.
(9) Latrines and Urinals:
(a) Sufficient latrine and urinal accommodation of the prescribed type should be
provided.
(b) Separate enclosed accommodation should be provided for male and female
workers.
(c) Latrines and urinals should be adequately lighted, ventilated and maintained
clean at all the times.
(10) Spittoons:
Sufficient number of spittoons should be provided at convenient places. The
spittoons should be maintained in clean hygienic condition.
Safety Provisions: (1) Encasing and Fencing of Machinery. Every prime mover like engine or motor,
moving part of the machinery and every dangerous part of the machinery should
be fenced properly.
(2) Work on OK Near Machinery in Motion:

Industrial Engineering (2161907) 5. Industrial Legislations
Department of Mechanical Engineering Prepared by: Hardik B. Joshi Darshan Institute of Engineering & Technology, Rajkot Page 2.7
(a) Examination of any part of the machinery in motion should be carried out only
by a specially trained adult male worker, wearing tight fitting clothes.
(b) No woman or young worker should be permitted to clean, lubricate or adjust
any part of moving machinery which may involve a risk of injury.
(3) Employment of Young Persons on Dangerous Machines. No young person should
be allowed to work on a dangerous machine unless he is properly trained and
carefully supervised.
(4) Hoists and Lifts:
(a) Every hoist and lift should be of good mechanical construction, adequate
strength and must be protected by enclosures and fitted with gates.
(b) Every hoist and lift should be adequately maintained and periodically (at least
once in six months) examined.
(5) Lifting Machine, Chains Ropes and Lifting Tackles. Lifting machines such as cranes,
crab, winch, pulley block etc. should be of good construction, adequate strength.
They should be properly maintained and thoroughly examined at least once in a
year by a competent person.
(6) Pressure Plants. It should be ensured that the working pressure of pressure vessels
such as boilers does not exceed the safe limit.
(7) Floors, Stairs and Means of Access to different Places. All floors, steps, stairs,
passages and gangways should be of sound construction and free from
obstructions.
(8) Pits, Sumps, Opening in Floors etc. Every pits, sumps, opening in floors, fixed
vessels, tanks etc. should be securely covered or fenced.
(9) Excessive Weights. No person should be asked to lift, carry or move any load so
heavy that is likely to cause him injury.
(10) Protection of Eyes. To protect the eyes of workers from the flying particles (such
as in grinding, fitting, rivet cutting, chipping, etc.) or from exposure to welding
rays, each worker should be provided with effective screens or suitable goggles.
(11) Precautions against Dangerous Fumes:
(a) Adequate protection should be provided against dangerous fumes. No person
should be allowed to enter confined space, chamber, tank pit, etc. in which
dangerous fumes are likely to be present.
(b) If a manufacturing process is producing dust, gas, fumes or vapour which can
explode on ignition, the plant should be effectively enclosed; and such dust, gas,
fumes, etc. should not be allowed to accumulate.
(12) Precautions in case of Fire:
(a) Effective fire warning signal.
(b) Unlocked doors and opening towards outside the workroom as a means of
escape in case of fire.
(c) A free passageway and easily open able windows.

5. Industrial Legislations Industrial Engineering (2161907)
Prepared by: Hardik B. Joshi Department of Mechanical Engineering Page 5.8 Darshan Institute of Engineering & Technology, Rajkot
Welfare Provisions (1) Washing Facilities. In every factory separate and adequate washing facilities must
be provided and maintained for male and female workers.
(2) Facilities for Sitting. Suitable sitting facilities should be provided for all workers
obliged to work in standing position so that they may take rest if an opportunity
occurs in the course of their work, without affecting the work.
(3) First Aid Appliances. First aid/boxes equipped with prescribed contents and not
less than one in number for every 150 workers at any one time must be provided
and maintained at accessible places.*
(4) Canteen. A canteen should be provided and maintained in every factory employing
more than 250 workers.
(5) Shelters, Rest-rooms and Lunch-Rooms. Every factory in which more than 150
workers are ordinarily employed, adequate, suitable, clean, sufficiently lighted and
ventilated rest and lunch rooms should be provided.
(6) Creches. In factory wherein more than 50 women workers are employed, suitable
rooms (creches) must be provided for the use of the children under the age of 6
years of such women.
Welfare Officers. Every factory employing 500 or more workers should employ
prescribed number of welfare officers.
The State Govt. may prescribe the duties, qualifications and conditions of service of
welfare officers employed.
Working Hours
Hours of Work for Adults. No adult worker should be required or allowed to work in a
factory for more than 48 hours in any week; or 9 hours in any day. Moreover, no
worker should work for more than 5 hours before he had an interval of half-an hour.
Holidays. No adult worker should be required or allowed to work in a factory on the
first day (i.e. Sunday) of the week, unless the factory manager substitutes Sunday by
a holiday one or three days immediately before or after Sunday. If he is required to
work on Sunday, he shall be entitled to the compensatory holiday t or the same.
Extra Wages for Overtime. Where a worker is required to work for more than 9 hours
in any day or for more than 48 hours in any week, he shall be entitled for an overtime
at the rate of twice his ordinary rate of wastes as specified in the act. The manager of
every factory should maintain a register of adult workers to be available to the
inspector at all times during the working hours.
Restriction on Double Employment. No adult worker should be allowed to work in a
second factory on any day on which he has already been working in one factory.
Employment of Women. No women should be allowed to clean, lubricate or adjust
any part of the machinery while that is in motion. Every factory must provide for the
creches wherein more than 30 women workers are ordinarily employed. No woman
should be permitted to work in any factory except between the hours of 6 a.m. and 7
p.m.
Industrial Engineering (2161907) 5. Industrial Legislations
Department of Mechanical Engineering Prepared by: Hardik B. Joshi Darshan Institute of Engineering & Technology, Rajkot Page 2.9
Employment of Young Persons. A young person means a person who is either a child
or an adolescent. A “Child" means a person who has not completed his 15th year of
age. An “adolescent" means a person who has not completed his 18th year.
No child who has not completed 14th year should be required or allowed to work in a
factory. But a child who has completed his 14th year or an adolescent may be allowed
to work in a factory if:
(1) A certificate of fitness for such work granted by certifying surgeon is obtained by
the manager of the factory.
(2) Such a child or adolescent carries a token giving a reference to such certificate
while he is at work.
Working Hours of the Children:
(1) No child should be employed or permitted to work in any factory for more than 45
hours in any week and during the night hours.
(2) The period of work for all children employed in a factory should be limited to two
shifts which should not overlap or spread over more than 5 hours each. The manager
of every factory in which children are employed should maintain a register of child
workers showing the details such as name ; nature of work the group in which he is
situated, the number of fitness certificate etc. of the child worker.
Annual Leave with Wages
Every worker who has worked for a period of 240 days or more in a factory during
calendar year should be given leave with wages for a number of days calculated at the
rate of;
(а) One day for every 20 days of work performed during the previous calendar year by
an adult worker.
(b) One day for every 15 days of work performed by a child worker.
(c) if a worker does not in any one calendar year take the whole of the leave allowed
to him, any leave not taken by him shall be accumulated and allowed to him in the
succeeding calendar year subject to a maximum of 30 days in case of adult or 40 days
in case of the child.
(d) A worker interested to take leave should apply 15 days in advance (30 days in case
public utilities).
Dangerous Operations
If any operation carried out in the factory is likely to cause bodily injury, poisoning or
disease to the worker, the State Govt., may declare such operations as dangerous and
make the following rules:
(1) Stopping the employment of women and children in such operations.
(2) Provision of proper safeguards of all concerned with that operation.
(3) Periodical medical check-up of all concerned with such operation etc.
5. Industrial Legislations Industrial Engineering (2161907)
Prepared by: Hardik B. Joshi Department of Mechanical Engineering Page 5.10 Darshan Institute of Engineering & Technology, Rajkot
Accident and Diseases (1) If an accident causes death or bodily injury due to which the worker cannot work
for a period of 48 hours or more immediately after the accident, it should be reported
to the factory inspector within the prescribed time.
(2) If a worker is suffering from any disease specified in the schedule, a report to that
effect should be immediately send to the chief inspector. Such a report should include
the particulars of the worker and the disease from which he is suffering.
Power to take Samples. Any inspector, during working hours, after informing the
manager may take samples of any substance or materials being used in the factory.
Penalties. No court shall take cogniance of any offense made under this act except on
complaint by or with the previous sanction in writing of, an inspector.
If in any factory, there is any contravention of any of the provisions of the act
or of any rules made there under, the occupier and the manager of the factory shall
each be guilty of an offense and punishable with imprisonment for a period up to 3
months or with fine up to Rs. 2,000 or both. If the contravention is continued after
conviction, they shall be punishable with further fine which may extend to Rs. 75 for
each day on which the contravention is continued.
5.5. The Industrial Dispute Act, 1947
The Industrial Dispute Act was passed in 1947. The act makes provision for settlement
of industrial disputes between employees and the employers. The main object of the
Act is to secure industrial peace by setting the industrial disputes through negotiations
and conciliations rather than on the strength of strikes and lockouts.
Important Definitions 1. Award. Award means an interim or final determination of an industrial dispute by a
labour court or Industrial Tribunals,
2. Average Pay. Average pay means the average of wages payable to the workman:
(a) In 3 calendar months for monthly paid workman.
(b) In 4 completed weeks, in case of weekly paid workers.
(c) In 12 full working days for daily paid workers.
3. Industry. Industry means any business, trade, undertaking, manufacture, etc. It
includes calling service, employment handicraft or industrial occupation or a vocation
of workman. The educational and the professional firms of solicitors, chartered
accountants are not treated as industry under this act. But municipality, Govt. run
hospitals are treated as industry.
4. Industrial Dispute. Industrial dispute means any dispute or difference between:
Employers and Employers
Employers and Workmen
Workmen and Workmen and which is connected with:
The employment or
Non-employment or
The conditions of labour of any person.

Industrial Engineering (2161907) 5. Industrial Legislations
Department of Mechanical Engineering Prepared by: Hardik B. Joshi Darshan Institute of Engineering & Technology, Rajkot Page 2.11
5. Lay-off. Lay-off means failure, refusal or inability of an employer, on account of
shortage of coal, power, raw-material, accumulation of stock, breakdown of
machinery or for any other reason to continue to employ workers (in his industry)
whose name is borne on the muster-rolls and who have been retrenched.
Lay-off is a temporary phase; the employer-employee relations do not come to an end
but are simply suspended for some period (of emergency).
6. Lock out. Lock out means closing at place of employment or suspension of work or the
refusal by an employer to continue to employ any number of workers employed by
him.
7. Retrenchment. Retrenchment is the termination of the services of a worker for any
reason whatsoever, other than due to disciplinary action. Retrenchment does not
include,
Voluntary retirement of the worker,
Termination of service on the ground of continued ill-health.
8. Strike. Strike means refusal to work under a common understanding of any number
of workers. It is the weapon of the workers to compel the employer to accept their
demands.
9. Settlement. Settlement means a settlement arrived at during the course of
conciliation proceedings. It includes a written agreement between the workers and
the employer.
10. Workman. Workman means any person (including an apprentice) employed in any
industry to do any skilled or un-skilled, manual, supervisory or clerical work for hire or
award.
11. Suspension of Workman. A workman may be suspended during pending inquiry and
disciplinary action. If after inquiry misconduct is proved, the worker is dismissed and
is not entitled to any wages of the suspension period. In case when a worker is fully
exonerated after the enquiry, he would remain in service and would be entitled to
receive full wages of the suspension period.
Main Provisions
The main provisions of Industrial Disputes Act are:
1. Constitution of formation of machinery for settlement
2. Strikes and lock-outs.
3. Compensation for lay-off and retrenchment.
4. Notice for change of service conditions.
5. Penalties for break of provisions of Act.
The act provides for the prevention as well as settlement of the industrial disputes. It
has provided for an extensive and effective machinery for establishing industrial
peace. The provisions are made in the act for establishing the following machineries
for the prevention and settlement of industrial disputes.

5. Industrial Legislations Industrial Engineering (2161907)
Prepared by: Hardik B. Joshi Department of Mechanical Engineering Page 5.12 Darshan Institute of Engineering & Technology, Rajkot
Works Committee. Any industry in which 100 or more workers are employed or have
been employed on any day in the preceding 12 months, shall constitute a works
committee. The works committee shall consist of the representatives of the employer
and workmen employed in the unit. The number of the representatives of the
workmen shall not be less than those of the employer. The representatives of the
workmen shall be chosen from among them in consultation with the trade union, if
any.
The duties of the works committee are:
i. To secure and preserve the unity and good relations between employer and the
workmen.
ii. To comment upon the matters affecting the interest of all the workmen.
iii. endeavour and to compromise any material difference of opinion in respect of
such matters.
Conciliation. Conciliation officers are appointed by the appropriate Govt. for any
specified area or for one or more specific industries, either permanently or for a
limited period. The duty of the conciliation officer is to mediate in and to promote the
settlement of the industrial disputes.
If he fails in this he shall report to Govt. The appropriate Govt. in case of need, will
refer the dispute to Board of conciliation. Labour Court, Industrial Tribunal or National
Tribunal.
Board of Conciliation. A Board of conciliation is constituted by the appropriate Govt.
by notification in the Official Gazette. The Board consists of a chairman and two or
four other members; chairman is an independent person and other members are
representatives from employer and employees, in equal numbers.
Powers of the Board:
(i) A member of a board can enter the premises of the establishment for the purpose
of inquiry into any industrial dispute after any reasonable notice.
(ii) Every board inquiry is treated to be judicial proceeding within the meaning of
section 193 and 228 of the Indian Penal Code.
(iii) The Board will try to settle the industrial dispute. If it fails in this then, it will send
its report within two months from the date of reference to the appropriate Govt.
regarding the steps taken by it and the reasons why the settlement could not be
sought.
Court of Enquiry. Court of Enquiry may also be appointed by the appropriate Govt. by
notification in the Official Gazette. Such a court may consist of one or more
independent persons appointed by the Govt. The duty of the court is to enquire into
the matter referred to it and report thereon to the Govt. within 6 months from the
commencement of enquiry.

Industrial Engineering (2161907) 5. Industrial Legislations
Department of Mechanical Engineering Prepared by: Hardik B. Joshi Darshan Institute of Engineering & Technology, Rajkot Page 2.13
Labour Court. The appropriate Govt. may constitute Labour court for adjudication of
the disputes relating act. It consists of only one person who possesses a high judicial
standing as specified in the act. The mailers within the jurisdiction of labour court as
per second schedule are:
i. The propriety or legality of an order passed by employer under the standing
orders.
ii. The application and interpretation of standing orders.
iii. Illegality or otherwise of a strike or lock-out.
iv. Dismissal of workers including reinstatement of or grant of relief to workers
wrongly dismissed.
v. Withdrawal of any customary concession or privilege.
vi. All matters other than those specified in the third schedule.
Presiding officer of one man labour court shall have the following qualification:
(a) A judge of a high court; or
(b) A district judge who has worked for more than 3 years.
Industrial Tribunals. Appropriate Govt. may also constitute one person Industrial
Tribunals for the adjudication of Industrial disputes reterating to matters specified in:
(i) Schedule II (as mentioned in jurisdiction of labour court)
(ii) Schedule III. The schedule III includes matters such as;
1. Wages including the period and mode of payment.
2. Compensatory and other allowances.
3. Hours of work and rest pauses.
4. Holidays and leave with wages.
5. Bonus, provident fund and gratuity.
6. Rules of discipline.
7. Classification by grades.
8. Rationalisation.
9. Retrenchment of workmen and closure of establishment.
10. Shift working otherwise than in accordance with standing orders.
Presiding officer of the tribunal shall have the same qualification as that of Labour
court.
National Tribunals. The Central Govt. may constitute one or more National Tribunals
for the adjudication of the industrial disputes which may involve questions of national
importance. It can also take up industrial disputes which are of such a nature that
industrial establishments situated in more than one state are likely to be interested in
or affected by such disputes.
The presiding officer of the National Tribunal shall be:
i. an independent person
ii. less than 65 years of age ; and
iii. an existing or retired judge of a high court.

5. Industrial Legislations Industrial Engineering (2161907)
Prepared by: Hardik B. Joshi Department of Mechanical Engineering Page 5.14 Darshan Institute of Engineering & Technology, Rajkot
Strikes and Lock-outs (1) Strikes. No employee of a public utility service shall go on strike,
i. without giving a notice of strike to the employer within 6 weeks before striking
OR
ii. within 14 days of giving such notice; OR
iii. before the date mentioned in the notice; OR
iv. during the pendency of proceedings before a Labour court; Tribunal or
National tribunal and two months after the conclusion thereof.
(2) Lock-outs. No employer of any public utility service shall lock-out,
i. without giving a notice of lock-out within six weeks before locking out;
ii. within 14 days of giving such notice;
iii. before the date specified in the notice;
iv. during the pendency of conciliation proceeding.
The employer shall send information of strike or lock-out to the specified authority on
the day on which it is declared.
Penalty for Illegal Strikes or Lock-outs. A strike or lock-out is illegal if it is declared in
contravention of points 1 & 2 above (i.e. section 22 and section 23 of the act,
respectively);
i. Any worker who commences or continues strike which is illegal * shall be
punishable with imprisonment up to one month or a fine up to Rs. 50 or both.
ii. Any employer who commences or continues lock-out, which is illegal, shall be
punishable with imprisonment up to one month or a fine up to Rs. 1000 or
both.
iii. Instigating others for strikes or lock-outs is punishable up to a period of six
months or Rs. 1000/- or both.
iv. Any person held responsible for breaking the term of settlement of award is
punishable up to a period of six months.
Compensation for Lay off and Retrenchment. If a worker who has completed not less
than one year of continuous service under an employer is laid-off, he shall be paid for
all days during which he is so laid-off. The compensation applicable is 50 percent of
basic wages plus dearness allowances that would have been payable to him had he
not been laid off or retrenched.
No worker who has been in a continuous service for not less than one year under an
employer shall be retrenched by that employer until:
(a) The workman has been given one month’s notice in writing indicating the
reasons for retrenchment and the period of notice has expired or the worker
has been paid in lieu of such notice wages for the period of the notice provided
that no notice shall be necessary if the retrenchment is under an agreement
which specifies a date for the termination of service.

Industrial Engineering (2161907) 5. Industrial Legislations
Department of Mechanical Engineering Prepared by: Hardik B. Joshi Darshan Institute of Engineering & Technology, Rajkot Page 2.15
(b) The worker has been paid, at the time of retrenchment, compensation which
shall be equivalent to 15 days’ average pay for every completed year of
continuous service or any part thereof in excess of 6 months.
(c) The workman who is employed last in a particular category will be retrenched
first.
The following persons are not entitled for any benefit from the employer:
i. Who does not present himself at the appointed time during the laid off period
at least once a day.
ii. Who refuses to accept an alternative job on the same wages and of the same
nature within a radius of 8 kilometers.
iii. The enterprise is seasonal or employees less than 50 workers.
Notice for change of service conditions. According to the provisions of Industrial
Disputes Act, an employer cannot introduce any change in service conditions of a
worker until and unless the worker is served with a notice of 20 days in advance for
effecting such change. The conditions under which notice for change in service can be
given are : Wages, contribution towards provident fund, compensatory or other
allowances, leave with wages, hours of work and rest intervals, gratuity, holidays,
modernisation of plant and equipment etc.
Closing down the undertaking. An employer who intends to close down an enterprise
shall serve, at least 60 days before the date on which he intends closure to become
effective, a notice to Appropriate Govt. stating clearly the reasons for closing the
undertaking. Compensation by reference to section 25- FFF of the act is provided to
workers who are in continuous service for not less than a year with the undertaking.
The Industrial Disputes Act was amended in 1976.
This amendment deals with the special provisions relating to following:
(a) Prohibition of Lay-off and conditions precedent to retrenchment of workers in
certain undertakings with 300 or more than 300 workers.
(b) Restarting of establishments closed before the commencement of the
Amendment Act, 1976.
(c) Penalty for lay-off and retrenchment without prior permission.
(d) Penalty for closure.
The Industrial Disputes Amendment Act (1976) has provided for reasonable
restrictions put on employer’s right to layoff, retrenchment and closure.
The act also provides for restarting the undertakings which have already been closed
down on account of unavoidable circumstances.
Penalty for illegal lay-off or retrenchment is one month’s imprisonment or fine up to
Rs. 1000 or both (Section. 25).
In case of illegal closure of an establishment the workers shall be entitled to all the
benefits from the date of closure under any law in force as if no notice has been given
[Section 25-0 (3)]

5. Industrial Legislations Industrial Engineering (2161907)
Prepared by: Hardik B. Joshi Department of Mechanical Engineering Page 5.16 Darshan Institute of Engineering & Technology, Rajkot
5.6. The Indian Trade Unions Act, 1926
The modern industrialization process crates the labour problems in such forms as
employment of women and children even for heavy manual work, long hours of work,
low wages, lack of elementary facilities, bad working conditions heavy work load and
inhuman treatment of workers by their superiors. Individually, the workers find it
difficult to stop such exploitation by the management; so they organize themselves
into trade unions and fight the employers directly in the industrial field. Through their
collective action, workers ask for more wages, fewer hours of work, reasonable
amenities and human treatment. Thus trade union is born.
Even though a Trade Union is thus an economic organization, asking for more wages
and less hours of work, it may also serve as a moral institution, or a militant,
revolutionary body, a welfare agency or an agent for social change. A trade union can
perform a variety of roles.
Important Definitions 1. Registered trade union: A trade union registered under this act is called registered
trade union.
2. Registered office: The office of trade union which is registered under this act as the
head office thereof is called registered office.
3. Trade Union: Any combination, whether temporary or permanent, formed primarily
for the purpose of regulating the relations between workmen and employers or
between workmen and workmen, or between employers and employers, or for
imposing restrictive conditions on the conduct of any trade or business.
4. Trade dispute: Any dispute between workmen and employers or between, workmen
and, workmen, or between employers and employers which is connected with the
employment or non-employment, or the terms of employment or the conditions of
labor, of any person.
Registration procedure
It describes of trade unions. Following is procedure for registration of the trade
unions:
(1) Appointment of Registrars:
The appropriate Government shah appoint a; person to rbe the Registrar of Trade
Unions. The appropriate Government may appoint as many Additional | and Deputy
Registrars of Trade Unions as it thinks fit for the purpose of | exercising and
discharging, under the superintendence and direction of the Registrar, such powers
and functions of the Registrar under this Act as it may, by order, specify and define
the local limits within which any such Additional or Deputy Registrar shall exercise and
discharge the powers and functions so I specified.
(2) Modes of registration:
Any seven members of a trade union, by subscribing their names to the rule can apply
for registration. ..

Industrial Engineering (2161907) 5. Industrial Legislations
Department of Mechanical Engineering Prepared by: Hardik B. Joshi Darshan Institute of Engineering & Technology, Rajkot Page 2.17
(3) Application of registration:
Every application for registration of a Trade Union shall be made to the Registrar, and
shall be accompanied by a copy of the rules of the Trade Union and a statement of the
following particulars, namely:
(a) The names, occupations and addresses of the members making the application;
(b) The name of the Trade Union and the address of its head office; and
(c) The titles, names, ages, addresses and occupations of office bearers of the Trade
Union.
(d) If a Trade Union has been in existence for more than one year before the making
of an application for its registration, a general statement of the assets and
liabilities of the Trade Union prepared in such form and containing such particulars
as may be prescribed, should be delivered to the Registrar, together with the
application.
(4) Registration and certificate of registration:
The Registrar, on being satisfied that the Trade Union has complied with all the
requirements of this Act in regard to registration, shall register the Trade Union by
entering in a register, to be maintained in such form as may be prescribed, the
particulars relating to the Trade Union contained in the statement accompanying the
application for registration. The registrar, provides a certificate as a proof that trade
union is registered.
(5) Cancellation of registration:
Certificate of registration of a Trade Union may be withdrawn or cancelled by the
Registrar -
(a) On the application of the Trade Union to be verified in such manner as may be
prescribed, or
(b) If the Registrar is satisfied that the certificate has been obtained by fraud or
mistake, or that the Trade Union has ceased to exist or has willfully and after notice
from the Registrar contravened any provision of this Act or allowed any rule to
continue in force which is inconsistent with any such provision, or has rescinded
any rule providing for any matter provision for which is required by section 6.
Two months advance notice period showing the reason for cancellation has to be sent
to the trade union before cancellation.
Rights and liabilities of registered trade union.
The trade union has liability to maintain general fund for expenses related to various
activities related to trade union and must be spent as per provision of the act under
section 15.
The trade union has to keep separate fund for the political purposes.
If any member or office-bearer found violating the provision of section 15, it is
punishable act.

5. Industrial Legislations Industrial Engineering (2161907)
Prepared by: Hardik B. Joshi Department of Mechanical Engineering Page 5.18 Darshan Institute of Engineering & Technology, Rajkot
No suit or other legal proceeding shall be maintainable in any Civil Court against any
registered Trade Union in respect of any act done in contemplation or furtherance of
a trade dispute.
The account books of a registered Trade Union and the list of members thereof shall
be open to inspect of the Trade Union at such times as may be provided for in the
rules of the Trade Union.
Any registered Trade Union may, with the consent of not less than two-thirds of the
total number of its members (and subject to the provisions of section 25) change its
name.
Amalgamation of Trade Unions: Any two or more registered Trade Unions may
become amalgamated together as one Trade Union with or without dissolution or
division of the funds of such Trade Unions or either or any of them, provided that the
votes of at least one-halt of the members of each or every such trade Union entitled
to vote are recorded, and that at least sixty per cent of the votes recorded are in favor
of the proposal.
Return shall be sent annually to the Registrar, on or before such date as may be
prescribed, a general statement, audited in the prescribed manner, of all receipts and
expenditure of every registered Trade Union during the year ending on the 31st day
of December next preceding such prescribed date, and of the assets and liabilities of
the Trade Union existing on such 31st day of December. The statement shall be
prepared in such form and shall comprise such particulars as may be prescribed.
Traded union may make regulations for the purpose of carrying into effect the
provisions of this Act without prejudice.
Penalties
It describes to the trade union on violating several conditions.
Failure to submit the returns responsible person is punishable with the fine of Rs. 5,
and it continues further additional fine which may be extend to five rupees for each
week after the first default.
Any person who, with intent to deceive, gives to any member of a registered Trade
Union or to any person with the like intent, gives a copy of any rules of an unregistered
Trade Union to any person on the pretense that such rules are the rules of a registered
Trade Union, shall be punishable with fine which may extend to two hundred rupees.
5.7. Industrial employment (Standing orders) act 1946
The object of the Act is to have uniform Standing Orders providing that there should
not be different conditions of service for the employment by the employer to the
employees who work in under them. This act is Applicable to every industrial
establishment where 100 or more workmen are employed on any day of the preceding
12 months. Following are the silent features of the act:

Industrial Engineering (2161907) 5. Industrial Legislations
Department of Mechanical Engineering Prepared by: Hardik B. Joshi Darshan Institute of Engineering & Technology, Rajkot Page 2.19
Procedure to get certified standing orders:
Within six months from the date on which this Act, becomes applicable to an industrial
establishment, the employer shall submit to the certifying officer five copies of the
draft standing order proposed by him for adoption in this industrial establishment.
The draft standing orders submitted under this section shall be accompanied by a
statement giving prescribed particulars of the workmen employed in the industrial
establishment including the name of the trade union, if any, to which they belong.
On receipt of the draft, the Certifying Officer shall forward a copy thereof to the trade
union (if any) of the workmen, with a notice in the prescribed form requiring
objections, if any, which the workmen may desire to make to the draft standing orders
to be submitted to him within fifteen days from the receipt of the notice.
After giving the employer and the trade union or such other representatives of the
workmen as may be prescribed an opportunity of being heard, the Certifying Officer
shall decide whether or not any modification of or addition to the draft submitted by
the employer is necessary to render the draft standing orders certifiable under this
Act, and shall make an order in writing accordingly.
The Certifying Officer shall thereupon certify the draft standing orders, after making
any modifications there in which his order within seven days thereafter send copies
of the certified standing orders authenticated in the prescribed manner to the
employer and to the trade union or other prescribed representatives of the workmen.
Standing orders shall come into operation on the expiry of thirty days from the date
on which authenticated copies thereof are sent.
The text of the standing orders as finally certified under this Act shall be prominently
posted by the employer in English and in the language understood by the majority of
his workmen on special boards to be maintained for the purpose at or near the
entrance through which the majority of the workmen enter the industrial
establishment and in all departments thereof where the workmen are employed.
Standing orders finally certified under this Act shall not, except on agreement between
the employer and the workmen be liable to modification until the expiry of six months
from the date on which the standing orders or the last modifications thereof came in
to operation. If any modification within the standing orders as per agreement
between employer and employee, industrial establishment may apply to the
Certifying Officer to have the standing orders modified, and such application shall be
accompanied by five copies of the modifications proposed to be made, and along with
agreement between the employer and the workmen
Penalties and procedure:
An employer who fails to submit draft standing orders as per requirement or who
modifies his standing orders otherwise than in accordance to the procedure, shall be
punishable with fine which may extend to five thousand rupees, and in the case of a
continuing offence with a further fine which may extend to two hundred rupees for
every day after the first during which the offence continues.

5. Industrial Legislations Industrial Engineering (2161907)
Prepared by: Hardik B. Joshi Department of Mechanical Engineering Page 5.20 Darshan Institute of Engineering & Technology, Rajkot
An employer who does any act in contravention of the standing orders finally certified
under this Act for his industrial establishment shall be punishable with fine which may
extend to one hundred rupees, and in the case of a continuing offence with a further
fine which may extend to twenty five rupees for every day after the first during which
the offence continues.
Payment of subsistence allowance:
Where any workman is suspended by the employer pending investigation or inquiry
into complaints or charges of misconduct against him, the employer shall pay to such
workman subsistence allowance:
(a) at the rate of fifty per cent of the wages which workman was entitled to
immediately preceding the date of such suspension, for the first ninety days of
suspension; and
(b) At the rate of seventy-five per cent of such wages for the remaining period of
suspension if the delay in the completion of disciplinary proceedings against such
workman is not directly attributable to the conduct of such workman.
If any dispute arises regarding the subsistence allowance payable to a workman, the
workman or the employer concerned may refer the dispute to the Labor Court,
constituted under the Industrial Disputes Act, 1947 within the local limits of whose
jurisdiction the industrial establishment wherein such workman is employed is situate
and the Labor Court to which the dispute is so referred shall, after giving the parties
an opportunity of being heard, decide the dispute and such decision shall be final and
binding on the parties.
5.8. Payment of wage act, 1936
This act regulates the payment of wages to certain classes of employed persons in the
industry. This Act has 26 sections which regulates the wages.
Following are the silent features of this act:
o Wages means all remuneration payable to an employee in his respect of employment.
Any over-time remuneration, gratuity, bonus, pension, provident fund, leaves with
salary etc. are considered as part of wages.
o Payment of wages should be done to all employees in fix wage period on exceeding
one month. In industry, where there are less than 1000 employees, wages should be
paid within 7 days from the end of fixed wage period, whereas, when there are more
than 1000 employees, wages should be paid within 10 days from the end of fixed wage
period in current currency.
o From the wages, employer is authorized to carry out deduction such as, professional
tax, provident fund, fines, LWPs, TDS, ESI deductions, recovery of advance loan taken
by employee from the employer etc.
o If any fine (imposed after proper enquiry) is to be deducted, from the wages of
employees, the deduction should not exceed 3% of total wages payable to the
employee of that wage period.

Industrial Engineering (2161907) 5. Industrial Legislations
Department of Mechanical Engineering Prepared by: Hardik B. Joshi Darshan Institute of Engineering & Technology, Rajkot Page 2.21
o Every employer is required to maintain the registers and records for employees
employed by him, regarding particular work done by employee and wages paid to him,
deduction from wages along with the receipt of wages. This record is to be kept up to
3 years.
o If employee has any dispute related to unauthorized deductions, the state
government appoints an inspector, in order to examine the dispute. After hearing, the
authority may direct the employer to refund the deduction along with compensatory
reward. If the application employee is found malicious, he may be punished up to Rs.
50, to the employer.
Penalties and offences:
If person who is responsible for maintaining the record or register to furnish any
information related to wages, is punishable if he:
o fails to maintain the such register or record,
o Willfully refuse or neglect to furnish the information,
o Willfully furnishes an information which he knows false,
o Willfully obstructs an inspector from his duty,
o Willfully refuses to produce record on demand of an inspector,
o Prevents the employee from appearing before the inspector.
Payment of undisbursed wages in cases of death of employed person.
In cases of death of employed person, all amounts payable to an employed person as
wages shall, if such amounts could not or cannot be paid on account of his death
before payment is to be paid to the person nominated by him in this behalf. Where
no such nomination has been made or where for any reasons such amounts cannot
be paid to the person so nominated, be deposited with the prescribed authority who
shall deal with the amounts so deposited in such manner as may be prescribed.
5.9. Workmen’s Compensation Act, 1923
The Workmen’s Compensation Act, 1923 came into force on 1 July, 1924. The act was
amended in 1926 and 1929 to introduce certain changes and to rectify the
International Labour Convention on occupation disease. In 1933 a consolidating and
amending act was passed to incorporate the recommendations of the Royal
Commission on Labour. The Workmen’s Compensation (amendment) act, 1976 is the
latest amendment which became effective from 1st October 1976. Main provisions of
the act amended in 1976 are as follows:
Workmen’s Compensation Act provides compensation to certain categories of
workers for the loss of working capacity due to accidents. This act prevents the
exploitation of workers in case of payment of compensation. It safeguards the workers
and their families in case of death or disablements of workers arising from accidents.
The object of awarding compensation is to replace the actual loss suffered by the
worker.

5. Industrial Legislations Industrial Engineering (2161907)
Prepared by: Hardik B. Joshi Department of Mechanical Engineering Page 5.22 Darshan Institute of Engineering & Technology, Rajkot
Important Definitions in the Act 1. Dependent. ‘Dependent’ means any of the following relatives of the deceased worker:
i. A widow, a minor legimate son, an unmarried legimate daughter or widowed mother.
ii. An infirm son or daughter who has attained the age of 18 years and who was wholly
dependent on the earning of the workman at the time of his death and
iii. If wholly or partly dependent on the earning of the workman at the time of his death
a widower, a parent other than widowed mother, a minor legitimate son, an
unmarried illegitimate daughter or a daughter legimate or illegimate if married and
minor or if widowed and minor, a minor brother or an unmarried sister or widowed
sister, if a minor, a widowed daughter-in-law, a minor child of a predeceased son, a
minor child of a predeceased daughter where no parent of the child is a live or a
parental grandparent if no parent of the workman is alive. [Section 2(d)].
2. Partial disablement. Partial disablement means disablement of temporary nature that
reduces the earning capacity of a workman in the employment in which he was
engaged at the time of accident resulting in the disablement.
3. Temporary partial disablement. Disablement that temporarily reduces the earning
capacity of a workman.
4. Permanent partial disablement. It means any disablement that permanently reduces
the earning capacity of the workman in every employment.
5. Total disablement. Total disablement means such disablement whether of a
temporary or permanent nature, which incapacitates a workman for all work which
he was capable of performing at the time of accident resulting in such disablement.
The Act also specifies certain injuries which are to be deemed to result in permanent
total disablement. These include:
Loss of both hands and amputation at higher sites.
Loss of hand and a foot.
Double amputation through leg or thigh or amputation through leg or thigh on one
side and loss of other foot.
Loss of sight to such an extent as to render the claiment unable to perform any
work for which eye-sight is essential.
Very severe facial disfigurement and
Absolute deafness.
Besides permanent total disablement shall be deemed to result from any combination
of injuries where the agreegate percentage loss of earning capacity (as specified in
schedule I) amounts to one hundred percent or more. (Refer Table 2)
Application of the Act
The act applies to all workers employed in Railways, Factories, Mines, mechanically
propelled vehicles, construction work and other hazardous occupations except
persons employed in a clerical or administrative capacity or in Armed forces.

Industrial Engineering (2161907) 5. Industrial Legislations
Department of Mechanical Engineering Prepared by: Hardik B. Joshi Darshan Institute of Engineering & Technology, Rajkot Page 2.23
Employer’s Liability for Compensation. If a personal injury is caused to a workman by accident in the course of his employment, the employer shall be liable to pay
compensation in accordance with the provision of this act if : (a) Injury has been caused by accident. (b) During the course of employment. (c) And has resulted in workman’s death, permanent or temporary disablement.
The employer is not liable to pay compensation if: (a) The injury disables the workman for less than 3 days. (b) The injury is caused by an accident which occurred while the workman was under
the influence of drink or drugs. (c) The injury is caused by wilful disobedience of the safety rules by the worker; or (d) The injury is caused owing to the wilful removal or disregard of any safety guard
by the workman. But, if the worker dies of an accident due to the above reasons
the employer has to pay compensation.
Amount of Compensation. Amount of compensation depends upon the following factors: (1) Average monthly wages of the worker concerned which should not be more than Rs.
1000. (2) The extent of injury e.g.
(a) Death. (b) Permanent total disablement.
(c) Permanent partial disablement. (d) Temporary disablement.
(3) Type of work of the worker (clerical, industrial, administrative). (4) Causes of accidents (whether it occurred due to negligence of the worker etc.):
Amount of compensation payable in case of different injuries can be ascertained from Schedule IV as given below (as amended up to 1976)
Table 5. 1 Rate of compensation
Sr No
Amount of Compensation for
Monthly wages Death Permanent
disabled Temporary
disabled
1 Up to Rs. 60 7,200 10,080 50% of Monthly Wages
2 More than 60 up to 90 9,720 14,608 36
3 More than 90 up to 120 11,520 16,128 42
4 More than 120 up to 150 13,500 18,900 48 75
5 More than 150 up to 200 16,800 23,520 60
6 More than 200 up to 300 18,000 25,200 82.5
7 More than 300 up to 400 19,200 26,880 100
8 More than 400 up to 500 21,000 29,400 118.75
9 More than 500 up to 600 21,600 30,240 135
10 More than 600 up to 700 23,100 32,340 148.75
11 More than 700 up to 800 24,600 33,000 160
12 More than 800 up to 900 27,000 37,800 168.75
13 More than 900 up to 1,000 30,000 42,000 175
5. Industrial Legislations Industrial Engineering (2161907)
Prepared by: Hardik B. Joshi Department of Mechanical Engineering Page 5.24 Darshan Institute of Engineering & Technology, Rajkot
Notice of Accident
A worker injured in an accident-should first of all give in writing a notice of the accident
to the employer.
Every such notice should include:
o Name and Address of the injured worker.
o Cause of accident.
o Date of accident.
Medical Examination
An injured worker who has submitted a notice, must present himself for the medical
examination, if the employer wants. The employer must offer the medical
examination free of charge and with 3 days from the time at which service of notice
has been affected.
If the worker does not present himself for the medical examination then he will not
have the right for compensation.
Distribution of Compensation
Payment of compensation in respect of death of workman or under legal disability
shall be deposited by the employer with the commissioner. Employer should not make
payment of compensation directly.
However, in case of deceased workman an employer can give an advance up to Rs.
100 to dependents of the deceased worker for meeting the immediate expenses. The
commissioner, after deducting this advance, may allot the entire amount of
compensation to the dependent of the deceased workman.
Occupational Diseases
If a worker suffers from any of the specified occupational disease (the list of which is
given in schedule III of the act) and he worked in the factory for at least six months,
then the employer has to pay compensation. Some of the occupational diseases are
compressed air illness, poisoning by lead, phosphorous, mercury, arsenic, radium and
other radioactive substances, x-rays etc.
Appointment of Commissioner
The State Govt. may by notification in the Official Gazette appoint any person to be
commissioner for workmen’s compensation for the areas specified in this
modification. Every commissioner is deemed to be a public servant within the meaning
of the Indian Penal Code.

Industrial Engineering (2161907) 5. Industrial Legislations
Department of Mechanical Engineering Prepared by: Hardik B. Joshi Darshan Institute of Engineering & Technology, Rajkot Page 2.25
Table 5. 2 Schedule 1: Percentage of loss of earning capacity
Sr No. Description of Injury Percentage loss of earning capacity
1. Loss of both hands 100
2. Loss of a hand and a foot 100
3. Loss of sight to an extent that renders the claimant unable to perform any work for which sight is needed
100
4. Very severe disfigurement of face 100
5. Absolute deafness 100
6. Double amputation to leg or thigh and other foot 100
7. Amputation through shoulder joint 90
8. Amputation of both feet 90
9. Loss of a hand or a thumb and four fingers of one hand 60
10. Loss of 4 fingers of one hand 50
11. Amputation below knee 40
12. Loss of one eye 40
13. Loss of all toes of both feet 40
14. Loss of thumb 30
15. Loss of three fingers of one hand 30
16. Loss of two fingers of one hand 20
17. Loss of vision of one eye 30
18. Loss of index finger 14
19. Loss of middle finger 12
20. Loss of ring or little finger 7
21. Loss of right or left great toe 14
22. Loss of any other toe 3
23. Two toes of one foot excluding great toes 5
24. Three toes of one foot excluding great toes 6
25. Four toes of one foot excluding great toes 9
Illustrative example for calculating compensation.
A worker getting Rs. 1000/- per month, meets an accident and loses one eye and three
fingers of his right hand and also one of his great toes. Determine the compensation to be
paid to the worker. What would be the compensation if the poor worker also loses his
thumb?
Solution.
1 Percentage loss of earning capacity due to loss of one eye (Schedule I. Table 5.2)
40%
2 Percentage of loss of earning capacity due to loss of three fingers of right hand
30%

5. Industrial Legislations Industrial Engineering (2161907)
Prepared by: Hardik B. Joshi Department of Mechanical Engineering Page 5.26 Darshan Institute of Engineering & Technology, Rajkot
3 Loss of earning capacity due to loss of his one great toe.
14%
Therefore, the total loss due to above = 40 + 30 + 14 = 84% Amount of compensation payable to the worker
= 84/100 X 42000 = Rs. 33768/- 4 If the worker also loses his thumb, then the
percentage of loss of earning capacity would be
84+30=114%
But it cannot be more than 100 percent loss and therefore, the compensation payable
would be Rs. 42000/-.
5.10. Payment of bonus act 1965
Bonus means something extra than salary and wages. For the workers, the extra
amount paid by the employer apart from salary, generally on annual basis, is
considered as bonus. Bonus is given by an employer to the employees because due to
their effort, the employer has earned and as token of appreciation extra amount is
paid to the workers.
In industry to solve the dispute related to bonus, this act was constituted in 1965.
Following are the silent features of the act:
Bonus is calculated on the annual basis of accounting year. In major cases, Accounting
year is either the date of book closure or 1st April of year to 31st March of next year.
For calculation of bonus distribution, all departments, undertakings and branches re
also to be considered.
The workers who has worked in the previous accounting year, are entitled for the
bonus.
An employee shall be disqualified from receiving bonus under this Act, if he is
dismissed from service for -
(a) fraud; or
(b) riotous or violent behavior while on the premises of the establishment; or
(c) Theft, misappropriation or sabotage of any property of the establishment.
Minimum and Maximum bonus:
Every employer shall be bound to pay a minimum bonus which shall be 8.33% of the
salary or wage earned by the employee during the accounting year or one hundred
rupees, whichever is higher, whether or not the employer has any allocable surplus in
the accounting year. If an employee has not completed 15thyear of age at the
beginning of the accounting year, the provisions of this section shall have effect in
relation to such employee, 8.33% of the salary or wage earned by the employee during
the accounting year or sixty rupees.
The employer shall, in lieu of above mentioned minimum bonus, be bound to pay to
every employee in proportion to the salary or wages earned by the employee subject
to maximum 20% of such salary or wages.
If the salary of an employee is above Rs. 2500 per men sum, the bonus payable to such
employee, shall be calculated if his salary or wage were Rs. 2500 men sum

Industrial Engineering (2161907) 5. Industrial Legislations
Department of Mechanical Engineering Prepared by: Hardik B. Joshi Darshan Institute of Engineering & Technology, Rajkot Page 2.27
Rules regarding payment of bonus:
If employee has paid any interim bonus or customary bonus to an employee, he shall
be entitled to deduct the amount of payable bonus at the end of accounting year.
If in the accounting year, due to employee any financial loss has occurred to the
employer, then it shall be lawful for the employer to deduct the amount from the
bonus payable to the employee.
The employer shall pay the bonus payable within 8 months of book closure of that
accounting year. If any dispute regarding bonus is pending, then the bonus shall be
paid within one month from the award of that dispute.
For payment of bonus, various provisions are made in the Act, for newly setup
organizations.
5.11. Employees provident fund scheme 1952
Employee Provident Fund Act, was passed in 1952. The object of this act is to provide
for the installation of Provident and family pension schemes for the employees in the
factories and establishments.
The act is applicable to factories and establishments failing under notified industry,
which have been in existence for at least:
a. 3 years when the number of employees is 50 or more.
b. 5 years when the number of employees in between is 20 to 50.
EPF Act, 1952 has following major aspects:
o Contribution towards provident fund and
o Withdrawals and payments of provident fund.
o Benefit to nominee to employee Contribution towards provident fund:
The contribution towards Provident Fund shall be made by the employees and the
employers at the statutory rate as may be specified in the act. Commonly employer
and employee each contribute 12% of workers’ emolument component basic pay,
dearness allowances and relating allowances to provident fund. The employers shall
be required to collect the share of their employees by deducting the same from wages
and make their own contribution as per the rates provided in the act.
The employees shall also contribute at a similar statutory rate. The employees are held
responsible for remitting their contribution as well as that of employees towards
provident fund. The Government shall pay interest on provident fund contribution at
the specified rate.
Withdrawals and payments of provident fund:
To avail the benefit of the scheme, the employee should have completed one years
continuous service or worked for 240 days during a period of 12 months. An employee
is entitled to receive specified amount as given below as per his tenure of service.

5. Industrial Legislations Industrial Engineering (2161907)
Prepared by: Hardik B. Joshi Department of Mechanical Engineering Page 5.28 Darshan Institute of Engineering & Technology, Rajkot
Table 5. 3
Tenure of service % of employer’s Contribution receivable by the employee
After 15 years 100%
Less than 3 years 75%
Between 3 to 5 years 50%
Between 5 to 10 years 25%
Between 10 to 15 years 15%
The employee’s own contribution shall be payable to him in full with interest in any
case of above.
Benefit to nominee of employee:
If an employee dies during employment, his nominee or family member gets an
amount full amount in Provident account of the deceased person.

Department of Mechanical Engineering Prepared By: Jainik Makwana Darshan Institute of Engineering & Technology, Rajkot Page 6.1
6
Inspection and Statistical Quality Control
Course Contents
6.1 Inspection
6.2 Quality
6.3 Control
6.4 Quality Control
6.5 Cost of Quality
6.6 Statistical Quality Control
6.7 Total quality management
6.8 Quality Assurance and Quality audit
6.9 Six Sigma
6.10 Quality Circle
6.11 Distinction between variable and
attribute data
6.12 Acceptance sampling
6.13 The Operating characteristics curve
6.14 Sampling Plans
6.15 Control charts
6.16 Definition of Control Chart
6.17 Control Charts for Variables
6.18 Control charts for attributes

6. Inspection and Statistical Quality Control Industrial Engineering (2161907)
Prepared by: Jainik Makwana Department of Mechanical Engineering Page 6.2 Darshan Institute of Engineering & Technology, Rajkot
6.1 Inspection o Inspection is the most common method of attaining standardization, uniformity and
quality of workmanship. It is the cost art of controlling the product quality after
comparison with the established standards and specifications.
o It is the function of quality control. If the said item does not fall within the zone of
acceptability it will be rejected and corrective measure will be applied to see that the
items in future conform to specified standards.
o Inspection is an indispensable tool of modern manufacturing process. It helps to
control quality, reduces manufacturing costs, eliminate scrap losses and assignable
causes of defective work.
6.1.1 Objectives of Inspection
1. To collect information regarding the performance of the product with established
standards for the use of engineering production, purchasing and quality control etc.
2. To sort out poor quality of manufactured product and thus to maintain standards.
3. To establish and increase the reputation by protecting customers from receiving poor
quality products.
4. Detect source of weakness and failure in the finished products and thus check the
work of designer.
6.1.2 Purpose of Inspection
1. To distinguish good lots from bad lots
2. To distinguish good pieces from bad pieces.
3. To determine if the process is changing.
4. To determine if the process is approaching the specification limits.
5. To rate quality of product.
6. To rate accuracy of inspectors.
7. To measure the precision of the measuring instrument.
8. To secure products – design information.
9. To measure process capability.
6.1.3 Stages of Inspection
1. Inspection of incoming materials:
o It is also called receiving inspection. It consists of inspecting and checking of all the
purchased raw materials and parts that are supplied before they are taken on to stock
or used in actual manufacturing. Inspection may take place either at supplier’s end or
at manufacturer’s gate. If the incoming materials are large in quantity and involve
huge transportation cost it is economical to inspect them at the place of vendor or
supplier.
2. Inspection of production process:
o The work of inspection is done while the production process is simultaneously going
on. Inspection is done at various work center of men and machines and at the critical

Industrial Engineering (2161907) 6. Inspection and Statistical Quality Control
Department of Mechanical Engineering Prepared by: Jainik Makwana Darshan Institute of Engineering & Technology, Rajkot Page 6.3
production points. This had the advantage of preventing wastage of time and money
on defective units and preventing delays in assembly.
3. Inspection of finished goods:
o This is the last stage when finished goods are inspected and carried out before
marketing to see that poor quality product may be either rejected or sold at reduced
price.
6.1.4 Methods of Inspection
There are two methods of inspection.
1. 100% Inspection:
o This type will involve careful inspection in detail of quality at each strategic point or
stage of manufacture where the test involved is non-destructive and every piece is
separately inspected. It requires more number of inspectors and hence it is a costly
method.
o There is no sampling error. This is subjected to inspection error arising out of fatigue,
negligence, difficulty of supervision etc. Hence complete accuracy of influence is
seldom attained.
o It is suitable only when a small number of pieces are there or a very high degree of
quality is required.
o Example: Jet engines, Aircraft, Medical and Scientific equipment.
2. Sampling Inspection:
o In this method randomly selected samples are inspected. Samples taken from
different batches of products are representatives. If the sample prove defective. The
entire concerned is to be rejected or recovered.
o Sampling inspection is cheaper and quicker. It requires less number of Inspectors. It’s
subjected to sampling errors but the magnitude of sampling error can be estimated.
o In the case of destructive test, random or sampling inspection is desirable.
o This type of inspection governs wide currency due to the introduction of automatic
machines or equipment’s which are less susceptible to chance variable and hence
require less inspection, suitable for inspection of products which have less precision
importance and are less costly.
o Example: Electrical bulbs, radio bulbs, washing machine etc.
o Destructive tests conducted for the products whose endurance or ultimate strength
properties are required.
o Example: Flexible strength, resistance capacity, compressibility etc.
6.1.5 Drawbacks of Inspection
o Inspection adds to the cost of the product but not for its value.
o It is partially subjective, often the inspector has to judge whether a product passes or
not.
o Example: Inspector discovering a slight burnish on a surface must decide whether it is
bad enough to justify rejection even with micrometres a tight or loose fit change

6. Inspection and Statistical Quality Control Industrial Engineering (2161907)
Prepared by: Jainik Makwana Department of Mechanical Engineering Page 6.4 Darshan Institute of Engineering & Technology, Rajkot
measurement by say 0.0006 inches. The inspectors design is important as he enforces
quality standards.
o Fatigue and Monotony may affect any inspection judgment.
o Inspection merely separates good and bad items. It is no way to prevent the
production of bad items.
6.2 Quality
o Different meaning could be attached to the word Quality under different
circumstances.
o The word Quality does not mean the Quality of manufactured product only. It may
refer to the Quality of the process (i.e., men, material and machines) and even that of
management.
o Where the quality of manufactured product referred as or defined as ‘‘Quality of
product as the degree in which it fulfils the requirement of the customer. It is not
absolute but it judged or realized by comparing it with some standards’’.
o It is usually determined by some characteristics namely design, size, material,
chemical composition, mechanical functioning workmanship, finish and other
properties. In the final analysis the Quality standards for the products are established
by the customer.
o Example: Gear used in sugarcane extracting machine through not of the same material
and without possessing good finish, tolerance and accuracy as that of gear used in the
hand stock of a teeth may be considered of good quality if it work satisfactory in the
juice extracting machine.
o Quality begins with the design of a product in accordance with the customer
specification further it involves the established measurement standards, the use of
proper material, selection of suitable manufacturing process and the necessary
tooling to manufacture the product, the performance of the necessary manufacturing
operations and the inspection of the product to check the manufacturing operations
and the inspection of the product to check on performance with the specifications.
The word “Quality” has variety of meanings:
1. Fitness for purpose:
o The component is said to possess good quality, if it works well in the equipment for
which it is meant Quality is thus defined as fitness for purpose.
2. Conformance to requirements:
o Quality is the ability of the material/component to perform satisfactorily in an
application for which it is intended by the user. Quality of a product thus, means
conformance to requirements. Customer needs have to be assessed and translated
into specifications depending upon the characteristics required for specific
application. Just as every human has his own characteristics every application has its
own characteristics.

Industrial Engineering (2161907) 6. Inspection and Statistical Quality Control
Department of Mechanical Engineering Prepared by: Jainik Makwana Darshan Institute of Engineering & Technology, Rajkot Page 6.5
o Thus we conclude that the product should have certain abilities to perform
satisfactorily in a stated application. These abilities may be categorised into ten factors
as under:
1. Suitability. For specific application.
2. Reliability. It should give efficient and consistent performance.
3. Durability. It should have desired life.
4. Safe and fool proof workability.
5. Affordability. It should be economical.
6. Maintainability. It should be easy to maintain.
7. Aesthetic look. It should look attractive.
8. Satisfaction to customers. It should satisfy the customers’ requirements.
9. Economical. It should have reasonable price.
10. Versatility. It should serve number of purposes.
A product can be said to possess good quality if all the above requirements are properly
balanced while designing and manufacturing it.
a) Quality of Design o The quality of design of a product is concerned with the tightness of the specifications
for manufacture of the product. For example, a part which has a drawing tolerance of
±0.001 mm. would be considered to have a better quality of design than another with
a tolerance of ±0.01 mm.
o A good quality of design must ensure consistent performance over its stipulated life
span stated in terms of rated output, efficiency, and overload capacity, continued or
intermittent operation for specified application or service.
o It should consider possible modes of failure due to stress, wear, distortion, corrosion,
shocks, vibrations, high or low temperature, altitude or pressure, environmental
conditions etc.
o However, product design and development is a continuous process which results into
evaluation of a product, based on assessed user needs, their feedback after use and
development in technology at a given point of time, in a given environment.
b) Quality of Conformance
o The quality of conformance is concerned with how well the manufactured product
conforms to the quality of design.
o When a design has been established, it is the task of all responsible for production
planning and manufacture to obtain a high level of quality of conformity; the measure
of truthfulness with which the product conforms to the design specifications.
c) Quality of Performance o The quality of performance is concerned with how well the manufactured product
gives its performance. It depends upon
a) Quality of Design.
b) Quality of Conformance.

6. Inspection and Statistical Quality Control Industrial Engineering (2161907)
Prepared by: Jainik Makwana Department of Mechanical Engineering Page 6.6 Darshan Institute of Engineering & Technology, Rajkot
o It can be a best design possible, but poor conformance control can cause poor
performance, conversely the best conformance control cannot make the product
function correctly, if the design itself is not right
6.3 Control o Control can be defined as a process by means of which we observe the actual
performance and compare it with some standard. If there is a deviation between the
observed performance and die standard performance then it is necessary to take
corrective action.
o The control process involves a universal sequence of steps as follows: 1. Choose the control subject. 2. Choose a unit of measure. 3. Set a standard value i.e., specify the quality characteristics 4. Choose a sensing device which can measure. 5. Measure actual performance. 6. Interpret the difference between actual and standard. 7. Taking action, if any, on the difference.
6.4 Quality Control The term quality control has variety of meanings:
1. Quality control is the process through which we measure the actual quality
performance, compare it with the standards and take corrective action if there is a
deviation.
2. It is a systematic control of various factors that affect the quality of the product It
depends on: Material, Tools, Machines, type of labour, working conditions, measuring
instruments, etc.
3. Quality control can be defined as the entire collection of activities which ensures that
the operation will produce the optimum quality products at minimum cost
4. It can also be defined as the tools, devices or skills through which quality activities are
carried out.
5. It is the name of the department which devotes itself full time to quality functions.
6. The procedure for meeting the quality goals is termed as quality control.
7. It is a system, plan or method of approach to the solution of quality problems.
Steps in quality control programme:
1. Formulate quality policy.
2. Work out details of product requirements, set the standards (specifications) on the
basis of customer’s preference, cost and profit.
3. Select inspection plan and set up procedure for checking.
4. Detect deviations from set standards or specifications.
5. Take corrective action through proper authority and make necessary changes to
achieve standards.
6. Decide on salvage method i.e. to decide how the defective parts are disposed of,
entire scrap or rework.

Industrial Engineering (2161907) 6. Inspection and Statistical Quality Control
Department of Mechanical Engineering Prepared by: Jainik Makwana Darshan Institute of Engineering & Technology, Rajkot Page 6.7
7. Co-ordination of quality problems.
8. Developing quality consciousness in the organization. Quality control is not a
function of any single department or a person. It is the primary responsibility of any
supervisor to turn out work of acceptable quality.
6.4.1 Aims or Objectives of Quality Control
1. To improve the company’s income by making the product more acceptable to the
customers; by providing long life, greater usefulness (versatility), aesthetic aspects,
maintainability, etc.
2. To reduce company’s cost through reduction of the losses due to defects.
3. For example, to achieve lower scrap, less rework, less sorting, fewer customer returns
etc.
4. To achieve interchangeability of manufacture in large scale production.
5. To produce optimum quality at minimum price.
6. To ensure satisfaction of customers with products or services of high quality level, to
build customers’ goodwill, confidence and reputation of manufacturer.
7. To make inspection prompt to ensure quality control at proper stages to ensure
production of non-defective products.
8. Judging the conformity of the process to the established standards and taking suitable
action when there are deviations.
9. To improve quality and productivity by process control, experimentation and
customers feedback.
10. Developing procedure for good vendor-vendee relations.
11. Developing quality consciousness in the organisation.
6.4.2 Quality Characteristics
o A physical or chemical property, a dimension, a temperature, pressure, taste, smell or
any other requirements used to define the nature of the product or service (which
contributes to fitness for use) is a quality characteristic. Thus, a metal cylinder may be
defined by stating the quality characteristics such as, the type if metal, the length, the
diameter etc.
o Quality characteristics may be:
1. Directly measurable e.g. weight, shear strength, specific gravity, length, diameter
etc.
2. Non-measurable: e.g. rejections due to flaws, cracks, breakages etc. For each
quality characteristic, there is a sequence of activities as shown in figure below.
6.5 Cost of Quality o The costs of carrying out the company’s quality functions (meeting the quality needs
of the customers) are known as costs of quality. These include:
1. Market research costs of discovering the quality needs of the customers which will
meet these quality needs.
2. The design costs of translating the product concept into information which permits
planning for manufacture.

6. Inspection and Statistical Quality Control Industrial Engineering (2161907)
Prepared by: Jainik Makwana Department of Mechanical Engineering Page 6.8 Darshan Institute of Engineering & Technology, Rajkot
3. The cost of manufacturing planning in order to meet required quality
specifications.
4. Cost of inspection and test.
5. Cost of defect prevention.
6. Cost of scrap, quality failures.
7. Cost of quality assurance.
8. Field service and such other factors attributed to the quality improvement and
maintenance.
o A quality cost committee of the American Society for Quality Control has
recommended that quality costs be defined in four categories:
1. Cost of prevention.
2. Cost of appraisal.
3. Cost of internal failures.
4. Cost of external failures.
6.5.1 Cost of Prevention
o It consists of the costs associated with personnel engaged in designing, implementing,
and maintaining the quality system. These costs are incurred to keep failure and
appraisal costs to a minimum. Maintaining the quality system includes auditing the
system. Cost of prevention includes:
1. Cost of quality planning. It includes the costs associated with creating an overall
quality plan, the cost of market research and product development, inspection
plan, reliability plan etc.
2. Cost of documenting. It also includes cost of preparation of manuals and
procedures needed to communicate these plans to all concerned.
3. Process control cost. It is the cost associated with implementing the quality plants
and procedures to achieve fitness for use.
4. Cost of Training. It consists of costs of preparing training programmes for attaining,
maintaining and improving quality performance.
5. Costs associated with preventing recurring defects. Engineering, technical and
supervisory costs of preventing re-occurring defects.
6. Costs of investigation, analysis and correction of causes of defects by quality
control department
7. Cost of investigation, analysis, and correction of causes of defects by engineering
department.
8. Cost of cost consciousness programmes.
6.5.2 Cost of Appraisal
o The costs associated with the measuring, evaluating or auditing of products
components and purchased materials to assure conformance with quality standards
and performance requirements are called cost of appraisal.
o In other words, the costs of evaluating quality, and of identifying and segregating non-
conforming parts and assemblies. This consists of the costs of:

Industrial Engineering (2161907) 6. Inspection and Statistical Quality Control
Department of Mechanical Engineering Prepared by: Jainik Makwana Darshan Institute of Engineering & Technology, Rajkot Page 6.9
1. Receiving or incoming test and inspection.
2. Laboratory acceptance testing.
3. Inspection and test
4. Checking labour.
5. Set up for inspection and test.
6. Inspection and test material.
7. Maintenance and calibration of test and inspection equipment.
8. Quality audits.
9. Review of test and inspection data.
10. Evaluation of field stock and spare parts.
6.5.3 Cost of Internal Failures
o The costs associated with defective products, components, and materials that fail to
meet quality requirements and result in manufacturing losses are called as costs of
internal failures. This includes:
1. Cost associated with scrap, i.e. costs of material, labour and burden of non-usable
part.
2. Cost or rework and repair i.e. the cost of making defective parts and assemblies
good.
3. Cost of re-inspection and retest after the defective parts are repaired.
4. Cost associated with material review activity.
5. Cost of disposition i.e. the cost associated with the efforts required to determine
whether non-conforming products are usable for some other work and make final
disposal.
6. The costs of process yield lower than might be attainable by improved controls.
6.5.4 Cost of External Failures
o It consists of the costs which are generated because of defective products being
shipped to customers. This includes:
1. Cost of processing complaints from customers.
2. Cost of service to customers who receive defective items.
3. Cost of inspecting and repairing the defective items returned by the customers.
4. Cost of replacing the defective materials or products.
5. Cost of concessions made to customers due to substandard products being
accepted by customers. It includes loss in income due to down grade products for
sale as seconds.
Table 6.1 – Comparison of inspection and quality control
Sr. No. Inspection Quality Control
1 Inspection is a part of quality control.
Quality control is a broad term, it involves inspection at particular stages, but mere inspection does not mean quality control.

6. Inspection and Statistical Quality Control Industrial Engineering (2161907)
Prepared by: Jainik Makwana Department of Mechanical Engineering Page 6.10 Darshan Institute of Engineering & Technology, Rajkot
2
Inspection is an act of checking materials, parts, components or products at various stages in manufacturing and sorting out the faulty or defective items from good items.
Q.C. is an effective system for integrating quality development, quality maintenance and quality improvement efforts of various groups in an organisation to enable the production to be carried out at most economical level and to achieve satisfaction of customers.
3
Inspection uses precision measuring instruments such as vernier callipers, micrometers etc. and devices such as tool makers, microscope, profile projector, flaw detector etc.
Q.C. uses devices such as statistics, control charts, acceptance sampling, process capability study, V.Q.R., V.R., Quality audits, field complaints etc.
4
Inspection is concerned with quality of past production to judge conformance with specifications and sorting out defective items from good items.
Q.C. is concerned with quality of future production. For example, take a sample, inspect it, if it is defective find out the reasons and take corrective action so that such type of defects will not occur in future. What is learned from inspection is used as a basis to ascertain whether the quality of products to be produced will meet the specifications or it is necessary to make changes in production process.
5 Inspection is mainly the responsibility of the inspectors.
Everybody working in an organisation is responsible for quality of products produced.
6.6 Statistical Quality Control (S.Q.C.) o A quality control system performs inspection, testing and analysis to ensure that the
quality of the products produced is as per the laid down quality standards.
o It is called “Statistical Quality Control” when statistical techniques are employed to
control, improve and maintain quality or to solve quality problems.
o Statistic is the collection, organisation, analysis, interpretation and presentation of the
data. It is based on law of large numbers and mathematical theory of probability.
o It is just one of the many tools necessary to solve quality problems it takes into account
the existence of variation.
o It is in this sense that the adjective statistical is used in the expression statistical quality
control. Building an information system to satisfy the concept of ‘prevention’ and
‘control’ and improving upon product quality, requires statistical thinking.
o Statistical quality control is systematic as compared to guess-work of haphazard
process inspection, and the mathematical statistical approach neutralizes personal
bias and uncovers poor judgement.
o Statistical quality control consists of three general activities:

Industrial Engineering (2161907) 6. Inspection and Statistical Quality Control
Department of Mechanical Engineering Prepared by: Jainik Makwana Darshan Institute of Engineering & Technology, Rajkot Page 6.11
1. Systematic collection and graphic recording of accurate data.
2. Analyzing the data.
3. Practical engineering or management action, if the information obtained indicates
significant deviations from the specified limits.
6.6.1 Benefits of Statistical Quality Control
1. Efficiency. The use of S.Q.C. ensures rapid and efficient inspection at a minimum cost.
2. Reduction of scrap. It uncovers the cause of excessive variability in manufactured
products—forecasting trouble before rejections occur and reducing the amount of
spoiled work.
3. Moreover, the use of acceptance sampling in S.Q.C. exerts more effective pressure for
quality improvement than is possible by 100% inspection.
4. Easy detection of faults. In S.Q.C. after plotting the control charts (X R, P, C, U) etc.
When the points fall above the upper control limits or below the lower control limit it
is an indication of deterioration in quality, necessary corrective action is then taken.
On the other hand, with 100% inspection, unwanted variations in quality may be
detected at a stage when large amount of defective products have already been
produced.
5. Increases, output and reduces wasted machine and man hours.
6. Better customer relationship through improvement in product quality.
7. Reduces bottlenecks in the manufacturing process.
8. Higher productivity.
6.7 Total quality management (TQM)
o Total Quality Control gives stress on prevention of defects rather than setting it right
by rectification. The concept of total quality is different from product quality, it
includes product quality and much more. Its approach towards quality is in all its forms
in people and processes, in products and costs, in planning and management. All the
operations of a company market research, the needs of the customer, the optimal use
of raw materials and other inputs, product development and design, manufacturing
processes, sales, service after sales the whole of it comprise total quality.
o Total quality can be achieved only through total Employee Involvement. It starts with
people. Total quality comes from employees’ creativity, team work, participation,
continuous improvement, leadership, motivation etc.
o In short the Total Quality function includes :
1. Development of product specifications based on needs of users and economic
considerations.
2. Interaction with product design.
3. Reliability and development testing.
4. Process capability studies.
5. Quality planning for control of production process/assembly operations.
6. Quality control of incoming materials.
7. Vendor quality control and vendor development.

6. Inspection and Statistical Quality Control Industrial Engineering (2161907)
Prepared by: Jainik Makwana Department of Mechanical Engineering Page 6.12 Darshan Institute of Engineering & Technology, Rajkot
8. Inspection and testing during manufacture.
9. Interaction with service engineering.
10. Training of staff and customers.
11. Quality audit etc.
o There are six identifiable phases to achieve Total Quality Control:
1. Comprehension
2. Commitment
3. Competence
4. Communication
5. Correction
6. Continuance
o These are explained as below.
1. Comprehension: What is quality, it should be definable and measurable.
2. Commitment: Clarity of concepts and policies, organization for it.
3. Competence: Develop methods, tests, procedure to evaluate quality.
4. Communication: Create awareness, resolve conflicts, create an image of
product quality and reliability
5. Correction: Resolve problems of non-conformance. Problems are likely due to
unawareness and lack of knowledge.
6. Continuance: Maintain importance of quality.
o Thus, TQM refers to total involvement of staff in organization together, which includes
supplier, distributer and even customers in bringing about customer satisfaction by promoting
quality cultures through quality circles, job enrichment and effective purchasing.
6.7.1 Principle Objective of TQM
1. Meeting the customer’s requirements [customer focus customer satisfaction].
2. Continuous improvement of quality at every level, at every place and at every
stage.
3. To develop participative and integrated problem solving process. (Employee
involvement).
4. Bring about a total cultural change [conducive to continuous improvement] in
every facet of the organisation.
5. Focussed, continuous and relentless cost reduction.
6. Interlink and integrate various sub-systems of the organisation (which strives for
excellence).
6.7.2 Requirements for Successful Implementation of TQM
o For the successful implementation of TQM, the following guidelines may be followed:
1. The objectives and policies of the firm must reflect its commitment to quality as a
philosophy of customer satisfaction.
2. The TQM philosophy must be effectively communicated to each and every
employee and department so that it is clearly understood throughout the
organisation.

Industrial Engineering (2161907) 6. Inspection and Statistical Quality Control
Department of Mechanical Engineering Prepared by: Jainik Makwana Darshan Institute of Engineering & Technology, Rajkot Page 6.13
3. The TQM programme should be properly designed to meet the requirements of
the customers.
4. The participation of all the employees should be encouraged so that innovative
ideas are put forward by the employees. TQM should not be imposed upon
employees. The management should make TQM an employees’ programme
through proper education of workers.
5. Workers and managers should be given the necessary training for the effective
implementation of TQM.
6. TQM must involve product design and improvement, adoption of new technology,
system and procedures.
7. TQM should be considered as a continuous programme as the requirements of
customers keep on changing. TQM should also attempt to integrate the operations
of various departments.
8. TQM must involve customer feedback and employee feedback mechanisms to
create customer-oriented quality culture.
6.7.3 Benefits of TQM
A. Advantages unique to TQM
1. It makes company a leader not follower
2. It makes company more sensitive to customer needs
3. It makes company adopt more readily to change
B. Benefits to customers
1. Fewer problems with the product or services
2. Better customer care
3. Greater satisfaction
C. Benefits for the company
1. Better product quality
2. Staff is more motivated
3. Improved productivity
4. Reduced quality cost
5. Increased market
D. Benefits to staff
1. Empowerment
2. Improved job interest
3. More recognition
4. More training and improvement in skill
6.8 Quality Assurance and Quality audit o The job of evaluating the organization activities with respect to quality, reporting the
results of evaluation to all concerned departments for information and necessary
corrective actions is called as quality assurance.
o There are three stages in consideration to total quality of product; related to quality
assurance.

6. Inspection and Statistical Quality Control Industrial Engineering (2161907)
Prepared by: Jainik Makwana Department of Mechanical Engineering Page 6.14 Darshan Institute of Engineering & Technology, Rajkot
1. Design stage: To ensure that the quality of design is as per the requirement of
customer need.
2. Manufacturing stage: To confirm that the quality of the product is as per the
design specification.
3. Field observation/ performance stage: observing the performance of product
in actual field, study and analysis of performance, maintenance, life etc. for
improvement of quality of product.
o Total quality of assurance = (1) Quality of design + (2) quality of manufacturing
conforming to design + (3) Quality of performance
o The activities assigned to the assurance function usually include:
1. Processing of the field complaints.
2. Quality rating of outgoing product.
3. Quality survey or audit
4. Preparation of executive report on quality.
5. Setting up quality levels.
6. Inspection planning.
7. Disposition of non-conforming products.
o Advantages from Quality Assurance Engineering
a) Fewer defects.
b) Less scrap.
c) Fewer complaints.
d) Less inspection rejects.
e) Better quality.
f) Higher efficiency.
g) Higher productivity.
h) Good customer relations.
6.8.1 Quality Audit
o The quality auditor survey is an appraisal of the quality system of an entire plant The
quality survey is analogous to an accounting audit The audit checks the books, the
book keeper, and accounting system.
o The quality audit evaluates the product the inspector and the system for achieving
product quality. It inquires about the adequacy of all the entire system of handling
quality function.
o Quality audit is one of the key management tools for achieving the objectives set out
in the organisation’s policy.
o According to ISO 8402, Quality Audit is defined as “A systematic and independent
examination to determine whether quality activities and related results comply with
planned arrangements and whether these arrangements are implemented effectively
and are suitable to achieve objectives.” Quality audit provides an independent
unbiased assessment of the actual state of company with reference to the laid down
standards and practices.
Industrial Engineering (2161907) 6. Inspection and Statistical Quality Control
Department of Mechanical Engineering Prepared by: Jainik Makwana Darshan Institute of Engineering & Technology, Rajkot Page 6.15
6.8.2 Scope of Quality Audit
o Quality Audit covers various aspects, viz.
1. Policies and procedures regarding:
(a) Operators (b) Quality control (c) Administration.
2. Operating effectiveness involving:
(a) Records, interpretations, corrective action, (b) Equipment control.
(c) Inter-departmental co-ordination. (d) Assessment of product quality.
3. System Effectiveness covering:
(a) Storage and Handling practices.
(b) Field complaints and corrective action.
(c) Tool and Gauge control
(d) Product design changes.
4. Engineering specifications.
The complete quality survey or audit involves bringing together the data from the
following investigations.
A. To Examine Whether
1. The design meets the functional requirements completely.
2. Design specifications are clear cut without ambiguity.
3. The design fulfils the customer’s requirements.
B. To Examine Whether
1. Manufacturing specification conforms to the functional design
specifications.
2. The manufacturing specifications are complete and clear cut.
C. To Examine
1. Customer’s quality complaints.
2. And the adequacy of corrective action taken by the company.
D. To Examine
o The various phases of quality performance such as :
Check inspection data.
Control charts.
Inspection policies and its implementation etc.
E. To Examine Activities in shops such as
1. The adequacy of gauges and test equipment used.
2. Completeness and sequence of performance of inspection procedure, data
collection system and action.
F. To Examine Whether
1. Shop personnel possess adequate understanding and responsibility about
quality control.
2. The scope and organization of the programme to assure that all personnel.
6. Inspection and Statistical Quality Control Industrial Engineering (2161907)
Prepared by: Jainik Makwana Department of Mechanical Engineering Page 6.16 Darshan Institute of Engineering & Technology, Rajkot
6.8.3 Types of Audit
o The various types of audits generally carried out are:
1. The Adequacy Audit
o It is also called as management audit It determines the extent to which the
documented system, represented in the quality manual and the associated
procedures, work instructions and forms, adequately meets the requirements
of the standards, and also to ensure that it provides objective evidence that
the system has been designed to do so.
2. A Compliance Audit
o It is carried out to establish the extent to which the documented system is
implemented and observed by the workforce.
3. An External Audit
o External audit is carried out by one organisation or another with which they
have either entered into contract to purchase goods or provide services or
intend to do so. It may be an adequacy and/or a compliance audit
4. An Extrinsic Audit
o This is an external audit carried out by an independent third party that may be
accredited, using a national or international standard, such as ISO: 9000 series
to provide assurance on the effectiveness of the quality systems.
5. Internal Audit
o It is the audit carried out by the company on its own quality systems. Its
purpose is to give assurance to the management that its quality systems are
effectively achieving the planned quality objectives. These audits are carried
out by the organizations own staff, provided that they are independent of the
system being audited or by an outside agency.
6.9 Six Sigma o The concept of Six Sigma quality was evolved by Motorola Corporation, USA. Its
evolution lies in a classic stretch target set in 1981 by Motorola’s CEO, Bob Galvin, in
order to effect a tenfold improvement in product-failure levels over a 5-year period.
Bill Smith, an engineer at the company, realized that such results could be obtained
only after going into the core of what caused defects in the first place. So, he
conducted a statistical correlation between the field life of a product and the number
of flaws that have been detected and corrected while the product was being
manufactured. He concluded that if a product has been found defective and corrected
during the production process, chances were high that other defects had been missed
and would show up later during usage.
o On the other hand, error-free products rarely failed in the first 3 years of customer-
usage. Evidently, the simplest way to prevent product breakdowns was to ensure that
the process prevented defects of any kind, making detection and repair redundant.
External support for this argument came from the best-in-class benchmarking at

Industrial Engineering (2161907) 6. Inspection and Statistical Quality Control
Department of Mechanical Engineering Prepared by: Jainik Makwana Darshan Institute of Engineering & Technology, Rajkot Page 6.17
Motorola had been conducting simultaneously. It showed that total quality companies
were turning out products that had not been reworked at all.
o To minimise and, ideally, eliminate defects from the manufacturing process, Mikel J.
Hary, introduced the concept of Six Sigma to Motorola. The idea was to set a steep
quantitative target for all processes— and then, break each process into smaller and
smaller sequences, each of which could be examined for their potential for errors and
changed/modified to eliminate that potential. Thus, breaking down and studying
processes is a key element of result-oriented quality programmes. This helps in
tracking down the root cause of defects.
o Until 1994, Six Sigma remained a closely guarded secret at Motorola. The outside
world knew about, but not how to use it. Pioneers like Motorola reported saving of up
to $2 billion over 10 years of implementation while a recent convert like General
Electric reported $ 750 million saving in the costs in 1998.
6.9.1 The Mathematics [Concept] of Six Sigma
o Sigma i.e. standard deviation is used to designate the distribution or spread of any
process about the mean (average). The Sigma value indicates how well that process is
performing. The higher the Sigma value (2σ, 3σ, 4σ etc.), the better the process. Sigma
measures the capability of the process to perform defect free work.
o A defect is anything that results in customer’s dis-satisfaction. With six sigma, the
common measurement index is ‘defects-per-unit’, where unit can be virtually
anything—a component, a piece of material, a line of code, an administrative form, a
time frame, a distance etc.
o The sigma value indicates how of defects are likely to occur. As sigma value increases,
cost goes down, cycle time goes down, and customer satisfaction goes up.
Figure 6.1 - The mathematics of six sigma

6. Inspection and Statistical Quality Control Industrial Engineering (2161907)
Prepared by: Jainik Makwana Department of Mechanical Engineering Page 6.18 Darshan Institute of Engineering & Technology, Rajkot
o Six sigma quality approach relies upon the normal distribution. Most of the output of
the process will meet the specifications (call it X). Bui some will deviate, to varying
extent, measured by the standard deviation (σ). So, some units will have a
specification of X ± lσ, some, X ± 2σ and some X ± 3σ.
o The Six Sigma methodology tackles this problem in two ways as shown in Figure 6.1.
First, it widens the design width, stretching the upper and lower specification limits so
that, even if the product ranges between X - 3σ and X + 3σ it will function properly.
o The second step consists of analysing and re-engineering the process so that the value
of sigma drops, thus if the upper and lower specification limits originally stood at ±3σ,
they will automatically shifted to ±6σ as shown in Figure 6.1 (b).
o Thus the manufacturing process may be at 2σ or 3σ, etc., we now start our journey
towards 6σ. In other words, we have to shrink the variability of our process to such an
extent that the value of sigma of the process reduces to a new low value, which can
be fitted between ±6σ times even with the same specification limits. This is quality
improvement such an improved process hardly produces any defect.
Six sigma is an overall strategy to accelerate improvement in its processes, products and
services. It is also a measurement of total quality to let the company know how effective it is
in eliminating defects and variations from its processes. It encompasses tools from all
improvement initiatives, including those in operational, technical and customer excellence. It
just applies to every function in the company, not just the factory floor.
6.9.2 Why Six Sigma?
o The goal of a six sigma quality programme is to improve customer satisfaction through
reducing and eliminating defects and to continuously improve processes thereby
improving quality and productivity.
1. Six sigma quality level is the closest to zero defect. Less than 6a does not yield
acceptable level of quality and more than 6a does not yield substantial benefits.
2. Total customer satisfaction can be achieved with reliable product/services.
3. Reduction of cost is possible as shown in table.
4. It gives higher yield as indicated in the table.
5. Improved reliability.
6.9.3 Basic Steps Involved in the Application of Six Sigma
o The methodology of six sigma consists of five steps namely, Define (D), Measure (M),
Analyse (A), Improve (I) and Control (C). Brief explanations of the same are as follows:
1. Define/Identify
o Identify the key process/product characteristics for which 6a quality levlels are
to be achieved.
2. Measure
a) Select CTQ characteristics
b) Define performance standards
c) Validate measurement systems

Industrial Engineering (2161907) 6. Inspection and Statistical Quality Control
Department of Mechanical Engineering Prepared by: Jainik Makwana Darshan Institute of Engineering & Technology, Rajkot Page 6.19
3. Analyse
a) Establish product capability
b) Define performance objectives
c) Identify variation sources
4. Improve
a) Screen potential causes
b) Discover variable relationship
c) Establish operating tolerances
d) Improve continuously
5. Control
a) Validate measurement system
b) Determine process capability
c) Implement process controls
6.10 Quality Circle o Dewar, President of the International Association of QCs. defines QCs as “a way of
capturing toe creative and innovative power that lies within the work force.
o A quality circle is a small group of volunteers (usually 3 to 12 employees) doing similar
work. They meet regularly under the leadership of their immediate supervisor, or
someone chosen among the circle to identify problems, set priorities, discover causes
and propose solutions. These may concern quality, productivity, safety, job structure,
process flow, control mechanism, aesthetics of the work area etc.
o The Quality Circle concept has three major attributes ; these are :
1. QC is a form of participative management.
2. QC is a human resource development technique.
3. QC is a problem solving technique.
6.10.1 The Characteristics of Quality Circles
The characteristics of quality circles as management tool for improving productivity and
quality may be listed as below:
1. Circles are small primary groups of employees/workers whose lower limit is three
and upper limit twelve.
2. The memberships of quality circles are most voluntary. The workers/employees
interested in some area of work improvement may come together toform a circle.
3. Each circle is led by the area supervisor. Also they are normally coordinated
centrally in organisation by a person who has been trained as a Facilitator
4. The members meet regularly every week or according to an agreed schedule.
5. The circle members are specially trained in techniques of analysis and problem
solving in order to play their role effectively.
6. The basic role of circles is to identify and solve work related problems for
improving quality and productivity.

6. Inspection and Statistical Quality Control Industrial Engineering (2161907)
Prepared by: Jainik Makwana Department of Mechanical Engineering Page 6.20 Darshan Institute of Engineering & Technology, Rajkot
7. Quality Circles enable their members to exercise their hidden talents, creative
skills and competence for tackling challenging tasks and thus contribute to their
self-development
8. It also promotes the mutual development of their members through cooperative
participation.
9. The circle work is characterised by the attributes of high skill variety, task identity,
task significance, autonomy, goal setting and feedback. These attributes
contribute to job enrichment of the members.
10. It also contributes to job satisfaction of their members by creating feelings of
accomplishment from identifying and solving challenging problems. (It provides
them opportunity to satisfy their higher order needs).
11. It provides their members with opportunities for receiving public recognition from
the company’s management in the form of company-wide presentation of their
work.
12. The members also receive recognition in the form of mementos, certificates and
privileges. In some cases they also share in productivity gains that might be the
result of their work.
13. It also contributes to their self-esteem and self-confidence through acceptance of
their recommendation by the management.
6.10.2 Objectives of Quality Circles
o Objectives which contribute to the improvement and development of the enterprise
and indirectly the interest of the employees are:
1. To improve the quality and productivity and thus contribute to the improvements
and development of the enterprise.
2. To reduce the cost of products or services by waste reduction, safety, effective
utilisation of resources, avoiding unnecessary errors and defects.
3. To identify and solve work related problems that interfere with production.
4. To tap the creative intelligence of the persons working in the organisation and to
make full use of its human resources.
5. To permit employees to develop and use greater amount of knowledge and skill
and motivate them to apply to a wide range of challenging tasks.
6. To improve communication within the organisation.
7. To increase employees1 loyalty and commitment to the organisation and its goals.
8. To respect humanity and build a happy bright work place environment which is
meaningful to work in.
9. To enrich human capability, confidence, moral, attitude and relationship.
10. To satisfy the human needs of recognition, achievement and self-development.
6.10.3 Limitation of quality circles
1. The overall productivity may decrease initially (at the beginning of quality circles),
as the members turn from their daily work to the task of organising themselves
and undergoing training.
Industrial Engineering (2161907) 6. Inspection and Statistical Quality Control
Department of Mechanical Engineering Prepared by: Jainik Makwana Darshan Institute of Engineering & Technology, Rajkot Page 6.21
2. A large investment of time and money is required for a concept that is essentially
new and unproven in the organisation’s context.
3. The chances of errors increases initially. Mistakes are inevitable as employees
adjust to a new way of doing things.
4. Over-expectation of some employees who are too excited initially may turn to
disappointment and drop out.
5. Quality circles may threaten traditional authority structure. Threatened
authorities are likely to resist and non-cooperate with the circle activities.
6. Employees who are habituated to depend on their supervisors for direction and
who have lost their initiative feel uncomfortable with Quality circles.
7. After circle implementation, a period of confusion may arise. This is because
people experiment with new ideas, new skills and new roles.
8. Changes in system and control may become necessary.
6.11 Distinction between variable and attribute data o Statistical data can be characterised as either variable data or attribute data. When a
record is made of an actual measured quality characteristics, such as dimension
measured in mm, the quality is said to be measured in variables (Continuous data).
o The variability may be due to assignable causes of variation likely to occur because of
men, machines and materials or it can be due to unassignable causes of variations.
The object of quality control system is to minimize the unassignable causes of variation
and eliminate assignable causes of variation.
o Examples of Variables [Continuous data]
a) A dimension of a part measured.
b) Hardness in Rockwell units.
c) Temperature in degrees centigrade.
d) Tensile strength in kg/cm2.
e) Weight in kg etc.
o When a record shows only the number of articles conforming and the number of
articles failing to conform to any specified requirements, it is said to be recorded by
attributes. A part fits a gauge or it does not this method simply notes the presence or
absence of a quality characteristic in the parts examined. The characteristic is the thing
being checked in the inspection, observation, or test. It may be given dimension,
weight, volume, hardness, viscosity, or the life.
o Defective refers to those parts which do not possess the characteristic of conformity.
So, attribute or discrete data is a data on characteristic that can assume certain
distinct values (e.g., integer values). For example, a sample of 25 castings taken from
a lot contain 0, 1 or 2 defectives; there cannot be fraction defectives such as 2.5
defectives.
o Examples of Attribute [Discrete data]
a) The number of defective pieces found in a sample.
b) Surface finish of furniture.

6. Inspection and Statistical Quality Control Industrial Engineering (2161907)
Prepared by: Jainik Makwana Department of Mechanical Engineering Page 6.22 Darshan Institute of Engineering & Technology, Rajkot
c) Cracks in sheets by spot welds etc.
6.12 Acceptance sampling o Acceptance sampling is the process of evaluating a portion of the product/material in
a lot for the purpose of accepting or rejecting the lot as either conforming or not
conforming to a quality specifications. Inspection for acceptance purpose is carried
out at many stages in manufacturing. There are generally two ways in which inspection
is carried out:
i. 100% inspection
ii. Sampling inspection.
o In 100% inspection all the parts or products are subjected to inspection, whereas in
sampling inspection only a sample is drawn from the lot and inspected. A sample may
be defined as the number of items drawn from a lot, batch or population for inspection
purposes.
o Sampling inspection can be defined as a technique to determine the acceptance or
rejection of a lot or population on the basis of number of defective parts found in a
random sample drawn from the lot. If the number of defective items does not exceed
a predefined level, the lot is accepted, otherwise it is rejected. Sampling inspection is
not a new concept.
o In our daily life we use sampling inspection in selecting certain consumable items. For
example, while purchasing our annual or monthly requirements of wheat, rice or such
other food grains we naturally take a handful of grains to judge its quality for taking
purchasing decision. If we are not satisfied we take another sample and after two or
three samples from the same or different sources we take purchasing decision.
o Or, let us take another example, suppose we want to purchase mangoes we normally
take one or two mangoes from the lot and taste its quality, if the samples taken are
found good we decide to purchase the required quantity. Similarly in engineering
sampling inspection is preferred because it is more practical, quick and economical as
compared to 100% inspection.
o The main purpose of acceptance sampling is to distinguish between good lots and bad
lots, and to classify the lots according to their acceptability or non-acceptability.
6.12.1 The advantages of sampling inspection
1. The items which are subjected to destructive test must be inspected by sampling
inspection only.
2. The cost and time required for sampling inspection is quite less as compared to 100%
inspection.
3. Problem of inspection fatigue which occurs in 100% inspection is eliminated.
4. Smaller inspection staff is necessary.
5. Less damage to products because only few items are subjected to handling during
inspection.
6. The problem of monotony and inspector error introduced by 100% inspection is
minimised.

Industrial Engineering (2161907) 6. Inspection and Statistical Quality Control
Department of Mechanical Engineering Prepared by: Jainik Makwana Darshan Institute of Engineering & Technology, Rajkot Page 6.23
7. The most important advantage of sampling inspection is that, it exerts more effective
pressure on quality improvement. Since the rejection of entire lot on the basis of
sampling brings much stronger pressure on quality improvement than the rejection of
individual articles.
6.12.2 Limitations.
1. Risk of making wrong decisions:
o However, in sampling inspection, since only a part is inspected, it is inevitable that
the sample may not always represent the exact picture obtaining in the lot and
hence, there will be likelihood or risk of making wrong decisions about the lot. This
wrong decision can be made in two ways. Firstly, a really good lot (that is,
containing less proportion of defectives than specified) may be rejected because
the sample drawn may be bad. Secondly, a really bad lot (that is a lot containing
greater proportion of defectives than specified) may be accepted because the
sample drawn may be good. In the former case, the producer has to suffer a risk
of his good lots being rejected and hence the associated risk (chance) is called as
the producer’s risk. In the latter case, the consumer runs the risk of accepting bad
lots and hence the associated risk is called as consumer’s risk.
2. The sample usually provides less information about the product than 100 per cent
inspection.
3. Some extra planning and documentation is necessary.
o However, in scientific sampling plans, these risks are quantified and the sampling
criteria are adjusted to balance these risks, in the light of the economic factors
involved.
o The success of a sampling scheme depends upon the following factors:
i. Randomness of samples
ii. Sample size
iii. Quality characteristic to be tested
iv. Acceptance criteria
v. Lot size
6.12.3 Sampling methods
o The sampling methods can be classified as:
1. Simple Random sampling
2. Stratified sampling
3. Systematic sampling
4. Cluster sampling
5. Two stage sampling
Simple Random Sampling
o Selecting a sample in such a way that each item in a lot has an equal chance of being
selected, is called random sampling. Since, a judgement about the lot is to be made
on the basis of only a sample it is very important that the sample truly represents the
universe from which it is drawn. This requires that the sample size be large enough
6. Inspection and Statistical Quality Control Industrial Engineering (2161907)
Prepared by: Jainik Makwana Department of Mechanical Engineering Page 6.24 Darshan Institute of Engineering & Technology, Rajkot
and the sampling procedure such as to avoid bias. Parts resting on the bottom or in
the middle of a group must be selected as well as those lying conveniently on top.
o According to this method, the sample of the requisite size n is drawn from a lot of size
N, in such a manner; that while selecting an item, the chance for any item of the lot
being included in the sample is the same. An item once drawn is not placed back in
the lot.
Stratified Sampling
o In large lots, the difficulties of random selection may be so great that it may be
advisable to adopt stratified (proportional) sampling. For stratified sampling the
following rules should be followed.
1. Draw proportional samples. Whenever possible, be divided into sub-lots on
the basis of homogeneity (into certain number of homogeneous groups or
strata).
2. Draw sample items from all parts of such sub-lots of the inspection lot.
3. Draw sample items blind (without any bias).
o From each sub-lot into which the inspection lot is divided a sub-sample should be
selected. The size of the sub-sample should be proportional to the size of the sub-lot.
o This method of sampling may be generally more efficient than the simple random
sampling, as the simple random sampling may not always result in the selection of the
items from such stratum of the lot, thereby affecting the representativeness of the
sample drawn.
o It would be advisable to ensure that a minimum of two items are selected from each
sub-lot.
Systematic Sampling
o When the items in a lot are presented in an orderly manner, (such as piles of mild steel
sheets or stacks of cement bags) it is possible to considerably simplify the selection of
a random sample of the required size.
o In systematic sampling an item is chosen at random from the lot and thereafter, the
items are selected regularly at predetermined intervals. It has been established that
this method of systematic sampling is quite good approximation to the simple random
sampling provided there is no deliberate attempt to manipulate the sequence of the
items in the lot in any desired manner while the lot is presented for inspection.
Cluster Sampling
o When the lot submitted for inspection consists of certain groups of clusters of items,
it may be advantageous and economical to select a few clusters of items and then
examine all the items in the selected clusters.
o For example, when the lot consists of items packed in cartons and it is either
impracticable or costly to repack the cartons opened for selecting sample items, then
only few cartons are selected at random without replacement in the first instance and
all the items in the selected cartons are inspected.

Industrial Engineering (2161907) 6. Inspection and Statistical Quality Control
Department of Mechanical Engineering Prepared by: Jainik Makwana Darshan Institute of Engineering & Technology, Rajkot Page 6.25
Two Stage Sampling
o When the lot submitted for inspection consists of larger number of packages each
consisting of a number of items, it may not be economical to select few packages and
inspect all the items in these packages (as in case of cluster sampling).
o In such cases, the sample is selected in two stages. In the first stage a desired number
of packages (primary units) are selected at random and in the second stage, the
required number of items are chosen at random from the selected primary units.
6.12.4 Symbols Used in Relation to Sampling Acceptance
o Following symbols and terms are used in connection with acceptance sampling:
N = number of pieces in a given lot (Lot size)
n = number of pieces in a sample (Sample size)
M = number of defective pieces in a given lot of size N.
m = number of defective pieces in a given sample of size n.
c = acceptance number, the maximum allowable number of defective pieces in a
sample of size n.
p = fraction defective. In a given submitted lot p = M/N in a given sample p = m/n.
p’ = true process average fraction defective of a product submitted for inspection.
p = average fraction defective in observed samples.
pa = a probability of acceptance.
pc = consumer's risk, the probability of accepting product of some stated quality. The
probability of rejecting product of some stated quality is referred to as producer’s
risk, (1 - PJ. P095, P050, p0 l5 etc.
= fraction defective having a probability of acceptance of 0.95, 0.50. 0.15 etc.
under any given acceptance criteria.
6.13 The Operating characteristics curve (OC curve) o The operating characteristic curve for an attribute sampling plan is a graph of fraction
defective in a lot against the probability of acceptance. For any fraction defective p’ in
a submitted lot, the OC curve shows the probability pa that such a lot will be accepted
by the sampling plan.
o In a single sampling plan three parameters are specified
N = lot size from which the samples are drawn = 1000
n = sample size = 5
C = acceptance number = 2
o It means that a random sample of 5 from a lot of 100, if the sample contains more
than 2 defectives, reject the lot otherwise accept the lot. By changing the parameters
N, n and C different sampling plans can be obtained. For different sampling plans the
OC curve will differ. To construct an OC curve, we should know the mathematical
probability of accepting lots with varying per cent defectives.

6. Inspection and Statistical Quality Control Industrial Engineering (2161907)
Prepared by: Jainik Makwana Department of Mechanical Engineering Page 6.26 Darshan Institute of Engineering & Technology, Rajkot
Figure 6.2 – OC curve
6.13.1 Producer’s Risk and Consumer’s Risk o There are always two parties to an acceptance procedure the party submitting the
product for acceptance and the party for whom the decision is made regarding
acceptance or rejection (i.e. producer and consumer. All lots greater than 2%
defectives have a probability of acceptance of zero. Actually, however, no sampling
plan exists that can discriminate perfectly, there always remains some risk that a good
lot will be rejected or that a bad lot will be accepted.
o Producer’s risk: Since, ideal sampling plan which will satisfy both the consumer
and producer is not possible, some compromise has to be made and they have
to tolerate certain risk If the quality is good still from sampling plan some lots
are rejected the producer has to suffer. The producer’s risk is the probability
of rejecting a good lot which otherwise would have been accepted. So the
producer should be protected against the rejection of relatively better
products. The producer can decrease his risk by producing products at a better
quality level than the specified AQL (explained latter) depending on other
economic considerations.
o Consumer’s risk: If the quality is bad still from the sampling plan some lots are
to be accepted the consumer will suffer. Consumer’s risk is the probability of
defective lots being accepted which otherwise would have been rejected.
Saying that Pq.io - 2.5% means the consumer does not want a worse quality
containing more than 2.5% defectives and he would at the most accept 10% of
lots containing 2.5% defectives.
6.13.2 Quality Indices for Acceptance Sampling Plans
1. Acceptable Quality Level (AQL)
o It represents the maximum proportion of defectives which the consumer finds
definitely acceptable. AQL can also be defined as the maximum per cent defectives

Industrial Engineering (2161907) 6. Inspection and Statistical Quality Control
Department of Mechanical Engineering Prepared by: Jainik Makwana Darshan Institute of Engineering & Technology, Rajkot Page 6.27
that for the purpose of sampling inspection can be considered satisfactory as a
process average. It is the fraction defective that can be tolerated without any
serious effect upon further processing or a customer relations.
2. Rejectable Quality Level (RQL)
o It is also called as Lot Tolerance Per cent Defective (LTPD). This is a definition of
unsatisfactory quality. It represents the proportion of defectives which the
consumer finds definitely unacceptable. As RQL is an unacceptable quality level,
the probability of acceptance for an RQL lot should be low. The probability of
accepting a lot a t RQL level represents consumer’s risk.
3. Indifference Quality Level (IQL)
o This is a quality level somewhere between the AQL and RQL. It is frequently
defined as the quality level having a probability of acceptance of 0.50 for a given
sampling plan.
4. Average Outgoing Quality (AOQ)
o It represents the average % defective in the outgoing products after inspection,
including all accepted and all rejected lots which have been 100% inspected and
defectives replaced by non-defectives.
AOQ = pa * p’
5. Average Outgoing Quality Limit o For any given n and c there is a maximum value of AOQ beyond which the average
fraction of defective p assed forward will not rise, no matter how bad the quality
of the lots when they arrive at inspection. Because, when incoming quality is
perfect, outgoing quality must likewise be perfect.
o However, when incoming quality is very bad, outgoing quality will also be perfect,
because the sampling plan will cause all lots to be rejected, which are subjected a
t 100% inspection and rectification.
o Thus at either extreme incoming quality very good or very bad the outgoing quality
will tend to be very good. Between these extremes is the p o in t a t which the
percent of defective s in the outgoing product will reach its maximum. This point
is known as the average outgoing limit (AOQL).
o Therefore, AOQL is the maximum possible value of the average percentage
defectives in outgoing product after inspection and rectification.
6.13.3 Characteristics of OC Curve
1. The Operating Characteristic (OC) Curve of an Acceptance Sampling plan shows the
ability of the plan to distinguish between good lots and b ad lots.
2. Sampling acceptance plans with same percent samples gives very different quality
protection. For example, the curves (Figure 6.3) shows that lots which are 4% defective
will be accepted 81% of the time using a 10% sample from a lot of 100, 42% of the
time using a 10% sample from a lot of 200, and less than 2% of the time b y a 10%
sample from a lot of 1000, assuming an acceptance number of zero in all cases.

6. Inspection and Statistical Quality Control Industrial Engineering (2161907)
Prepared by: Jainik Makwana Department of Mechanical Engineering Page 6.28 Darshan Institute of Engineering & Technology, Rajkot
o Obviously a producer making a product 4% defective would have a strong motive
for trying to have his product inspected in lots of 50 rather than in lots of 100.
3. Fixed sample size tends towards constant quality protection. It is the absolute size of
the sample rather than its relative size that determines the quality protection given
by an acceptance sampling plan. Figure 6.3, illustrates this point.
Figure 6.3 – Comparison of OC curves for different sample plans
4. The OC curves of plans with acceptance numbers greater than zero are superior to
those of comparable plans with acceptance number of zero.
o With fixed value of N, and c<n, larger the value of n, the better is the ability of the
plan to discriminate between good and bad lots. Figure 6.4, illustrates this point.
5. The larger the sample size and acceptance number, the steeper the slope of the OC
curve.

Industrial Engineering (2161907) 6. Inspection and Statistical Quality Control
Department of Mechanical Engineering Prepared by: Jainik Makwana Darshan Institute of Engineering & Technology, Rajkot Page 6.29
Figure 6.4 Comparison of OC curves for different percentage defectives
6.14 Sampling Plans o Sampling plans may be grouped into three categories.
a. Single sampling plan
b. Double sampling plan
c. Multiple sampling plan
Single Sampling Plan
o When a decision on acceptance or rejection of the lot is made on the basis of only one
sample, the acceptance plan is known as a single sampling plan. In a single sampling
plan three numbers are specified.
N= lot size, from which the sample is drawn.
n = sample size.
c = acceptance number.
o If the sampling plan is
N = 50
n = 5
c = 1
o It means, take a sample of 5 items from a lot of 50, if the sample contains more than
1 defective reject the lot, and otherwise accept the lot.

6. Inspection and Statistical Quality Control Industrial Engineering (2161907)
Prepared by: Jainik Makwana Department of Mechanical Engineering Page 6.30 Darshan Institute of Engineering & Technology, Rajkot
Double sampling plan
o In double sampling plan the decision on acceptance or rejection of the lot is based on
two samples. A lot may be accepted at once if the first sample is good enough or
rejected a t once if the first sample is bad enough. If the first sample is neither good
enough nor bad enough, the decision is based on the evidence of first and second
sample combined.
o Parameters: n1 = of pieces in the first sample.
c1= acceptance number for the first sample,
i.e. the maximum number of defectives that will permit the acceptance of the lot on
the basis of the first sample.
n2 = number of piece in second sample
n1 + n2 = number of pieces when both samples are combined
c2 = acceptance number when both samples are combined
i.e. maximum number of defectives that will permit the acceptance number of the lot
on the basis of the first and second sample are combined.
o The following example illustrates the use of a double sampling plan. Let,
N = 500, n1 = 35
c1= 1, n2 = 50 and c2 = 4
o This may be interpreted as follows:
1. Take a first sample of 35 items from a lot of 500 and inspect. •
2. Accept the lot on the basis of first sample, if it contains 0 or 1 defective
Industrial Engineering (2161907) 6. Inspection and Statistical Quality Control
Department of Mechanical Engineering Prepared by: Jainik Makwana Darshan Institute of Engineering & Technology, Rajkot Page 6.31
3. Reject the lot on the basis of first sample if it contains more than 4 defectives.
4. Take a second sample of 50 items if the first sample contains 2, 3 or 4 defectives.
5. Accept the lot on the basis of first and second sample combined, if the combined
sample of 85 items contains 4 or less defectives.
6. Reject the lot on the basis of combined sample if the combined sample contains
more than 4 defectives.
o The lot thus may be accepted in the following ways :
a) 0 or 1 defective in the first sample (without taking second sample).
b) 2 defectives in the first sample followed by 0,1 or 2 defectives in the second
sample.
c) 3 defectives in the first sample followed by 0 or 1 defective in the second sample.
d) 4 defectives in the first sample followed by 0 defective in the second sample.
o The probability of accepting the lot is the sum of the probabilities of these different
ways in which it may be accepted.
Multiple Sampling Plan
o The phrase multiple sampling is generally used when three or more samples of stated
size are permitted and when the decision on acceptance or rejection must be reached
after a stated number of samples.
o The phrase sequential sampling is generally used when a decision is possible after each
item has been inspected and when there is no specified limit on the total number of
units to be inspected: However, some writers use the two phrases interchangeably.
o A multiple sampling procedure can be represented on a table such as the following:
Table 6.2 – multiple sampling plan
Sample Samples size
Combined samples
Size Acceptance
number
Rejection
number
1 n1 n1 c1 r1
2 n2 n1 + n2 c2 r2
3 n3 n1 + n2 + n3 c3 r3
4 n4 n1 + n2 + n3 + n4 c4 r4
5 n5 n1 + n2 + n3 + n4 + n5 c5 r5
o A first sample of n\ is drawn, the lot is accepted if there are no more than c1 defectives,
and the lot is rejected if there are more than r1 defectives. Otherwise a second sample
of n2 is drawn the lot is accepted if there are no more than c2 defectives in the
combined sample of n1 + n2 , The lot is rejected if there are more than r2 defectives in
the combined sample of n1 + n2. The procedure is continue in accordance with the
above table. If by the end of the fourth sample, the lot is neither accepted nor
rejected, a sample n5 is drawn. The lot is accepted if the number of defectives in the
combined sample of n1 + n2 + n3 +n4 + n5 does not exceed c5. Otherwise the lot is
rejected. Note that c1 < c2 < ... < c5 and ci, < ri, for all i.

6. Inspection and Statistical Quality Control Industrial Engineering (2161907)
Prepared by: Jainik Makwana Department of Mechanical Engineering Page 6.32 Darshan Institute of Engineering & Technology, Rajkot
o A multiple sampling plan will generally involve less total inspection, than the
corresponding single or double sampling plan guaranteeing the same protection. But
they usually require higher administrative costs, and higher calibre inspection
personnel may be necessary to guarantee proper use of the plans.
Table 6.3 – Comparison of different sampling plan
Single
sampling plan
Double sampling
plan
Multiple sampling
plan
Average number of
pieces inspected per lot. Largest
In between single
plan and multiple
plan
Lowest
Cost of administration Lowest
In between single
plan and multiple
plan
Largest
Information available
regarding prevailing
quality level.
Largest
In between single
plan and multiple
plan
Less
Acceptability to
producers. Less Most acceptable
Decision is
continued for a
long term
6.15 Control charts o A control chart is an important aid or statistical device used for the study and control
of the repetitive processes. Control chart was developed by Dr. W.A. Shewhart and it
is based upon the fact that variability does exist in all the repetitive processes.
o There exist two kinds of variations:
1. Variation due to chance causes.
2. Variation due to assignable cause
6.15.1 Variations due to assignable causes
o These variations possess greater magnitude as compared to those due to chance
causes and can be easily traced or detected. The power of the Shewhart control chart
lies in its ability to separate out these assignable causes of quality variation (say in
length, thickness, weight or diameter or a component). The variations due to
assignable causes may be because of the following factors:
1. Differences among machines.
2. Differences among workers.
3. Differences among materials.
4. Differences in each of these factors over time.
5. Differences in their relationship to one another.
o These variations may also be caused due to change in working conditions, mistake on
the part of the operator, lack of quality mindness etc.

Industrial Engineering (2161907) 6. Inspection and Statistical Quality Control
Department of Mechanical Engineering Prepared by: Jainik Makwana Darshan Institute of Engineering & Technology, Rajkot Page 6.33
6.15.2 Chance Variations (Random Variations)
o Variations due to chance causes are inevitable in any process or product. They are
difficult to trace and difficult to control even under best conditions of production.
Since these variations may be due to some inherent characteristic of the process or
machine which functions at random.
o For example, a little play between nut and screw at random may lead to back-lash
error and may cause a change in dimension of a machined part. The chance factors
effect each component in a separate manner.
o It has been established that if the variations are due to chance factors alone, the
observations will follow a ‘normal curve’. Knowledge of the behaviour of chance
variation is the foundation on which control chart analysis rests.
o If after a random selection, observations are made under the same conditions and if
the distribution of observation follows a standard curve (normal curve), then it is
assumed that the variations are due to chance causes and no assignable causes of
error are present. The conditions which produced these variations are accordingly said
to be “under control’’.
o On the other hand, if the variations in the data do not conform to a pattern that might
reasonably be produced by chance causes, then it is concluded that one or more
assignable causes are at work. In this case conditions producing the variations are said
to be “Out of control’.
6.16 Definition of Control Chart o A control chart is a graphical representation of the collected information. The
information may pertain to measured quality characteristics or judged quality
characteristics of samples. It detects the variation in processing and warns if there is
any departure from the specified tolerance limits.
o In other words, control chart is a device which specifies the state of statistical control,
second a device for attaining statistical control, and third, a device to judge whether
statistical control has been attained.
o There are many types of control charts designed for different control situations, each
with its own advantages and disadvantages and with its own field of application.
However, all have a few characteristics in common and are interpreted in much the
same manner. The control charts which are most commonly used are:
1. Control charts for measurable quality characteristics (control charts for variables).
This includes X – bar and R - bar charts and charts for X – bar and σ – bar.
2. Control charts for fraction defective (P-chart).
3. Control chart for number of defects per unit (C-chart).
o The control charts for variables are useful for controlling fully automatic processes,
where the operator is probably responsible for three or more machines.
o Control charts for fraction defective and defects per unit are attribute control charts.
A fraction defective control chart discloses erratic fluctuations in the quality of

6. Inspection and Statistical Quality Control Industrial Engineering (2161907)
Prepared by: Jainik Makwana Department of Mechanical Engineering Page 6.34 Darshan Institute of Engineering & Technology, Rajkot
inspection which may result in improvement in inspection practice and inspection
standards.
6.17 Control Charts for Variables o Control charts based upon measurements of quality characteristics are called as
control charts for variables. Control charts for variables are often found to be a more
economical means of controlling quality than control charts based on attributes. The
variable control charts that are most commonly used are average or X – bar charts,
range or R- bar charts and σ - bar chart - or standard deviation charts.
6.17.1 Some Possible Objectives of the Control Charts
o Control charts are based on statistical techniques. In general, control charts for
variables, either X and R or X and a charts are used for some or all of the following
purposes.
1. X and R or σ and X - charts are used in combination for the control process.
o X-chart shows the centring of the process, i.e. it shows the variation in the
averages of samples. It is the most commonly used variables chart.
o R - Chart shows the uniformity or consistency of the process i.e. it shows the
"variations in the ranges of samples. It is a chart for measure of spread,
o σ - Chart shows the variation of the process.
2. The control charts are used to determine whether a given process can meet the
existing specifications without a fundamental change in the production process. In
other words they tell whether the process is in control and if so at what dispersion.
3. To secure information to be used in establishing or changing production
procedures. Such changes may be either elimination of assignable causes of
variation that may be called for whenever the control chart makes it clear that
specifications cannot be met with present methods.
o For example, where both upper and lower values are specified for a quality
characteristic, as in the case of dimensional tolerances. If the basic variability
of the process is so great that it is impossible to make all the products within
the specification limits, and when the specification cannot be changed then
the alternatives will be (a) To make a fundamental change in the production
process that will reduce the basic variability or (b) To suffer and sort out the
good (no defective) products from the bad (defective products).
4. To secure information when it is necessary to widen the tolerances. Sometimes
the control chart shows so much basic variability that some product is sure to be
made outside the tolerances, a review of the situation may show that the
tolerances are tighter than necessary for the functioning of the product.
Therefore, the appropriate action will be to change the specifications to widen the
tolerances for the sake of economy.
5. To secure information to be used in establishing or changing inspection procedure
or acceptance procedures or both.

Industrial Engineering (2161907) 6. Inspection and Statistical Quality Control
Department of Mechanical Engineering Prepared by: Jainik Makwana Darshan Institute of Engineering & Technology, Rajkot Page 6.35
6. To provide a basis for current decisions on acceptance or rejection of
manufactured or purchased product. It is possible to reduce inspection costs by
using the control charts for variables for acceptance.
7. To provide a basis for current decisions during production as to when to hunt for
causes of variation and take action so as to correct them, and when to leave a
process alone
8. To familiarize personnel with the use of the control charts.
6.17.2 Practical Limitations of the Control Chart for Variables
o X and R charts are powerful devices for the diagnosis of quality problems and means
for routine detection of sources of trouble. But their use is limited to only a small
fraction of quality characteristics, specified for manufactured product. The limitations
of X and R charts are as discussed below.
1. X and R charts can be used for quality characteristics that can be measured and
expressed in numbers. However, many quality characteristics can be observed only as
attributes, i.e., by classifying each item inspected into one of the two classes, either
conforming or non-conforming to the specifications. For example, while inspecting the
castings in addition to conformity to dimensions, it may be necessary to inspect other
quality characteristics such as blow holes, cracks, swells, undercuts, finish, etc. each
of which singly or in combination may make the casting defective. This type of data
can be collected only on the basis of number of products that conforms to the
specifications and the number of products failing to conform to the specifications.
2. Furthermore, X and R charts can be used only for one measurable characteristic at a
time. For example, a firm may be producing a part or an assembly involving 50
different dimensions (or quality characteristics). For each dimension a separate X and
R chart is necessary, however, it will be impracticable and uneconomical to have 50
such charts and hence the manufacturer may prefer to analyse the results in terms of
defective or non-defective items.
3. For reason of economy even in some cases, where the direct measurement of variable
quality characteristics is possible, it is common practice to classify them as good or
bad on the basis of inspection by Go-No-Go gauges. In such cases X and R charts may
be plotted for the most important and troublesome quality characteristic.
6.18 Control charts for attributes o No dimension should be chosen for X and R chart unless there is an opportunity to
save cost from reduction of spoilage, rework etc. The quality improvement resulted
from the X and R chart together with the opportunity to save cost should compensate
the cost of taking the measurement, keeping the charts and analyzing them.
o As an alternative to X and R charts, and as a substitute when characteristic is measured
only by attribute a control chart based on fraction defective P is used (P-chart).
o Fraction defective P’, may be defined as the ratio of the number of defective articles
found in any inspection to the total number of articles actually inspected. Fraction
defective is always expressed as a decimal fraction.

6. Inspection and Statistical Quality Control Industrial Engineering (2161907)
Prepared by: Jainik Makwana Department of Mechanical Engineering Page 6.36 Darshan Institute of Engineering & Technology, Rajkot
6.18.1 Comparison of X and R chart with P chart:
1. P chart is an attribute control chart, i.e. for quality characteristic that can be classified
as either conforming to the specifications. For example, dimensions checked by Go -
No Go gauges. Whereas, X and R chart is used for quality characteristic that can be
measured and expressed in numbers.
2. The cost of collecting the data for P chart is less than the cost of collecting the data for
X and R chart. For example 10 shafts might be inspected with ‘go - no go” gauge in the
time required to measure a single shaft diameter with a micrometers. Secondly, P
chart uses data already collected for other purpose.
3. The cost of computing and charting may also be less since P chart can be applied to
any number of quality characteristics observed on one article. But separate X and R
chart is required for each measured quality characteristic, which may be impracticable
and uneconomical.
4. P-chart is best suited in cases where inspection is carried out with a view to classifying
an article as accepted or rejected. X and R chart are best suited for critical dimensions.
5. P-chart though discloses the presence of assignable causes of variations, it is not as
sensitive as X and R chart. For actual diagnosis of causes of troubles, X and R charts
are best, still P chart can be used effectively in the improvement of quality.
6. The sample size is generally larger for P chart than for X and R chart. The variations in
the sample size influences the control limits much more in X and R charts than in P
chart
7. The control chart for fractions defective provides management with a useful record of
quality history.
6.18.2 Purpose of the p chart
o Because of the lower inspection and maintenance costs of p charts, they usually have
a greater area of economical applications than do the control charts for variables. A
control chart for fraction defective may have any one or all of the following purposes:
1. To discover the average proportion of defective articles submitted for inspection, over
a period of time.
2. To bring to the attention of the management, any changes in average quality level
3. To discover, identify and correct causes of bad quality.
4. To discover, identify and correct the erratic causes of quality improvement.
5. To suggest where it is necessary to use X and R charts to diagnose quality problems.
6. In a sampling inspection of large lots of purchased articles.
Table 6.4 – Comparison of variable and attribute charts
Variable chart Attribute chart
Example: X, R, a charts. P, np, C, u charts.
Type of data required:
Variables data (Measured values of
characteristics.)
Attribute data (using Go-No-Go gauges).
Field of application: Control of proportion of defectives or

Industrial Engineering (2161907) 6. Inspection and Statistical Quality Control
Department of Mechanical Engineering Prepared by: Jainik Makwana Darshan Institute of Engineering & Technology, Rajkot Page 6.37
Control of individual characteristics. number of defects or number of defects per
unit
Advantages:
a. Provides maximum utilization of
information available from data.
b. Provides details information on
process average and variation for
control of individual dimensions.
a. Data required are often already
available from inspection records.
b. Easily understood by all persons.
c. Since, it is more simple as compared
to X and R chart.
d. It provides overall picture of quality
history.
Disadvantages:
a. They are not easily understood
unless training is provided.
b. Can cause confusion between
control limits and specification
limits.
c. Cannot be used with go-no-go type
gauge inspection.
a. They do not provide detailed
information for control of individual
characteristic.
b. They do not recognize different
degree of defectiveness. (Weightage
of defects).