location aware asset tagging - mit computer...
TRANSCRIPT

Location Aware Asset Tagging
Tina Hsieh 6.UAP Thesis
Project Advisor: Seth Teller
May 16, 2005

Abstract The MIT Property Office is responsible for managing all movable equipment on the MIT campus. Current methods of managing assets have proven to be somewhat inefficient due to the email exchange between the Property Office and the people responsible for the equipment. Initially we believed that including the usage of a system that provides geographic coordinates would aid in the process of asset tracking, but we discovered that the people interaction was the source of problems in latency delays. The property administrators spend large amounts of time looking for people who own the unaccounted equipment, in efforts to account for the equipment value. We decided that in order to reduce the work for the property administrator, we would incorporate a set of tools that automate menial tasks and prompt for better and quicker responses from the responsible people.

Table of Contents
Introduction 1
Background 1
MIT GIS Web Services 4
Cricket Location System 5
Research Approach 6
Report Generator 6
People Database 7
Interactive Map Tool 7
User Perspectives 10
Future Work and Conclusions 12
Building Model Generation Pipeline 13
Cricket applications 14
Conclusions 14
Acknowledgements 14
Appendix 16
Software Implementation of the Interactive Map Tool 16
Bugs 17
References 19

1
Introduction In order to comply with its charter and meet its educational objectives, MIT must hold in public trust any property in which it has acquired ownership. The MIT Property Office is responsible for accounting and asset management of all moveable equipment. Based on current methods of doing so, however, asset tracking is a manual-labor intensive task that requires up to a year to account for all equipment on the MIT campus. A further examination into the current difficulties in asset tracking and management gives inspiration to creating a set of tools that interact with the SumProp database of assets, the property administrators who maintain the equipment, and the responsible students and professors who use the equipment.
Background It is now exceptionally rare to find equipment without a barcode. Barcodes were introduced to identify objects quickly, so that a shipment of goods could be efficiently identified. However, barcodes are only useful when a barcode reader is held close enough to scan it, which thereby identifies the barcode of the object. This identification process cannot occur continuously; barcodes can only be scanned within a moment in time. This means that managing assets and resources is reduced to scanning barcodes in a moment in time. True asset management, however, would maintain items in the inventory over a length of time without delays or interruptions. When an item of importance disappears, the asset management system immediately signals an alert. When an item of importance requires repair, the system notifies the appropriate personnel. True asset management is a continuous maintenance process that presents relevant information to the owners of assets at the proper time. Currently, the MIT Property Office is responsible for the accounting and asset management of all items of moveable equipment that belongs to MIT. During an inventory process, a property administrator travels within a campus building in search of listed items and scans its identifying barcode into a scanner, where

2
updated information on the items is temporarily stored. After scanning, the scanner gun is placed into a holster connected to a computer, so that the updated information of scanned items is uploaded to modify the properties database. Completing an inventory process on all campus buildings, from room to room, takes a little over a year. Within the Stata Center alone, the inventory work requires 11 man-days. The existing asset tracking technology used by the MIT Property Office is manual-labor intensive. A typical scanning routine includes traversing through the entire building and waving a scanner in front of all visible items of perceived importance. After scanning items, the property administrator uses SumProp, a property reporting system, to upload modifications of location information onto the MITVMA mainframe that contains accounting databases.1 SumProp generates a list of these unaccounted items that should have been scanned but were not found, called a PRN file. The property administrator takes this list of items and conducts further investigation on its whereabouts. Usually this involves inquiring the responsible people and the principal investigators who, by record, take responsibility for the items (See Figure 1 below).
Figure 1. Asset management by the MIT Property Office.
Generally, the cycle from modifying the accounting database using SumProp to generating lists to contacting people could take up to months or even semesters.
3
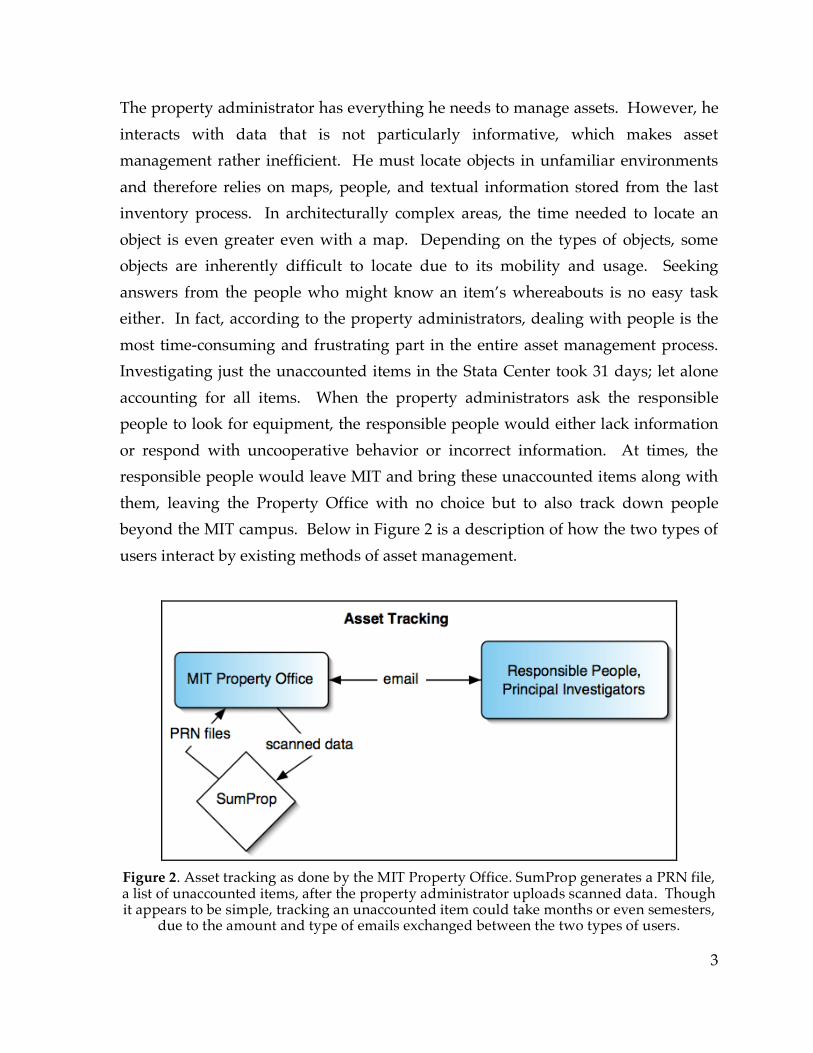
The property administrator has everything he needs to manage assets. However, he interacts with data that is not particularly informative, which makes asset management rather inefficient. He must locate objects in unfamiliar environments and therefore relies on maps, people, and textual information stored from the last inventory process. In architecturally complex areas, the time needed to locate an object is even greater even with a map. Depending on the types of objects, some objects are inherently difficult to locate due to its mobility and usage. Seeking answers from the people who might know an item’s whereabouts is no easy task either. In fact, according to the property administrators, dealing with people is the most time-consuming and frustrating part in the entire asset management process. Investigating just the unaccounted items in the Stata Center took 31 days; let alone accounting for all items. When the property administrators ask the responsible people to look for equipment, the responsible people would either lack information or respond with uncooperative behavior or incorrect information. At times, the responsible people would leave MIT and bring these unaccounted items along with them, leaving the Property Office with no choice but to also track down people beyond the MIT campus. Below in Figure 2 is a description of how the two types of users interact by existing methods of asset management.
Figure 2. Asset tracking as done by the MIT Property Office. SumProp generates a PRN file, a list of unaccounted items, after the property administrator uploads scanned data. Though it appears to be simple, tracking an unaccounted item could take months or even semesters,
due to the amount and type of emails exchanged between the two types of users.

4
The dependence on people for information is the main difficulty in tracking assets. From the user standpoint of the property administrator, the responsible people are often not providing useful information. From the user standpoint of the responsible people, either they do not want to bother with looking for unaccounted government property or they simply do not know the location of these items. Our approach, as will be later discussed, is to incorporate a set of tools and services, and create additional ones to improve efficiency and productivity in tracking assets. The property administrator would be able to deal minimally with unnecessary emails and human errors. The tools we use include the MIT Geographic Information Systems web services and the Cricket location system. MIT GIS Web Services The Geographic Information Systems (GIS) web services, provided by the MIT Department of Facilities, offer spatial information for map related applications. Applications can send a HTTP request to which the GIS web services can respond with JPG, XML (eXtensible Markup Language) or SVG (Scalable Vector Graphics) data description of spatial information of the MIT campus. Currently, the MIT campus map uses the GIS web services to display JPG images of selected areas or buildings at user-defined zoom levels. These images contain graphical representation of buildings, landscape, and roads, which could be overlaid with the floorplan of a specified floor. The GIS Web Services is a framework comprised of three basic mapping-related services and a test service. The Mapping Service when queried with a “GetMap” request returns a JPG map image. The Spatial Selection Service allows an application to send a “GetSelection” request, to which the service replies with a XML description of the submitted selection set. The SVG Service allows an application to send a “GetLayerSVG” request to which it replies with selected features in SVG 1.0 format. The SVG contains path coordinates of features from a single specified layer, from a selection of layers including Buildings, Building Walkways, Other Buildings, Landscape, Parking, Roads, and River. The Map Server

5
Test Service when queried with a “Up”, returns confirmation that Map Service is running. SVG is a language for describing two-dimensional graphics in XML. SVG allows for three types of graphic objects: vector graphic shapes (e.g., paths consisting of straight lines and curves), images and text. The feature set includes nested transformations, clipping paths, alpha masks, filter effects, template objects and extensibility. SVG drawings can be dynamic and interactive. The Document Object Model (DOM) for SVG, which includes the full XML DOM, allows for straightforward and efficient vector graphics animation via scripting. Because of its compatibility and leveraging of other Web standards, features like scripting can be done on SVG elements and other XML elements from different namespaces simultaneously within the same Web page.2 Cricket Location System Cricket is an indoor location system that provides fine-grained location information to applications running on mobile listeners.3 Cricket uses a combination of RF and ultrasound technologies to provide location information, such as position coordinates and orientation. Beacons are mounted on walls and ceilings and transmit RF information concurrently with an ultrasonic pulse. Listeners attached to mobile devices listen for a RF signal and a corresponding ultrasonic pulse from a set of the nearby beacons. Listeners can then deduce a distance estimate to a particular beacon by taking advantage of the difference in propagation speeds between RF (speed of light) and ultrasound (speed of sound). A listener will listen for three or more beacons and use various algorithms to calculate its position coordinates and orientation. Cricket can operate in an active mobile architecture, where fixed listeners determine the position of a moving object. Cricket can also operate in a passive mobile architecture, where fixed beacons advertise to a mobile listener. Thus, in an active mobile architecture, the fixed listeners can actively track the movements of a mobile object and communicate this information to a remote terminal, thereby allowing a

6
person to track an object remotely. On the other hand, Cricket operating in a passive mobile architecture permits the mobile object to determine its own position based on its communication with fixed beacons.
Research Approach We believe improvements can be made to expedite the process of communicating with people and acquiring information on the whereabouts of an unaccounted item. After a day’s worth of scanning, the property administrator uploads scanned information into the SumProp database and generates a list of unaccounted items. This involves a lot of manual tasks for the property administrator. We begin by observing that this process can be improved by having a user interface for the property administrator in conjunction with the SumProp interface. Report Generator After the property administrator uploads scanned data to SumProp, he obtains a list of unaccounted items in a PRN file. The Report Generator user interface is a Java application that takes in PRN files, or lists of unaccounted items from SumProp, and sends email requests to the responsible people asking them to look for these unaccounted items. From the user standpoint of the property administrator, all he would have to do is connect a scanning gun, generate a PRN file using SumProp, open the Report Generator application, and the responsible parties will be notified by email. The Report Generator sends emails to responsible parties by looking up their email addresses on a mySQL database, discussed later, and places a list of these items in XML format in the database to be accessed by the Interactive Map Tool. The emails from the Report Generator would be identical to the emails the property administrator used to send manually. These emails ask the responsible people to look for items based on a name description (e.g. “Dell Latitude CPIA laptop”), a date of when the item was bought (e.g. ”04/00”), a price at which it was bought (e.g. “$4,721”), and a serial number (e.g. “WV4YY”). They ask the responsible people to report the current MIT address (a building number and room number) and the MIT barcode tag number affixed to the item in question.

7
Since the mySQL database contains confidential email information, the Report Generator creates a randomly generated 6-digit number that is included in the email. The user will have to enter this confirmation number into the Interactive Map Tool in order to be able to use it to reply to the Property Office. People Database The People Database is a mySQL database that looks up the email address of a responsible person, and returns the String representation to the Report Generator. Every time the property administrator opens the Report Generator application, the application accesses the People Database to look up the email address of the responsible person to send. The database also serves as storage for the XML lists generated by the Report Generator, to be used by the Map Tool. The database maintains a “Sent Emails” table that notes whether people have received previous emails about the same items. For example, when looking up John Doe on the issue of unaccounted item X, the table notes that [email protected] has been sent 2 previous emails about item X. Thus, the Report Generator sends John Doe another email that appends the subject title with “Third Notice”. After John Doe uses the Map Tool discussed below, a request will be sent to the database for his entry to be deleted. This serves to automate the follow-up reminders that previously the property administrator had to do on his own. After the property administrator has verified the location of an unaccounted item X, he will be able to update the information on item X using SumProp. Subsequent PRN files (unaccounted items lists) will not include item X, and the Report Generator will no longer send emails to the people responsible for item X. Interactive Map Tool When an item is determined becomes unaccounted, the email interactions (or the lack thereof) between the MIT Property Office and the responsible people are inconvenient means for locating an item. Emails rarely contain all the required information, the MIT address and the MIT barcode tag number. In the unusual case

8
that emails contain all the necessary information, the property administrator still has to return to the site of the government-sponsored items and ascertain their locations and barcode numbers. We observe that an Interactive Map Tool would be useful for both the responsible person user and the property administrator user. The Interactive Map Tool is a Java archive accessible online, and it displays an interactive view of a floorplan in the building where the unaccounted item was last seen. Upon opening of the Map Tool, the user is asked to enter the confirmation number found in the email he received from the Property Office. This serves to make the database information less accessible unless the user has permission. After verifying the MIT barcode tag number and giving a description of the location of an unaccounted item, the responsible person user can send an email containing all such information back to the Property Office. Since this tool verifies the item tag number automatically, the user is more likely to be correct in his description of the item’s location. This eliminates unnecessary email exchange between the property administrator and the responsible person. Figure 3 is a screenshot of what the responsible user sees when he verifies the location of an unaccounted item.

9
Figure 3. A screenshot of the Interactive Map Tool when verifying the MIT barcode tag number. The user is also allowed to draw on the map indicating the location of an item.
The responsible person user can depict the location of an item by drawing, circling, and writing on a map, because we believe that a map with drawing and text is more descriptive of a location than a simple textual description. The viewable portion of this drawn map is captured and sent as a JPG attachment in an email containing user comments, which is sent to the property administrator. If it is necessary for the property administrator to return to the physical site of the item, we believe that picture and text together are sufficient for the property administrator to locate the item in a shorter amount of time than before.

10
Figure 4. Contents of an email sent by the Interactive Map Tool to the Property Office. The
above text and picture are included in the email for each item that contains modifications made by the responsible person user.
Once the property administrator has either accepted the credibility of the email response or checked the location of an unaccounted item, he still has to use SumProp to modify location information in the assets database. We decided that it would be safer for the property administrator to modify database information himself. User Perspectives These tools interact with each other to substitute the cumbersome email exchange between the property administrator and the responsible people for unaccounted items. Below in Figure 4 is an illustration of how our tools play a role in asset management.

11
Figure 4. A data flow chart of how the interaction changes when using our tools, the Report Generator, the database,
and the Interactive Map Tool. The property administrator interacts with the Report Generator and
SumProp. The responsible people/PI only interacts with the Interactive Map Tool.
From one end of the picture, the property administrator uses the Report Generator, a Java application, to send emails and follow-up reminders to people responsible for the unaccounted items. On the other end of the picture, the people use the Interactive Map Tool, a Java archive accessible online, to reply back to the property administrator. The property administrator does not have to directly prompt the students to look for items, nor does he have to remember to whom does he have to send reminders. Additionally, the responsible people, when willing to perform the task, will give better descriptions of the location of items, reducing the amount of unnecessary emails arriving at the inbox of the property administrator. Since both types of users are not directly interacting with each other, and since menial tasks are performed automatically (follow-up emails, barcode tag number verification), we believe this

12
enhances the user experience for both sides, increasing throughput in asset management. As seen in Figure 1 of the flow in asset tracking, there is a cycle for every unaccounted item that goes unanswered by students. However, using our tools, these cycles hopefully no longer take months. Instead, the tools are designed to prompt accurate descriptive emails from the responsible people in order to reduce the amount of work for the property administrator. Automatic Scanning Another time-consuming aspect of asset management is the scanning process. In beginning the asset tracking process (Figure 1), the property administrator has to scan the barcodes on every item of perceived value. However, the property administrator may not have prior knowledge of equipment that may be stored in obscure hidden areas. This increases the likelihood that an item will become unaccounted, and the property administrator would have to later initiate an email exchange with the responsible people. We observe that the Cricket location system can be useful in tracking assets. Instead of using merely a scanning gun, the property administrator can use a Cricket listener attached to a scanning gun. In an environment where Cricket beacons are deployed building-wide, the Cricket listener can determine its coordinates within the building. Thus, the Cricket listener/scanning gun would know exactly where it was in the building. A scanning gun that knows where it is, provided that it can access the assets database wirelessly, may be used to update location information of items in real-time. This, however, remains for future work.
Future Work and Conclusions
At the moment the Interactive Map Tool contains some bugs that interfere with the user experience, which are discussed in the Appendix. In the near future when the space ID tabular database becomes available from the MIT GIS web services, this can be integrated with the Interactive Map Tool so that a rendered map will show a

13
floorplan of a specified floor within a building. This information is also useful in rendering a graphical representation of an item within the SVG map, whereby clicking on this representation will present pop-up information on an item to the user. SVG allows for links, which can aid in this user experience. Additionally, the drawing tools in the Map Tool are meager. A Brush tool or similar drawing tool can allow the user to draw arrows and mark on the map more freely. Building Model Generation Pipeline The Building Model Generation (BMG) project devotes research to a system that is capable of automatic extraction of a 3D model of the MIT campus from a set of 2D floorplans maintained by the MIT Department of Facilities.4 The BMG pipeline provides a visualization of building floorplans, which can lead to a map routing service. The time required to scan a building’s worth of items is determined by the route and pace of scanning. Likely the property administrator doing the scanning should already be familiar with the building, and thus would know what to look for in each room and how to go from room to room. This process can be quicker if the property administrator knew where to go in advance, by virtue of a carefully mapped route that takes the least time to traverse. This can be accomplished in utilizing BMG. A 3D visualization of the MIT campus is also useful in providing a graphical context for location tracking services. When tracking items, it is useful to know where an item is located in its physical context, as opposed to knowing an item’s position coordinates. For example, rather than looking at a table of items and its space ID, we would much prefer to look at a 3D model of MIT that consists of black and white floorplan outlines drawn on a colored building background, and a red dot in a room on the floorplan to indicate where a tracked item is located. A building populated with many red dots would mean that many of the items being tracked are located in this specific building. This could also mean that this building may require more

14
security than usual, or that more property administrators are needed to manage and maintain the assets located in this building. Cricket applications Tagging is useful in keeping track of movable items in continuous time. Despite the fact that the existing framework for asset tracking does not benefit greatly from continuously tracking items, tagging is potentially useful in the following scenario. The property administrator has a Cricket listener attached to his scanner gun. With the help of a location system like Cricket, barcode tags can become beacon-like tags that broadcast; an item could automatically report its presence to the property administrator when he shows up. This leads to the potential of updating the SumProp database in real-time. By updating the SumProp database in real-time, there is the possibility for the property administrator to be able to ask responsible people right there during the scanning process where unaccounted items might be. This could prevent an initiation of the email exchange. Conclusions Initially we believed that Cricket would help greatly asset tracking, but the greater problem was rooted in the fact that people often don’t respond the way you want them to. The property administrators spend large amounts of time looking for people who own the unaccounted equipment, in efforts to account for the equipment value. With the addition of the Report Generator, Database, and the Interactive Map Tool, we believe asset management can be improved in a variety of ways. The tools could even support other user experiences unrelated to asset tracking.
Acknowledgements I would like to thank Seth Teller, my project advisor, for all his motivating ideas and driving energy in helping me think and work. Also, I would like to thank Grayson

15
Giovine for working with me, particularly for his work on the Report Generator and the People Database.

16
Appendix Software Implementation of the Interactive Map Tool The Interactive Map Tool uses the Batik toolkit for Java 1.65 to render a SVG formatted map of the MIT campus. The toolkit includes a Xerces XML parser that renders SVG files for viewing and manipulating. When a call is made to setURI(), the SVG file begins the rendering process. The Xerces parser is also used to parse the XML data obtained from the GIS “GetSelection” service to acquire the bounding box coordinates for the SVG map to be rendered. The Batik toolkit includes a set of Core Modules and Low Level Modules that make up the bulk of the Map Tool Java archive. When the user draws on the map using the “Box” or “Circle” tool, there is a Java Graphics2D object drawn based on MouseEvents while the user is creating the Box or Circle. When the user releases the mouse button, a SVG Element is created and inserted into the DOM tree of the SVG map. When the user selects items on the list box on the right, the SVG map is repainted to reflect these changes. However, the repainting is a little delayed which can be improved by finding the proper bounding boxes to repaint. The user can then send an email to the property administrator containing all the modifications he has made to the locations of items. When he clicks “Save” to modify information of an item, the viewable portion of the SVG map is saved as a JPG. The picture is created by the JPEGTranscoder, included in the Batik toolkit, after sending the DOM tree of the SVG map to the JPEGTranscoder,. However somewhere along this process there is a bug, which is discussed later. The email is composed using the JavaMail API. The email is a multipart message, where text is one part and attached files are in separate parts. This email is sent using the outgoing.mit.edu server.

17
The MIT GIS web services offer a “GetLayerSVG” that returns specified features of the MIT campus in SVG format. The SVG for the Buildings, Building Walkways, Other Buildings, Landscape, Parking, Roads, and River are acquired with a HTTP query and written to a file, “tempsvg”, which is the resulting SVG map. The Building features are described as <path> elements with id names; additional text features are added to the SVG map file based on these id names. (The other features are also <path> elements, but without id names.) The resulting SVG map file is rendered as the MIT campus map with labeled buildings. Currently, the entire MIT campus is included in this map. When the space ID query service becomes available for general use, this map will be overlaid with a floorplan of a specified floor of the specified building zoomed at a user-appropriate level. The JDOM XML parser is used to parse the unaccounted item XML lists created by the Report Generator. These XML lists are acquired after sending a HTTP request, and are parsed with the JDOM XML parser, because data manipulation is easier using the Document Object Model (DOM) hierarchal representation of XML. Bugs After clicking “Save” when modifying the information of an item, the SVG map does not repaint or render properly, and thus the user no longer can draw on the map for other items. I suspect this has to do with the way the JPEGTranscoder from the Batik toolkit handled the DOM tree of the SVG map. Somehow the DOM representation of the map is mishandled and needs to be cloned before sending it to the transcoder to be rasterized into a JPG. Also, the GUI resizes itself into a difficult viewing size after rendering the SVG map, which has something to do with the fact that the DOM has been set in a dynamic state. The initial rendering of the SVG map is slow, which may be optimized by rewriting a more lightweight rendering package. In general the Tool runs slower on the Mac

18
OS X due to the Batik toolkit; recently they have made some changes in the performance but there are still improvements to be made.

19
References 1 MIT Controller’s Accounting Office http://web.mit.edu/cao/www/ 2 Scalable Vector Graphics (SVG) 1.1 Specification http://www.w3.org/TR/SVG/ 3 Nissanka B. Priyantha, Anit Chakraborty, Hari Balakrishnan. The Cricket Location-
Support System, Proc. 6th ACM MOBICOM, Boston, MA, August 2000. 4 Kulikov, Vitaliy. Building Model Generation Project. M.Eng. Thesis, Massachusetts
Institute of Technology, Cambridge, MA, May 2004. 5 Batik SVG Toolkit website, part of the Apache XML Project.
http://xml.apache.org/batik/index.html