locate procedia improving dark matter searches by...
TRANSCRIPT
Physics Procedia 00 (2014) 1–7
PhysicsProcedia
www.elsevier.com/locate/procedia
Improving Dark Matter Searches by Measuring the NucleonAxial Form Factor: Perspectives from MicroBooNE
Tia Miceli, Vassili Papavassiliou, Stephen Pate, Katherine Woodruff
for the MicroBooNE Collaboration
NMSU Department of Physics, MSC 3D P.O. Box 30001, Las Cruces, NM 88003
Abstract
The MicroBooNE neutrino experiment at Fermilab is constructing a liquid-argon time-projection chamber for theBooster Neutrino Beam to study neutrino oscillations and interactions with nucleons and nuclei, starting in 2014. Wedescribe the experiment and focus on its unique abilities to measure cross sections at low values of Q2. In particular, theneutral-current elastic scattering cross section is especially interesting, as it is sensitive to the contribution of the strangesea quark spin to the angular-momentum of the nucleon, ∆s. Implications for dark-matter searches are discussed.
Keywords:PACS: 14.20.Dh, 13.15.+g, 11.30.Pb
1. Motivation
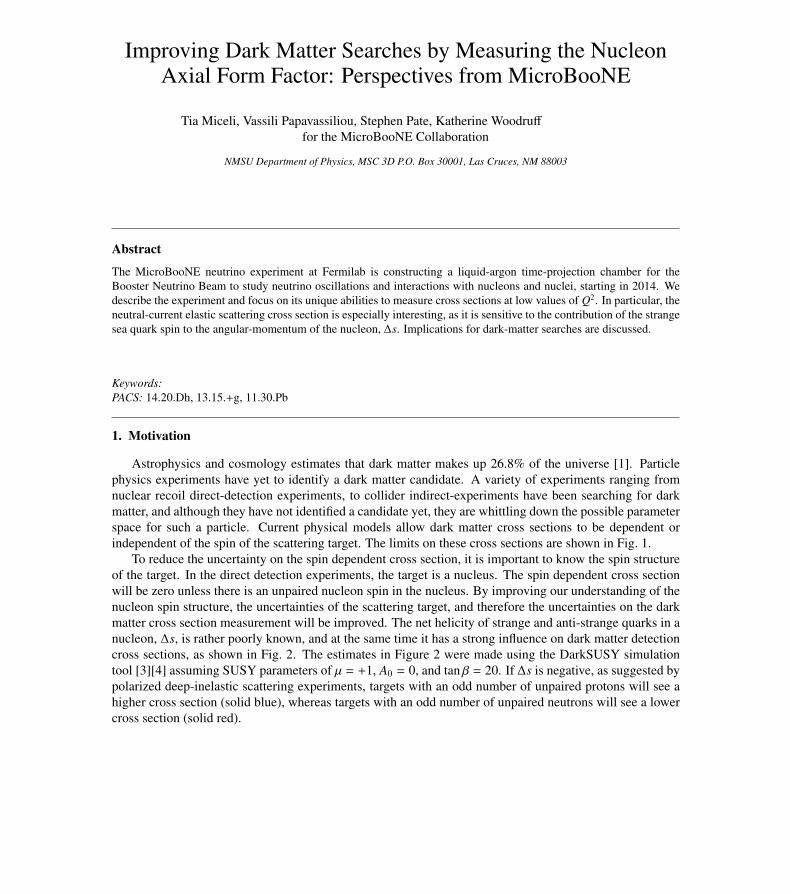
Astrophysics and cosmology estimates that dark matter makes up 26.8% of the universe [1]. Particlephysics experiments have yet to identify a dark matter candidate. A variety of experiments ranging fromnuclear recoil direct-detection experiments, to collider indirect-experiments have been searching for darkmatter, and although they have not identified a candidate yet, they are whittling down the possible parameterspace for such a particle. Current physical models allow dark matter cross sections to be dependent orindependent of the spin of the scattering target. The limits on these cross sections are shown in Fig. 1.
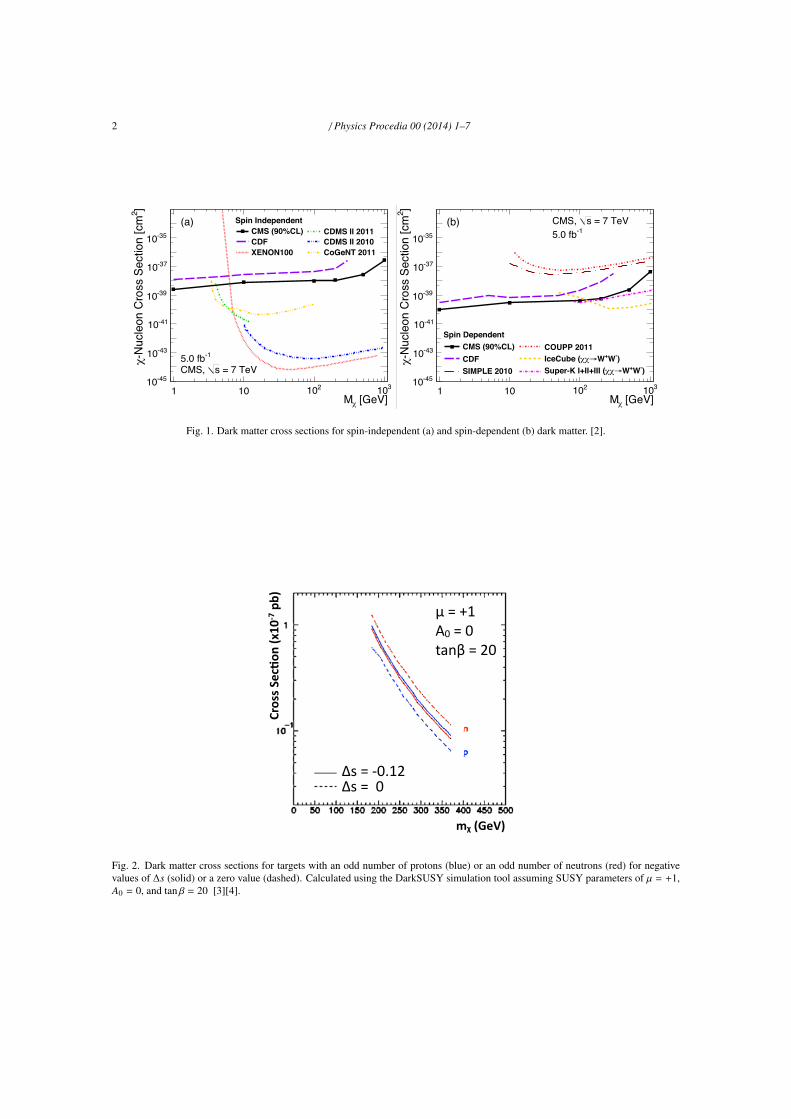
To reduce the uncertainty on the spin dependent cross section, it is important to know the spin structureof the target. In the direct detection experiments, the target is a nucleus. The spin dependent cross sectionwill be zero unless there is an unpaired nucleon spin in the nucleus. By improving our understanding of thenucleon spin structure, the uncertainties of the scattering target, and therefore the uncertainties on the darkmatter cross section measurement will be improved. The net helicity of strange and anti-strange quarks in anucleon, ∆s, is rather poorly known, and at the same time it has a strong influence on dark matter detectioncross sections, as shown in Fig. 2. The estimates in Figure 2 were made using the DarkSUSY simulationtool [3][4] assuming SUSY parameters of µ = +1, A0 = 0, and tan β = 20. If ∆s is negative, as suggested bypolarized deep-inelastic scattering experiments, targets with an odd number of unpaired protons will see ahigher cross section (solid blue), whereas targets with an odd number of unpaired neutrons will see a lowercross section (solid red).
2 / Physics Procedia 00 (2014) 1–7
5
[GeV]χ M1 10 210 310
]2-N
ucle
on C
ross
Sec
tion
[cm
χ
-4510
-4310
-4110
-3910
-3710
-3510
Spin IndependentCMS (90%CL)CDFXENON100
CDMS II 2011CDMS II 2010CoGeNT 2011
= 7 TeVsCMS, -15.0 fb
(a)
[GeV]χ M1 10 210 310
]2-N
ucle
on C
ross
Sec
tion
[cm
χ
-4510
-4310
-4110
-3910
-3710
-3510
Spin DependentCMS (90%CL)CDFSIMPLE 2010
COUPP 2011
)-W+W→χχIceCube ()-W+W→χχSuper-K I+II+III (
= 7 TeVsCMS, -15.0 fb
(b)
Figure 2: The 90% CL upper limits on the c-nucleon cross section as a function of Mc for (a)spin-independent and (b) spin-dependent scattering. Also shown are the limits from selectedexperiments with published [27–34] and preliminary [35] results.
Table 1: (a) Observed (expected) 90% CL upper limits on the DM production cross section s,and 90% CL lower limits on the cutoff scale L for vector and axial-vector operators as a functionof the DM mass Mc. (b) Expected and observed lower limits on MD at 95% CL, as a function ofextra dimensions n, with K-factors (and without, i.e., K = 1).
Mc [GeV]Vector Axial-Vector
s [fb] L [GeV] s [fb] L [GeV]1 14.3 (14.7) 572 (568) 14.9 (15.4) 565 (561)10 14.3 (14.7) 571 (567) 14.1 (14.5) 573 (569)
100 15.4 (15.3) 558 (558) 13.9 (14.3) 554 (550)200 14.3 (14.7) 549 (545) 14.0 (14.5) 508 (504)500 13.6 (14.0) 442 (439) 13.7 (14.1) 358 (356)1000 14.1 (14.5) 246 (244) 13.9 (14.3) 172 (171)
(a) 90% CL Limits on DM model parameters.
n K-factorsExpected ObservedMD [TeV] MD [TeV]
3 1.5 1.70 (1.53) 1.73 (1.55)4 1.4 1.65 (1.53) 1.67 (1.55)5 1.3 1.63 (1.54) 1.64 (1.56)6 1.2 1.62 (1.55) 1.64 (1.57)
(b) 95% CL Limits on ADD parameters.
⇡3 fb at 90% CL. For spin-dependent scattering, the upper limits surpass all previous con-straints for the mass range of 1–100 GeV. The results presented are valid for mediator masseslarger than the limits on L, assuming unity for the couplings gc and gq. The specific case oflight mediators is discussed in Ref. [3, 36]. The assumptions on c interactions made in calcu-lating the limits vary with experiment. Further, in the case of direct and indirect searches, anastrophysical model must be assumed for the density and velocity distribution of DM.
A set of 95% confidence level (CL) upper limits are also placed on the ADD cross sections andtranslated into exclusions on the parameter space of the model. The upper limits are calculated
Tia$Miceli
May 1, 2011
Dark*Matter*Searches
4
! Dark$MaZer$may$be$dependent$or$independent$of$spin.
JHEP$1209$(2012)$094
Apologies$if$your$favorite$curve$is$not$here!
Fig. 1. Dark matter cross sections for spin-independent (a) and spin-dependent (b) dark matter. [2].
μ"="+1"A0"="0"tanβ"="20
Cross%S
ec)o
n%(x10
/7%pb)
mχ%(GeV)
Δs"="/0.12"Δs"=""0
Fig. 2. Dark matter cross sections for targets with an odd number of protons (blue) or an odd number of neutrons (red) for negativevalues of ∆s (solid) or a zero value (dashed). Calculated using the DarkSUSY simulation tool assuming SUSY parameters of µ = +1,A0 = 0, and tan β = 20 [3][4].
/ Physics Procedia 00 (2014) 1–7 3
These proceedings will summarize the current state of knowledge of the nucleon spin structure, andpresent a method to measure the strange component to the nucleon spin. This is the variable which ismost in need of improvement in order to better estimate dark matter cross sections. We will highlight theimprovement capabilities from the new MicroBooNE detector at Fermilab.
2. Form Factor Global Fits
Calculating the scattering amplitude of a particle with a nucleon is non-trivial since the nucleon is notpoint-like. Experimentally determined form factors are used to parameterize the scattering matrix elementinto pieces. Each form factor depends on the momentum transferred, Q2. The form factors for the elec-tromagnetic current and charged weak current are well understood for Q2 < 1 GeV2. However, the matrixelement for the neutral weak current can be improved, specifically the axial form factor which is related tothe spin structure of the nucleon. The axial form factor has components dependent on the up, down, andstrange quark composition of the nucleon, Eq. 1
GZ,pA =
12
(−GuA + Gd
A + GsA) (1)
The combination of form factors −GuA + Gd
A is well determined from charged current neutrino reactionsand elastic and deep inelastic electron and muon scattering experiments, as well as neutron decay experi-ments [5]. The last form factor, Gs
A, approaches the value of the strange quark spin, ∆s, as the momentumtransfer squared, Q2, goes to zero, Eq. 2.
GsA(Q2 → 0) = ∆s (2)
This quantity can be measured in neutral current neutrino scattering experiments provided that the detectorhas detailed tracking capabilities.
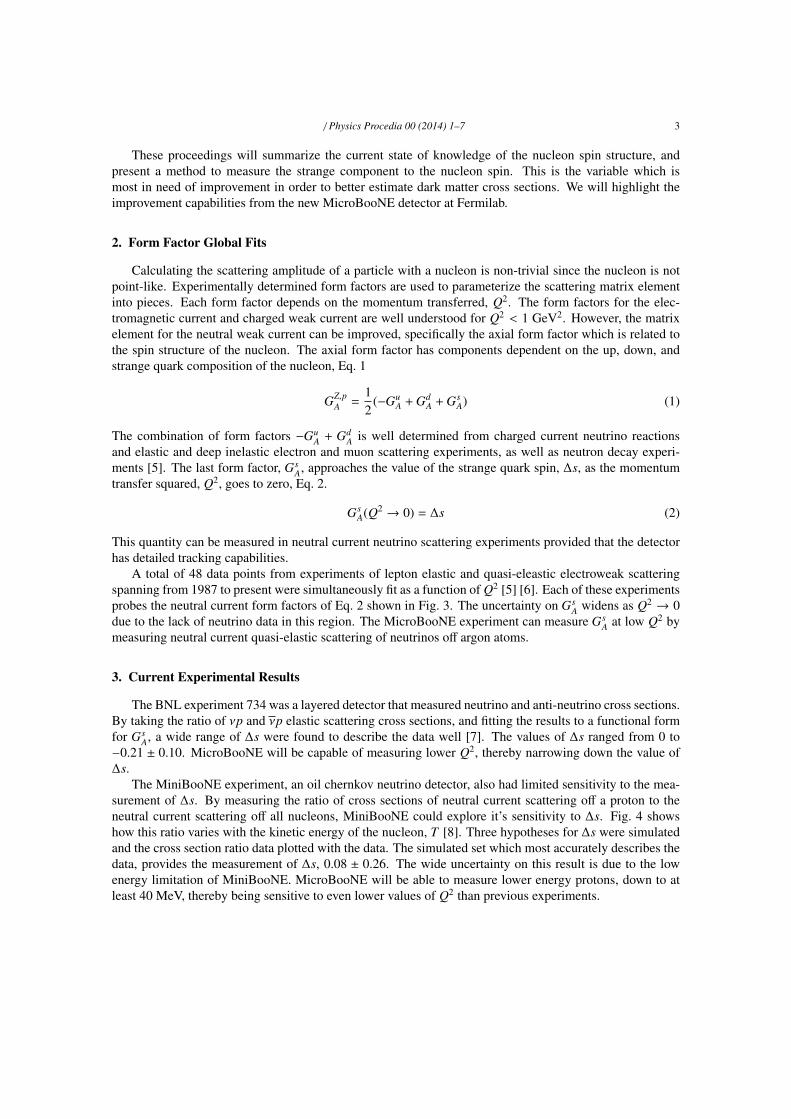
A total of 48 data points from experiments of lepton elastic and quasi-eleastic electroweak scatteringspanning from 1987 to present were simultaneously fit as a function of Q2 [5] [6]. Each of these experimentsprobes the neutral current form factors of Eq. 2 shown in Fig. 3. The uncertainty on Gs
A widens as Q2 → 0due to the lack of neutrino data in this region. The MicroBooNE experiment can measure Gs
A at low Q2 bymeasuring neutral current quasi-elastic scattering of neutrinos off argon atoms.
3. Current Experimental Results
The BNL experiment 734 was a layered detector that measured neutrino and anti-neutrino cross sections.By taking the ratio of νp and νp elastic scattering cross sections, and fitting the results to a functional formfor Gs
A, a wide range of ∆s were found to describe the data well [7]. The values of ∆s ranged from 0 to−0.21 ± 0.10. MicroBooNE will be capable of measuring lower Q2, thereby narrowing down the value of∆s.
The MiniBooNE experiment, an oil chernkov neutrino detector, also had limited sensitivity to the mea-surement of ∆s. By measuring the ratio of cross sections of neutral current scattering off a proton to theneutral current scattering off all nucleons, MiniBooNE could explore it’s sensitivity to ∆s. Fig. 4 showshow this ratio varies with the kinetic energy of the nucleon, T [8]. Three hypotheses for ∆s were simulatedand the cross section ratio data plotted with the data. The simulated set which most accurately describes thedata, provides the measurement of ∆s, 0.08 ± 0.26. The wide uncertainty on this result is due to the lowenergy limitation of MiniBooNE. MicroBooNE will be able to measure lower energy protons, down to atleast 40 MeV, thereby being sensitive to even lower values of Q2 than previous experiments.

4 / Physics Procedia 00 (2014) 1–7
Tia$Miceli
May 1, 2011
0 0.2 0.4 0.6 0.8 1
0 0.2 0.4 0.6 0.8 1
-1
-0.5
0
0.5
-1
-0.5
0
0.5
sAG
0 0.2 0.4 0.6 0.8 1
0 0.2 0.4 0.6 0.8 1
-0.2
0
0.2
0.4
-0.2
0
0.2
0.4
sMG
)2 (GeV2Q0 0.2 0.4 0.6 0.8 1
0 0.2 0.4 0.6 0.8 1
-0.2
0
0.2
-0.2
0
0.2
sEG
Current*Fits*&*70%*conKidence*band
�13arXiv:1308.5694
! 48$experiments$of$elasQc$and$quasic
elasQc$electroweak$sca[ering$data$
compiled$by$S.$Pate$and$D.$Trujillo$
arXiv:1308.5694.$
! In$each!bin!of!Q2,$the$data$is$
simultaneously$fit.$
! GSA$uncertainty$widens$as$Q2→0$
" MicroBooNE$can$make$a$big$contribuQon$at$
low$Q2$like$BNLcE734$did$for$higher$Q2.
G0 (forward ep) + E734 (ν p and ν p)HAPPEx (forward ep) + E734 (ν p and ν p)Pate, Papavassiliou & McKee, PRC 78 (2008) 015207
PVA4 (forward and backward ep)Baunack et al., PRL 102 (2009) 151803
G0 (forward and backward ep, and backward ed)D. Androic et al., PRL 104 (2010) 012001
HAPPEx (forward ep and e 4 He) + G0 (forward ep) + SAMPLE (backward ep and ed) + PVA4 (forward ep) near Q2 = 0.1 GeV2
Liu, McKeown & Ramsey-Musolf, PRC 76 (2007) 025202
HAPPEx (forward ep) + G0 (forward and backward ep) at Q2 = 0.62 GeV2
Ahmed et al., PRL 108 (2012) 102001
Fig. 3. Points: determinations of the strangeness form factors at specific Q2 values, drawing on specific experiments. Solid line: Globalfit of all 48 available data points. Dashed line: 70% confidence interval for the global fit. [5] [6].
Tia$Miceli
May 1, 2011
10
(degrees)pθ0 20 40 60 80 100 120 140 160 180
Even
ts/(5
deg
rees
)
0
200
400
600
800
1000
1200 Total Monte Carlo
Data with stat error
NCE with a single proton
Multiple protons
Other backgrounds
FIG. 11: The angle between the reconstructed nucleon direc-tion and the incident beam direction for data and MC afterthe NCE, “Proton/Muon”, and “Proton/Neutron” cuts. Alldistributions are POT–normalized. Events with θp < 60o areused in the analysis.
T (MeV)350 400 450 500 550 600 650 700 750
2 N
) on
CH
ν →
N
ν p
) / (
ν →
p
ν(
0.1
0.2
0.3
0.4
0.5
Data with total error=1.35 GeV
As = -0.5, MΔMC,
=1.35 GeVA
s = 0.0, MΔMC, =1.35 GeV
As = 0.5, MΔMC,
FIG. 12: The ratio of νp → νp/νN → νN as a function ofthe reconstructed energy for data and MC with ∆s values aslabeled.
data sample includes 7,616 events with the following pre-dicted channel fractions: 55% νp → νp, 10% νn → νn,14% NCE-like background, 1% dirt background, and 19%other backgrounds.
The ratio of νp → νp to νN → νN events for dataand MC for different values of ∆s (−0.5, 0, and +0.5) isshown in Fig. 12, which illustrates the sensitivity of thisratio to ∆s. The error bars for the data histogram arethe diagonal elements of the full error matrix.
C. Measurement of ∆s.
The full error matrix is used for the χ2 tests of ∆s todetermine the best fit and the confidence interval. The χ2
surface also slightly depends on the value of MA. Assum-ing MA = 1.35 GeV, the fit to the MiniBooNE measured
νp → νp/νN → νN ratio yields:
∆s = 0.08 ± 0.26, (1)
with χ2min/DOF = 34.7/29. Using MA = 1.23 GeV
yields ∆s = 0.00±0.30 with χ2min/DOF = 34.5/29. The
result is consistent with the BNL E734 measurement [12].One needs to comment on the implications of Fig-
ures 4, 11, and 12 on the ∆s result. From Fig. 4, onecan see that the MiniBooNE MC overpredicts the to-tal number of events passing the NCE selection cutsat high reconstructed energies (T > 250 MeV) by asmuch as 40%. The NCE proton-enriched sample wasobtained for events with high reconstructed energies,350 < T < 800 MeV. For these events, looking at theθp distribution in Fig. 11, it seems that the entire dis-agreement between data and MC at these energies comesfrom the forward-going events, νp → νp. Clearly thereis a deficit of νp → νp in the data, which in principleimplies that this might be due to positive values of ∆s.However, Fig. 12 and the result in Eq.(1) shows that itis consistent with zero. This may indicate that there isalso a deficit of νn → νn.
This measurement represents the first attempt at a∆s determination using this ratio. The systematic er-rors are quite large, mostly due to large uncertaintiesin the optical model of the mineral oil. MiniBooNEmaintains a sensitivity to ∆s for proton energies aboveCherenkov threshold for protons, where the contributionfrom NCE-like background is significant. In order toimprove the sensitivity to ∆s, future experiments needto have good proton/neutron particle identification (pos-sibly through neutron capture tagging) and extend thecross-section measurement down to the T < 200 MeV re-gion, where the contribution from NCE-like backgroundbecomes negligible and where the extrapolation of theaxial form factor to Q2 = 0 becomes less model depen-dent.
V. SUMMARY.
In summary, MiniBooNE has used a high-statisticssample of NCE interactions to measure the NCE (νN →νN) flux-averaged differential cross section, dσ/dQ2 onCH2. Using MiniBooNE CCQE data, a measurementof NCE/CCQE cross-section ratio has also been per-formed. Using POT-normalized distributions of the re-constructed energy for the NCE sample, χ2 tests for sev-eral MA and κ values have been performed. The MCwith higher values of MA give a better χ2 than that withMA = 1.02 GeV. The allowed region for the axial vec-tor mass using just MiniBooNE NCE data was obtained,MA = 1.39±0.11 GeV. It is in agreement with the shapenormalized fits of νµ CCQE scattering on neutrons boundin carbon, oxygen and iron as obtained by recent experi-ments [6–8, 19]. For energies above Cherenkov threshold,a sample of NCE proton-enriched events was obtained,
Detecting*Strange*Spin! RaQo$of$neutral$current$/$charged$current$cross$secQons$(σNC/σCC)$is$sensiQve$to$Δs.
�15
MiniBooNE:$Phys.$Rev.$D$82,$092005$(2010)
! At$MiniBooNE:$" Measure$raQo$σ(νp→νp)/σ(νN→μN)$
" See$which$Δs$predicQon$matches$best$with$the$data.
! At$MicroBooNE:$" Follow$similar$procedure,$but$MicroBooNE$will$do$be[er$(lower$Q2,$and$improved$parQcle$ID).$
Fig. 4. Ratio of neutral current proton scattering to all neutral current scattering in the MiniBooNE detector. Black dots and grey bandsare data, and uncertainty of the data, solid blue line is the simulated ratio assuming ∆s is -0.5, dashed cyan for ∆s is 0, and dashedblack for ∆s is 0.5[8].
/ Physics Procedia 00 (2014) 1–7 5
4. Anticipated improvement with MicroBooNE data
The MicroBooNE detector, which is now under construction at Fermilab, will be well-suited for themeasurement of Gs
A at low Q2. The ratio of neutral current (NC) elastic cross section to charged current(CC) quasi-elastic cross section is sensitive to ∆s. By using a ratio of cross sections (Eq. 3), some nuclear,detector, and flux effects common to both neutral current and charged current interactions will be cancelled.
ratio(∆s) =σ(NC)elastic
σ(CC)quasi-elastic =σ(νp→ νp)σ(νn→ µp)
(3)
By fitting a function to this ratio, the value of ∆s can be extracted, similar to the procedure describedfor MiniBooNE. MicroBooNE’s improved particle identification enables measurements down to a lowerQ2 than MiniBooNE. At MicroBooNE, a 40 MeV proton will provide the minimum detectible track length(spreading over 5 detection wires). This enables a measurement of Q2 down to ∼ 0.08 GeV2, which will bethe lowest Q2 neutral current measurement for any neutrino scattering experiment.
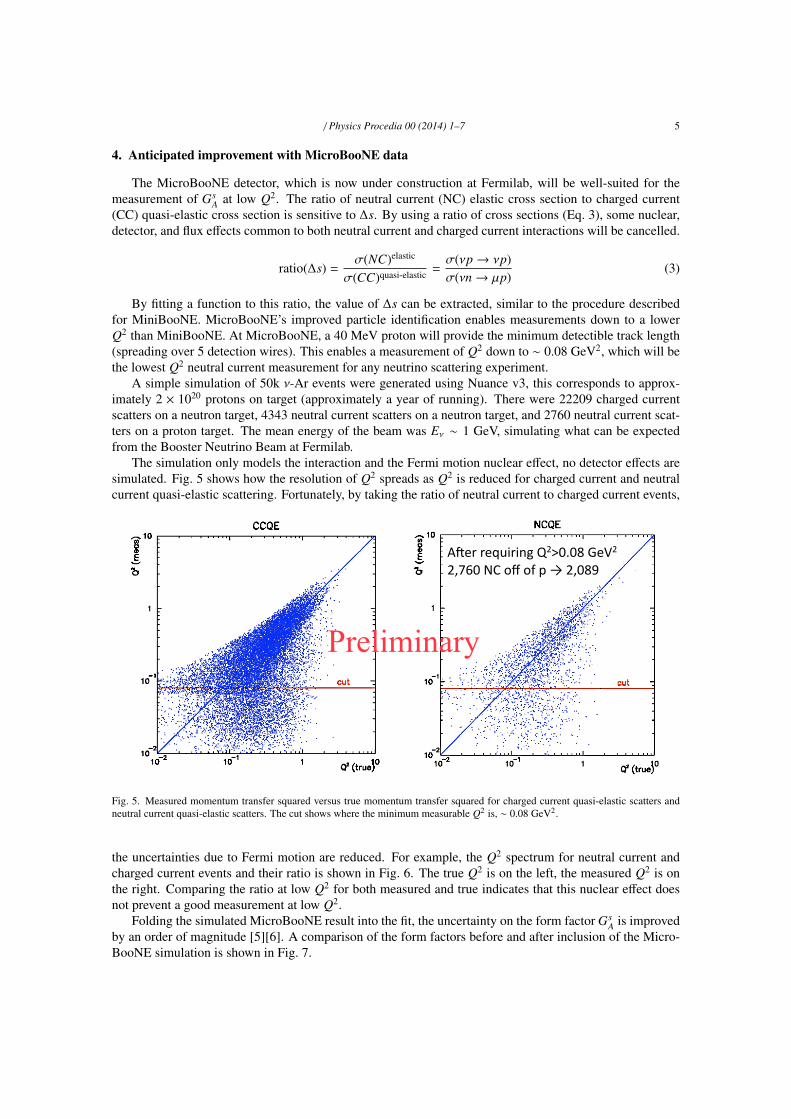
A simple simulation of 50k ν-Ar events were generated using Nuance v3, this corresponds to approx-imately 2 × 10²⁰ protons on target (approximately a year of running). There were 22209 charged currentscatters on a neutron target, 4343 neutral current scatters on a neutron target, and 2760 neutral current scat-ters on a proton target. The mean energy of the beam was Eν ∼ 1 GeV, simulating what can be expectedfrom the Booster Neutrino Beam at Fermilab.
The simulation only models the interaction and the Fermi motion nuclear effect, no detector effects aresimulated. Fig. 5 shows how the resolution of Q2 spreads as Q2 is reduced for charged current and neutralcurrent quasi-elastic scattering. Fortunately, by taking the ratio of neutral current to charged current events,
Tia$Miceli
May 1, 2011
MC#ν%Ar#Events! Apparent$vs.$True$Q2$
" only$nuclear$effects$(Fermi$mo:on)$are$considered$in$Nuance$v3
�18
Preliminary
MicroBooNE$DocDB$2810Fv1
AGer$requiring$Q2>0.08$GeV2$2,760$NC$off$of$p$→$2,089
Fig. 5. Measured momentum transfer squared versus true momentum transfer squared for charged current quasi-elastic scatters andneutral current quasi-elastic scatters. The cut shows where the minimum measurable Q2 is, ∼ 0.08 GeV2.
the uncertainties due to Fermi motion are reduced. For example, the Q2 spectrum for neutral current andcharged current events and their ratio is shown in Fig. 6. The true Q2 is on the left, the measured Q2 is onthe right. Comparing the ratio at low Q2 for both measured and true indicates that this nuclear effect doesnot prevent a good measurement at low Q2.
Folding the simulated MicroBooNE result into the fit, the uncertainty on the form factor GsA is improved
by an order of magnitude [5][6]. A comparison of the form factors before and after inclusion of the Micro-BooNE simulation is shown in Fig. 7.

6 / Physics Procedia 00 (2014) 1–7
Tia$Miceli
May 1, 2011
Detecting(Strange(Spin! σNC/σCC$=$σ(νp→νp)/σ(νn→μ5p)$=$Np/Np+μ$(careful$of$backgrounds!)
�19
Preliminary
MicroBooNE$DocDB$28105v1
Q2true$(GeV2/c2) Q2
meas$(GeV2/c2)! Some$nuclear,$detector,$and$flux$effects$are$common$to$both$NC$and$CC,$so$they$cancel$by$taking$a$raWo.$
" Example:$Above,$fermi$moWon$does$not$affect$raWo.
Num
ber$of$Events
NCQ
E/CC
QE
Fig. 6. Number of neutral current (νp elastic) and charged current (νn quasi-elastic) events as a function of Q2, left for the true Q2,right for the measured Q2. Bottom two plots show the ratio of these two events which will be used to make measurements.
Tia$Miceli
May 1, 2011
Axial&FF&Fit&Uncertainty
�20
Preliminary
! When$the$simulated$MicroBooNE$data$is$folded$into$the$fit$(right),$the$uncertainty$in$GSA$can$improve$by$an$order$of$magnitude.
An$earlier$fit$from:$arxiv:1012.2991Fig. 7. Same as Fig. 3, but on the right, the lines include with MicroBooNE projected data folded into the fit [5][6].
/ Physics Procedia 00 (2014) 1–7 7
5. Experimental Considerations
As the MicroBooNE detector is commissioned, many studies will be done to understand experimentalbackgrounds. The most challenging backgrounds are those anticipated from neutrons which are produced inneutrino interactions in the material around the detector. Since they are neutral, they can mimic a neutrinointeraction, and can have similar scattering topologies as neutral current events. Neutrons are produced byneutrino interactions in the material up stream of the detector. Low energy neutrons can bounce around thedetector hall, and enter the detector in any direction, whereas fast neutrons will enter the detector’s frontface with neutrinos in the beam.
The low energy neutrons generally enter the sensitive area from every direction. These will be challeng-ing to estimate experimentally since argon does not moderate neutrons efficiently, we expect to estimate thisbackground using Monte Carlo.
The high energy neutrons are expected to enter MicroBooNE upstream. By counting the number ofneutral current-like events within certain distances from the upstream face of the detector, a model of thenumber and energy of incoming neutrons can be made. As a neutrino travels through the detector, theprobability of its interacting with liquid argon is flat, it is independent of its penetration depth. Conversely,a neutron is more likely to interact in the upstream half of the detector due to its much shorter interactionlength.
If the number of high energy neutrons cannot be well modeled, auxiliary detectors may be utilized toestimate the neutron rate of the beam. Since charged particles are often produced with the high energyneutrons, a scintillator wall in front of MicroBooNE may be used as a veto to indicate that an incomingneutron is from an upstream beam scatter. Another option under study is to directly measure the neutronrate with a temporary low density gas TPC placed in front of MicroBooNE, which will still require a goodmodel and simulation of neutron interactions [9].
6. Conclusion
The MicroBooNE neutrino detector is well equipped to measure short particle tracks as is necessary tomeasure protons recoiling from a neutral current interaction. The fine resolution tracking enables detectionof neutral current scatters at very low Q2. By comparing the ratio of neutral current interactions to chargedcurrent interactions in data with those in simulations, the value of the nuclear form factor Gs
A can be mea-sured at low Q2. This measurement will refine the uncertainty in the global fits of this form factor at Q2
approaching zero, which provides a measurement of ∆s. The value of ∆s can modify the cross section limitsof dark matter interactions by a few orders of magnitude.
References
[1] P. Ade, et al., Planck 2013 results. I. Overview of products and scientific results arXiv:1303.5062.[2] CMS, Search for dark matter and large extra dimensions in monojet events in pp collisions at
√s= 7 TeV, J. High Energy Phys.
09 (arXiv:1206.5663. CMS-EXO-11-059. CERN-PH-EP-2012-168) (2012) 094. 35 p, comments: Submitted to the Journal ofHigh Energy Physics.
[3] P. Gondolo, J. Edsj, P. Ullio, L. Bergstrm, M. Schelke, E. Baltz, T. Bringmann, G. Duda, Darksusy home page,http://www.fysik.su.se/ edsjo/darksusy/ (Mar. 2013).
[4] P. Gondolo, J. Edsjo, P. Ullio, L. Bergstrom, M. Schelke, et al., DarkSUSY: Computing supersymmetric dark matter propertiesnumerically, JCAP 0407 (2004) 008. arXiv:astro-ph/0406204, doi:10.1088/1475-7516/2004/07/008.
[5] S. Pate, D. Trujillo, Strangeness Vector and Axial-Vector Form Factors of the Nucleon, arXiv:1308.5694.[6] S. Pate, J. Schaub, D. Trujillo, Strange Quark Contribution to the Nucleon Spin from Electroweak Elastic Scattering Data,
arXiv:1208.5944.[7] G. T. Garvey, W. C. Louis, D. H. White, Determination of proton strange form factors from ?¡i¿p¡/i¿ elastic scattering, Phys. Rev.
C 48 (1993) 761–765. doi:10.1103/PhysRevC.48.761.URL http://link.aps.org/doi/10.1103/PhysRevC.48.761
[8] A. A. Aguilar-Arevalo, et al., Measurement of the neutrino neutral-current elastic differential cross section on mineral oil at eν ∼ 1GeV, Phys. Rev. D 82 (2010) 092005. doi:10.1103/PhysRevD.82.092005.URL http://link.aps.org/doi/10.1103/PhysRevD.82.092005
[9] J. Lopez, K. Terao, J. Conrad, D. Dujmic, W. L., A Prototype Detector for Directional Measurement of the Cosmogenic NeutronFlux, arXiv:1108.4894.