local strength personal commitment - scotiabank … · local strength personal commitment 1997...
TRANSCRIPT

Executive OfficesScotia Plaza, 44 King Street West, Toronto, Ontario, Canada M5H 1H1
Since welcoming its first customers in 1832, Scotiabank has grown into a major
international financial institution, with over 1,600 branches and offices in more
than 50 countries around the world – as well as affiliates and joint venture partners
in Latin America and Asia. Our assets now total $195 billion.
1 9 9 7 a n n u a l r e p o r t
global reach
local strength
personal commitment
19
97
a
nn
ua
l r
ep
or
t

t a b l e o f c o n t e n t s
■ The Scotiabank Group 1
■ Highlights 2
■ Letter to shareholders 4
■ Questions & answers 8
■ Business highlights 10
■ Competitive advantages 12
■ Glossary 20
■ 1997 financial report 21
Management’s discussion and analysis 22
Consolidated financial statements 67
■ Corporate governance & Board of directors 102
■ Corporate listings 108
■ Shareholder information 114
Scotiabank’s goal is to be Canada’s best and most successful
financial services company.
We will achieve this by focusing on our core strengths:
diversification, risk management, productivity, customer
satisfaction and our Scotiabank team.
In all relationships with our stakeholders, we rely on our
core values: a customer focus; honesty, integrity and candour;
hard work and smart work; two-way commitment between
employees and the bank; and teamwork.
Putting people first is central to who we are.
Cover: Emilce Andrea Correa is one of 1,800 employees of Banco Quilmes, Scotiabank’s Argentine
partner. Page 1: Left: Familiar Scotiabank signage at the main branch in Moncton, New Brunswick.
Centre: Stephanie Sorensen works as a retail lending administration officer at the Toronto Midtown
Commercial Banking Centre. Right: PC banking at your fingertips.
Corporate HeadquartersScotiabank, Scotia Plaza, 44 King Street West, Toronto, Ontario, Canada M5H 1H1
Transfer AgentMontreal Trust Company of Canada, 151 Front Street West, 8th Floor, Toronto, Ontario, Canada M5J 2N1
The SecretaryScotiabank, 44 King Street West, Toronto, Ontario, Canada M5H 1H1
http://www.scotiabank.ca
For product, corporate and financial information
Corporate HeadquartersTel.: (416) 866-6161
Fax: (416) 866-3750
E-mail: [email protected]
Annual Report and Other Financial ReportsTel.: (416) 866-3925
Fax: (416) 866-4988
Financial Analysts, Portfolio Managers and other Institutional InvestorsTel.: (416) 866-5982
Fax: (416) 866-7867
E-mail: [email protected]
Transfer AgentTel.: (416) 981-9633; 1-800-663-9097
Fax: (416) 981-9507
Secretary’s DepartmentTel.: (416) 866-4790
Fax: (416) 866-5090
For complete addresses, please refer to the Worldwide Directory. To obtain a copy, contact:
Public and Corporate Affairs, 44 King Street West, Toronto, Ontario
Tel.: (416) 866-3925
Fax: (416) 866-4988
William E. Bailey, 44 King Street West, Toronto, Ontario, Canada M5H 1H1
Tel.: (416) 933-3299; 1-800-785-8772
Fax: (416) 933-3276
Senior Long-Term Debt Commercial PaperCBRS A+(high) CBRS A-1+
DBRS AA DBRS R-1(middle)
IBCA AA- Moody’s P-1
Moody’s Aa3 Standard & Poor’s A-1+
Standard & Poor’s AA-
Non-Cumulative Preferred SharesCBRS P-2
DBRS Pfd-1(low)
S c o t i a b a n k 115
C o n t a c t a n d g e n e r a l i n f o r m a t i o n
Design: Sutton/Javelin Communications, Toronto Principal photography: Michael Fiala, Larry Newland Typesetting: Graphic Services, Scotiabank Printing: Arthurs-Jones Inc.Translation: KPMG (Management’s Discussion and Analysis), Price Waterhouse (Consolidated Financial Statements), Translation Department, Quebec Regional Office, ScotiabankProduced by: Public and Corporate Affairs, Scotiabank
C R E D I T R AT I N G S
B Y M A I L
O N L I N E
O F F I C E O F T H E O M B U D S M A N
WO R L D W I D E D I R E C T O R Y
B Y P H O N E , FA X A N D E - M A I L

S c o t i a b a n k 1
■ The Scotiabank Group provides comprehensive financial solutions to meet the needs
of Canadian and international clients across four business lines – domestic, corporate,
investment and international banking. Beyond traditional retail, commercial and
wholesale banking, we also offer mutual funds, discount and full-service brokerage,
discretionary portfolio management, trust and insurance services. The Scotiabank
Group prides itself on providing superior service in more than 50 countries.
■ The Bank’s steady growth and excellent financial performance have been character-
ized by an uninterrupted history of dividend payments since 1833. This clearly
demonstrates our ability to compete successfully, both domestically and internationally.
As the new millennium approaches, Scotiabank is stepping forward as a truly global
bank – strong, resourceful, focused on our core strengths and supported by a dedicated
team of people.
t h e S c o t i a b a n k g r o u p

1997 1996 1995
Shareholder returns
for the fiscal year, $ unless otherwise indicated
Net income ($ millions) $ 1,514 1,069 876
Earnings per common share $ 5.91 4.08 3.38
Dividends per common share $ 1.48 1.30 1.24
Return on common shareholders’ equity 20.2% 15.8 14.2
Return on common shareholders’ investment 51.1% 52.3 10.2
Common share price (close, October 31) $ 62.15 42.45 28.88
Growth in the business
at October 31, $ billions, unless otherwise indicated
Assets
Total assets $ 195.2 165.3 147.2
Loans & acceptances (excluding reverse repos) $ 123.3 101.6 94.3
U.S. loans syndicated as agent (1997 to September) $ 52.7 45.4 32.7
Deposits
Total deposits $ 139.0 117.9 111.3
Personal deposits $ 59.2 47.8 45.5
Assets under management $ 14.1 13.7 11.6
People (number)
Staffing (full-time equivalent) 38,648 34,592 33,717
Canadian mutual fund licencees 5,980 4,335 3,265
ScotiaMcLeod investment executives 750 650 600
Points of service (number)
Branches & other offices 1,658 1,464 1,460
Countries with Scotiabank Group offices 53 46 44
ABMs – Canada 1,669 1,406 1,324
– International (Scotiabank & affiliates) 830 609 540
Financial strength
at October 31
Tier 1 capital ratio (%) 6.90% 6.69 6.67
Total capital ratio (%) 10.42% 8.85 9.65
Common shareholders’ equity ($ billions) $ 7.9 6.4 5.7
Market capitalization ($ billions) $ 15.2 10.0 6.7
Composite of ratings from leading rating agencies AA- AA- AA-
Fiscal 1997 was a year of achievement for Scotiabank. The Bank produced good returns for the benefit of its
shareholders, and made several important acquisitions that broaden its customer base and global reach. In
addition, there were substantial increases in activity levels in most parts of the Bank’s business, and capital
ratios rose significantly. These two pages provide an overview of some of the goals and accomplishments
of 1997.
H i g h l i g h t s
S c o t i a b a n k2

S c o t i a b a n k 3
Net Income
The Bank had strong growth in earnings in 1997– net income rose 42% to $1,514 million. Thisincrease was partly the result of several unusualitems but, even excluding them, there was still asolid gain of 14%.*1994 purple is before special charges
Strong growth in earnings
42%up
93 94 95 96 97
500
750
1000
1250
1500
Return on Equity
In fiscal 1997, the Bank’s ROE was 20.2% versus15.8% in 1996. Even excluding the unusualitems, the ROE of 16.4% exceeded the Bank’starget.*1994 purple is before special charges
Above-target ROE
20.2%
93 94 95 96 97
10
15
20
Risk Management
A key aspect of risk management is credit quality. The Bank improved its specific provisionfor credit losses in 1997 to $360 million or0.33% of average loans and acceptances, versus0.39% in the prior year.
Customer Satisfaction
Scotiabank consistently achieves a high rankingamong its peers for customer satisfaction (in anindependent survey), enhancing the ability ofthe Bank to retain customers and grow marketshare.
5%better
top-tier
An improvement in credit losses
93 94 95 96 97
0.2
0.4
0.6
0.8
High rank for customer satisfaction
Rank among Big Six banks
1 year #25 years #110 years #2
source: calculated from data from MarketFacts of Canada Limited
$ millions
*
*
%
specific credit losses, as % of loans and acceptances
excl.unusualitems
Scotiabank has a number of financial goals based on its core strengths and
the outlook for its main markets. The goals are:
■ to earn a specific premium over risk-free Government of Canada bonds
— which presently translates into a return on equity target of more
than 14%
■ to maintain a productivity ratio of less than 60%
■ to have steady increases in dividends to common shareholders
■ to generate consistent growth in book value per share which should
lead to a higher market value of the Bank’s common shares
1 9 9 7 R E S U L T S
ROE: 20.2%
Productivity ratio: 62.4%
Annual dividend increase: 18 cents
Growth in
book value per share: $5.33
g o a l s
a c h i e v e m e n t s
excl.unusualitems

L e t t e r t o s h a r e h o l d e r s
S c o t i a b a n k4
Peter C. Godsoe
Chairman of the Board
& Chief Executive Officer
Albert E. Wahbe
Executive Vice-President
Operations
Robert W. Chisholm
Vice-Chairman Finance &
Administration and President
& Chief Executive Officer
National Trust
Richard E. Waugh
Vice-Chairman
Corporate Banking
Sylvia D. Chrominska
Executive Vice-President
Human Resources
Robert L. Brooks
Executive Vice-President
Investment Banking
In 1997, we extended our reach as a truly multinational
bank, one equipped to take advantage of diverse business
opportunities in major world markets. At the same time,
we strengthened our overall business position in the
domestic retail marketplace.
Our financial performance in 1997 demonstrated that
our strategy of building on our core strengths, relying on
our employees across the Scotiabank Group, and main-
taining our focus on customers is generating increased
value for shareholders. This strategy addresses the new
challenges of the financial services business: rapid changes
in the global marketplace, shifting customer requirements,
increasing competition and the introduction of new infor-
mation technologies to serve our customers better.
This year's financial highlights underscore our success.
Net income rose to $1,514 million, up 42 per cent over the
previous year. Return on common shareholders' equity was
20.2 per cent, and earnings per share climbed from $4.08 to
$5.91, an increase of 45 per cent. These results were affected
by several unusual items, including the acquisition of
National Trust and the reversal of a portion of the country
risk provision. Excluding these unusual items, net income
would have been $1,223 million in 1997, a solid 14 per cent
increase over 1996; return on common shareholders’ equity
would have been 16.4 per cent, still exceeding the Bank’s
target; and earnings per share would have been $4.72.
Scotiabank continues to generate superior shareholder
value. Dividends per common share were up 14 per cent.
This, together with appreciation on Scotiabank’s common
share price, produced a total return to shareholders of
51.1 per cent in 1997, following a total return of 52.3 per
cent the previous year.
Key initiatives and acquisitions
Our strong financial position enabled us to make several
key acquisitions in 1997 to broaden our customer base in
Canada and extend our geographic reach.
At home, we purchased National Trust, with
$14.6 billion in assets, for $1.2 billion. This acquisition
improves our share of the Canadian retail market in
deposits and residential mortgages, expands our market
share in personal trust services, and strengthens our repre-
sentation, especially in southwestern and central Ontario.
We implemented several other strategic initiatives
we believe will ensure future growth in the Domestic
Bank. With the launch of PC Internet banking in August,
we now offer customers another way to do their everyday
transactions. We simultaneously launched an Internet

S c o t i a b a n k 5
Bruce R. Birmingham
President
Gordon F. Cheesbrough
Chairman & Chief
Executive Officer
Scotia Capital Markets
and ScotiaMcLeod Inc.
W. David Wilson
President & Deputy Chief
Executive Officer
ScotiaMcLeod Inc.
S. Dennis N. Belcher
Executive Vice-President
Investment Banking
Credit & Credit Policy
Sarabjit S. Marwah
Executive Vice-President
FinanceJohn F.M. Crean
Senior Executive
Vice-President
Credit & Risk Management
mid-market companies throughout North America, with a
particular focus on Canada. This is an important business
that we feel will grow significantly in the future.
To establish us as one of the world's leading met-
als trading and bullion banks, we signed an agreement
to acquire Mocatta Bullion & Base Metals from
Standard Chartered Bank, U.K. Mocatta will be inte-
grated with Scotia Capital Markets to enhance the
Bank’s existing strengths in precious metals and the
mining sector, and to position us to take advantage of
opportunities in expanding markets in the Middle
and Far East.
We believe that diversification, especially in major
and emerging markets around the world, is critical to our
future success. Based on our belief in the economic
potential of Latin America and Asia, we expanded our
presence in both areas with initiatives that will yield
extensive business opportunities in the future.
We acquired 53 per cent of Banco Ahorromet in
El Salvador, 25 per cent of Banco Sudamericano in Peru
discount brokerage trading service, which enables cus-
tomers to buy and sell securities, view their portfolios,
get real-time stock quotes and receive up-to-the-minute
market news. We also continued to expand our ABM,
telephone banking and debit card networks.
Innovative retail product development has improved
our market position. The Scotia RRSP Catch-Up Loan –
introduced during the 1997 RRSP sales season – was a
great success, boosting both consumer credit outstandings
and sales of investment products of the Scotiabank Group.
We have experienced good growth in the small and
medium business sectors, introduced electronic banking
alternatives for small business customers, and streamlined
credit application processes to enhance our service levels
and decrease costs.
To improve efficiency and offer customers additional
services, we formed a number of strategic alliances. In the
United States, one such partnership will provide compre-
hensive cash management services to Scotiabank customers
in Canada, the U.S. and Mexico.
We continued to strengthen our leadership position in
syndication lending, especially in Canada, the U.S. and the
U.K. From January to October 1997, Scotiabank led all
Canadian banks in global syndication lending in terms of
volume. We are the ninth-ranked bank among all domestic
and international banks in the global syndication market.
We founded Scotia Merchant Capital Corporation, a
merchant bank that funds equity investments in private

S c o t i a b a n k6
and signed a letter of intent to acquire 25 per cent of
Banco del Caribe in Venezuela. In Mexico, where we have
a 10 per cent interest in Grupo Financiero Inverlat and an
option to move to a controlling interest by the year 2000,
we are positioning the company to share in the country's
economic recovery and growth.
Reinforcing our Asia-Pacific strategy, we filed a letter
of intent to purchase a 35 per cent interest in Bank Arya,
an Indonesian retail bank. We plan further expansion in
India, as well as entry into Sri Lanka and Bangladesh.
We also enhanced our dominant presence in the
Caribbean with new branches in Grenada and Belize, and
launched a comprehensive program of continuous
improvement in the region to increase our efficiency.
Our intention is to continue to build our global net-
work in order to maintain our unique position as
Canada's most international bank.
The personal touch
Our core strengths – productivity, diversification, risk
management, customer satisfaction and our Scotiabank
team – provide us with continuity and a sense of direction.
Although each of these strengths is important to our suc-
cess, it is our people who set us apart from other financial
institutions. We built our businesses on the strength of
relationships – relationships among our employees, and
relationships between our employees and customers.
We continue to make substantial investments in our
staff through competitive, innovative compensation, plus
training programs and career development initiatives, to
ensure they are properly equipped to serve the ever-
increasing needs of customers.
In 1997, we successfully introduced an employee share
ownership plan in the United Kingdom, with an initial
enrolment of approximately 75 per cent of eligible staff
members, adding to the 88 per cent of Canadian employees
and 82 per cent of U.S. employees who already participate.
These figures speak to the commitment our employees
have made toward the Bank.
Our training budget more than tripled between 1992
and 1997. During the past year, more than 16,000 employees
in the branch network received Bank-sponsored training and
more than 10,000 updated their skills through technology-
assisted learning. We used multimedia equipment and
coach-assisted self-study modules in all Canadian branches,
to support the programs offered through our nine regional
training centres. Caribbean staff receive training at centres in
Jamaica, Bahamas, Trinidad and Puerto Rico, the latter offer-
ing Spanish-language instruction. A fifth training centre will
open next year in Barbados.
The Bank’s Mexican affiliate, Banco Inverlat, launched
a major management training initiative for branch man-
agers and supervisors, preparing branch leaders to take
greater responsibility for human resources management.
In all, more than 1,000 Inverlat employees benefitted from
these and other programs.
Kevin S. Rowe
Executive Vice-President
Pacific RegionBarry R. F. Luter
Executive Vice-President
Corporate Banking
Eastern U.S.A.
Malcolm C. Johnston
Executive Vice-President
International BankingRobert J. Marshall
Executive Vice-President
Retail Banking
William P. Sutton
President of the Executive
Committee
Grupo Financiero Inverlat
Mexico
S c o t i a b a n k 7
Other internal training and educational activities
include programs to prepare employees for international
positions, such as Spanish language training, an interna-
tional MBA co-op program, and intercompany exchanges
for subsidiaries and affiliates.
Beyond these internal programs, Scotiabankers
registered for more than 8,000 courses offered by the
Institute of Canadian Bankers, the second-highest number
among Canadian banks. Seventy per cent of these
individuals signed up for courses directly related to
investment and financial planning, supporting our
customers’ growing reliance on our employees’ expertise
in financial planning and wealth management.
Besides formal training programs and educational
assistance, we provide other development opportunities,
such as mentorship programs and automated job posting.
Outlook
For most of the Bank’s major markets, the outlook through
1998 is quite favourable. North American interest rates may
edge higher in the months ahead, but the economy is
expected to remain on track to register solid growth.
Canada’s expansion is now firmly rooted in the domestic
economy and improving fiscal fundamentals. The U.S.
economy, with almost full employment, should continue to
experience broad-based growth. The pace of activity in
western Europe and Japan is likely to revive, as domestic
demand begins to recover. Latin America appears poised for
another good year, led by gains in business investment and
consumer spending. The recent financial turbulence in a
number of Asian countries has created significant adjust-
ment challenges and diminished growth prospects, but the
long-term outlook for the region remains bright.
We expect our own good financial performance over
the past eight years to continue, largely because the correct
building blocks are in place to maintain our momentum
and achieve our goals.
As we move toward the next century, three clearly
defined challenges must be met: The need to manage new
technologies. The need to define a new framework for the
regulation of Canadian banks that will encourage growth
and diversification. And the need to find ways to compete
globally with banks that are often much larger than ours.
These challenges will be met by planning strategically
for the future, continuing to build on our core strengths,
and by focusing on our competitive advantages, including
the skills and expertise of our people worldwide.
For our customers, we will continue to focus on their
needs, delivering the highest quality service in all of our
businesses. For our employees, we will continue to be a
great place to work, providing challenging career opportu-
nities. For the communities we serve, we will continue our
tradition of support, particularly to organizations with an
emphasis on youth, education and health. And for our
shareholders, we will continue to generate strong returns
and build long-term value.
Peter C. Godsoe
Chairman of the Board & Chief Executive Officer
Bruce R. Birmingham
President

Q u e s t i o n s a n d a n s w e r s
S c o t i a b a n k8
Scotiabank’s outstanding performance has been part of the reason for the climb, but other
factors, such as the low interest rate environment, have also played an important role. Our
purpose is building long-term value through share appreciation for shareholders, and we’re
doing just that. We’re experiencing a very good economy, it’s a good time to invest and there’s
good potential to build that long-term value.
Chairman and CEO Peter Godsoe addresses a number of questions dealing with issues affecting
Scotiabank and the banking industry.
Strategically, this purchase makes perfect sense. With similar small-town roots and values,
Scotiabank and National Trust have a lot in common. The acquisition adds $12 billion in
personal deposits and $9 billion in residential mortgages to our business. It also strengthens
our branch network in many important Canadian markets – particularly in southwestern
and central Ontario – and provides further penetration in personal trust services.
We’re one of a handful of banks in the world that understands and can operate successfully in a
multinational environment. That’s because more than a century of international expansion has
enabled us to develop the expertise that is now one of our key competitive advantages. Global
diversification helps ensure a stream of earnings independent of the Canadian economy, and
spreads risks. From our shareholders’ perspective, these long-term investments offer the poten-
tial for good growth in the future.
Why did Scotiabank acquire National Trust?Q
A
A
A
Scotiabank’s common shares have seen strong growth since November
1995. Do you expect this to continue?Q
Why is the Bank continuing to expand its international operations?Q

S c o t i a b a n k 9
Should foreign banks be allowed to operate freely in Canada?Q
You say, as many corporations do, that your employees are one of your
core strengths. How is Scotiabank different?Q
How does the Bank practice good corporate citizenship?Q
We welcome competition and have supported the right of foreign banks to come to Canada for
the past 25 years, and we still do. We believe foreign banks should be allowed to open branches
without having to establish a Canadian subsidiary. They should not be placed under any disad-
vantage, nor should they be given any special advantages. This means foreign banks should work
under the same regulatory regime as all other banks in Canada.
Scotiabank is committed to its employees. We have resisted the popular trend to downsize our
workforce. Certainly, many jobs have changed and some have even disappeared but, at the same
time, we have been able to create many new job opportunities. The result is that we’ve been a net
job creator – our workforce has grown by close to 1,500 over the last two years, not including the
3,440 new National Trust employees. We are also committed to our employees in other ways – by
posting job opportunities and providing extensive training so our staff can grow in their careers,
by encouraging alternate work arrangements that enable employees to balance work and family,
and by recognizing individual achievements through our incentive pay program.
We have a longstanding tradition of supporting the communities where we do business, and
where our employees live and work – particularly in the areas of youth, education and health. In
1997, we contributed close to $14 million to numerous organizations, including direct donations
and community support.
What cannot be easily measured is the time and effort given freely by our employees every
day of the year. By launching the Scotia Employee Volunteer Program in 1998, we will be build-
ing on the tradition of supporting local involvement and individual commitments. Under this
program, the Bank will donate up to $1,000 per year to charities and non-profit organizations in
which our employees and pensioners are active volunteers. We hope this will encourage even
more of our staff to volunteer, further support the efforts of those who already do so, and pro-
vide additional assistance to the causes that are important to us and our communities.
A
A
A
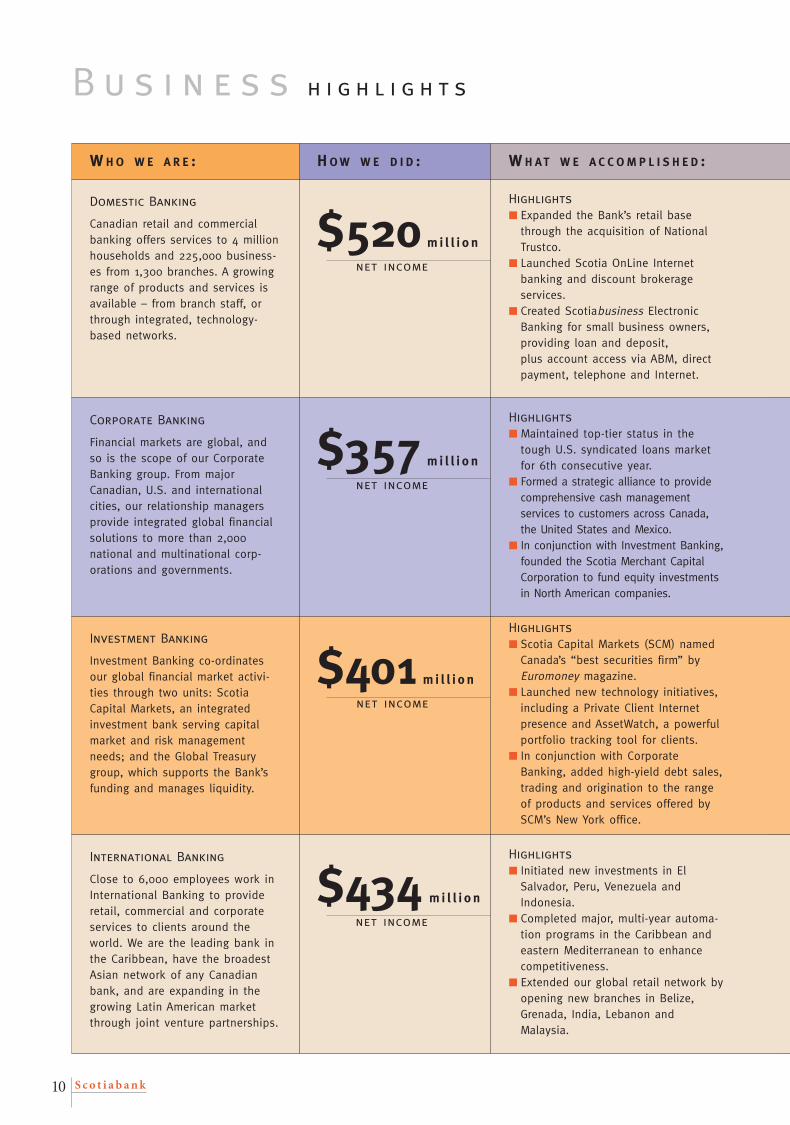
Domestic Banking
Canadian retail and commercialbanking offers services to 4 millionhouseholds and 225,000 business-es from 1,300 branches. A growingrange of products and services isavailable – from branch staff, orthrough integrated, technology-based networks.
B u s i n e s s h i g h l i g h t s
S c o t i a b a n k10
Corporate Banking
Financial markets are global, andso is the scope of our CorporateBanking group. From majorCanadian, U.S. and internationalcities, our relationship managersprovide integrated global financialsolutions to more than 2,000national and multinational corp-orations and governments.
Investment Banking
Investment Banking co-ordinatesour global financial market activi-ties through two units: ScotiaCapital Markets, an integratedinvestment bank serving capitalmarket and risk managementneeds; and the Global Treasurygroup, which supports the Bank’sfunding and manages liquidity.
International Banking
Close to 6,000 employees work inInternational Banking to provideretail, commercial and corporateservices to clients around theworld. We are the leading bank inthe Caribbean, have the broadestAsian network of any Canadianbank, and are expanding in thegrowing Latin American marketthrough joint venture partnerships.
H OW W E D I D :W H O W E A R E :
$520 mi l l i o n
W H AT W E A C C O M P L I S H E D :
net income
$357 mil l i o n
net income
$401 mi l l i o n
net income
$434 mil l i o n
net income
Highlights
■ Expanded the Bank’s retail basethrough the acquisition of NationalTrustco.
■ Launched Scotia OnLine Internetbanking and discount brokerage services.
■ Created Scotiabusiness ElectronicBanking for small business owners,providing loan and deposit, plus account access via ABM, directpayment, telephone and Internet.
Highlights
■ Maintained top-tier status in thetough U.S. syndicated loans marketfor 6th consecutive year.
■ Formed a strategic alliance to providecomprehensive cash management services to customers across Canada,the United States and Mexico.
■ In conjunction with Investment Banking,founded the Scotia Merchant CapitalCorporation to fund equity investmentsin North American companies.
Highlights
■ Scotia Capital Markets (SCM) namedCanada’s “best securities firm” byEuromoney magazine.
■ Launched new technology initiatives,including a Private Client Internetpresence and AssetWatch, a powerfulportfolio tracking tool for clients.
■ In conjunction with CorporateBanking, added high-yield debt sales,trading and origination to the rangeof products and services offered bySCM’s New York office.
Highlights
■ Initiated new investments in ElSalvador, Peru, Venezuela andIndonesia.
■ Completed major, multi-year automa-tion programs in the Caribbean andeastern Mediterranean to enhancecompetitiveness.
■ Extended our global retail network byopening new branches in Belize,Grenada, India, Lebanon andMalaysia.

S c o t i a b a n k 11
One of 41 commercial banking centres in Canada, Toronto’sMidtown Commercial Banking Centre provides services tosmall and medium businesses.
W H E R E W E A R E H E A D E D :
Hfdfnj du dfgjs at fgfu-
gi is dgynstun.
From offices in Europe, Asia, Latin America, the U.S. andCanada, Corporate Banking provides financial solutions tointernational clients.
AssetWatch enables ScotiaMcLeod’s clients to monitor theirportfolios and the markets from their own personal computers.
In 1997, Scotiabank established a joint venture partnershipwith Banco Sudamericano, based in Lima, Peru.
■ Integrate National Trust smoothly.■ Continue to develop alternate
delivery channels, and furtherexplore the potential of theInternet.
■ Increase responsiveness to theneeds of small business owners.
■ Build shareholder value by capitalizing on strong customerrelationships.
■ Develop multi-product financialsolutions and provide value-addedservices.
■ Enhance our global finance andsyndication capabilities.
■ Be a leading Canadian investmentbank and a capital market force inmajor global markets by offeringexpertise and innovative financialsolutions.
■ Expand the range of value-addedservices to clients.
■ Broaden Scotia Capital Markets’geographic reach to selectedemerging markets.
■ Further build Scotiabank’s globalfranchise by expanding our localexpertise and by forming additionalstrategic alliances in key markets.
■ Strengthen sales and servicefocus in selected markets, such asthe Caribbean.

b u i l d i n g o n o u r
C o m p e t i t i v e A d v a n t a g e s
S c o t i a b a n k12
How has Scotiabank built Canada’s most international
financial services company? Very consciously. By looking
outside Canada for new business opportunities for 165
years. And by using our local strengths as the building
blocks for a strong global network. Today, our world-
wide presence allows us to serve the needs of individuals
and businesses, and participate with them in the world’s
fastest growing markets.
Left: The Festival of the Future introduced consumers to Scotia OnLine, the Bank’s Internet
banking and discount brokerage services. Centre: Worldwide, more than 350,000 automated
banking machines that display the Interac, VISA or Plus symbols give Scotiabank customers
access to their money. Right: Credit Officer Miguel Cartagena and Clerk Ana Torres are based at
the Fajardo branch of Scotiabank de Puerto Rico.

S c o t i a b a n k 13
global reachScotiabank’s global expansion, guided by a long-established strategy of seeking out the best
opportunities for growth, has resulted in a network that now spans more than 50 countries
on five continents. This means that our customers – no matter where in the world they do
business – benefit from our ability to provide them with specialized service.
local strengthStrong local operations form the foundation of our global strategy. A commitment to shared
values, such as customer service and teamwork, unites the employees of Scotiabank Group
through branches, offices and affiliates in North America, the Caribbean, Asia, Latin America
and Europe. In all locations, the combination of local knowledge and contacts, and our inter-
national experience and resources, enable us to provide our customers with the financial
solutions they seek.
personal commitmentGlobally and locally, Scotiabank and Scotiabankers share the same commitment – to their
customers, shareholders and each other. Scotiabank is committed to being a great place to
work. This includes providing rewarding career opportunities, giving employees a greater
stake in the Bank’s success, and investing in training to continually enhance individual skills.
It also means providing flexibility to meet employee needs and, finally, communicating
with honesty, integrity and candour.

compet i t i ve advantage
global reach
S c o t i a b a n k14
International scope
Scotiabank opened its doors for business in Halifax, Nova Scotia, in 1832 and almost
immediately appointed its first agent in New York, taking the initial step toward becoming
Canada's most international bank. In 1889, we opened our first branch in the Caribbean. In
fact, we were international before we were national – establishing a branch in Kingston,
Jamaica, before moving west across Canada.
Today, Scotiabank is Canada’s most international bank – and is still growing. We are
increasing our presence in the expanding economies of Asia and Latin America, building
strategic alliances, focusing on specialized niches and extending our retail network.
In each of the countries where we operate, our goal is to provide superior local and
international financial services for a growing customer base.
In the Caribbean, we have established an extensive network of full-service Scotiabank
branches that serve local customers, as well as Canadian and international customers doing
business in the region. In other major markets around the world, clients are served through
branch networks, subsidiaries and representative offices.
In Mexico, Argentina, Peru, Chile, El Salvador and the Philippines, we have invested in
respected local banks with their own branch networks. These strategic alliances are mutually
beneficial. We share information technology and management skills, and access to our inter-
national network and global clients. In turn, our affiliates provide local expertise, the
resources of their branches, a valued name and a strong marketing presence.
We are currently finalizing similar arrangements in Indonesia and Venezuela.

S c o t i a b a n k 15
Our global links allow the Bank and its business clients to participate in the excellent
long-term prospects of many of the developing nations in the Asia-Pacific and Latin
American regions. They provide a diversified revenue base, and serve as a springboard for
securing new business.
For example, our corporate banking relationship with U.K.-based Courts plc, an inter-
national home furnishings and electrical goods retailer, now spans the U.K. plus seven
countries in the Caribbean, Malaysia and Singapore. In addition to providing local banking
in these countries, Scotiabank arranged and acted as agent for Courts in a multi-million
dollar global syndication.
Large multinational corporations, such as McDonald’s and Chrysler, also take advantage
of our international expertise to further their expansion. McDonald’s is currently looking to
Scotiabank to help support its growth internationally. We now provide lending commitments
and cash management services to the fast-food chain in 10 countries. When Chrysler, a major
Scotiabank corporate customer in the U.S. and Canada, returned to the Argentine market
after a long absence, our partner, Banco Quilmes, became its leading banker. Banco Quilmes
now provides credit to some of Chrysler Argentina’s dealers, as well as retail loans to
Chrysler customers.
We will continue to be responsive to the needs of our multinational customers as we expand
and position ourselves to take advantage of further growth opportunities in global markets.
Far left: Representatives of Peru’s Banco Sudamericano, Director Rafael Calda (l) and José
Escajadillo, visit a bank client – a manufacturer of plastic tubing. Centre top: The Bank main-
tains a branch, plus regional, investment and corporate banking offices and a trust company in
Hong Kong. Centre bottom: Shurie Smith of our Nassau Central Accounting Unit. Right: One
of 86 branches of Argentina’s Banco Quilmes. Far right: The Freeport Container Port in the
Bahamas was recently completed with Scotiabank financing as a joint venture between the local
port authority and a subsidiary of one of our Hong Kong clients.

compet i t i ve advantage
local strength
S c o t i a b a n k16
Developing relationships
In our view, you can't be strong globally unless you're strong locally.
In Canada, we have built that strength through our coast-to-coast network of branches,
our full complement of products and services, our skilled and knowledgeable workforce, and
the more effective use of information technology.
We have built our strength in other ways, too.
Responding to our customers’ increasingly sophisticated needs, we have expanded our
self-service distribution channels, and boosted the number of personal banking officers
and personal investment managers in our branches and call centres. This approach will play
a pivotal role as customers increasingly look to the Bank for advice on investments and
wealth management.
We continue to develop close relationships with local and national customers, becoming
an integral member of the communities we serve. And we are taking steps to position
the Scotiabank Group as a distinctive brand in the marketplace, emphasizing a human
touch in a highly technological world.
Local strength is not confined to our domestic operations. Each of our international
branches, representative offices and affiliates must be strong in its own business environment
to succeed.
We can capitalize on the local strength of our operations abroad. Our recent investment
in Peru's Banco Sudamericano, for instance, helped win business with that country's largest
copper company.

S c o t i a b a n k 17
We are broadening a number of corporate banking relationships by providing credit,
cash management and trust agency services to major corporations in many countries. For
example, by arranging new financings in China and Indonesia for American Standard, one of
our U.S. corporate clients, we not only helped the company expand its global presence, but
further deepened our relationship with this multinational client.
As part of our effort to strengthen our offshore operations, we are exporting expertise,
products and service concepts, and innovative new technologies that have proved successful
in Canada.
In Mexico, Banco Inverlat is developing a variation of Canada's successful small-business
Scotia Professional Plan to provide loans to doctors and other professionals. And in the
Caribbean, based on models first developed in Canada, we completed a 10-year roll-out of
our Caribbean Automation Program and launched a region-wide Continuous Improvement
Program.
As Canada’s most international bank, we will continue to rely on local expertise – in
Canada and abroad – to provide solid advice and reliable service to our customers.
Far left: Bertha Ritchie and Keva Ryan, Rawson Square, Nassau. Centre top: The Fajardo
branch is one of 14 branches of Scotiabank de Puerto Rico. Centre bottom: Mark Lipton,
Personal Investment Manager, Halifax Commercial Banking Centre. Right: Bank financing has
helped revitalize Saskatchewan’s hog industry. Here, (from left) Wayne Vermette and Richard
Wright of Quadra Group, a successful hog production management firm, confer with Darren
Eurich, their account manager from our Westside branch in Saskatoon.

compet i t i ve advantage
personal commitment
S c o t i a b a n k18
People first
Putting people first is a sound business strategy. Our research has proved it. Satisfied, skilled,
committed and motivated employees create above-average levels of customer satisfaction –
and above-average results.
How do we create such an environment? By pursuing our shared goals and shared values.
Consider the two-way commitment that exists between the Bank and its employees. Faced
with technological advances, shifting demographics and rising consumer expectations, our
employees are working harder than ever to provide excellent service to our customers. They
need to know that Scotiabank, in turn, is working to support them.
We recognize individual contributions by giving employees a greater stake in the Bank’s
success. A new incentive pay program links compensation to individual performance, and to
the performance of the Bank, as measured by return on equity. We launched this program in
Canada in 1996, extended it to selected international locations in 1997, and will include all
remaining locations worldwide in 1998.
Dealing openly, fairly and sensitively with employees, particularly during times of major
change, is the hallmark of Scotiabank’s approach to employee relations. Careful human

S c o t i a b a n k 19
resource management has helped the Bank avoid massive downsizing and, in fact, become a
net creator of new jobs – close to 1,500 over the past two years, not including the 3,440 new
National Trust employees.
Customers are demanding new kinds of services in the areas of investment products and
electronic banking. To meet this demand, jobs are changing, and we are reshaping our train-
ing, communication and career development programs to better prepare our people to deal
with these new challenges.
Employees are developing the skills they need to pursue future career opportunities at
regional training centres, through coach-assisted self-study programs, with in-branch multi-
media equipment and training software, and through Bank-financed external courses.
Commitment to our employees also means helping them balance work with their per-
sonal needs. To provide a more flexible work environment, we launched a formal policy on
alternate work arrangements in 1996. One year later, the number of Scotiabankers taking
advantage of more flexible work options doubled, and continues to grow. A new telecom-
muting pilot project will also offer an increase in choices and allow more Scotiabankers to
work outside the office.
During times of change, constant and consistent communication increases in impor-
tance. Communicating with honesty, integrity and candour is part of our commitment to
making Scotiabank a great place to work.
Far left: Gloria Kim, Personal Banking Officer, and Customer Service Representative Carman
Hudson from the Toronto Midtown Commercial Banking Centre. Centre top: Althea Davis of
Nassau’s Cable Beach branch in the Bahamas. Centre bottom: Self-study modules on CD-ROM
focus on the Bank’s investment products. Right: Stephanie Di Ceglie, Performance and Training
Services, demonstrates the Bank’s orientation program for new employees. Far right: Lori Purdy,
Staff Ombuds Office, is solely devoted to helping employees.

S c o t i a b a n k20
G L O S S A R Y
ALLOWANCE FOR CREDIT LOSSES: An allowance set asidefrom income, which, in management’s opinion, is adequate toabsorb all credit-related losses from on- and off-balance sheetitems. It includes specific provisions, the country risk provisionand the General provisions. Allowance for credit losses isdeducted from the related asset categories on the balance sheet.
BANKERS’ ACCEPTANCES (BAs): A negotiable, short-termdebt security, guaranteed for a fee by the issuer’s bank.
BASIS POINT: A unit of measure defined as one-hundredth ofone per cent.
CAPITAL: Capital consists of common shareholders’ equity,preferred shareholders’ equity and subordinated debentures.Capital supports asset growth, provides against loan losses andprotects depositors.
COUNTRY RISK PROVISION: Funds set aside initially in1987-89 to cover potential losses on exposures to a designatedgroup of emerging market countries determined by OSFI.
DERIVATIVE PRODUCTS: Derivatives are financial contractswhose value is derived from an underlying price, interest rate,exchange rate or price index. Forwards, options and swaps are allderivative instruments.
DESIGNATED EMERGING MARKETS (DEM): Countriesagainst whose loans and securities OSFI has required banks toset aside a country risk provision.
FOREIGN CURRENCY TRANSLATION GAIN/LOSS: Theunrealized gain or loss recorded when foreign currency assetsand liabilities are translated into Canadian dollars at a balancesheet date, when exchange rates differ from those of the previ-ous balance sheet date.
FOREIGN EXCHANGE CONTRACTS: Commitments to buyor sell a specified amount of foreign currency on a set date andat a predetermined rate of exchange.
FORWARD RATE AGREEMENT (FRA): A contract betweentwo parties, whereby a designated interest rate, applied to anotional principal amount, is locked in for a specified period oftime. The difference between the contracted rate and prevailingmarket rate is paid in cash on the settlement date. These agree-ments are used to protect against, or to take advantage of, futureinterest rate movements.
FUTURES: Commitments to buy or sell designated amounts of commodities, securities or currencies on a specified date at apredetermined price. Futures are traded on recognized exchanges.Gains and losses on these contracts are settled daily, based on closing market prices.
GENERAL PROVISIONS: Provisions for doubtful credits(General provisions) are established against the loan portfolio inthe Bank’s business lines, where a prudent assessment by theBank of adverse economic trends suggests that losses may occur,but where such losses cannot yet be determined on an item-by-item basis.
GUARANTEES AND LETTERS OF CREDIT: Assurancesgiven by the Bank that it will make payments on behalf of clientsto third parties if the clients default. The Bank normally hasrecourse against its clients for any such funds advanced.
HEDGING: Protecting against price, interest rate or foreignexchange exposures by taking positions which are expected toreact to market conditions in an offsetting manner.
IMPAIRED LOANS: Loans on which the Bank no longer hasreasonable assurance as to the timely collection of both interestand principal, or where a contractual payment is past due a pre-scribed period. Interest is not accrued on impaired loans.
MARKED-TO-MARKET: The valuation of securities and off-balance sheet instruments, such as interest and exchange ratecontracts, at market prices, as of the balance sheet date. The difference between market and book value is recorded as a gain or loss to income.
NET INTEREST MARGIN: Net interest income, on a taxableequivalent basis, expressed as a percentage of average total assets.
NOTIONAL PRINCIPAL AMOUNTS: The contract or principal amounts used in determining payments for certain off-balance sheet instruments, such as FRAs, interest rate swapsand cross-currency swaps. The amounts are termed “notional”because they are not usually exchanged themselves, serving onlyas the basis for calculating amounts that do change hands.
OFF-BALANCE SHEET INSTRUMENTS: These instrumentsare comprised of indirect credit commitments, includingundrawn commitments to extend credit and derivative instru-ments.
OPTIONS: Contracts between buyer and seller giving the buyerof the option the right, but not the obligation, to buy (call) orsell (put) a specified commodity, financial instrument or cur-rency at a set price or rate on or before a specified future date.
OSFI: The Office of the Superintendent of Financial InstitutionsCanada, the regulator of Canadian banks.
PRODUCTIVITY RATIO: Productivity ratio measures theefficiency with which the Bank incurs expenses to generate revenue. It expresses non-interest expenses as a percentage of thesum of net interest income (TEB) and other income. A lower ratio indicates improved productivity.
REPOS: Repos is short for “obligations related to assets soldunder repurchase agreements” – a short-term transaction wherethe Bank sells securities to a client and simultaneously agrees torepurchase them on a specified date and at a specified price. It isa form of short-term funding.
REVERSE REPOS: Reverse repos is short for “assets purchasedunder resale agreements” – a short-term transaction where theBank purchases securities from a client and simultaneouslyagrees to resell them on a specified date and at a specified price.It is a form of short-term collateralized lending.
RISK-ADJUSTED ASSETS: Risk-adjusted assets are calculatedusing weights based on the degree of credit risk for each class ofcounterparty. Off-balance sheet instruments are converted tobalance sheet equivalents, using specified conversion factors,before the appropriate risk weights are applied.
SWAPS: Interest rate swaps are agreements to exchange streamsof interest payments, typically one at a floating rate, the other ata fixed rate, over a specified period of time, based on notionalprincipal amounts. Cross-currency swaps are agreements toexchange payments in different currencies over predeterminedperiods of time.
TAXABLE EQUIVALENT BASIS (TEB): The grossing up oftax-exempt income earned on certain securities to an equivalentbefore-tax basis. This procedure allows a uniform measurementand comparison of net interest income that arises from bothtaxable and tax-exempt sources.
TIER 1, TIER 2 CAPITAL RATIOS: These are ratios of capitalto risk-adjusted assets, as stipulated by OSFI, based on guide-lines developed under the auspices of the Bank for InternationalSettlements (BIS). Tier 1 capital, considered to be the more per-manent, consists primarily of common shareholders’ equity plusnon-cumulative preferred shares, less any unamortized good-will. Tier 2 is mainly cumulative preferred shares, subordinateddebentures and general provisions.
VALUE AT RISK (VAR): VAR is an estimate of the potentialloss of value which could result from holding a position for aspecified period of time, with a given level of statisticalconfidence.

S c o t i a b a n k 21
management’s discussion and
analysis of financial condition
and results of operations
consolidated financial statements
1 9 9 7 F i n a n c i a l r e p o r t

S c o t i a b a n k22
of financial condition
and results of operations
M a n a g e m e n t ’ s d i s c u s s i o n
a n d a n a l y s i s
t a b l e o f c o n t e n t s
■ overview of financial results 23
■ canadian retail and commercial banking 24
■ corporate banking 26
■ investment banking 28
■ international banking 30
■ major corporate developments 32
■ revenues 33
■ productivity and expenses 37
■ risk management 39
credit risk 41
credit quality 43
asset liability management 45
market risk 48
derivatives 51
operating risk 53
■ capital 54
■ supplementary data 56
■ 1997 consolidated financial statements 67

S c o t i a b a n k 23
Substant ial Incre ase in Ne t Income
■ Net income was $1,514 million in 1997, a substantial increase of 42% from the previous year. This year’s results
were affected by several unusual items including the effects of the acquisition of National Trust and the rever-
sal of a portion of the country risk provision (refer to Table 1, page 56).
Excluding the unusual items, earnings would have
been $1,223 million in 1997, which was still a solid
14% increase over the prior year. This arose from
good growth in loans and fee income in most of the
Bank’s activities, and continued improvement in
credit quality.
St rong Re tur n to Common Shareholders
■ Return to common shareholders, which includes both dividends and appreciation in the price of the Bank’s
common shares, has been strong in recent years, including 1997. The annualized return for the five years to the
end of 1997 was 26% per year, consistent with other Canadian banks and materially better than the return on
the TSE 300 index.
Div idends Grow ing Consistently
■ Common share dividends have increased in 23 of the past 25 years. This performance continued in 1997,
when the dividend payments increased to $1.48 per common share from $1.30 in 1996. Dividends per common
share have risen 7% a year over the past five years.
Business Lines: St rength in Diversit y
■ The Bank’s four main business lines provide it with diversification and many opportunities. The results of the
business lines are summarized below and reviewed beginning on the following page.
O v e r v i e w o f f i n a n c i a l r e s u l t s
Strong return to common shareholders
1997 1996
Canadian Retail & Commercial $ 520 $ 405Corporate 357 250Investment 401 232International 434 236Other* (198) (54)
Total net income $1,514 $1,069
*includes gains on sale of businesses, items related to National Trust, certain overhead expenses and corporate items
Four profitable business lines
$ millions
9392 94 95 96 97
100
200
300
1992=100
ScotiabankTSE banks & trustsTSE 300
%For the financial years 1997 1996 1995 1994 1993
Annual return 51.1% 52.3% 10.2% (0.9)% 26.6%
Five-year return (annualized) 26.0% 21.9% 27.6% 16.2 % 21.1%
93 94 95 96 97
500
1000
1500
$ millions
excludingunusual items
excluding special charges

S c o t i a b a n k24
C A N A D I A N R E TA I L A N D C O M M E R C I A L B A N K I N G
Canadian Retail
and Commercial Banking is dedicated to providing useful and innovative financial services to
customers. We offer a variety of delivery channels from which they can choose, easy to understand
products and services, increasingly expert advice – and in partnership with our customers, we are
helping them build their financial well-being.
T H E H U M A N S I D E O F B A N K I N G
A C C O M P L I S H M E N T S
■ expanded customer base and branch network with National Trust acquisition
■ introduced Scotia OnLine for Internet banking and discount brokerage
■ offered alternate delivery channels to small business clients
Per for mance
Canadian Retail and Commercial Banking serves
well over 3.5 million households and more than
225,000 businesses, through branches, ABMs and
electronic delivery channels.
In late fiscal 1997, the Bank acquired National
Trust, a Canadian trust company with a substantial
base of retail business, including 500,000 households,
$9 billion in residential mortgages and $12 billion in
personal deposits. The financial results of National
Trust will be reported with Canadian Retail and
Commercial Banking beginning in fiscal 1998.
In 1997, this business line produced net income of
$520 million, up 28% from 1996, and contributed 34%
of the Bank’s net income.
because of higher volumes and a better interest margin.
Average earning assets rose by $4 billion, of which the
largest component was an increase of $2 billion or 8%
in residential mortgages. This was accompanied by
growth in personal lending (including Scotia Plan
Loans, ScotiaLine and VISA) of 4%.
In the priority area of commercial lending, mainly
to small and medium businesses, volumes rose by 8%
in 1997.
Average deposits grew by 3% during the year.
Personal deposits were almost unchanged over the
prior year because of customer migration to mutual
funds. This shift in customer preference contributed to
growth of 38% in the Bank’s Scotia Excelsior mutual
funds to $7 billion at the end of fiscal 1997. Current
account deposits also rose substantially, by 17% in
1997, continuing the strong growth trend of the past
few years.
Fee income was strong in 1997, rising 11%, with
good contributions from mutual funds, commercial
lending, foreign exchange, and payment services.
Expenses rose 6%, with higher employment, new
delivery channels, and an increase in advertising.
Credit losses improved from the prior year
in commercial, but were higher in personal lending,
including student loans.
Financial Results*$ millions 1997 1996Net interest income $ 2,277 $ 2,031Other income 787 710Provision for credit losses (227) (236)Non-interest expenses (1,934) (1,816)Income taxes (383) (284)
Net income $ 520 $ 405
Average earning assets ($ billions) $ 62 $ 58Average deposits ($ billions) $ 51 $ 49
Staffing 19,426 19,326* excludes National Trust
Total revenues were substantially higher in
1997 across most categories. Net interest income rose

S c o t i a b a n k 25
93 94 95 96 97
100
200
300
400
L O O K I N G F O R W A R D
■ timely and cost-effective integration of National Trust operations
■ expand alternate delivery services for retail and commercial clients
■ improve management of relationships with Canadian families and small businesses
The bank of choice for professionals
Business plans
A key goal is the timely and cost-effective integra-
tion of National Trust, while ensuring customers
receive a continued high standard of service.
The Bank intends to enable customers to use the
channel of their choice, for example, the new Scotia
OnLine Internet service, mobile sales officers or new
electronic delivery services for businesses.
The Bank is deepening its knowledge of consumer
behaviour, with the aim of building better financial
solutions for different customer needs.
Many retail initiatives will also improve relation-
ships with Canadian families, such as:
■ strengthening contacts with customers at times of
investment and mortgage rollovers
■ making it easier for customers to deal with the Bank
by rationalizing and simplifying its products and using
new systems to facilitate high-quality advice
■ improving sales capacity by reducing work in
branches through paperless teller transactions and
enhancing the sales capabilities in call centres
■ further developing employee skills with new training
programs, with an emphasis on accreditation
Rapid growth in mutual fund accounts
93 94 95 96 97
5
10
15
20
000s, October 31
cumulative # of Scotia Professional Plans sold
000s, October 31
■ offering home and auto insurance in Alberta and
other provinces.
On the commercial side, the Bank is re-engineering
its operations while maintaining the benefits of its
presence in local markets across Canada:
■ branch employees will be freed up for business
development. As well, with the pilot of credit scoring
for small commercial credits, response times will be
shortened and lending decisions will be more consistent
■ the Bank will continue to develop programs aimed
at particular market segments, such as professionals
(building on the highly successful Scotia Professional
Plan), the agricultural sector, automotive dealers, know-
ledge-based industries and Aboriginal communities.
Outlook
Economic expansion is expected to be robust in
Canada in 1998, and the Bank is looking for good busi-
ness growth. Some benefits from the National Trust
acquisition should be realized in 1998, with most to
come in 1999 and beyond. Overall, the Bank expects
earnings growth to continue in 1998.
# of active accounts

S c o t i a b a n k26
C O R P O R A T E B A N K I N G
S U P E R I O R C L I E N T R E L A T I O N S H I P SCorporate Banking’s success in building superior client relationships globally are founded on
high-quality credit skills that are increasingly based on industry specialization; a growing set of
value-added services in cash and treasury management; corporate trust and credit; and effective
teamwork with other Scotiabank groups.
A C C O M P L I S H M E N T S
■ maintained top-tier status in loan origination and syndication in global markets
■ expanded full-service financing capabilities with Scotia Merchant Banking and
high yield expertise, together with Scotia Capital Markets
■ established strategic alliance for cash management in Canada, United States and Mexico
Per for mance
Corporate Banking manages the Bank’s global
relationships with large corporations, institutions and
major governments, marketing the full capabilities of
the Scotiabank Group to these clients.
In fiscal 1997, Corporate Banking earned a record
$357 million, 43% higher than in 1996, marking the
fifth year of growth.
Corporate Banking divisions, other than real estate,
continued to provide strong and stable earnings. For
real estate, the turnaround continued in 1997, with
results improving substantially because of a lower cost
of carrying impaired loans, as well as significant recov-
eries and reversals of provisions made in previous years.
Average assets rose by 19% in 1997. There was
very strong demand for bank loans among major
corporations during the past year. Substantial growth
in business from existing customers, taken together
with an expansion of the Bank’s base of corporate
customers, led to a large increase in global syndicated
loan transactions agented by the Bank.
Total revenues were up by 8% across the Corporate
Banking group in 1997, from higher assets, the lower
cost of carrying impaired real estate loans in North
America and from fees generated by arranging and
syndicating large corporate financings. Conversely,
lower loan spreads held revenues down. The expansion
of Montreal Trust’s stock transfer and corporate trust
services partially offset the reduction in revenues from
the sale of its custody services in 1997.
Provision for credit losses amounted to a net credit
of $46 million in 1997, reflecting substantial recoveries
and reversals in real estate, which more than offset a
provision for one large corporate account in the U.S.
In an environment of lower loan spreads, the Bank
continues to carefully examine client relationships to
ensure that they produce acceptable returns to the Bank.
Financial Results$ millions 1997 1996Net interest income $ 502 $ 455Other income 355 337Provision for credit losses 46 (86)Non-interest expenses (308) (293)Income taxes (238) (163)
Net income $ 357 $ 250
Average earning assets ($ billions) $ 33 $ 27Average deposits ($ billions) $ 3 $ 3
Staffing 1,755 1,876

Cdn corporate
S c o t i a b a n k 27
Top-tier standing in US loan syndications
Business plans
Corporate Banking will continue to stress effective
management of client relationships using the Scotia-
bank Group’s full range of services. This includes:
■ strengthening relationships with profitable clients
for whom the Bank is a principal or lead bank
■ building on global corporate finance and syndica-
tion capabilities in North America, Europe and Asia
■ increasing the proportion of revenues from fees,
in part from the integration of Montreal Trust’s
Corporate Services with the Bank’s cash and treasury
management services
■ adding value for clients through industry expertise,
for example in mining, energy, media and trans-
portation
■ cross-selling cash management services in Canada,
the United States and Mexico.
Concurrently, Corporate Banking expects to main-
tain its excellent management of credit risk, through
careful adjudication of credit proposals and broad
diversification of its portfolio.
Meeting Corporate Banking’s goals will entail
working effectively with other parts of the Scotiabank
Group. This includes:
■ together with Scotia Capital Markets, providing
clients with a full range of financial solutions, by using
a sophisticated new system for managing the develop-
ment of client relationships
■ expanding high-yield debt business in the United
States, also in collaboration with Scotia Capital Markets
■ with International Banking, emphasizing the Bank’s
global reach as a key benefit to clients with diverse
business activities
■ exploring possibilities for extending Montreal Trust’s
stock transfer business to emerging markets.
Outlo ok
The Corporate Bank anticipates higher syndica-
tions and loan sales in Canada, the United States and
Europe. Economic trends in Corporate Banking’s main
markets and the emphasis on relationship profitability
should lead to a strong performance again in 1998.
A diverse corporate loan portfolio
Cdn real estate
% distribution1997 average balances
US corporate
US real estate
domestic US syndications 1997 up to September 30
Rank among banks
agent/co-agent agent only
1997 8 91996 9 101995 11 111994 9 111993 9 11
source: Loan Pricing Corp.
L O O K I N G F O R W A R D
■ build client relationships using a range of innovative, high-value services
■ expand linkages with Scotia Capital Markets and the international network
■ balance growth in assets and market share, with return on equity
46%
1% 18%
6%
6%
23%
EuropePacific

S c o t i a b a n k28
Per for mance
Investment Banking comprises two groups: Global
Treasury, which manages the Bank’s investments and
funding – and Scotia Capital Markets, which provides
businesses, governments and investors with financial
solutions.
Investment Banking had an exceptional year in
1997. In total, it contributed $401 million to the Bank’s
results, as compared with $232 million in 1996.
Investment Banking provided 26% of the Bank’s total
net income in 1997.
I N V E S T M E N T B A N K I N G
The focus of Scotiabank’s
Investment Banking group is on serving clients better than anyone else. Investment Banking’s
activities, initiatives and innovations are all aimed at providing value-added services to clients
(including the Bank itself) and providing clients with access to global capital markets.
S E R V I N G C L I E N T S B E T T E R
A C C O M P L I S H M E N T S
■ Scotia Capital Markets named Canada’s “best securities firm” by Euromoney
■ substantial gains from the sale of investment securities in 1997
■ continued leadership in Canadian Income Trust market, with market share of 25%
Notwithstanding these sales, unrealized gains
on investment securities remained large, and totalled
$817 million at year end (refer to chart on page 29).
The other key factor behind Investment Banking’s
exceptional results, was the record performance in
Scotia Capital Markets, significantly above their excel-
lent contribution in 1996. Corporate Finance had
another record year, from new equity issues, and merg-
er and acquisition activity.
Another source of strong earnings was Private
Client Financial Services, where revenues increased
30% in 1997. The development of ScotiaMcLeod’s
full-service retail brokerage has been a priority, with
11 new offices and 150 additional personal investment
executives added in the past two years.
Euromoney magazine proclaimed Scotia Capital
Markets the “best securities firm” in Canada, pointing
out the firm’s role in “high-profile and innovative
deals”, its “large presence” in mergers and acquisitions
and its leadership in income trusts.
As part of the acquisition of National Trust, Global
Treasury assumed responsibility for the well estab-
lished firm, Cassels Blaikie Investment Management
Limited, with assets under management of $6 billion.
Financial Results$ millions 1997 1996Net interest income $ 309 $ 317Other income 1,172 744Provision for credit losses – 1Non-interest expenses (794) (667)Income taxes (286) (163)
Net income $ 401 $ 232
Average earning assets ($ billions) $ 56 $ 50Average deposits ($ billions) $ 59 $ 52
Staffing 3,722 3,424
A major contributor to this strong growth in
earnings was Global Treasury’s very large gains on
the sale of securities, including $321 million from
equities, well above the average of the past few years.

S c o t i a b a n k 29
Strong growth in retail brokerage atScotiaMcLeod
Business plans
Scotiabank’s Investment Banking group aims to
continue offering innovative services globally to its
clients. Accordingly, it will:
■ expand the range of value-added services, in line
with clients’ emerging requirements, such as service
packages in retail brokerage, structured products in
fixed income, more research and options in foreign
exchange, and new products and risk-control capabili-
ties in derivatives
■ strengthen industry specialization in equities,
corporate finance and marketing
■ push forward with connective technologies like the
Internet and Intranets, for purposes such as electronic
delivery of capital market’s research to investors.
Investment Banking is working together with other
Scotiabank Groups in order to:
■ widen Scotia Capital Markets’ geographic franchise
to selected emerging markets, using the local strengths
of Scotiabank and its affiliates
■ develop and roll-out a sophisticated new system for
building client relationships, in conjunction with
Corporate Banking
■ expand high-yield debt business in the United
States, in collaboration with Corporate Banking
■ work with Retail Banking to meet the requirements
of different types of retail investors.
In 1998, Investment Banking will also continue
to enhance the application of Value at Risk (VAR) to
control trading risk.
Outlo ok
Investment Banking’s financial results fluctuate
with conditions in securities markets. The Bank
expects the Canadian economy and markets to be
favourable through the coming year. As a result,
excluding the above-average gains on the sale of invest-
ment securities this past year, 1998 results should be
close to the very good results of 1997. In addition, the
Bank expects that the financial performance of
Investment Banking will improve over time because of
a stronger ability to cross-sell services and expand into
new activities and markets.
Large unrealized gains on investmentsecurities
-.5
0
.5
1.0
1.5
93 94 95 96 97
other
designatedemergingmarket bonds
$ billions, October 31surplus of market over book value
93 94 95 96 97
200
250
300
350
L O O K I N G F O R W A R D
■ emphasize innovation, expertise and technology in providing value for clients
■ work with other Scotiabank groups to lever Investment Banking’s skills
■ continue with strategy of expanding full service retail brokerage network
in ScotiaMcLeod
retail revenues
$ millions
S c o t i a b a n k30
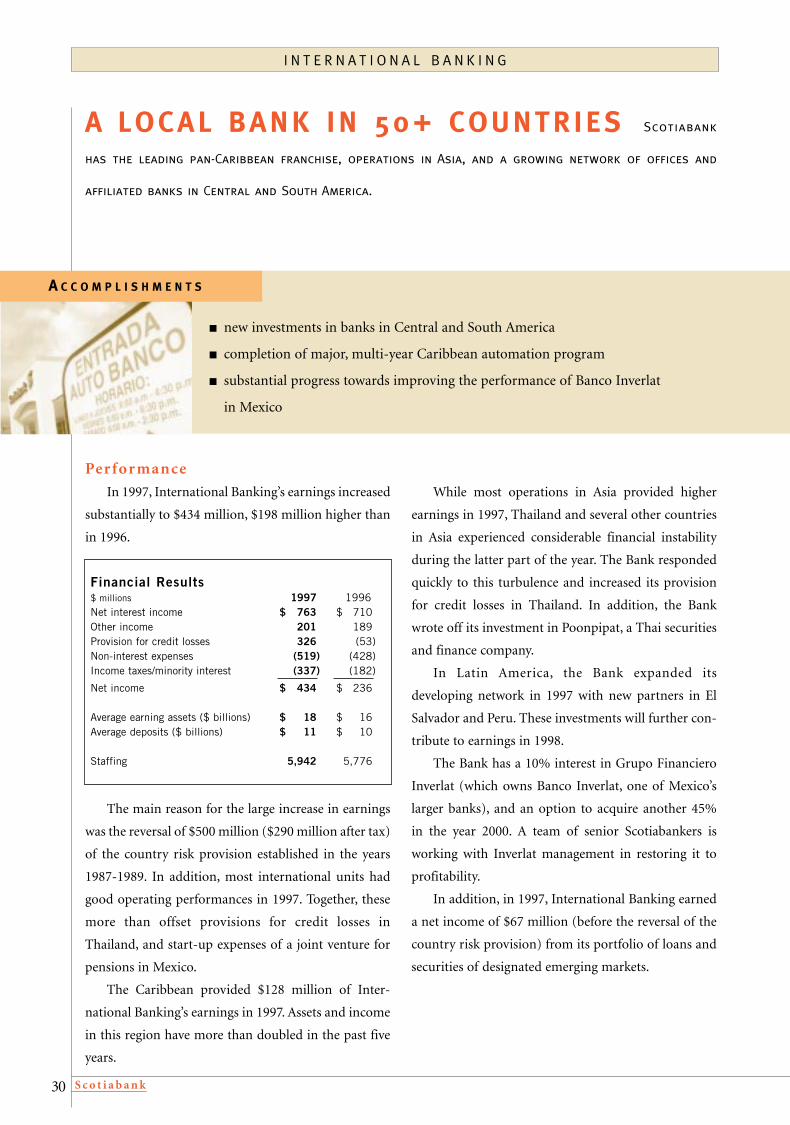
I N T E R N A T I O N A L B A N K I N G
Scotiabank
has the leading pan-Caribbean franchise, operations in Asia, and a growing network of offices and
affiliated banks in Central and South America.
A LOCAL BANK IN 50+ COUNTR IES
A C C O M P L I S H M E N T S
■ new investments in banks in Central and South America
■ completion of major, multi-year Caribbean automation program
■ substantial progress towards improving the performance of Banco Inverlat
in Mexico
Per for mance
In 1997, International Banking’s earnings increased
substantially to $434 million, $198 million higher than
in 1996.
The main reason for the large increase in earnings
was the reversal of $500 million ($290 million after tax)
of the country risk provision established in the years
1987-1989. In addition, most international units had
good operating performances in 1997. Together, these
more than offset provisions for credit losses in
Thailand, and start-up expenses of a joint venture for
pensions in Mexico.
The Caribbean provided $128 million of Inter-
national Banking’s earnings in 1997. Assets and income
in this region have more than doubled in the past five
years.
While most operations in Asia provided higher
earnings in 1997, Thailand and several other countries
in Asia experienced considerable financial instability
during the latter part of the year. The Bank responded
quickly to this turbulence and increased its provision
for credit losses in Thailand. In addition, the Bank
wrote off its investment in Poonpipat, a Thai securities
and finance company.
In Latin America, the Bank expanded its
developing network in 1997 with new partners in El
Salvador and Peru. These investments will further con-
tribute to earnings in 1998.
The Bank has a 10% interest in Grupo Financiero
Inverlat (which owns Banco Inverlat, one of Mexico’s
larger banks), and an option to acquire another 45%
in the year 2000. A team of senior Scotiabankers is
working with Inverlat management in restoring it to
profitability.
In addition, in 1997, International Banking earned
a net income of $67 million (before the reversal of the
country risk provision) from its portfolio of loans and
securities of designated emerging markets.
Financial Results$ millions 1997 1996Net interest income $ 763 $ 710Other income 201 189Provision for credit losses 326 (53)Non-interest expenses (519) (428)Income taxes/minority interest (337) (182)
Net income $ 434 $ 236
Average earning assets ($ billions) $ 18 $ 16Average deposits ($ billions) $ 11 $ 10
Staffing 5,942 5,776

S c o t i a b a n k 31
L O O K I N G F O R W A R D
■ more acquisitions or partnerships to complete representation in major
Latin American economies
■ strengthen sales and service culture in the Caribbean
■ higher earnings from recent investments
Vigorous growth in the long-standingCaribbean business
Business plans
In the Caribbean, as in Canada, the focus is on
reducing processing in branches, emphasizing sales and
service, and offering a wider array of delivery channels.
To reduce work in branches, the Bank will:
■ launch the Caribbean Improvement Program
throughout the region, based on a very successful pilot
■ centralize credit card processing.
The resource savings from these programs will be
reallocated to sales and customer service. Additionally,
a sales management platform is being developed for
use in the Caribbean.
The Bank is also extending its range of delivery
channels in the Caribbean. Major initiatives include:
■ piloting a call centre
■ broadening international ABM access
■ adding new services and multiple sales channels.
In the Asia/Pacific region, the Bank looks forward
to realizing important growth in these markets. Key
elements of its strategy are to:
■ expand the network of offices and affiliated banks
■ work with Corporate Banking to build project
finance business and corporate client relationships.
In Latin America, where the Bank is expanding its
activity, it expects to:
■ make acquisitions or enter into partnerships to
broaden its representation
■ continue to assist Banco Inverlat with plans for
growth and profitability, and build on the franchise of
Casa de Bolsa Inverlat, a top-tier Mexican investment
bank
■ develop trade finance and project finance business.
Outlo ok
Caribbean operations are expected to continue
their steady growth in volumes and earnings in 1998.
In the Asia/Pacific region, the performance of the busi-
ness units is dependent on the severity of the recent
financial instability, although a major impact on 1998
earnings is currently not anticipated. In Latin America,
the earnings contribution from the recent investments
is anticipated to increase. Looking beyond 1998, the
Bank expects that earnings from International Banking
will provide an increasing share of overall net income,
reflecting the investments of recent years.
Broad international representation*
1920 1940 1960 1980 1997
50
100
150
200
Scotiabank & affiliates
# of Caribbeanoffices
Offices ABMs Employees
Caribbean 202 183 5,982
Central & South America 651 574 17,955
Asia 142 73 3,519
Europe & Middle East 17 0 648
*includes associated companies in which Scotiabankhas an equity interest
1997
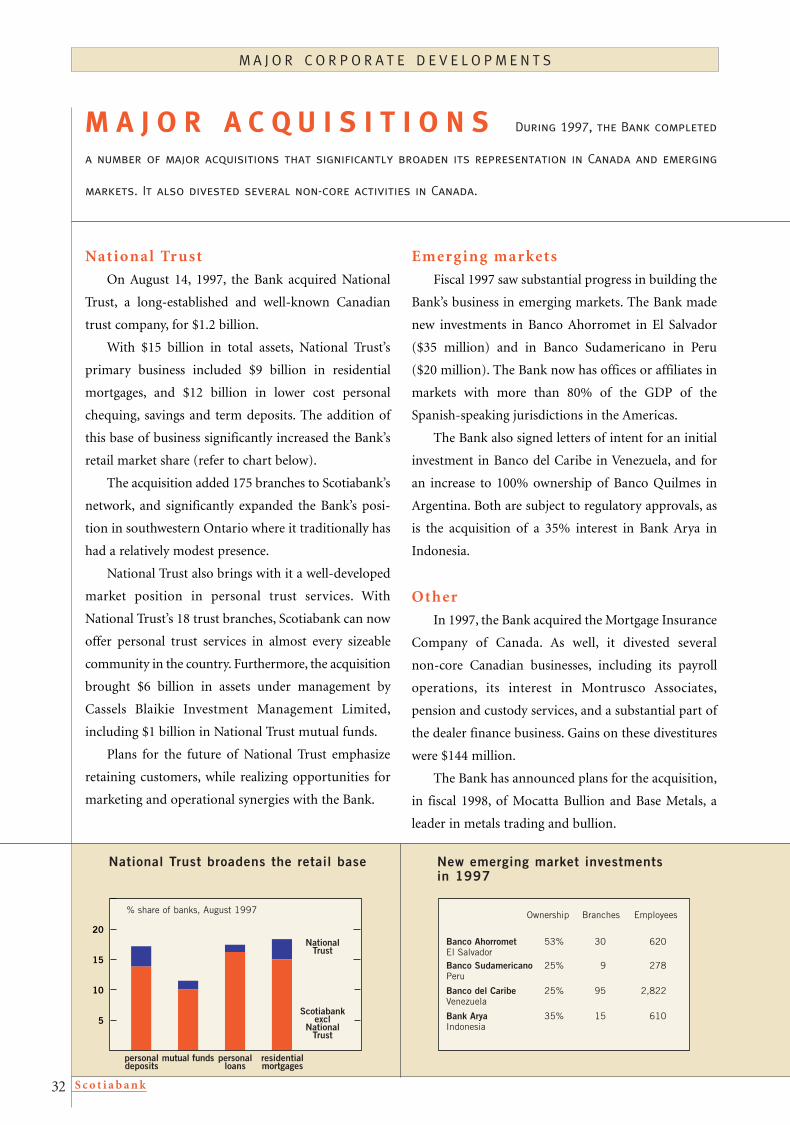
S c o t i a b a n k32
M A J O R C O R P O R A T E D E V E L O P M E N T S
During 1997, the Bank completed
a number of major acquisitions that significantly broaden its representation in Canada and emerging
markets. It also divested several non-core activities in Canada.
M A J O R A C Q U I S I T I O N S
New emerging market investmentsin 1997
National Trust broadens the retail base
5
10
15
20
Ownership Branches Employees
Banco Ahorromet 53% 30 620El SalvadorBanco Sudamericano 25% 9 278Peru
Banco del Caribe 25% 95 2,822Venezuela
Bank Arya 35% 15 610Indonesia
% share of banks, August 1997
residentialmortgages
personalloans
personaldeposits
mutual funds
Scotiabankexcl
National Trust
National Trust
Nat ional Tr ust
On August 14, 1997, the Bank acquired National
Trust, a long-established and well-known Canadian
trust company, for $1.2 billion.
With $15 billion in total assets, National Trust’s
primary business included $9 billion in residential
mortgages, and $12 billion in lower cost personal
chequing, savings and term deposits. The addition of
this base of business significantly increased the Bank’s
retail market share (refer to chart below).
The acquisition added 175 branches to Scotiabank’s
network, and significantly expanded the Bank’s posi-
tion in southwestern Ontario where it traditionally has
had a relatively modest presence.
National Trust also brings with it a well-developed
market position in personal trust services. With
National Trust’s 18 trust branches, Scotiabank can now
offer personal trust services in almost every sizeable
community in the country. Furthermore, the acquisition
brought $6 billion in assets under management by
Cassels Blaikie Investment Management Limited,
including $1 billion in National Trust mutual funds.
Plans for the future of National Trust emphasize
retaining customers, while realizing opportunities for
marketing and operational synergies with the Bank.
Emerg ing mar ke ts
Fiscal 1997 saw substantial progress in building the
Bank’s business in emerging markets. The Bank made
new investments in Banco Ahorromet in El Salvador
($35 million) and in Banco Sudamericano in Peru
($20 million). The Bank now has offices or affiliates in
markets with more than 80% of the GDP of the
Spanish-speaking jurisdictions in the Americas.
The Bank also signed letters of intent for an initial
investment in Banco del Caribe in Venezuela, and for
an increase to 100% ownership of Banco Quilmes in
Argentina. Both are subject to regulatory approvals, as
is the acquisition of a 35% interest in Bank Arya in
Indonesia.
Other
In 1997, the Bank acquired the Mortgage Insurance
Company of Canada. As well, it divested several
non-core Canadian businesses, including its payroll
operations, its interest in Montrusco Associates,
pension and custody services, and a substantial part of
the dealer finance business. Gains on these divestitures
were $144 million.
The Bank has announced plans for the acquisition,
in fiscal 1998, of Mocatta Bullion and Base Metals, a
leader in metals trading and bullion.
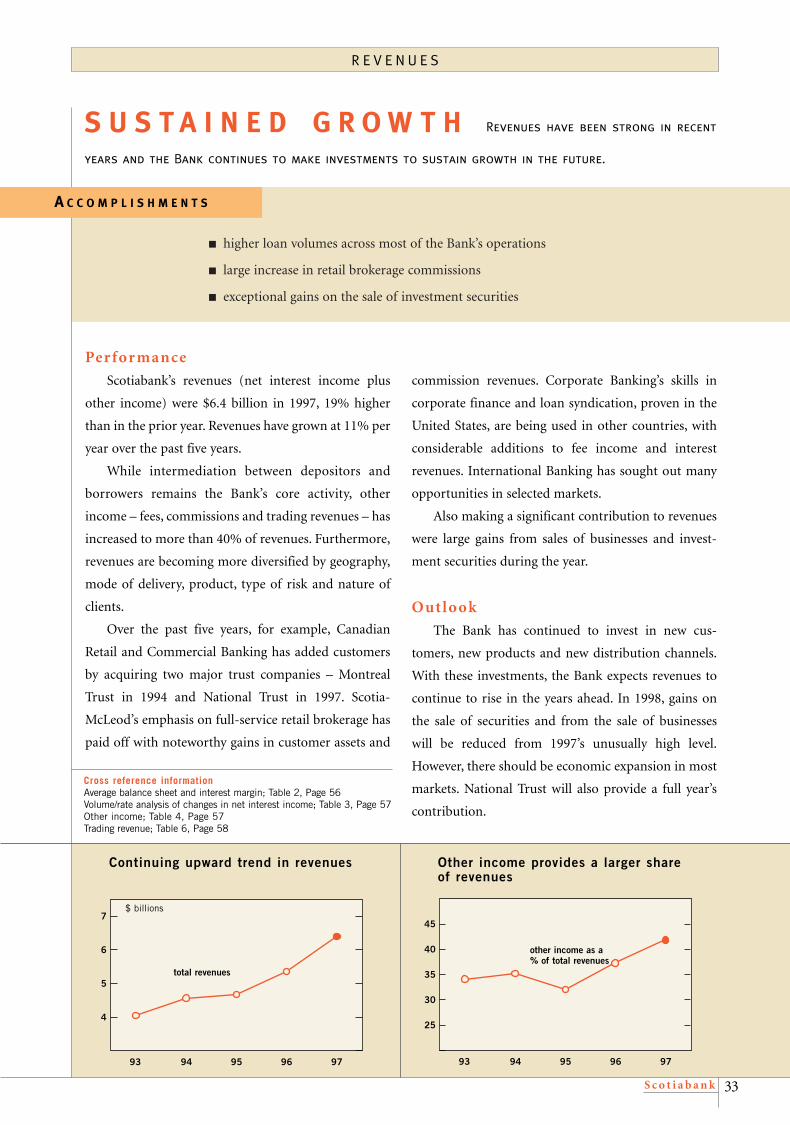
S c o t i a b a n k 33
R E V E N U E S
A C C O M P L I S H M E N T S
Revenues have been strong in recent
years and the Bank continues to make investments to sustain growth in the future.
S U S T A I N E D G R O W T H
■ higher loan volumes across most of the Bank’s operations
■ large increase in retail brokerage commissions
■ exceptional gains on the sale of investment securities
Per for mance
Scotiabank’s revenues (net interest income plus
other income) were $6.4 billion in 1997, 19% higher
than in the prior year. Revenues have grown at 11% per
year over the past five years.
While intermediation between depositors and
borrowers remains the Bank’s core activity, other
income – fees, commissions and trading revenues – has
increased to more than 40% of revenues. Furthermore,
revenues are becoming more diversified by geography,
mode of delivery, product, type of risk and nature of
clients.
Over the past five years, for example, Canadian
Retail and Commercial Banking has added customers
by acquiring two major trust companies – Montreal
Trust in 1994 and National Trust in 1997. Scotia-
McLeod’s emphasis on full-service retail brokerage has
paid off with noteworthy gains in customer assets and
Other income provides a larger shareof revenues
Continuing upward trend in revenues
93 94 95 96 97
4
5
6
7$ billions
93 94 95 96 97
25
30
35
40
45
other income as a% of total revenues
commission revenues. Corporate Banking’s skills in
corporate finance and loan syndication, proven in the
United States, are being used in other countries, with
considerable additions to fee income and interest
revenues. International Banking has sought out many
opportunities in selected markets.
Also making a significant contribution to revenues
were large gains from sales of businesses and invest-
ment securities during the year.
Outlo ok
The Bank has continued to invest in new cus-
tomers, new products and new distribution channels.
With these investments, the Bank expects revenues to
continue to rise in the years ahead. In 1998, gains on
the sale of securities and from the sale of businesses
will be reduced from 1997’s unusually high level.
However, there should be economic expansion in most
markets. National Trust will also provide a full year’s
contribution.
Cross reference informationAverage balance sheet and interest margin; Table 2, Page 56Volume/rate analysis of changes in net interest income; Table 3, Page 57Other income; Table 4, Page 57Trading revenue; Table 6, Page 58
total revenues
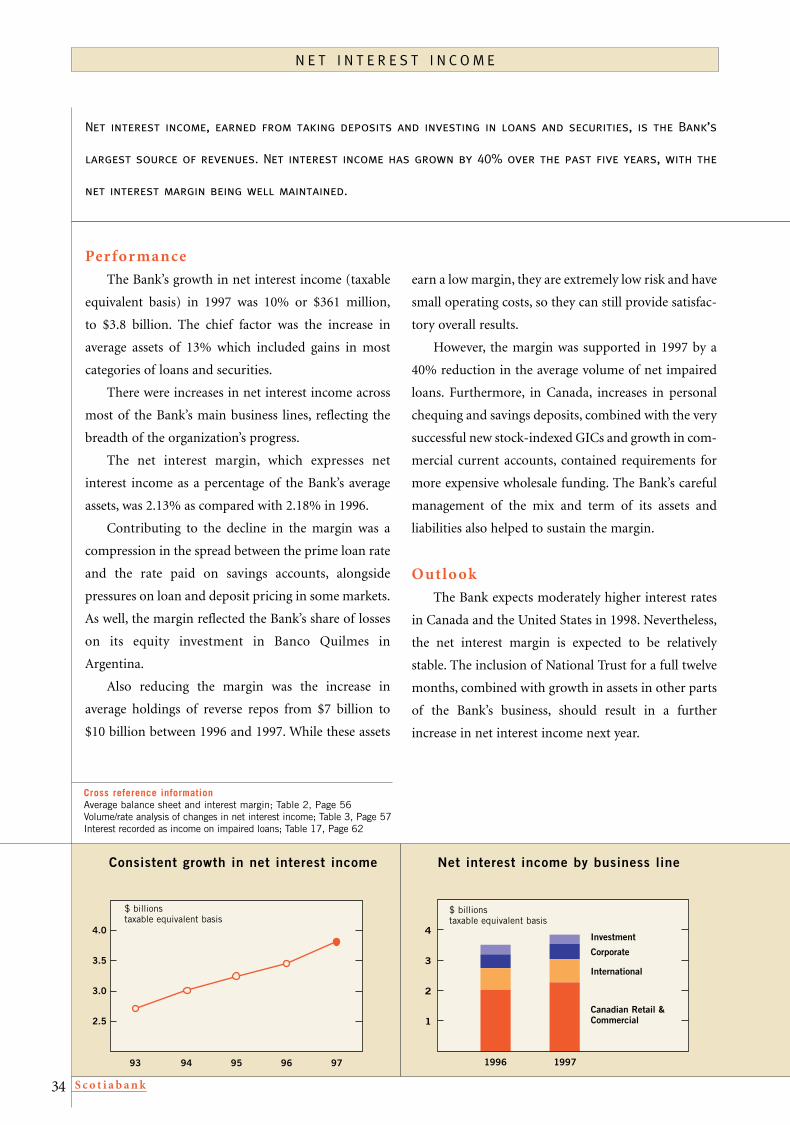
S c o t i a b a n k34
N E T I N T E R E S T I N C O M E
Net interest income, earned from taking deposits and investing in loans and securities, is the Bank’s
largest source of revenues. Net interest income has grown by 40% over the past five years, with the
net interest margin being well maintained.
Per for mance
The Bank’s growth in net interest income (taxable
equivalent basis) in 1997 was 10% or $361 million,
to $3.8 billion. The chief factor was the increase in
average assets of 13% which included gains in most
categories of loans and securities.
There were increases in net interest income across
most of the Bank’s main business lines, reflecting the
breadth of the organization’s progress.
The net interest margin, which expresses net
interest income as a percentage of the Bank’s average
assets, was 2.13% as compared with 2.18% in 1996.
Contributing to the decline in the margin was a
compression in the spread between the prime loan rate
and the rate paid on savings accounts, alongside
pressures on loan and deposit pricing in some markets.
As well, the margin reflected the Bank’s share of losses
on its equity investment in Banco Quilmes in
Argentina.
Also reducing the margin was the increase in
average holdings of reverse repos from $7 billion to
$10 billion between 1996 and 1997. While these assets
Net interest income by business lineConsistent growth in net interest income
93 94 95 96 97
2.5
3.0
3.5
4.0
$ billionstaxable equivalent basis
1
2
3
4
1996 1997
Investment
Canadian Retail & Commercial
International
Corporate
$ billionstaxable equivalent basis
earn a low margin, they are extremely low risk and have
small operating costs, so they can still provide satisfac-
tory overall results.
However, the margin was supported in 1997 by a
40% reduction in the average volume of net impaired
loans. Furthermore, in Canada, increases in personal
chequing and savings deposits, combined with the very
successful new stock-indexed GICs and growth in com-
mercial current accounts, contained requirements for
more expensive wholesale funding. The Bank’s careful
management of the mix and term of its assets and
liabilities also helped to sustain the margin.
Outlo ok
The Bank expects moderately higher interest rates
in Canada and the United States in 1998. Nevertheless,
the net interest margin is expected to be relatively
stable. The inclusion of National Trust for a full twelve
months, combined with growth in assets in other parts
of the Bank’s business, should result in a further
increase in net interest income next year.
Cross reference informationAverage balance sheet and interest margin; Table 2, Page 56Volume/rate analysis of changes in net interest income; Table 3, Page 57Interest recorded as income on impaired loans; Table 17, Page 62
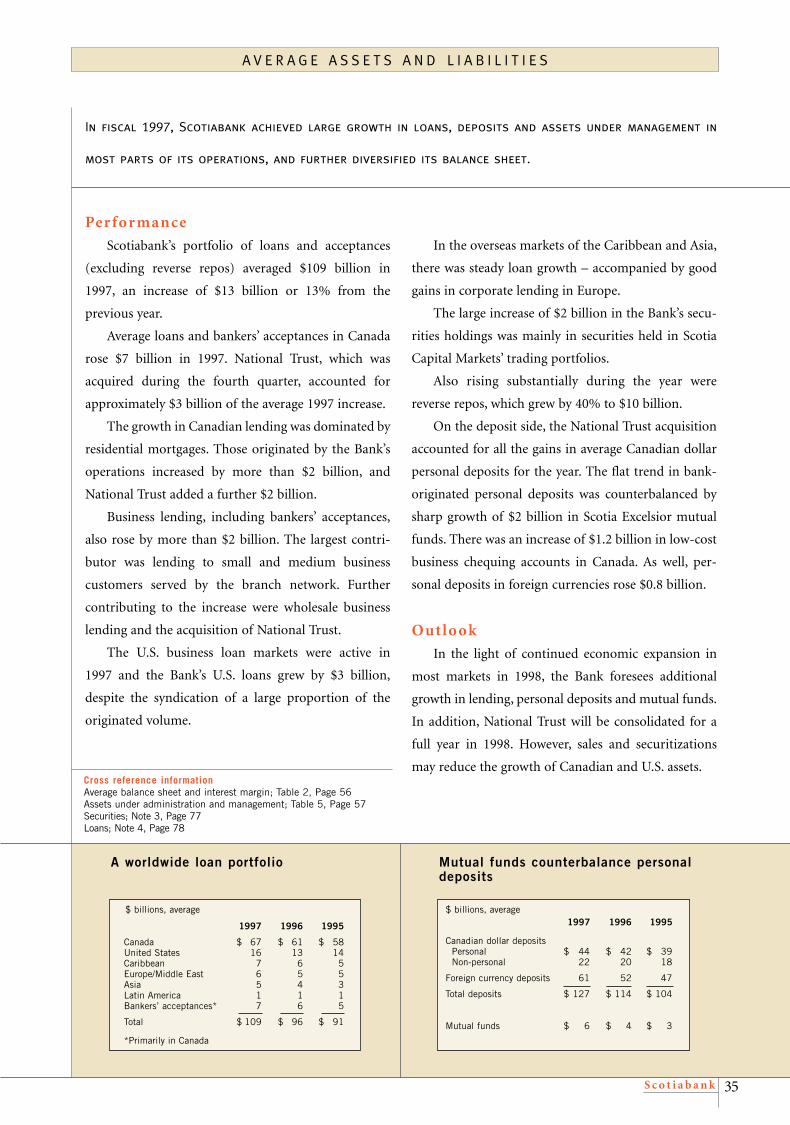
S c o t i a b a n k 35
Per for mance
Scotiabank’s portfolio of loans and acceptances
(excluding reverse repos) averaged $109 billion in
1997, an increase of $13 billion or 13% from the
previous year.
Average loans and bankers’ acceptances in Canada
rose $7 billion in 1997. National Trust, which was
acquired during the fourth quarter, accounted for
approximately $3 billion of the average 1997 increase.
The growth in Canadian lending was dominated by
residential mortgages. Those originated by the Bank’s
operations increased by more than $2 billion, and
National Trust added a further $2 billion.
Business lending, including bankers’ acceptances,
also rose by more than $2 billion. The largest contri-
butor was lending to small and medium business
customers served by the branch network. Further
contributing to the increase were wholesale business
lending and the acquisition of National Trust.
The U.S. business loan markets were active in
1997 and the Bank’s U.S. loans grew by $3 billion,
despite the syndication of a large proportion of the
originated volume.
In the overseas markets of the Caribbean and Asia,
there was steady loan growth – accompanied by good
gains in corporate lending in Europe.
The large increase of $2 billion in the Bank’s secu-
rities holdings was mainly in securities held in Scotia
Capital Markets’ trading portfolios.
Also rising substantially during the year were
reverse repos, which grew by 40% to $10 billion.
On the deposit side, the National Trust acquisition
accounted for all the gains in average Canadian dollar
personal deposits for the year. The flat trend in bank-
originated personal deposits was counterbalanced by
sharp growth of $2 billion in Scotia Excelsior mutual
funds. There was an increase of $1.2 billion in low-cost
business chequing accounts in Canada. As well, per-
sonal deposits in foreign currencies rose $0.8 billion.
Outlo ok
In the light of continued economic expansion in
most markets in 1998, the Bank foresees additional
growth in lending, personal deposits and mutual funds.
In addition, National Trust will be consolidated for a
full year in 1998. However, sales and securitizations
may reduce the growth of Canadian and U.S. assets.
In fiscal 1997, Scotiabank achieved large growth in loans, deposits and assets under management in
most parts of its operations, and further diversified its balance sheet.
A V E R A G E A S S E T S A N D L I A B I L I T I E S
A worldwide loan portfolio
$ billions, average
1997 1996 1995
Canada $ 67 $ 61 $ 58United States 16 13 14Caribbean 7 6 5Europe/Middle East 6 5 5Asia 5 4 3Latin America 1 1 1Bankers’ acceptances* 7 6 5
Total $ 109 $ 96 $ 91
*Primarily in Canada
Mutual funds counterbalance personaldeposits
$ billions, average1997 1996 1995
Canadian dollar depositsPersonal $ 44 $ 42 $ 39Non-personal 22 20 18
Foreign currency deposits 61 52 47
Total deposits $ 127 $ 114 $ 104
Mutual funds $ 6 $ 4 $ 3
Cross reference informationAverage balance sheet and interest margin; Table 2, Page 56Assets under administration and management; Table 5, Page 57Securities; Note 3, Page 77Loans; Note 4, Page 78

S c o t i a b a n k36
O T H E R I N C O M E
The growth in other income – now more than 40% of the Bank’s revenues – reflects new or improved
services, the expansion of the Bank’s customer base, as well as favourable trends in securities markets.
Per for mance
Other income grew substantially in 1997. Even
after excluding gains on the sales of certain non-core
businesses, the gains on the sale of investment securi-
ties and the contribution of $29 million from National
Trust after the acquisition, there was a notable increase
of 14% from last year.
Much of the improvement of 6% in fees for deposit
and payment services came from growth in retail trans-
actions, both from personal customers using Interac
Direct Payment and from merchants using Scotia 2020’s
point-of-sale terminals. Customer demand for the pop-
ular Scotia Value Account increased by 12%. Higher
ABM fees reflected more machines and added services.
The principal factor behind the 9% increase in
investment management and trust fees was mutual
fund revenues. These rose by 60%, mainly because of
growth in mutual funds to $8 billion at year end
(including both Scotia Excelsior and National Trust
funds) and the customer shift to higher fee equity
funds. Investment management and custody fees
declined by 21% because of the sale of the Bank’s
custody business during 1997. Going forward, the
acquisition of National Trust will significantly add to
revenues from personal trust activities.
The increase of 19% in credit fees reflects both the
Bank’s strength in structuring and syndicating whole-
sale credits, and success in building its base of small
and medium commercial customers in Canada.
The large increase of 23% in investment banking
revenues was mainly from a substantial growth of 42%
in retail brokerage and underwriting fees, as investors
and issuers were very active during the year. The Bank
also realized record gains of $366 million on the sale of
investment securities, mainly equities.
Gains of $144 million were also realized from the
sale of certain non-core businesses during the year
(refer to page 32).
Outlo ok
The Bank expects that its revenues from deposit
and payment services, credit fees and investment man-
agement and trust will show steady growth in 1998,
particularly with the addition of National Trust. Invest-
ment banking revenues depend on market conditions,
but the Bank expects a modest increase in 1998. Gains
on the sale of investment securities are expected to be
smaller.
Substantial expansion in other income
93 94 95 96 97
1.0
1.5
2.0
2.5
3.0$ billions1997 & 1995 excl sales of businesses
Diversified sources of other income
other
deposit &paymentservices
investmentmgmt & trust
investmentsecurities
1997 excl gains on sales of businesses
investmentbanking
credit fees
21%14%
33%
16%
10%6%
Cross reference informationOther income; Table 4, Page 57Trading revenue; Table 6, Page 58Reporting of gains and losses on securities; Note 2, Page 76
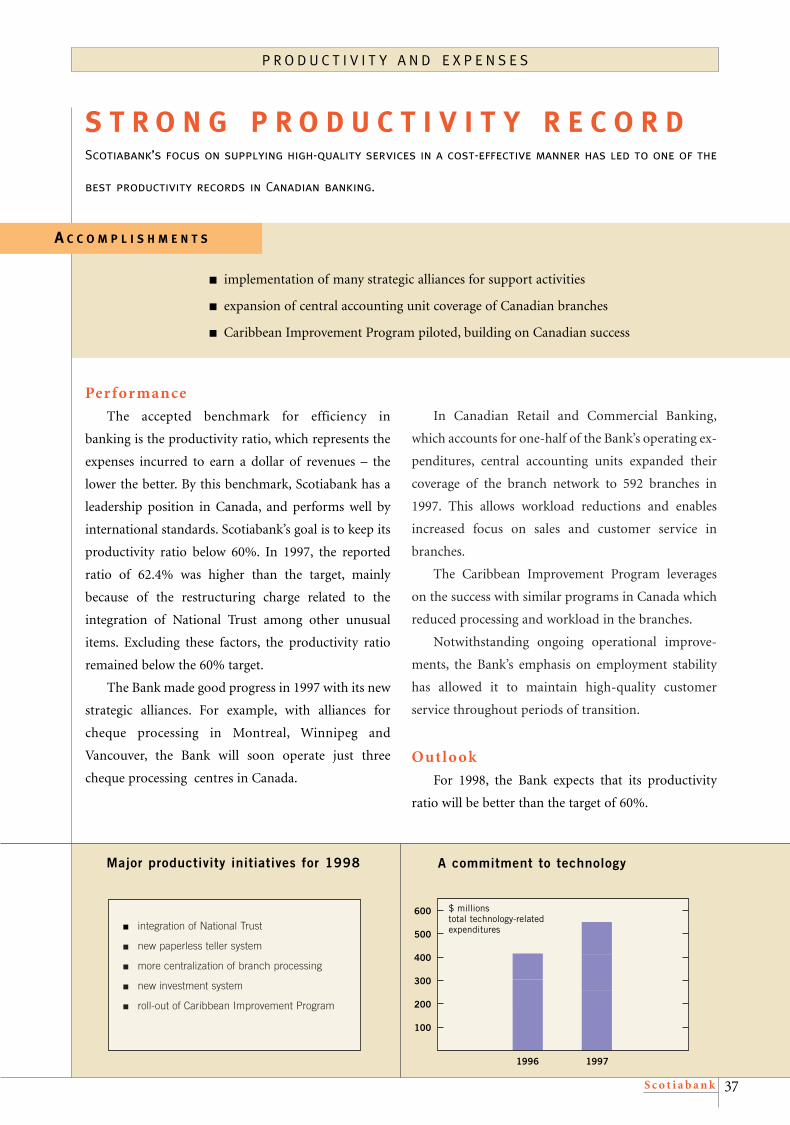
S c o t i a b a n k 37
P R O D U C T I V I T Y A N D E X P E N S E S
Per for mance
The accepted benchmark for efficiency in
banking is the productivity ratio, which represents the
expenses incurred to earn a dollar of revenues – the
lower the better. By this benchmark, Scotiabank has a
leadership position in Canada, and performs well by
international standards. Scotiabank’s goal is to keep its
productivity ratio below 60%. In 1997, the reported
ratio of 62.4% was higher than the target, mainly
because of the restructuring charge related to the
integration of National Trust among other unusual
items. Excluding these factors, the productivity ratio
remained below the 60% target.
The Bank made good progress in 1997 with its new
strategic alliances. For example, with alliances for
cheque processing in Montreal, Winnipeg and
Vancouver, the Bank will soon operate just three
cheque processing centres in Canada.
A C C O M P L I S H M E N T S
■ implementation of many strategic alliances for support activities
■ expansion of central accounting unit coverage of Canadian branches
■ Caribbean Improvement Program piloted, building on Canadian success
A commitment to technology
100
200
300
400
500
600
1996 1997
$ millionstotal technology-related expenditures
Major productivity initiatives for 1998
Scotiabank’s focus on supplying high-quality services in a cost-effective manner has led to one of the
best productivity records in Canadian banking.
S T R O N G P R O D U C T I V I T Y R E C O R D
■ integration of National Trust
■ new paperless teller system
■ more centralization of branch processing
■ new investment system
■ roll-out of Caribbean Improvement Program
In Canadian Retail and Commercial Banking,
which accounts for one-half of the Bank’s operating ex-
penditures, central accounting units expanded their
coverage of the branch network to 592 branches in
1997. This allows workload reductions and enables
increased focus on sales and customer service in
branches.
The Caribbean Improvement Program leverages
on the success with similar programs in Canada which
reduced processing and workload in the branches.
Notwithstanding ongoing operational improve-
ments, the Bank’s emphasis on employment stability
has allowed it to maintain high-quality customer
service throughout periods of transition.
Outlo ok
For 1998, the Bank expects that its productivity
ratio will be better than the target of 60%.

S c o t i a b a n k38
N O N - I N T E R E S T E X P E N S E S
Fiscal 1997 was a year when expense increases were driven by large business growth in activities where
performance-based compensation is important – and by spending on new initiatives in several key areas.
Expense growth driven by performancecompensation and investments
Employee growth was mainly in customerservice positions
1
2
3
4
93 94 95 96 97
$ billions, excl 1994 special charges & 1997 restructuring provision
other
performancecompensation
premises &equipment
000s, full-time equivalent staff, October 31
1997 1996 1995
Cdn Retail & Commercial* 23.7 20.1 19.5Corporate 1.8 1.9 1.8Investment 3.7 3.4 3.3International 5.9 5.8 5.5Subtotal 35.1 31.2 30.1Other 3.5 3.4 3.6Total 38.6 34.6 33.7
*includes call centres and, in 1997, National Trust
other compensation
Per for mance
Performance-based compensation, higher business
volumes, the Bank’s many initiatives, and a restructur-
ing charge relating to the integration of National Trust
were the chief factors behind the large growth in non-
interest expenses in 1997.
Growth in remuneration and benefits was 15% in
total and 14% excluding National Trust. Half of the
latter increase came from higher performance-based
compensation. The largest contributor to such pay-
ments was Scotia Capital Markets, where the increase
in performance-based compensation was tied to the
strong growth in revenues. Also contributing were
incentive programs based on the price of the Bank’s
shares, and the broadly based employee incentive plan.
In addition, there were new personnel costs for the
joint venture for managing pensions in Mexico.
There were 4,056 employees added during the year,
including 3,440 from National Trust. The balance of
the increase in Canada was chiefly in retail sales posi-
tions, commercial account management and in tele-
phone call centres. Higher employment in Investment
Banking was mainly the result of additional personal
investment executives, following the strategy to expand
the Bank’s retail presence. International growth was
from new branches, higher volumes and acquisitions.
The 17% increase in premises and equipment
spending arose mainly from very large technology
expenditures, including new initiatives, alternate
delivery channels and depreciation on technology
investments.
The increases in the other categories of expenses
were widespread, including advertising, training and
new initiatives. Business and capital taxes and deposit
insurance also rose. Total taxes on the Bank were
$1.2 billion in 1997, as compared with $1.1 billion in
1996. The level of bank taxation remains among the
highest of all Canadian industries.
Also included in expenses was a restructuring
charge of $250 million relating to the integration
of National Trust and a write-off of goodwill of
$26 million.
Outlo ok
Excluding the restructuring provision in 1997, the
Bank expects lower growth in non-interest expenses in
the coming year, assuming a steady increase in business
volumes and low inflation in North America.
Cross reference informationNon-interest expenses; Table 7, Page 58Direct and indirect taxes; Table 8, Page 58

S c o t i a b a n k 39
SCOTIABANK’S RISK
MANAGEMENT PRO CESSES
Risk management is given top priority throughout
the Scotiabank organization. Active, hands-on senior
management play a key role in the evaluation and
management of all risks. Management is supported by
a comprehensive structure of independent controls,
review, reporting and audit processes. Material risks are
subject to prudent constraints and are properly
measured, reported and acknowledged.
Responsibility for the Bank’s risk management
policies and level of risk assumed, lies with the Board
of Directors. The Board charges management with
developing, presenting and implementing these policies.
On a daily basis, senior management keeps in close
contact with line units and receives reports covering all
aspects of operations. Major credit and investment
decisions require direct senior management approval.
To ensure a thorough and objective analysis of all
risk factors, extensive reporting, control and review
processes are conducted independently from the busi-
ness lines, by middle and back offices. New products
and related systems, development of policies and
procedures, and review of limits and controls are
subject to independent analysis by the relevant risk and
policy departments prior to approval by executive
management. All policies, controls and limits are
designed to ensure that no single event, whether
related to a currency, market, position or portfolio,
customer, product, industry, or geographic area, will
adversely affect the well-being of the Bank.
Periodic reviews of all aspects of the Bank’s
business and management information systems groups
are conducted by internal Audit and Compliance
Departments. Finally, all procedures and policies are
subject to ongoing review by regulatory bodies.
Pro cess improvements
During 1997, enhancements were made to the risk
management processes, accompanied by substantial
investment in new technology, in order to keep pace
with changes in global product offerings and emerging
risk patterns. Risk management staffing levels were
also increased significantly to improve the quality of
testing, control and risk administration.
Outlo ok
Scotiabank is committed to the continued
development of its risk management processes. With
continued focus on risk management, Scotiabank is
well-positioned to take advantage of growth and
opportunities in its key markets.
Risk management is a cornerstone of prudent
banking practice. At Scotiabank, all levels of management play an active role in the evaluation and
management of the risks the bank faces.
A C O R N E R S T O N E
R I S K M A N A G E M E N T
A C C O M P L I S H M E N T S
■ strengthened risk measurement and management processes
■ devoted more people and technology to risk management processes

S c o t i a b a n k40
All aspects of the risk management processes are
reviewed on a regular basis by committees with cross-
departmental representation drawn from executive and
senior line management. The key committees are
described below.
Risk Policy Committe e
Consisting of the Chief Executive Officer, President
and other senior executives, the Committee reviews all
large risk exposures, ensures wide portfolio diversifica-
tion and establishes risk policies reflecting business
priorities.
S enior Credit Committe es
Three Senior Credit Committees representing
Canadian Commercial Credit, International Banking,
and Corporate and Investment Banking, are responsi-
ble for the adjudication of credits within prescribed
limits, and establishing the operating rules and guide-
lines for the implementation of credit policies.
Mar ket Risk Management and Policy
Committee
This Committee is chaired by one of the Bank’s
senior credit officers and includes the heads of trading
and risk management. It reviews and evaluates all
aspects of the trading process including the initiation
of new products, development of market risk policies
and practices, and setting limits.
Liabil i t y Committee
Consisting of the Chief Executive Officer, President
and other senior executives, the Liability Committee
meets weekly to appraise market trends, economic and
political developments, and to provide global strategic
direction in the management of interest rate risk,
liquidity risk, and trading and investment portfolio
decisions.
Scot ia Capital Mar ke ts Risk
Committee
This Committee is chaired by the Chairman of
Scotia Capital Markets. It includes heads of trading, as
well as representatives from Risk Management and
Control. It meets weekly to assess and monitor overall
principal risk, risk control mechanisms, credit risk and
compliance issues.
R I S K M A N A G E M E N T

S c o t i a b a n k 41
Credit pro cesses
Scotiabank’s credit disciplines are based on a divi-
sion of authority, a centralized credit review system, a
committee system for dealing with all major exposures,
and periodic independent review by the Audit
Department.
Banking officers, who have client contact, develop
and structure individual proposals. Each proposal is
adjudicated by a credit department which analyzes
the financial strength of the customer and the risks
inherent in the proposals. All exceptions to the credit
policies of the Bank must be referred to a Senior Credit
Committee for its decision or recommendation to
the Risk Policy Committee. Higher risk exposures
are subject to mandatory referral to a Senior Credit
Committee. These committees are composed of senior
officers of both credit and banking, bringing a range
of skills and backgrounds to bear on decisions.
The Bank uses a risk rating system to quantify and
evaluate proposed credits in order to assist officers in
understanding the risks inherent in credit proposals
and, if they are acceptable, to ensure appropriate
returns. In this analytical process, the Bank is particu-
larly sensitive to the risks posed to credit quality by
environmental exposures.
At least annually, banking officers meet formally
with each client to review their financial affairs and to
Diversification by geography
Canada
Caribbean
Asia
Europe/Middle East
USA
loans & acceptances, excl reverse reposSeptember 1997
70%
1%
4%
5%5%
15%
Latin America
C R E D I T R I S K
Credit quality is a core competency at Scotiabank and results from well-defined strategies for
controlling credit risk.
assess the appropriateness of their credit requirements.
The results are formalized into a presentation which
is adjudicated in the same manner as a new credit.
Where unusual risks exist, credits are reviewed more
frequently. In this way, the Bank remains fully aware of
customers’ risk profiles. Risk ratings are reassessed
with each credit presentation or review. These indivi-
dual risk ratings are the input for a risk rating system
across the portfolio.
Credit lines for off-balance sheet instruments
such as foreign exchange and swap contracts, letters of
credit and guarantee, are managed as an integral part
of this same process.
The Bank is continually striving to develop more
effective and efficient means of assessing and managing
risk. During the year, the Bank developed a statistically
based, credit risk scoring model for smaller commer-
cial and single proprietor businesses in Canada. This
program, which is now in the pilot-testing phase, is
designed to shorten the turnaround time for credit
approvals while ensuring greater consistency and
objectivity in risk assessment.
Retail credits are normally assessed and authorized
in branches within lending criteria established by the
Bank. Computer-driven credit scoring systems ensure
credit policies are applied consistently and objectively.
Diversification by borrowing sector
business
personal
financial& gov’t
loans & acceptances, excl reverse reposSeptember 1997
residentialmortgage
15%
34%
46%
5%
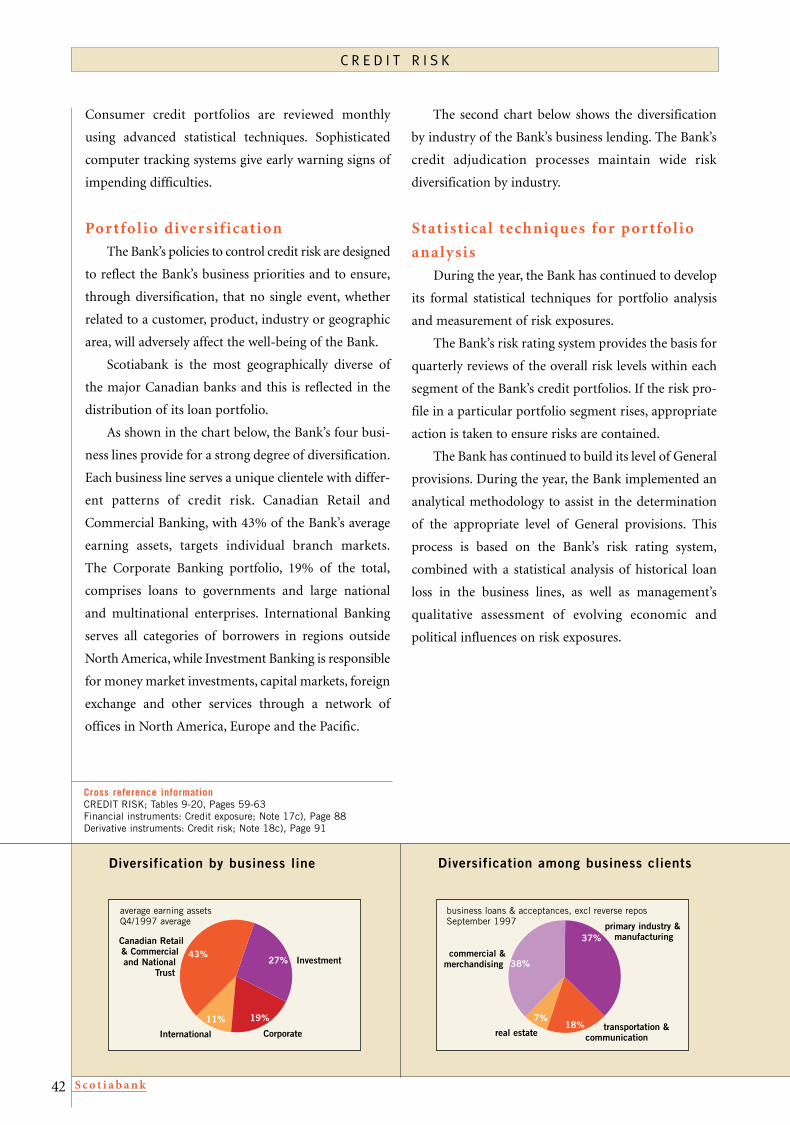
S c o t i a b a n k42
Diversification among business clients
transportation & communication
primary industry &manufacturing
commercial &merchandising
7%
38%
37%
18%
Consumer credit portfolios are reviewed monthly
using advanced statistical techniques. Sophisticated
computer tracking systems give early warning signs of
impending difficulties.
Por t fol io diversif icat ion
The Bank’s policies to control credit risk are designed
to reflect the Bank’s business priorities and to ensure,
through diversification, that no single event, whether
related to a customer, product, industry or geographic
area, will adversely affect the well-being of the Bank.
Scotiabank is the most geographically diverse of
the major Canadian banks and this is reflected in the
distribution of its loan portfolio.
As shown in the chart below, the Bank’s four busi-
ness lines provide for a strong degree of diversification.
Each business line serves a unique clientele with differ-
ent patterns of credit risk. Canadian Retail and
Commercial Banking, with 43% of the Bank’s average
earning assets, targets individual branch markets.
The Corporate Banking portfolio, 19% of the total,
comprises loans to governments and large national
and multinational enterprises. International Banking
serves all categories of borrowers in regions outside
North America, while Investment Banking is responsible
for money market investments, capital markets, foreign
exchange and other services through a network of
offices in North America, Europe and the Pacific.
The second chart below shows the diversification
by industry of the Bank’s business lending. The Bank’s
credit adjudication processes maintain wide risk
diversification by industry.
Stat ist ical techniques for p or t fol io
analysis
During the year, the Bank has continued to develop
its formal statistical techniques for portfolio analysis
and measurement of risk exposures.
The Bank’s risk rating system provides the basis for
quarterly reviews of the overall risk levels within each
segment of the Bank’s credit portfolios. If the risk pro-
file in a particular portfolio segment rises, appropriate
action is taken to ensure risks are contained.
The Bank has continued to build its level of General
provisions. During the year, the Bank implemented an
analytical methodology to assist in the determination
of the appropriate level of General provisions. This
process is based on the Bank’s risk rating system,
combined with a statistical analysis of historical loan
loss in the business lines, as well as management’s
qualitative assessment of evolving economic and
political influences on risk exposures.
C R E D I T R I S K
Cross reference informationCREDIT RISK; Tables 9-20, Pages 59-63Financial instruments: Credit exposure; Note 17c), Page 88Derivative instruments: Credit risk; Note 18c), Page 91
Diversification by business line
Investment
Canadian Retail& Commercialand National
Trust
43%
19%
27%
11%
average earning assetsQ4/1997 average
business loans & acceptances, excl reverse reposSeptember 1997
Corporate real estateInternational
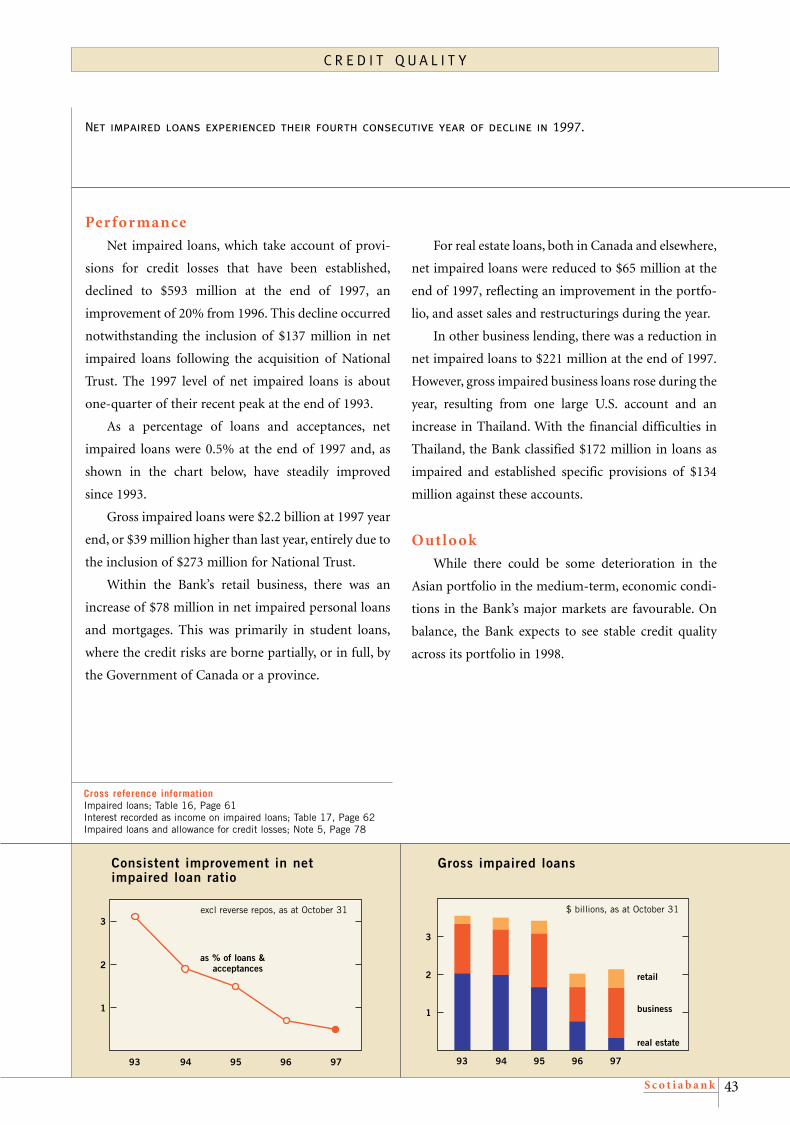
S c o t i a b a n k 43
C R E D I T Q U A L I T Y
Per for mance
Net impaired loans, which take account of provi-
sions for credit losses that have been established,
declined to $593 million at the end of 1997, an
improvement of 20% from 1996. This decline occurred
notwithstanding the inclusion of $137 million in net
impaired loans following the acquisition of National
Trust. The 1997 level of net impaired loans is about
one-quarter of their recent peak at the end of 1993.
As a percentage of loans and acceptances, net
impaired loans were 0.5% at the end of 1997 and, as
shown in the chart below, have steadily improved
since 1993.
Gross impaired loans were $2.2 billion at 1997 year
end, or $39 million higher than last year, entirely due to
the inclusion of $273 million for National Trust.
Within the Bank’s retail business, there was an
increase of $78 million in net impaired personal loans
and mortgages. This was primarily in student loans,
where the credit risks are borne partially, or in full, by
the Government of Canada or a province.
For real estate loans, both in Canada and elsewhere,
net impaired loans were reduced to $65 million at the
end of 1997, reflecting an improvement in the portfo-
lio, and asset sales and restructurings during the year.
In other business lending, there was a reduction in
net impaired loans to $221 million at the end of 1997.
However, gross impaired business loans rose during the
year, resulting from one large U.S. account and an
increase in Thailand. With the financial difficulties in
Thailand, the Bank classified $172 million in loans as
impaired and established specific provisions of $134
million against these accounts.
Outlo ok
While there could be some deterioration in the
Asian portfolio in the medium-term, economic condi-
tions in the Bank’s major markets are favourable. On
balance, the Bank expects to see stable credit quality
across its portfolio in 1998.
Net impaired loans experienced their fourth consecutive year of decline in 1997.
93 94 95 96 97
1
2
3
Gross impaired loansConsistent improvement in netimpaired loan ratio
1
2
3
93 94 95 96 97
excl reverse repos, as at October 31
as % of loans & acceptances
$ billions, as at October 31
real estate
business
retail
Cross reference informationImpaired loans; Table 16, Page 61Interest recorded as income on impaired loans; Table 17, Page 62Impaired loans and allowance for credit losses; Note 5, Page 78
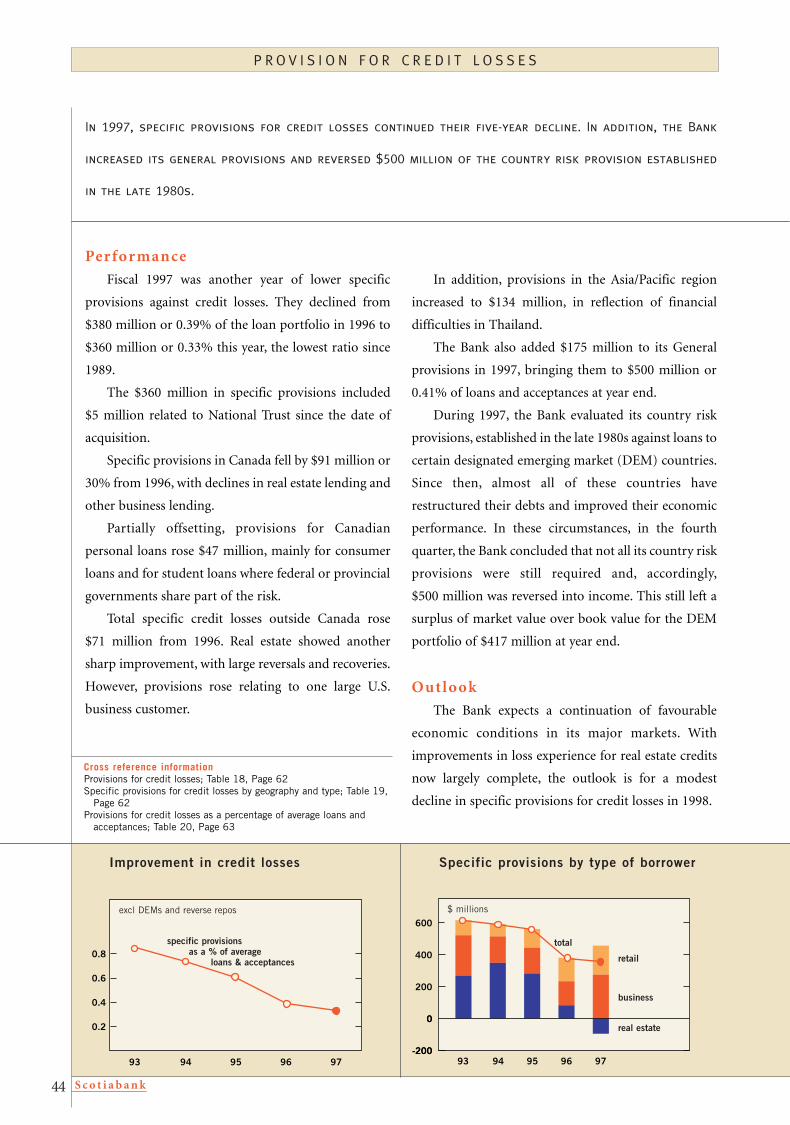
S c o t i a b a n k44
P R O V I S I O N F O R C R E D I T L O S S E S
In 1997, specific provisions for credit losses continued their five-year decline. In addition, the Bank
increased its general provisions and reversed $500 million of the country risk provision established
in the late 1980s.
Per for mance
Fiscal 1997 was another year of lower specific
provisions against credit losses. They declined from
$380 million or 0.39% of the loan portfolio in 1996 to
$360 million or 0.33% this year, the lowest ratio since
1989.
The $360 million in specific provisions included
$5 million related to National Trust since the date of
acquisition.
Specific provisions in Canada fell by $91 million or
30% from 1996, with declines in real estate lending and
other business lending.
Partially offsetting, provisions for Canadian
personal loans rose $47 million, mainly for consumer
loans and for student loans where federal or provincial
governments share part of the risk.
Total specific credit losses outside Canada rose
$71 million from 1996. Real estate showed another
sharp improvement, with large reversals and recoveries.
However, provisions rose relating to one large U.S.
business customer.
Specific provisions by type of borrower
93 94 95 96 97
0.2
0.4
0.6
0.8
excl DEMs and reverse repos
specific provisionsas a % of average
loans & acceptances
Improvement in credit losses
-200
0
-200
0
200
400
600
93 94 95 96 97
$ millions
real estate
business
retail
total
In addition, provisions in the Asia/Pacific region
increased to $134 million, in reflection of financial
difficulties in Thailand.
The Bank also added $175 million to its General
provisions in 1997, bringing them to $500 million or
0.41% of loans and acceptances at year end.
During 1997, the Bank evaluated its country risk
provisions, established in the late 1980s against loans to
certain designated emerging market (DEM) countries.
Since then, almost all of these countries have
restructured their debts and improved their economic
performance. In these circumstances, in the fourth
quarter, the Bank concluded that not all its country risk
provisions were still required and, accordingly,
$500 million was reversed into income. This still left a
surplus of market value over book value for the DEM
portfolio of $417 million at year end.
Outlook
The Bank expects a continuation of favourable
economic conditions in its major markets. With
improvements in loss experience for real estate credits
now largely complete, the outlook is for a modest
decline in specific provisions for credit losses in 1998.
Cross reference informationProvisions for credit losses; Table 18, Page 62Specific provisions for credit losses by geography and type; Table 19,
Page 62Provisions for credit losses as a percentage of average loans and
acceptances; Table 20, Page 63

S c o t i a b a n k 45
Asset Liability Management (ALM) refers to the
process whereby interest rate and liquidity risks are
measured, managed and controlled.
INTEREST RATE RISK
Interest rate risk arises when there is a mismatch
between positions which are subject to interest rate
adjustment within a specified period. The most impor-
tant source of interest rate risk is the Bank’s lending,
funding and investment activities, where fluctuations
in interest rates are reflected in interest margins and
earnings. Interest rate risk also arises in trading activi-
ties, where changes in interest rates may cause fluctua-
tions in portfolio market values (refer to Trading Risk
on page 48).
For the purposes of interest rate risk management,
the Bank has four distinct operations:
Domest ic banking
The Bank’s domestic banking operations offer a
wide range of funding and investment products to
retail and commercial customers. The variety of matu-
rities and options embedded in these products, cause a
structural gap within the domestic banking portfolio
that has increased the complexity of interest rate risk
management. The Liability Committee manages this
interest rate risk, including embedded options expo-
sure, using simulation modelling and scenario analysis
which are applied on a regular basis.
Inter nat ional br anches
Individually, most international branches are
relatively small. Regional treasury functions are subject
to strict interest rate risk limits, determined centrally.
Within each operation, exposure is generally managed
locally by currency and regularly reviewed on a consol-
idated basis by executive management.
Invest ment and emer g ing mar ke t
b ond p or t fol ios
These portfolios of bonds and other investment
securities are managed with a longer-term perspective.
The Liability Committee reviews these security hold-
ings at least weekly.
Wholesale banking
The Bank’s wholesale money market desks imple-
ment the prescribed interest rate risk management
strategy. Portfolios undergo regular stress testing, and
interest rate gaps are carefully monitored and adjusted
for changing market conditions. In addition, the
Liability Committee reviews global positions in major
currencies on a weekly basis.
Gap management
The interest rate gap is a common form of interest
rate sensitivity measurement. A liability gap is created
when more liabilities than assets are subject to rate
changes during a prescribed time period. The chart on
page 46 shows trends in the one-year liability gaps.
Scotiabank strives to achieve a balance between
reducing risk to earnings from adverse movements in
interest rates, and enhancing net interest income
through correct anticipation of the direction and
extent of interest rate changes.
During 1997, the one-year Canadian dollar liabili-
ty gap remained at about the same level as in 1996,
reflecting mortgage customer preferences for longer
terms and the Bank maintaining its mid-term securities
portfolio to benefit from the favourable interest rate
environment. At year end, this liability gap fell to
$3.0 billion, following the securitization of $1.5 billion
of consumer auto loans, as well as the inclusion of an
asset gap in National Trust.
MEASUREMENT, MANAGEMENT AND CONTROL
R I S K M A N A G E M E N T – A S S E T L I A B I L I T Y M A N A G E M E N T
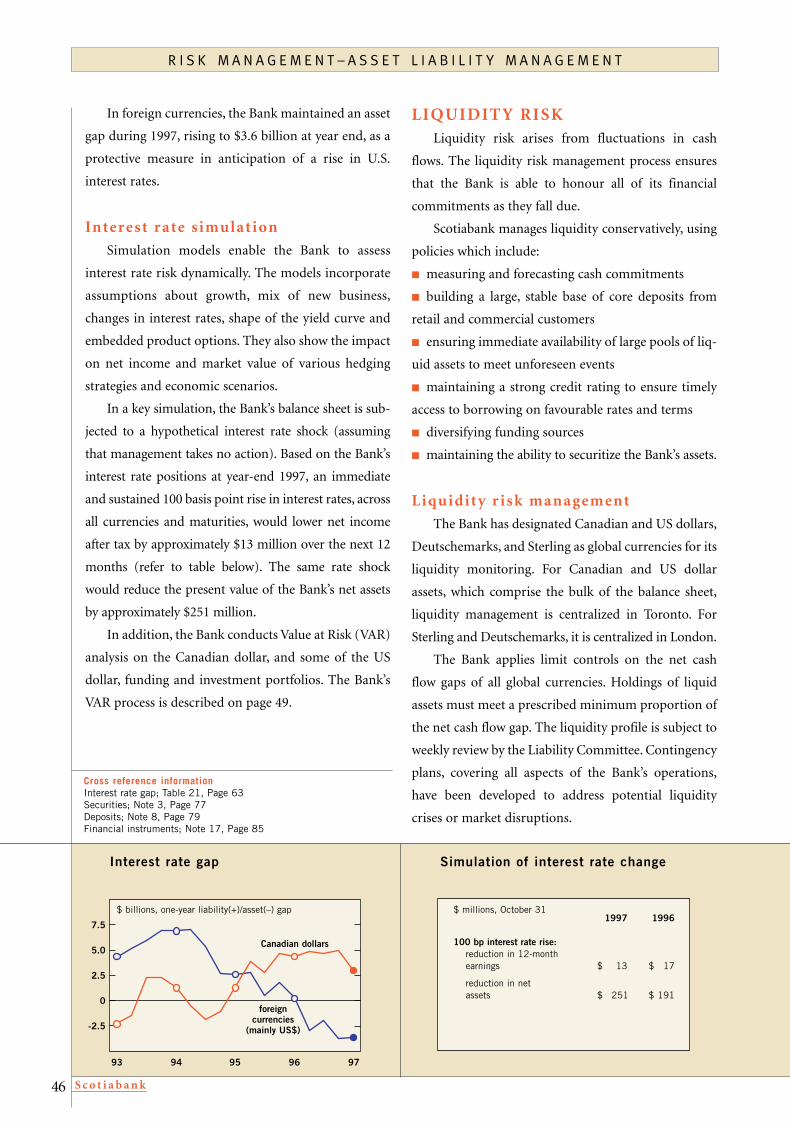
S c o t i a b a n k46
In foreign currencies, the Bank maintained an asset
gap during 1997, rising to $3.6 billion at year end, as a
protective measure in anticipation of a rise in U.S.
interest rates.
Interest r ate s imulat ion
Simulation models enable the Bank to assess
interest rate risk dynamically. The models incorporate
assumptions about growth, mix of new business,
changes in interest rates, shape of the yield curve and
embedded product options. They also show the impact
on net income and market value of various hedging
strategies and economic scenarios.
In a key simulation, the Bank’s balance sheet is sub-
jected to a hypothetical interest rate shock (assuming
that management takes no action). Based on the Bank’s
interest rate positions at year-end 1997, an immediate
and sustained 100 basis point rise in interest rates, across
all currencies and maturities, would lower net income
after tax by approximately $13 million over the next 12
months (refer to table below). The same rate shock
would reduce the present value of the Bank’s net assets
by approximately $251 million.
In addition, the Bank conducts Value at Risk (VAR)
analysis on the Canadian dollar, and some of the US
dollar, funding and investment portfolios. The Bank’s
VAR process is described on page 49.
LIQUIDIT Y RISKLiquidity risk arises from fluctuations in cash
flows. The liquidity risk management process ensures
that the Bank is able to honour all of its financial
commitments as they fall due.
Scotiabank manages liquidity conservatively, using
policies which include:
■ measuring and forecasting cash commitments
■ building a large, stable base of core deposits from
retail and commercial customers
■ ensuring immediate availability of large pools of liq-
uid assets to meet unforeseen events
■ maintaining a strong credit rating to ensure timely
access to borrowing on favourable rates and terms
■ diversifying funding sources
■ maintaining the ability to securitize the Bank’s assets.
Liquidit y r isk management
The Bank has designated Canadian and US dollars,
Deutschemarks, and Sterling as global currencies for its
liquidity monitoring. For Canadian and US dollar
assets, which comprise the bulk of the balance sheet,
liquidity management is centralized in Toronto. For
Sterling and Deutschemarks, it is centralized in London.
The Bank applies limit controls on the net cash
flow gaps of all global currencies. Holdings of liquid
assets must meet a prescribed minimum proportion of
the net cash flow gap. The liquidity profile is subject to
weekly review by the Liability Committee. Contingency
plans, covering all aspects of the Bank’s operations,
have been developed to address potential liquidity
crises or market disruptions.
93 94 95 96 97
-2.5
0
2.5
5.0
7.5
Simulation of interest rate changeInterest rate gap
R I S K M A N A G E M E N T – A S S E T L I A B I L I T Y M A N A G E M E N T
1997 1996
100 bp interest rate rise:reduction in 12-month earnings $ 13 $ 17
reduction in net assets $ 251 $ 191
$ millions, October 31$ billions, one-year liability(+)/asset(–) gap
foreign currencies
(mainly US$)
Canadian dollars
Cross reference informationInterest rate gap; Table 21, Page 63Securities; Note 3, Page 77Deposits; Note 8, Page 79Financial instruments; Note 17, Page 85

S c o t i a b a n k 47
R I S K M A N A G E M E N T – A S S E T L I A B I L I T Y M A N A G E M E N T
Large surpluses on investment securities
$ millions
fying the funding of the Bank’s assets.
S ecur it ies
To sustain operations in the event of unexpected
disruptions, the Bank maintains large holdings of high-
ly liquid assets. As at October 31, 1997, liquid assets
were $40 billion, representing 20% of total assets.
These liquid assets were comprised of securities of the
governments of Canada and the United States and
other high-quality issuers (54%), deposits with other
banks (43%) and cash (3%).
Total securities holdings as at October 31, 1997
were $28 billion, held in two portfolios, trading and
investment. The market value of the trading portfolio
at year end was $11 billion, having increased by 8% due
to the growth in securities markets, and higher volumes
held as hedges in the Bank’s derivatives portfolio.
The investment portfolio, which is carried at cost
(net of impairment writedowns and the country risk
provision), includes securities that are held for liquidity
and longer-term investment. At year end, investment
securities totalled $17 billion. After associated hedges,
their market value exceeded carrying value by
$817 million (refer to table below).
Pledg ing
The Bank pledges assets to support its participation
in certain markets and business activities. As at
October 31, 1997 total assets pledged were $20 billion.
Repos and securities borrowing account for $19 billion
of pledging activity.Cross reference informationRegulatory Capital; Table 22, Page 63Securities; Note 3, Page 77
In addition, the Bank conducts scenario testing
programs to evaluate its liquidity assumptions and
ability to sustain operations under duress. These tests
are consistent with regulatory requirements. Scenario
testing includes a modelling exercise which indicates
the length of time the Bank can sustain its operations
before liquidity reserves will be exhausted.
Funding
The principal sources of funding are capital, core
deposits from retail and commercial clients, and
wholesale deposits raised in the interbank and com-
mercial markets. Diversification of funding sources is a
cornerstone of prudent liquidity management, and is
achieved by applying a number of limits and controls.
Scotiabank’s extensive domestic and international
branch network facilitates this diversification.
Core funds, primarily capital and core deposits,
total $95 billion, up from $76 billion in 1996 (refer to
chart below). As in previous years, half of total funding
consists of core funds, thereby providing considerable
stability to the Bank’s liquidity.
Of particular note, National Trust added $12 billion
in core deposits in 1997. These deposits, similar to those
in the Bank’s branch operations, provide a very stable
base of funding since they are sourced from thousands
of customers widely dispersed across Canada.
In late 1997, the Bank securitized $1.5 billion in
auto loans through ATLAS Auto Loan Funding Trust
1997-A. This provides an additional method of diversi-
Surplus of marketover book value
designated emergingmarket (DEM) securities
past due interest bonds $ 297
other DEM securities 75subtotal $ 372
other issuers 445
total $ 817
DEM loans $ 45
Substantial core funds
20
40
60
80
93 94 95 96 97
$ billions, October 31

S c o t i a b a n k48
Market risk refers to the uncertainty of future
earnings resulting from changes in interest rates,
foreign exchange rates, market prices and volatilities.
The Bank assumes market risk from consumer and
corporate loans, position taking, and trading and
investment activities.
The strategy for controlling market risk includes:
■ direct involvement of experienced line management
■ stringent controls and limits
■ strict segregation of front and back office duties
■ comprehensive daily reporting of positions
■ regular independent review of all controls and limits
■ rigorous testing and auditing of all pricing, trading,
risk management and accounting systems.
The policies and procedures applied to each
element of market risk are described in the preceding
discussion of the Asset Liability Management process,
and the following sections on Trading Risk, Foreign
Exchange Risk, Equities Risk and Commodities Risk.
TRADING RISK
Continued enhancement of the Bank’s trading risk
management systems and processes has kept pace with
market developments.
Trading portfolios are managed with the intent to
buy and sell financial instruments over a short period
of time, rather than hold positions for investment. The
Bank’s trading activity is customer-focussed, but also
includes a proprietary component.
Tr ading r isk management
Trading management participates in the daily
trading process, in both a supervisory and trading
capacity. Executive management keeps in close contact
with front-line staff in the Bank’s major trading centres.
New products and trading processes are also subject to
the approval of executive management.
Management’s role is supported by extensive limits
and management information systems. Explicit limits
are established by counterparty, currency, instrument,
position and term. All limits are reviewed and
approved by the Market Risk Management and Policy
Committee.
The back office and middle office independently
review and report on various aspects of trading activity.
They provide daily reports of profit and loss, limit
overruns and compliance. These are circulated to all
appropriate departments and executive management
for evaluation.
Pricing and hedging for most trading activity are
done on a real time basis, and portfolios are marked to
market at least daily.
Rigorous analysis and testing programmes are
applied to measure risk, and to verify accuracy of vari-
ous controls and limits. These include stress testing,
sensitivity analysis, and the daily application of
Scotiabank’s Value at Risk system.
R I S K M A N A G E M E N T – M A R K E T R I S K
of the Bank’s
market risk processes has further strengthened the management, reporting, limits and testing
that the Bank applies to control market risk.
C O N T I N U E D E N H A N C E M E N T
A C C O M P L I S H M E N T S
■ implemented an improved calculation of the Value at Risk (VAR)
■ expanded the application of the VAR to all significant trading portfolios
■ established middle office staff in London, New York and Singapore
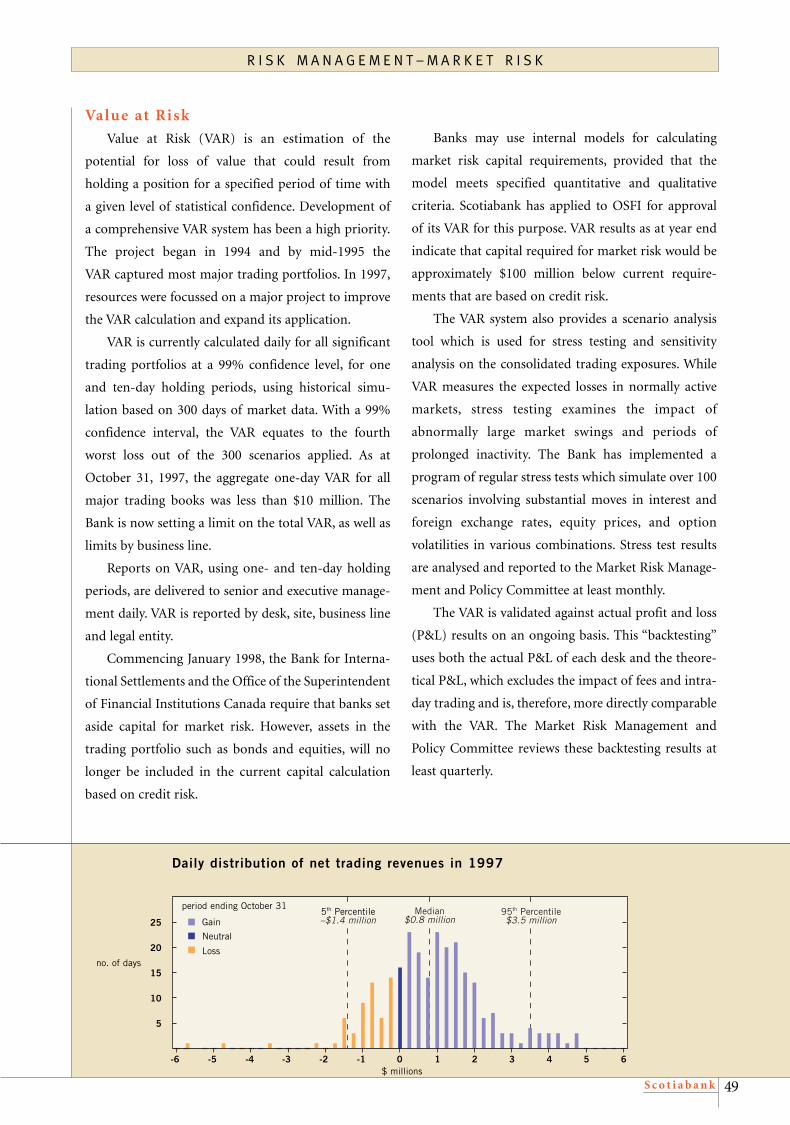
S c o t i a b a n k 49
Value at Risk
Value at Risk (VAR) is an estimation of the
potential for loss of value that could result from
holding a position for a specified period of time with
a given level of statistical confidence. Development of
a comprehensive VAR system has been a high priority.
The project began in 1994 and by mid-1995 the
VAR captured most major trading portfolios. In 1997,
resources were focussed on a major project to improve
the VAR calculation and expand its application.
VAR is currently calculated daily for all significant
trading portfolios at a 99% confidence level, for one
and ten-day holding periods, using historical simu-
lation based on 300 days of market data. With a 99%
confidence interval, the VAR equates to the fourth
worst loss out of the 300 scenarios applied. As at
October 31, 1997, the aggregate one-day VAR for all
major trading books was less than $10 million. The
Bank is now setting a limit on the total VAR, as well as
limits by business line.
Reports on VAR, using one- and ten-day holding
periods, are delivered to senior and executive manage-
ment daily. VAR is reported by desk, site, business line
and legal entity.
Commencing January 1998, the Bank for Interna-
tional Settlements and the Office of the Superintendent
of Financial Institutions Canada require that banks set
aside capital for market risk. However, assets in the
trading portfolio such as bonds and equities, will no
longer be included in the current capital calculation
based on credit risk.
Banks may use internal models for calculating
market risk capital requirements, provided that the
model meets specified quantitative and qualitative
criteria. Scotiabank has applied to OSFI for approval
of its VAR for this purpose. VAR results as at year end
indicate that capital required for market risk would be
approximately $100 million below current require-
ments that are based on credit risk.
The VAR system also provides a scenario analysis
tool which is used for stress testing and sensitivity
analysis on the consolidated trading exposures. While
VAR measures the expected losses in normally active
markets, stress testing examines the impact of
abnormally large market swings and periods of
prolonged inactivity. The Bank has implemented a
program of regular stress tests which simulate over 100
scenarios involving substantial moves in interest and
foreign exchange rates, equity prices, and option
volatilities in various combinations. Stress test results
are analysed and reported to the Market Risk Manage-
ment and Policy Committee at least monthly.
The VAR is validated against actual profit and loss
(P&L) results on an ongoing basis. This “backtesting”
uses both the actual P&L of each desk and the theore-
tical P&L, which excludes the impact of fees and intra-
day trading and is, therefore, more directly comparable
with the VAR. The Market Risk Management and
Policy Committee reviews these backtesting results at
least quarterly.
R I S K M A N A G E M E N T – M A R K E T R I S K
5
10
15
20
25
-5-6 -4 -3 -2 -1 0 1 2 3 4 5 6
Daily distribution of net trading revenues in 1997
no. of days
$ millions
5th Percentile–$1.4 million
Median$0.8 million
95th Percentile$3.5 millionGain
Neutral
Loss
period ending October 31

S c o t i a b a n k50
Ne t t r ading re venue
The chart on page 49 presents a frequency distrib-
ution of the history of the daily trading revenue for the
one-year period ending October 31, 1997. For most
days, the P&L was positive. On only five trading days
did the loss exceed $1.75 million, with the largest loss
of only $5.7 million. This P&L history demonstrates
the low risk of the Bank’s trading portfolio.
The midd le off ice
In response to the diversity, complexity and
expansion of global markets, the Bank has continued
to expand its middle office to complement the
preventative controls previously outlined. The middle
office conducts independent checks on the accuracy of
models and valuations used by the traders; develops
and supervises stress testing, sensitivity analysis and
VAR calculations; reviews P&L performance, and
participates in new product development. Full-time
middle office staff is located in Toronto, London,
New York and Singapore to support trading activity
in each market. Middle office staff is highly
skilled in computer analytics and quantitative
analysis.
FOREIGN EXCHANGE RISK
Foreign exchange risk arises in three areas of the
Bank’s global operations: trading, foreign currency
operations and its investment in foreign subsidiaries.
Tr ading op er at ions
The Bank buys and sells currencies in the spot, for-
ward and options markets to assist customers in meet-
ing their business needs, as well as for its own account.
The Bank assumes risks related to counterparties and
fluctuations in the price of currencies. The controls
applied to manage risks that arise in trading are
described in Trading Risk on page 48.
Foreign exchange trading is a high volume activity
which exposes the Bank to counterparty settlement
risk. This risk arises when a bank is required to deliver
value before it will receive value from the counterparty.
Scotiabank controls this risk by imposing prudent
credit and settlement limits on each counterparty.
Further control of counterparty settlement risk is
achieved through netting. Bilateral and multilateral
netting has received growing support from national
and international regulators, as a method of reducing
credit and settlement exposure. The Bank actively
pursues bilateral netting arrangements where support-
ed by legal opinions.
In addition, the Bank is actively participating in the
development of several national and international
clearing and settlement systems designed to reduce
settlement risk.
F o r e i g n c u r r e n c y o p e r a t i o n s
The Bank has no significant foreign exchange
exposure in its international business because assets are
customarily funded by liabilities in the same currency.
While staff in each country manages local currency
exchange risk, the Bank monitors its overall position
centrally. The Liability Committee reviews and man-
ages currency exposure that arises from net revenue
streams generated from foreign currency operations.
Ne t invest ment in foreig n
subsidiar ies
The Bank retains certain investments in foreign
subsidiaries in the currency of account and translates
them to Canadian dollars. Management and review of
these exposures is conducted by the Liability Committee.
EQUITIES RISK
The Bank trades equities for its customers through
Scotia Capital Markets and for its own account. In
addition, the Bank has substantial investment
portfolios consisting of a variety of equity and debt
securities. For each portfolio, stated objectives and
parameters clearly identify eligible investments, ensure
appropriate diversification, and set limits on the size of
each investment.
R I S K M A N A G E M E N T – M A R K E T R I S K

S c o t i a b a n k 51
1-5 years
over 5 years
under 1 year
The Bank manages some of the equity portfolios
itself and delegates the management of others through
arm’s length management agreements. Generally, man-
agement philosophy is to hold equities for a substantial
period of time, subject to rotation in accordance with
prudent risk management practices as dictated by
changing market conditions. For portfolios managed
by the Bank, each investment is typically made on the
basis of written recommendation and approval at an
appropriate level.
COMMODITIES RISK
Commodities trading activity has been concentrat-
ed in precious metals, specifically, gold, silver, platinum
and to a lesser extent palladium, as well as related
options and futures. Outside these activities, the Bank
has no significant commodities exposure.
Since commodities activity is focussed in precious
metals, the Bank applies gap and other market risk
limit structures similar to those applied to control
interest rate risk and foreign exchange risk. The appli-
cation of these limits is explained under the ALM and
Trading Risk sections. Limit controls are supplemented
by further analysis of precious metals trading by the
middle office.
DERIVATIVE PRODUCTS
Derivative products are financial contracts whose
value is derived from the level of an underlying price,
interest rate, exchange rate or price index. Swaps,
forwards and options are all types of derivative instru-
ments. The risk associated with derivatives include all
of the risks described in the preceding pages.
Globally, the market for derivative products con-
tinues to expand, especially in traditional products,
although new products continue to be developed.
Scotiabank’s activity has kept pace with the market and
has been focussed in generic products, where it is well
ranked for Canadian dollar products.
Derivatives are an important risk management tool
for both Scotiabank and its customers. For the Bank,
derivatives are fundamental to asset and liability
management. To manage interest rate risk associated
with the Bank’s fixed rate lending activities, the Bank
uses interest rate swaps, futures, FRAs and options. To
control foreign exchange risk, the Bank uses forwards
and swaps. Derivatives are also used to improve the cost
effectiveness of the Bank’s capital. As of October 31,
1997, derivatives used for the Bank’s own account
represented 15% of the notional principal outstanding,
with the remainder associated with customer accounts.
As a dealer, the Bank responds to customer needs,
taking into consideration its own views of the market.
The selective positioning of the Bank’s portfolios is
complemented by a comprehensive risk management
process to monitor trading activities. All derivative
trading portfolios are marked to market at least daily to
R I S K M A N A G E M E N T – D E R I VA T I V E S
Derivatives portfolio mostly comprisedof short maturities
4%
32%
64%
93 94 95 96 97
200
400
600
800
1000
Increasing client demand for derivatives
notional principal, October 31, 1997$ billions, October 31
notional principal
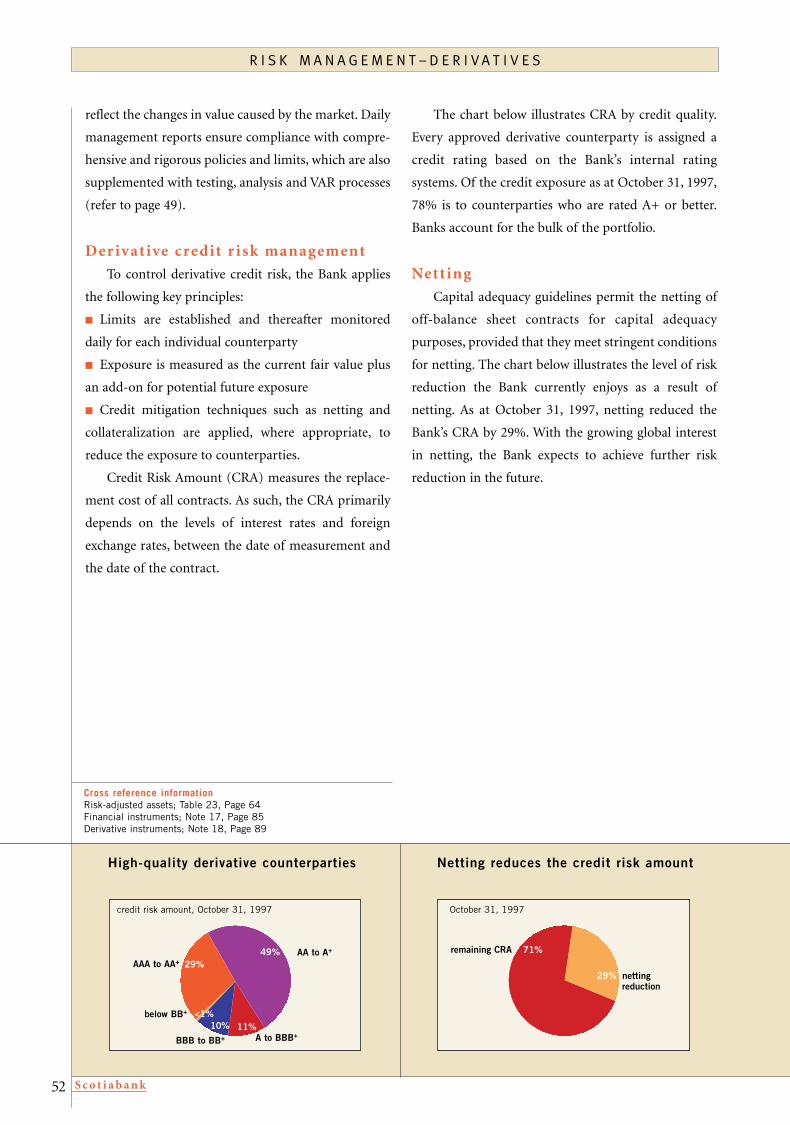
S c o t i a b a n k52
High-quality derivative counterparties Netting reduces the credit risk amount
reflect the changes in value caused by the market. Daily
management reports ensure compliance with compre-
hensive and rigorous policies and limits, which are also
supplemented with testing, analysis and VAR processes
(refer to page 49).
Der iv at ive credit r isk management
To control derivative credit risk, the Bank applies
the following key principles:
■ Limits are established and thereafter monitored
daily for each individual counterparty
■ Exposure is measured as the current fair value plus
an add-on for potential future exposure
■ Credit mitigation techniques such as netting and
collateralization are applied, where appropriate, to
reduce the exposure to counterparties.
Credit Risk Amount (CRA) measures the replace-
ment cost of all contracts. As such, the CRA primarily
depends on the levels of interest rates and foreign
exchange rates, between the date of measurement and
the date of the contract.
The chart below illustrates CRA by credit quality.
Every approved derivative counterparty is assigned a
credit rating based on the Bank’s internal rating
systems. Of the credit exposure as at October 31, 1997,
78% is to counterparties who are rated A+ or better.
Banks account for the bulk of the portfolio.
Ne tt ing
Capital adequacy guidelines permit the netting of
off-balance sheet contracts for capital adequacy
purposes, provided that they meet stringent conditions
for netting. The chart below illustrates the level of risk
reduction the Bank currently enjoys as a result of
netting. As at October 31, 1997, netting reduced the
Bank’s CRA by 29%. With the growing global interest
in netting, the Bank expects to achieve further risk
reduction in the future.
R I S K M A N A G E M E N T – D E R I VA T I V E S
October 31, 1997
nettingreduction
remaining CRA 71%
29%
AA to A+
A to BBB+
AAA to AA+
below BB+
credit risk amount, October 31, 1997
49%
11%
29%
<1%10%
BBB to BB+
Cross reference informationRisk-adjusted assets; Table 23, Page 64Financial instruments; Note 17, Page 85Derivative instruments; Note 18, Page 89
S c o t i a b a n k 53
Operating risk is the risk of loss caused by internal
or external events such as systems or procedural
failures, errors or fraud. The key elements of the Bank’s
strategy for minimizing operating risk are: the quality
of its human resources; separation of duties; compre-
hensive audit oversight; and continued prudent use of,
and investment in, technology.
Staff ing and t r aining
A knowledgeable and experienced management
team committed to risk management is fundamental
to the minimization of operating risk. The Bank also
strives to attract, develop and retain staff who share its
strong risk management culture. Training and develop-
ment programmes emphasize the importance of risk
management.
S epar at ion of dut ies
The Bank’s policies, procedures and systems have
been designed to ensure that there are built-in checks
and balances and clear separation of duties. Staff
responsibilities are clearly defined and organized to
avoid overlap and duplication between key areas.
Credit, risk management, and transaction processing
functions are fully independent of the business units.
Le g al r isk
To control legal risk, the Bank’s policies and proce-
dures require that documentation be reviewed, and
issues of suitability and legal capacity be evaluated.
Legal opinions are obtained from internal and external
counsel to support various aspects of the Bank’s busi-
ness. In its derivatives trading activities, the Bank uses
internationally recognized master netting agreements.
Audit re v iew
The Bank’s independent Audit Department
performs comprehensive reviews of the design and
operation of the internal control systems in all existing
business and support groups, including risk manage-
ment policies and procedures. Audit also reviews new
products and systems to ensure that risks have been
evaluated. The continued reliability and integrity of data
processing operations are audited on a regular basis.
Back-up faci l i t ies
The Bank has extensive on and off-site back-up
facilities to ensure the availability of service delivery
under adverse conditions. As well, all key operations
areas have developed business resumption plans and
procedures.
Ye ar 2000
The year 2000 poses a significant challenge to
businesses who are reliant on computer systems that
use the last two digits to represent a year. The Bank has
been preparing to meet the year 2000 challenge for
several years and has established December 31, 1998 as
the date it will be year 2000 compliant internally. The
Bank is confident that careful testing and upgrades of
its systems, and its work with third parties, will ensure
a smooth transition for the Bank and its customers.
Outlo ok
Technological advances continue to improve
transaction processing, information management and
control systems. The Bank is making significant
ongoing investments in the front, middle and back
offices to improve the efficiency and security of trans-
action processing and to reduce the risk of error.
R I S K M A N A G E M E N T – O P E R A T I N G R I S K
Proper control over operating
risk is a Scotiabank standard. Ongoing improvement of the Bank’s Human Resources and Information
Systems, and prudent audit and legal oversight, are designed to work together to minimize risk exposure.
M I N I M I Z I N G E X P O S U R E
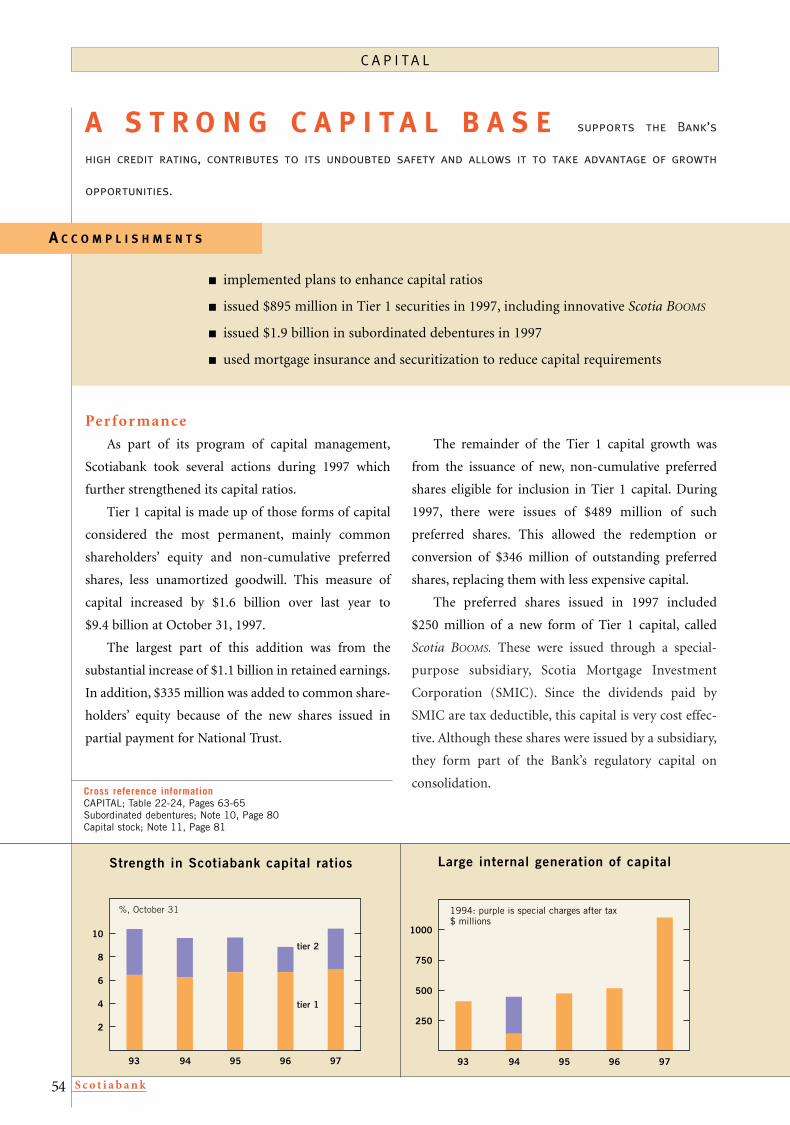
S c o t i a b a n k54
Per for mance
As part of its program of capital management,
Scotiabank took several actions during 1997 which
further strengthened its capital ratios.
Tier 1 capital is made up of those forms of capital
considered the most permanent, mainly common
shareholders’ equity and non-cumulative preferred
shares, less unamortized goodwill. This measure of
capital increased by $1.6 billion over last year to
$9.4 billion at October 31, 1997.
The largest part of this addition was from the
substantial increase of $1.1 billion in retained earnings.
In addition, $335 million was added to common share-
holders’ equity because of the new shares issued in
partial payment for National Trust.
The remainder of the Tier 1 capital growth was
from the issuance of new, non-cumulative preferred
shares eligible for inclusion in Tier 1 capital. During
1997, there were issues of $489 million of such
preferred shares. This allowed the redemption or
conversion of $346 million of outstanding preferred
shares, replacing them with less expensive capital.
The preferred shares issued in 1997 included
$250 million of a new form of Tier 1 capital, called
Scotia BOOMS. These were issued through a special-
purpose subsidiary, Scotia Mortgage Investment
Corporation (SMIC). Since the dividends paid by
SMIC are tax deductible, this capital is very cost effec-
tive. Although these shares were issued by a subsidiary,
they form part of the Bank’s regulatory capital on
consolidation.
supports the Bank’s
high credit rating, contributes to its undoubted safety and allows it to take advantage of growth
opportunities.
A S T R O N G C A P I T A L B A S E
C A P I TA L
Large internal generation of capitalStrength in Scotiabank capital ratios
A C C O M P L I S H M E N T S
■ implemented plans to enhance capital ratios
■ issued $895 million in Tier 1 securities in 1997, including innovative Scotia BOOMS
■ issued $1.9 billion in subordinated debentures in 1997
■ used mortgage insurance and securitization to reduce capital requirements
250
500
750
1000
93 94 95 96 97
1994: purple is special charges after tax$ millions
2
4
6
8
10
93 94 95 96 97
%, October 31
tier 2
tier 1
Cross reference informationCAPITAL; Table 22-24, Pages 63-65Subordinated debentures; Note 10, Page 80Capital stock; Note 11, Page 81

S c o t i a b a n k 55
The Tier 1 capital ratio was 6.90% at year end 1997,
versus 6.69% at October 31, 1996. (For this calculation,
capital is measured against risk-adjusted assets, using
weights based on credit risk for each class of counter-
party.)
During 1997, the Bank issued $1.9 billion in new
subordinated debentures eligible for inclusion in Tier 2
capital. In addition, under OSFI’s new policy, Canadian
banks may now include General provisions in Tier 2
capital, subject to certain limits, which brings the
Canadian rules more in line with international
practice. This allowed Scotiabank to include its
$500 million in General provisions in Tier 2 capital. In
total, Tier 2 capital rose by $2.3 billion to $4.8 billion at
October 31, 1997. The Tier 2 capital ratio at year end was
3.52%, an increase from 2.16% as at October 31, 1996.
The total capital ratio, the sum of the Tier 1 and
Tier 2 ratios, increased to 10.42% at the end of 1997,
from 8.85% in 1996.
In 1997, the Bank employed a variety of methods
for balance-sheet management as part of its program
of enhancing its capital ratios. Most notably, it
acquired credit insurance on $5 billion of its Canadian
conventional residential mortgage portfolio from a
private insurer. The purchase of mortgage insurance
reduced the risk weighting applied to these assets from
50% to 5%, thereby reducing risk-adjusted assets by
$2.3 billion.
The Bank also made its first issue of securitized
consumer auto loans, totalling $1.5 billion, by selling
the loans to a special-purpose entity, ATLAS Auto Loan
Funding Trust 1997-A. This securitization reduced the
requirement to hold capital and opened up a new
source of funding for the Bank.
Outlo ok
The Bank expects to increase its capital ratios over
the course of 1998, while continuing to provide a good
return to shareholders.
C A P I TA L
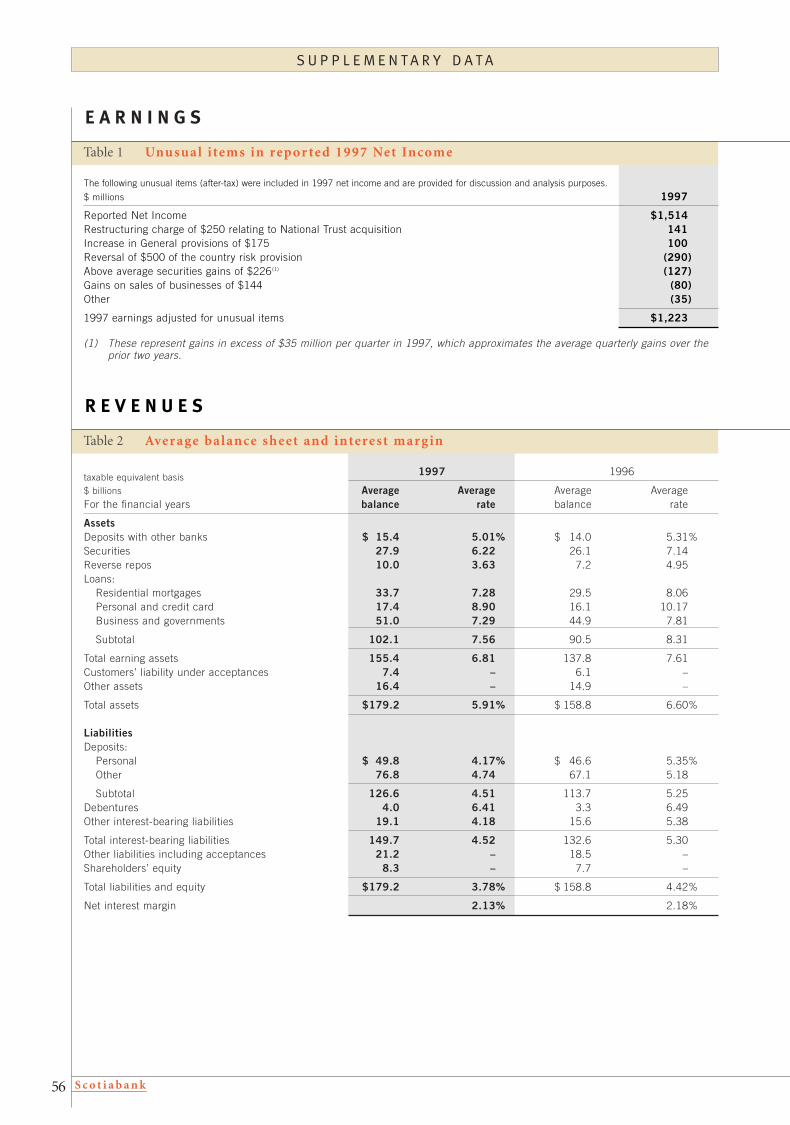
S c o t i a b a n k56
Table 2 Aver age balance sheet and interest marg in
taxable equivalent basis 1997 1996
$ billions Average Average Average AverageFor the financial years balance rate balance rate
AssetsDeposits with other banks $ 15.4 5.01% $ 14.0 5.31%Securities 27.9 6.22 26.1 7.14Reverse repos 10.0 3.63 7.2 4.95Loans:
Residential mortgages 33.7 7.28 29.5 8.06Personal and credit card 17.4 8.90 16.1 10.17Business and governments 51.0 7.29 44.9 7.81
Subtotal 102.1 7.56 90.5 8.31
Total earning assets 155.4 6.81 137.8 7.61Customers’ liability under acceptances 7.4 – 6.1 –Other assets 16.4 – 14.9 –
Total assets $179.2 5.91% $ 158.8 6.60%
LiabilitiesDeposits:
Personal $ 49.8 4.17% $ 46.6 5.35%Other 76.8 4.74 67.1 5.18
Subtotal 126.6 4.51 113.7 5.25Debentures 4.0 6.41 3.3 6.49Other interest-bearing liabilities 19.1 4.18 15.6 5.38
Total interest-bearing liabilities 149.7 4.52 132.6 5.30Other liabilities including acceptances 21.2 – 18.5 –Shareholders’ equity 8.3 – 7.7 –
Total liabilities and equity $179.2 3.78% $ 158.8 4.42%
Net interest margin 2.13% 2.18%
The following unusual items (after-tax) were included in 1997 net income and are provided for discussion and analysis purposes.
$ millions 1997
Reported Net Income $1,514Restructuring charge of $250 relating to National Trust acquisition 141Increase in General provisions of $175 100Reversal of $500 of the country risk provision (290)Above average securities gains of $226(1) (127)Gains on sales of businesses of $144 (80)Other (35)
1997 earnings adjusted for unusual items $1,223
(1) These represent gains in excess of $35 million per quarter in 1997, which approximates the average quarterly gains over theprior two years.
Table 1 Unusual i tems in repor ted 1997 Net Income
S U P P L E M E N TA R Y D A TA
E A R N I N G S
R E V E N U E S

S c o t i a b a n k 57
Table 5 Asse ts under administ r at ion and management
Table 4 Other income
Table 3 Volume/r ate analysis of changes in ne t interest income
taxable equivalent basis
$ millions 1997 versus 1996For the financial years Increase (decrease) due to change in:
Average Average Netvolume rate change
Net interest incomeAssets $ 1,204 $(1,097) $ 107Liabilities (770) 1,024 254
Total $ 434 $ (73) $ 361
1997$ millions versusFor the financial years 1997 1996 1995 1994 1993 1996
Deposit and payment servicesDeposit services $ 317 $ 289 $ 262 $ 235 $ 215 10%Card revenues 153 145 125 111 90 6Other payment services 61 65 60 55 51 (6)
Subtotal 531 499 447 401 356 6Investment management and trustMutual funds 82 51 39 38 12 60Investment management and custody 89 113 108 58 8 (21)Personal and corporate trust 79 66 60 39 9 20
Subtotal 250 230 207 135 29 9Credit feesCommitment/other credit fees 329 272 239 212 176 21Acceptance fees 66 61 50 48 32 7
Subtotal 395 333 289 260 208 19Investment bankingForeign exchange and precious metals 154 164 118 150 136 (6)Underwriting fees and
brokerage commissions 597 422 267 347 307 42Capital market fees 96 103 46 128 129 (7)
Subtotal 847 689 431 625 572 23
Net gain (loss) on investment securities 366(1) 129 (107) 52 119 100+Other 150 128 126 133 96 17
Total of above 2,539 2,008 1,393 1,606 1,380 26Gains on sale of businesses 144(1) – 105 – – n/a
Total other income $ 2,683 $ 2,008 $ 1,498 $ 1,606 $ 1,380 34%
Percentage increase over previous year 34% 34% (7)% 16% 15%
(1) Gain on sale of Montrusco Associates Inc. of $37 million was included in gains on sale of businesses, whereas in theConsolidated Statement of Income, it is reported in net gains on investment securities.
$ billions
As at September 30 1997 1996 1995 1994
Assets under administration(1)
Institutional trust and custodial services $ 32.9 $ 160.6 $ 148.3 $ 136.9Personal trust and custodial services 65.9 34.4 30.0 19.0Retail mutual funds 7.9 4.7 3.3 3.4Serviced mortgages 3.1 1.4 1.7 2.2
Total $ 109.8 $ 201.1 $ 183.3 $ 161.5Assets under managementInstitutional $ 2.0 $ 6.6 $ 6.0 $ 4.4Personal 7.1 2.4 2.3 0.9Retail mutual funds 5.0 4.7 3.3 3.4
Total $ 14.1 $ 13.7 $ 11.6 $ 8.7
(1) On October 1, 1997, the Bank securitized $1.5 billion of consumer auto loans which are now being administered by the Bank.
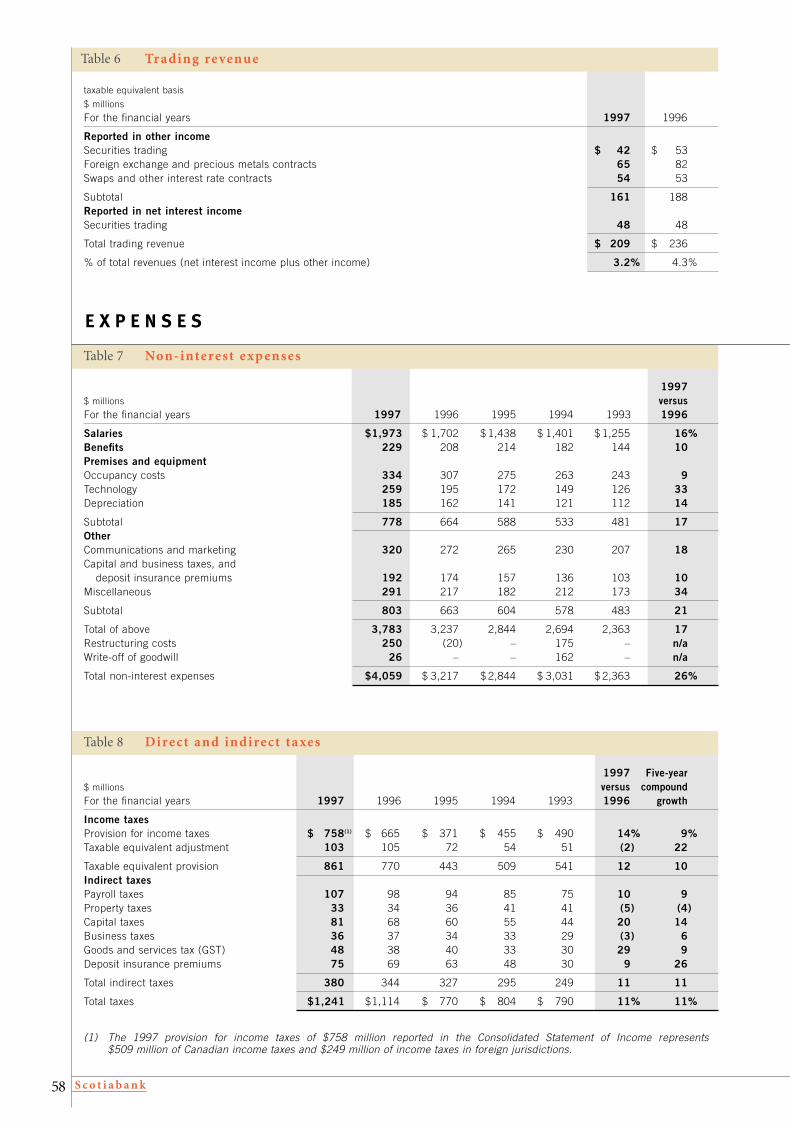
S c o t i a b a n k58
Table 6 Tr ading re venue
taxable equivalent basis
$ millions
For the financial years 1997 1996
Reported in other incomeSecurities trading $ 42 $ 53Foreign exchange and precious metals contracts 65 82Swaps and other interest rate contracts 54 53
Subtotal 161 188Reported in net interest incomeSecurities trading 48 48
Total trading revenue $ 209 $ 236
% of total revenues (net interest income plus other income) 3.2% 4.3%
Table 8 Direct and indirect taxes
Table 7 Non-interest exp enses
E X P E N S E S
1997$ millions versusFor the financial years 1997 1996 1995 1994 1993 1996
Salaries $1,973 $ 1,702 $ 1,438 $ 1,401 $ 1,255 16%Benefits 229 208 214 182 144 10Premises and equipment Occupancy costs 334 307 275 263 243 9Technology 259 195 172 149 126 33Depreciation 185 162 141 121 112 14
Subtotal 778 664 588 533 481 17OtherCommunications and marketing 320 272 265 230 207 18Capital and business taxes, and
deposit insurance premiums 192 174 157 136 103 10Miscellaneous 291 217 182 212 173 34
Subtotal 803 663 604 578 483 21
Total of above 3,783 3,237 2,844 2,694 2,363 17Restructuring costs 250 (20) – 175 – n/aWrite-off of goodwill 26 – – 162 – n/a
Total non-interest expenses $4,059 $ 3,217 $ 2,844 $ 3,031 $ 2,363 26%
1997 Five-year$ millions versus compoundFor the financial years 1997 1996 1995 1994 1993 1996 growth
Income taxesProvision for income taxes $ 758(1) $ 665 $ 371 $ 455 $ 490 14% 9%Taxable equivalent adjustment 103 105 72 54 51 (2) 22
Taxable equivalent provision 861 770 443 509 541 12 10Indirect taxesPayroll taxes 107 98 94 85 75 10 9Property taxes 33 34 36 41 41 (5) (4)Capital taxes 81 68 60 55 44 20 14Business taxes 36 37 34 33 29 (3) 6Goods and services tax (GST) 48 38 40 33 30 29 9Deposit insurance premiums 75 69 63 48 30 9 26
Total indirect taxes 380 344 327 295 249 11 11
Total taxes $1,241 $1,114 $ 770 $ 804 $ 790 11% 11%
(1) The 1997 provision for income taxes of $758 million reported in the Consolidated Statement of Income represents $509 million of Canadian income taxes and $249 million of income taxes in foreign jurisdictions.
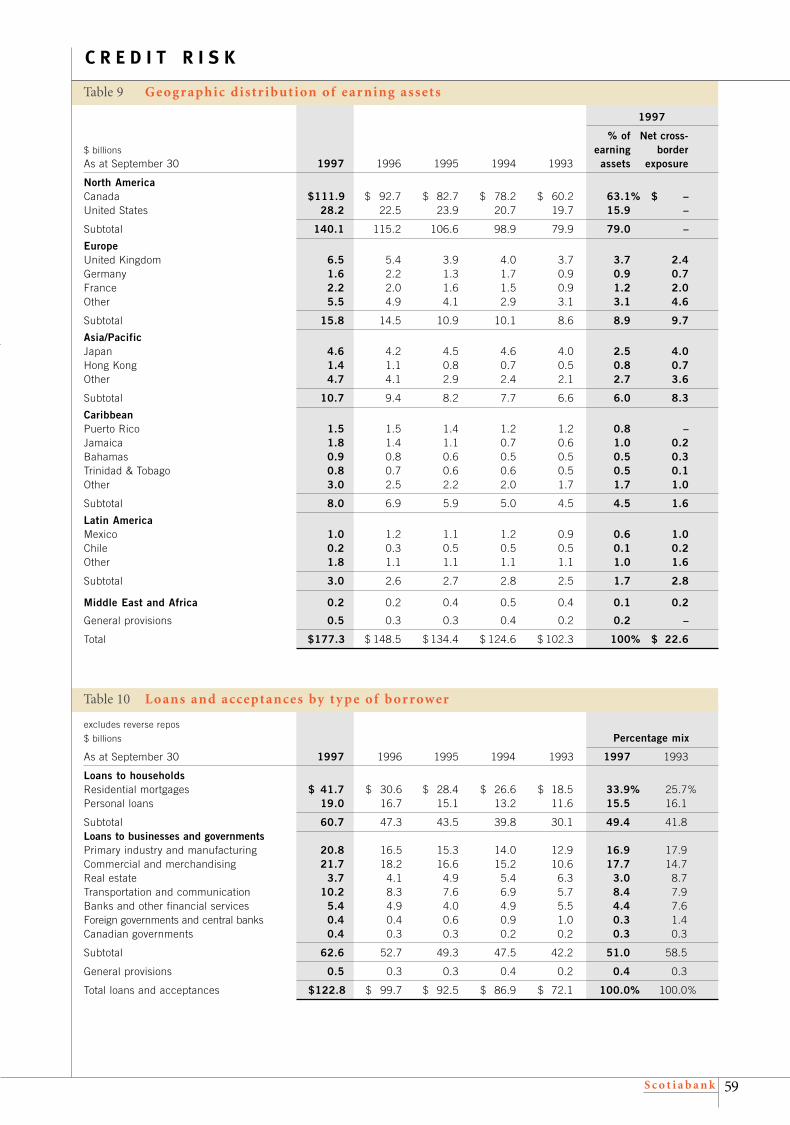
Table 9 Ge o g r aphic dist r ibut ion of e ar ning asse ts
1997
% of Net cross-$ billions earning borderAs at September 30 1997 1996 1995 1994 1993 assets exposure
North AmericaCanada $111.9 $ 92.7 $ 82.7 $ 78.2 $ 60.2 63.1% $ –United States 28.2 22.5 23.9 20.7 19.7 15.9 –
Subtotal 140.1 115.2 106.6 98.9 79.9 79.0 –
EuropeUnited Kingdom 6.5 5.4 3.9 4.0 3.7 3.7 2.4Germany 1.6 2.2 1.3 1.7 0.9 0.9 0.7France 2.2 2.0 1.6 1.5 0.9 1.2 2.0Other 5.5 4.9 4.1 2.9 3.1 3.1 4.6
Subtotal 15.8 14.5 10.9 10.1 8.6 8.9 9.7
Asia/PacificJapan 4.6 4.2 4.5 4.6 4.0 2.5 4.0Hong Kong 1.4 1.1 0.8 0.7 0.5 0.8 0.7Other 4.7 4.1 2.9 2.4 2.1 2.7 3.6
Subtotal 10.7 9.4 8.2 7.7 6.6 6.0 8.3
CaribbeanPuerto Rico 1.5 1.5 1.4 1.2 1.2 0.8 –Jamaica 1.8 1.4 1.1 0.7 0.6 1.0 0.2Bahamas 0.9 0.8 0.6 0.5 0.5 0.5 0.3Trinidad & Tobago 0.8 0.7 0.6 0.6 0.5 0.5 0.1Other 3.0 2.5 2.2 2.0 1.7 1.7 1.0
Subtotal 8.0 6.9 5.9 5.0 4.5 4.5 1.6
Latin AmericaMexico 1.0 1.2 1.1 1.2 0.9 0.6 1.0Chile 0.2 0.3 0.5 0.5 0.5 0.1 0.2Other 1.8 1.1 1.1 1.1 1.1 1.0 1.6
Subtotal 3.0 2.6 2.7 2.8 2.5 1.7 2.8
Middle East and Africa 0.2 0.2 0.4 0.5 0.4 0.1 0.2
General provisions 0.5 0.3 0.3 0.4 0.2 0.2 –
Total $177.3 $ 148.5 $ 134.4 $ 124.6 $ 102.3 100% $ 22.6
S c o t i a b a n k 59
Table 10 Lo ans and acceptances by t y p e of b or rower
excludes reverse repos
$ billions Percentage mix
As at September 30 1997 1996 1995 1994 1993 1997 1993
Loans to householdsResidential mortgages $ 41.7 $ 30.6 $ 28.4 $ 26.6 $ 18.5 33.9% 25.7%Personal loans 19.0 16.7 15.1 13.2 11.6 15.5 16.1
Subtotal 60.7 47.3 43.5 39.8 30.1 49.4 41.8Loans to businesses and governmentsPrimary industry and manufacturing 20.8 16.5 15.3 14.0 12.9 16.9 17.9Commercial and merchandising 21.7 18.2 16.6 15.2 10.6 17.7 14.7Real estate 3.7 4.1 4.9 5.4 6.3 3.0 8.7Transportation and communication 10.2 8.3 7.6 6.9 5.7 8.4 7.9Banks and other financial services 5.4 4.9 4.0 4.9 5.5 4.4 7.6Foreign governments and central banks 0.4 0.4 0.6 0.9 1.0 0.3 1.4Canadian governments 0.4 0.3 0.3 0.2 0.2 0.3 0.3
Subtotal 62.6 52.7 49.3 47.5 42.2 51.0 58.5
General provisions 0.5 0.3 0.3 0.4 0.2 0.4 0.3
Total loans and acceptances $122.8 $ 99.7 $ 92.5 $ 86.9 $ 72.1 100.0% 100.0%
C R E D I T R I S K

S c o t i a b a n k60
Table 14 Commercial re al estate exp osure by prop er t y t y p e (1)
$ billions
As at October 31 1997 1996 1995 1994 1993
Commercial $ 1.9 $ 2.3 $ 2.9 $ 3.5 $ 3.9Land and land development 0.8 0.7 0.9 1.1 1.3Residential 0.6 0.5 0.5 0.4 0.5Industrial 0.7 0.6 0.7 0.5 0.5Other 0.2 0.2 0.2 0.2 0.1
Total $ 4.2 $ 4.3 $ 5.2 $ 5.7 $ 6.3
(1) Comprises loans, bankers’ acceptances, letters of credit and guarantees, and stated after deducting specific provisions.
Table 13 Commercial re al estate exp osure by ge og r aphy (1)
$ billions
As at October 31 1997 1996 1995 1994 1993
Canada $ 2.6 $ 2.4 $ 2.9 $ 3.1 $ 3.2United States 1.4 1.6 2.0 2.4 2.8Other 0.2 0.3 0.3 0.2 0.3
Total $ 4.2 $ 4.3 $ 5.2 $ 5.7 $ 6.3
Total as a % of total loans and acceptances(2) 3.4% 4.2% 5.5% 6.5% 8.8%
(1) Comprises loans, bankers’ acceptances, letters of credit and guarantees, and stated after deducting specific provisions. (2) Excludes reverse repos.
$ billions
As at October 31 1997 1996 1995 1994 1993
Guarantees and letters of credit $ 10.1 $ 8.3 $ 8.1 $ 7.0 $ 6.0Commitments to extend credit 88.9 79.7 67.6 61.1 54.2Securities lending transactions 1.2 2.5 3.4 2.7 0.7
Total $100.2 $ 90.5 $ 79.1 $ 70.8 $ 60.9
excludes reverse repos
$ billions Percentage mix
As at September 30 1997 1996 1995 1994 1993 1997 1993
CanadaAtlantic provinces $ 8.4 $ 8.1 $ 7.6 $ 7.4 $ 6.4 6.8% 8.9%Quebec 7.2 6.1 5.7 5.4 3.2 5.8 4.4Ontario 46.6 33.9 32.7 30.5 23.9 38.0 33.2Manitoba and Saskatchewan 3.9 3.6 3.4 3.0 2.2 3.2 3.0Alberta 8.7 6.8 6.5 6.3 5.0 7.1 7.0British Columbia 11.2 9.3 8.7 7.8 5.6 9.1 7.7
Subtotal 86.0 67.8 64.6 60.4 46.3 70.0 64.2International
United States 18.0 15.2 14.1 13.9 13.5 14.7 18.8Europe 6.7 5.7 4.8 4.3 4.7 5.4 6.5Caribbean 6.3 5.7 4.8 4.0 3.7 5.2 5.1Asia/Pacific 5.3 4.6 3.1 3.1 2.7 4.3 3.8Latin America 0.9 0.8 1.1 1.2 1.1 0.7 1.5Middle East/Africa 0.1 0.2 0.3 0.4 0.3 0.1 0.4
Subtotal 37.3 32.2 28.2 26.9 26.0 30.4 36.1
General provisions 0.5 0.3 0.3 0.4 0.2 0.4 0.3
Total loans and acceptances $122.8 $ 99.7 $ 92.5 $ 86.9 $ 72.1 100.0% 100.0%
Table 11 Lo ans and acceptances by ge og r aphy
Table 12 Off-balance sheet credit inst r uments
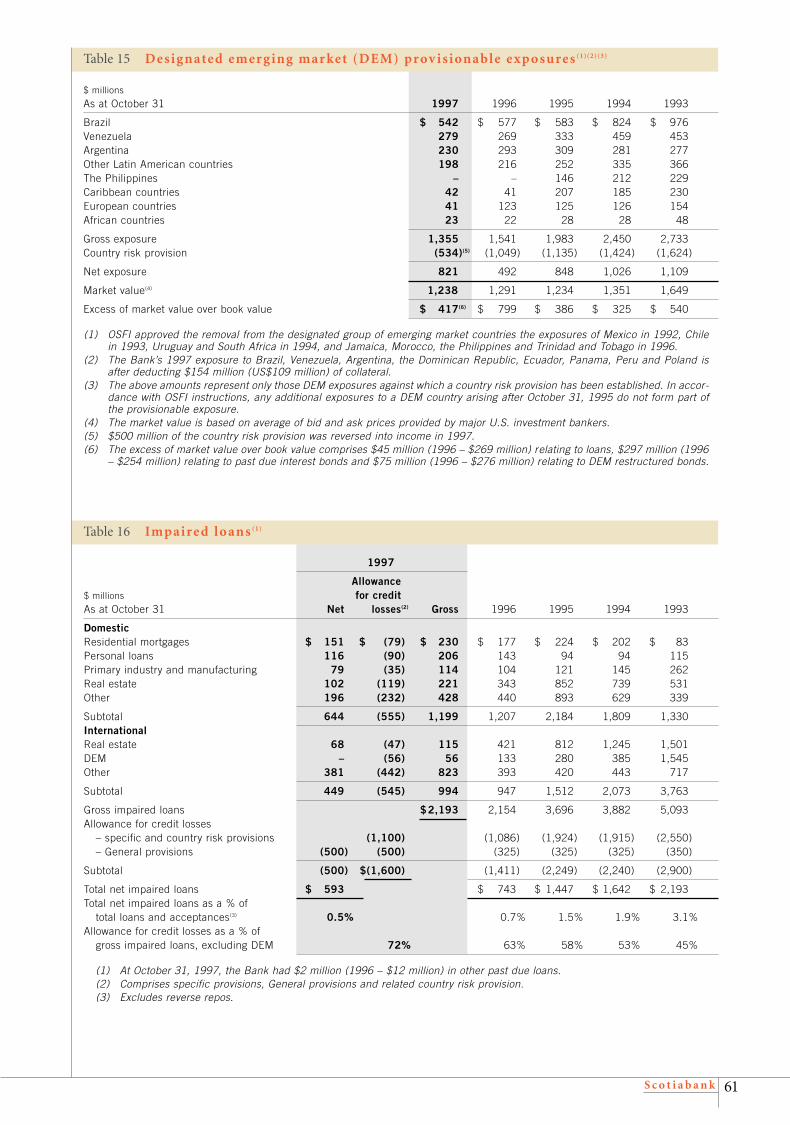
S c o t i a b a n k 61
Table 16 Impaired lo ans (1)
Table 15 Desig nated emer g ing mar ke t (DEM) prov isionable exp osures (1)(2)(3)
$ millions
As at October 31 1997 1996 1995 1994 1993
Brazil $ 542 $ 577 $ 583 $ 824 $ 976Venezuela 279 269 333 459 453Argentina 230 293 309 281 277Other Latin American countries 198 216 252 335 366The Philippines – – 146 212 229Caribbean countries 42 41 207 185 230European countries 41 123 125 126 154African countries 23 22 28 28 48
Gross exposure 1,355 1,541 1,983 2,450 2,733Country risk provision (534)(5) (1,049) (1,135) (1,424) (1,624)
Net exposure 821 492 848 1,026 1,109
Market value(4) 1,238 1,291 1,234 1,351 1,649
Excess of market value over book value $ 417(6) $ 799 $ 386 $ 325 $ 540
(1) OSFI approved the removal from the designated group of emerging market countries the exposures of Mexico in 1992, Chilein 1993, Uruguay and South Africa in 1994, and Jamaica, Morocco, the Philippines and Trinidad and Tobago in 1996.
(2) The Bank’s 1997 exposure to Brazil, Venezuela, Argentina, the Dominican Republic, Ecuador, Panama, Peru and Poland isafter deducting $154 million (US$109 million) of collateral.
(3) The above amounts represent only those DEM exposures against which a country risk provision has been established. In accor-dance with OSFI instructions, any additional exposures to a DEM country arising after October 31, 1995 do not form part ofthe provisionable exposure.
(4) The market value is based on average of bid and ask prices provided by major U.S. investment bankers. (5) $500 million of the country risk provision was reversed into income in 1997.(6) The excess of market value over book value comprises $45 million (1996 – $269 million) relating to loans, $297 million (1996
– $254 million) relating to past due interest bonds and $75 million (1996 – $276 million) relating to DEM restructured bonds.
1997
Allowance$ millions for creditAs at October 31 Net losses(2) Gross 1996 1995 1994 1993
DomesticResidential mortgages $ 151 $ (79) $ 230 $ 177 $ 224 $ 202 $ 83Personal loans 116 (90) 206 143 94 94 115Primary industry and manufacturing 79 (35) 114 104 121 145 262Real estate 102 (119) 221 343 852 739 531Other 196 (232) 428 440 893 629 339
Subtotal 644 (555) 1,199 1,207 2,184 1,809 1,330InternationalReal estate 68 (47) 115 421 812 1,245 1,501DEM – (56) 56 133 280 385 1,545Other 381 (442) 823 393 420 443 717
Subtotal 449 (545) 994 947 1,512 2,073 3,763
Gross impaired loans $2,193 2,154 3,696 3,882 5,093Allowance for credit losses
– specific and country risk provisions (1,100) (1,086) (1,924) (1,915) (2,550)– General provisions (500) (500) (325) (325) (325) (350)
Subtotal (500) $(1,600) (1,411) (2,249) (2,240) (2,900)
Total net impaired loans $ 593 $ 743 $ 1,447 $ 1,642 $ 2,193Total net impaired loans as a % of
total loans and acceptances(3) 0.5% 0.7% 1.5% 1.9% 3.1%Allowance for credit losses as a % of
gross impaired loans, excluding DEM 72% 63% 58% 53% 45%
(1) At October 31, 1997, the Bank had $2 million (1996 – $12 million) in other past due loans.(2) Comprises specific provisions, General provisions and related country risk provision. (3) Excludes reverse repos.
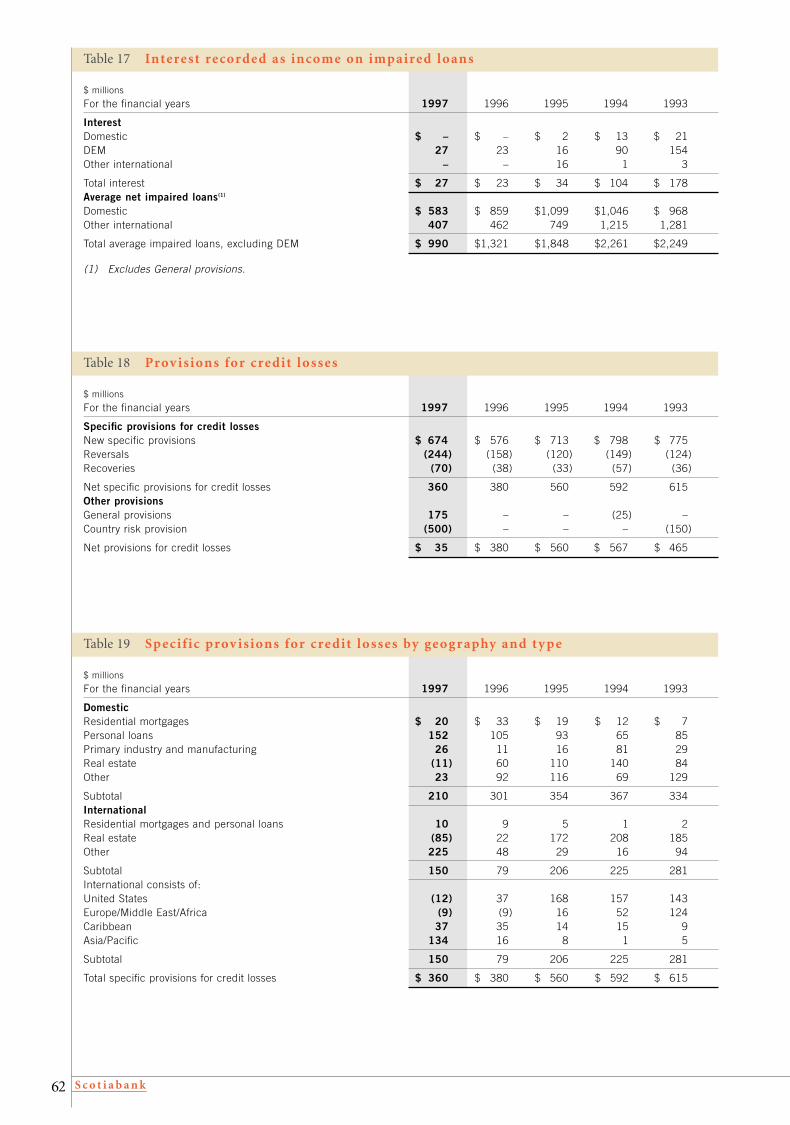
S c o t i a b a n k62
Table 19 Sp ecif ic prov isions for credit losses by ge og r aphy and t y p e
$ millions
For the financial years 1997 1996 1995 1994 1993
DomesticResidential mortgages $ 20 $ 33 $ 19 $ 12 $ 7Personal loans 152 105 93 65 85Primary industry and manufacturing 26 11 16 81 29Real estate (11) 60 110 140 84Other 23 92 116 69 129
Subtotal 210 301 354 367 334InternationalResidential mortgages and personal loans 10 9 5 1 2Real estate (85) 22 172 208 185Other 225 48 29 16 94
Subtotal 150 79 206 225 281International consists of:United States (12) 37 168 157 143Europe/Middle East/Africa (9) (9) 16 52 124Caribbean 37 35 14 15 9Asia/Pacific 134 16 8 1 5
Subtotal 150 79 206 225 281
Total specific provisions for credit losses $ 360 $ 380 $ 560 $ 592 $ 615
Table 17 Interest recorded as income on impaired lo ans
$ millions
For the financial years 1997 1996 1995 1994 1993
InterestDomestic $ – $ – $ 2 $ 13 $ 21DEM 27 23 16 90 154Other international – – 16 1 3
Total interest $ 27 $ 23 $ 34 $ 104 $ 178Average net impaired loans(1)
Domestic $ 583 $ 859 $1,099 $1,046 $ 968Other international 407 462 749 1,215 1,281
Total average impaired loans, excluding DEM $ 990 $1,321 $1,848 $2,261 $2,249
(1) Excludes General provisions.
Table 18 Prov isions for credit losses
$ millions
For the financial years 1997 1996 1995 1994 1993
Specific provisions for credit lossesNew specific provisions $ 674 $ 576 $ 713 $ 798 $ 775Reversals (244) (158) (120) (149) (124)Recoveries (70) (38) (33) (57) (36)
Net specific provisions for credit losses 360 380 560 592 615Other provisionsGeneral provisions 175 – – (25) –Country risk provision (500) – – – (150)
Net provisions for credit losses $ 35 $ 380 $ 560 $ 567 $ 465

S c o t i a b a n k 63
$ millions
As at October 31 1997 1996 1995 1994 1993
Tier 1 capitalCommon shareholders’ equity $ 7,930 $ 6,424 $ 5,745 $ 5,140 $ 4,604Non-cumulative preferred shares (including SMIC)(1) 1,468 1,325 1,225 750 950Non-controlling interest in subsidiaries 137 101 84 75 56Less: Goodwill (123) (11) (8) (5) (170)
Subtotal 9,412 7,839 7,046 5,960 5,440Tier 2 capitalSubordinated debentures (net of amortization) 4,616 2,851 3,039 2,975 3,116General provisions 500 – – – –Cumulative preferred shares (including subsidiaries) – – 399 450 350Less: Investments in associated corporations and other items (323) (318) (295) (180) (157)
Subtotal 4,793 2,533 3,143 3,245 3,309
Total capital $14,205 $ 10,372 $ 10,189 $ 9,205 $ 8,749
Total risk-adjusted assets ($ billions) $ 136.4 $ 117.2 $ 105.6 $ 95.8 $ 84.3Capital ratiosTier 1 capital ratio 6.90% 6.69% 6.67% 6.22% 6.45%Total capital ratio 10.42% 8.85% 9.65% 9.61% 10.38%
(1) Scotia Mortgage Investment Corporation.
Table 22 Re gulator y capital
C A P I T A L
Table 20 Provisions for credit losses as a percentage of average loans and acceptances(1)
%
For the financial years 1997 1996 1995 1994 1993
DomesticResidential mortgages and personal 0.35% 0.32% 0.28% 0.23% 0.33%Business 0.15 0.73 1.07 1.45 1.32International 0.42 0.26 0.72 0.87 1.08
Weighted subtotal – specific provisions(2) 0.33 0.39 0.61 0.74 0.85
General provisions 0.16 – – (0.03) –Country risk provision n/a – – – (8.10)
Weighted total 0.03% 0.39% 0.61% 0.71% 0.63%
(1) Excludes reverse repos.(2) Ratio of specific provisions for credit losses as a percentage of non-DEM average loans and acceptances.
Table 21 Interest r ate g ap
Interest rate sensitivity position(1) Non-interest$ billions Within 3 to 12 Over rate As at October 31, 1997 3 months months 1 year sensitive Total
Canadian dollarsAssets $ 54.7 $ 16.1 $ 35.4 $ 7.4 $ 113.6Liabilities 54.6 19.2 22.3 17.5 113.6
Gap 0.1 (3.1) 13.1 (10.1) –Cumulative gap 0.1 (3.0) 10.1 – –
Foreign currenciesAssets 54.4 14.4 6.4 6.4 81.6Liabilities 62.9 2.3 7.4 9.0 81.6
Gap (8.5) 12.1 (1.0) (2.6) –Cumulative gap (8.5) 3.6 2.6 – –
Total Gap $ (8.4) $ 9.0 $ 12.1 $ (12.7) $ –Cumulative gap (8.4) 0.6 12.7 – –As at October 31, 1996:
Gap $ (6.8) $ 2.1 $ 14.0 $ (9.3) $ –Cumulative gap (6.8) (4.7) 9.3 – –
(1) The above figures reflect the inclusion of off-balance sheet instruments as well as an estimate of prepayments on consumerand mortgage loans. The off-balance sheet gap is included in liabilities.
M A R K E T R I S K

S c o t i a b a n k64
Table 23 Risk-adjusted assets
$ billionsAs at October 31 1997 1996
Conversion Weighting Risk- Risk-factor factor Gross adjusted Gross adjusted
On-balance sheet– 0% Cash and claims on Canada, provinces,
and OECD governments $ 59.3 $ – $ 50.0 $ –– 5% Privately insured residential mortgages(1) 6.2 0.3 1.1 0.1– 20% Claims on banks and municipalities 19.9 4.0 16.0 3.2– 50% Uninsured residential mortgages(1) 12.8 6.4 17.8 8.9– 100% Loans and acceptances 74.2 74.2 61.6 61.6– 100% Other assets 22.8 22.8 18.8 18.8
Total on-balance sheet 195.2 107.7 165.3 92.6
Off-balance sheetIndirect credit instruments:
0% – One year and under credit commitments 47.0 – 42.8 –
20% 0 –100% Short-term trade letters of credit 1.2 0.2 1.0 0.150% 0 –100% Longer term credit commitments 41.8 20.3 36.8 17.550% 0 –100% Non-financial guarantees, standby
letters of credit, NIFs and RUFs 3.2 1.6 3.0 1.5100% 0 –100% Financial guarantees, standby letters of
credit and securities lending 7.0 4.1 6.9 2.8
Subtotal 100.2 26.2 90.5 21.9Interest rate instruments:
0 –1.5% 0 –50% Futures and forward rate agreements 211.6 – 123.5 –0 –1.5% 0 –50% Interest rate swaps 419.5 1.5 309.2 1.50 –1.5% 0 –50% Interest rate options 95.2 0.1 107.5 0.1
Subtotal 726.3 1.6 540.2 1.6Foreign exchange instruments:
1 –7.5% 0 –50% Futures and foreign exchange contracts 191.8 1.1 201.7 1.01 –7.5% 0 –50% Currency swaps 30.7 0.5 32.7 0.51 –7.5% 0 –50% Currency options 29.0 0.1 20.8 0.1
Subtotal 251.5 1.7 255.2 1.6
6 –15% 0 –50% Other derivative instruments 10.6 0.2 6.5 0.1
Total off-balance sheet 1,088.6 29.7 892.4 25.2
Total gross and risk-adjusted assets 1,283.8 137.4 1,057.7 117.8
Impact of master netting – (1.0) – (0.6)
Total $1,283.8 $ 136.4 $ 1,057.7 $ 117.2
(1) Excludes NHA guaranteed mortgages which are grouped with claims on Canada.

S c o t i a b a n k 65
Table 25 Comp onents of net income as a p ercentage of aver age total asse ts (1)
taxable equivalent basis
%
For the financial years 1997 1996
Net interest income 2.13% 2.18%Provision for credit losses (0.02) (0.24)Other income 1.50 1.26
Net interest and other income 3.61 3.20Non-interest expenses (2.11) (2.03)Restructuring costs and goodwill write-off (0.15) 0.01
Net income before the undernoted: 1.35 1.18Provision for income taxes and non-controlling interest (0.50) (0.51)
Net income 0.85% 0.67%
Average total assets ($ billions) $179.2 $ 158.8
(1) Income from tax-exempt securities has been expressed on an equivalent before-tax basis. The provision for income taxes hasbeen adjusted by a corresponding amount: 1997 – $103 million; 1996 – $105 million.
O T H E R I N F O R M A T I O N
Table 24 Capital funding act iv it y
Issues Redemptions/Conversions
November 21, 1996: $350 million 6.00% debentures due 2006 October 29, 1997: $250 million non-cumulative preferred shares Series 5
June 12, 1997: $300 million 6.25% debentures due 2007 October 29, 1997: $96 million non-cumulative
July 16, 1997: $500 million 6.25% debentures due 2012 preferred shares Series 10
July 21, 1997: US $500 million 6.50% debentures due 2007converted to non-cumulative
October 29, 1997: $239 million non-cumulative preferred shares preferred shares Series 11
Series 11 issued through conversion of non-cumulativepreferred shares Series 10 and exercise of non-cumulativepreferred shares Series 11 purchase warrants
October 31, 1997: $250 million non-cumulative preferred shares Class A issued by Scotia Mortgage Investment Corporation, a wholly-owned subsidiary of the Bank

S c o t i a b a n k66
Table 26 Quar ter ly infor mat ion
1997 1996
Q4 Q3 Q2 Q1 Q4 Q3 Q2 Q1
Statement of income ($ millions)Interest income $2,788 $2,611 $2,536 $2,553 $ 2,631 $ 2,611 $ 2,523 $ 2,613Interest expense 1,832 1,687 1,629 1,623 1,718 1,778 1,711 1,817
Net interest income 956 924 907 930 913 833 812 796Provision for credit losses (reversal) (406) 88 264 89 95 95 95 95Other income 665 711 686 621 490 513 485 520
Net interest and other income 2,027 1,547 1,329 1,462 1,308 1,251 1,202 1,221Non-interest expenses 1,298 911 878 972 840 799 774 804
Income before the undernoted: 729 636 451 490 468 452 428 417Provision for income taxes 188 245 143 182 176 169 159 161Non-controlling interest 8 7 8 11 9 8 7 7
Net income 533 384 300 297 283 275 262 249Preferred dividends paid 25 24 24 26 29 29 27 28Net income available to common
shareholders $ 508 $ 360 $ 276 $ 271 $ 254 $ 246 $ 235 $ 221
Common dividends paid $ 91 $ 88 $ 88 $ 88 $ 81 $ 80 $ 72 $ 72
Average assets ($ billions) $193.8 $179.0 $174.7 $169.1 $ 163.7 $ 162.9 $ 156.8 $ 151.3Return on common shareholders’
equity (%) 26.3% 20.3% 16.7% 16.5% 16.0% 16.0% 16.1% 15.2%
Balance sheet ($ billions)Cash resources $ 18.2 $ 16.1 $ 17.3 $ 14.1 $ 14.7 $ 16.8 $ 15.3 $ 14.8Securities 28.0 26.0 27.7 27.0 25.9 28.0 25.8 24.7Reverse repos 8.5 14.7 9.7 8.5 9.1 8.3 8.4 6.2Loans and acceptances:
Residential mortgages 41.6 32.5 31.9 31.4 30.7 30.1 29.3 28.9Personal and credit card loans 17.7 17.3 17.3 16.8 16.7 16.4 16.1 15.7Business and government loans
and acceptances 64.0 59.7 57.4 56.1 54.2 52.0 50.7 49.5
Total loans and acceptances $123.3 $109.5 $106.6 $104.3 $ 101.6 $ 98.5 $ 96.1 $ 94.1
Total assets $195.2 $181.7 $176.1 $168.7 $ 165.3 $ 164.3 $ 158.3 $ 153.9Deposits 139.0 124.0 126.7 121.9 117.9 118.5 113.4 111.7Subordinated debentures 5.2 5.1 3.6 3.6 3.3 3.3 3.3 3.1Preferred shares 1.5 1.3 1.3 1.3 1.3 1.7 1.7 1.6Common shareholders’ equity 7.9 7.1 6.9 6.6 6.4 6.2 6.0 5.8
Asset qualityNet impaired loans ($ millions) $ 593 $ 446 $ 364 $ 690 $ 743 $ 805 $ 937 $ 1,048As a % of loans and acceptances(1) 0.5% 0.4% 0.3% 0.7% 0.7% 0.8% 1.0% 1.1%
Risk-adjusted capital ratios (%)Tier 1 capital ratio 6.90% 6.67% 6.61% 6.71% 6.69% 6.71% 6.78% 6.69%Total capital ratio 10.42 9.98 8.87 9.08 8.85 9.37 9.63 9.42Common equity to risk-adjusted assets 5.82 5.56 5.48 5.53 5.48 5.47 5.50 5.47
Common share informationShares outstanding (millions)
End of period 244.9 238.9 238.3 237.8 237.4 236.3 234.9 233.6Average 243.8 238.5 238.0 237.6 236.4 235.0 233.7 232.3
Net income per share ($) $ 2.10 $ 1.51 $ 1.16 $ 1.14 $ 1.08 $ 1.04 $ 1.01 $ 0.95Dividends per share ($) 0.37 0.37 0.37 0.37 0.34 0.34 0.31 0.31Book value per share ($) 32.38 29.92 28.89 27.86 27.05 26.43 25.64 24.99Share price ($)
– high 68.20 66.25 57.40 48.00 42.40 33.85 31.88 32.25– low 57.80 53.05 47.60 41.10 33.00 30.65 29.63 28.38– close 62.15 66.00 53.05 47.60 42.25 32.95 30.85 31.50
Dividend yield (%) 2.3% 2.5% 2.8% 3.3% 3.6% 4.2% 4.0% 4.1%Dividend payout ratio (%) 17.8 24.6 32.0 32.4 31.6 32.5 30.9 32.5
(1) Excludes reverse repos.
Q U A R T E R L Y I N F O R M A T I O N

1 9 9 7 c o n s o l i d a t e d
f i n a n c i a l s t a t e m e n t s
t a b l e o f c o n t e n t s
■ Report of Management 68
■ Auditors’ Report 68
■ Consolidated Balance Sheet 69
■ Consolidated Statement of Income 70
■ Consolidated Statement of Changes
in Shareholders’ Equity 71
■ Consolidated Statement of Changes
in Financial Position 72
■ Index to the notes to the Consolidated
Financial Statements 73
■ Subsidiaries 94
■ Ten-year Statistical Review 96
S c o t i a b a n k 67
S c o t i a b a n k68
R e p o r t o f M a n a g e m e n tThe management of The Bank of Nova Scotia is responsible
for the integrity and objectivity of the financial information pre-
sented in this Annual Report. The consolidated financial state-
ments have been prepared in accordance with the financial report-
ing requirements of the Bank Act and instructions issued by the
Superintendent of Financial Institutions Canada which comply in
all material respects with generally accepted accounting principles.
The consolidated financial statements reflect amounts which must
of necessity be based on the best estimates and judgement of man-
agement with appropriate consideration as to materiality. Financial
information presented elsewhere in this Annual Report is consis-
tent with that shown in the accompanying consolidated financial
statements.
Management has always recognized the importance of the
Bank maintaining and reinforcing the highest possible standards of
conduct in all of its actions, including the preparation and dissem-
ination of statements fairly presenting the financial condition of
the Bank. In this regard, management has developed and maintains
a system of accounting and reporting which provides for the nec-
essary internal controls to ensure that transactions are
properly authorized and recorded, assets are safeguarded against
unauthorized use or disposition and liabilities are recognized. The
system is augmented by written policies and procedures, the care-
ful selection and training of qualified staff, the establishment of
organizational structures providing an appropriate and well-
defined division of responsibilities, and the communication of
policies and guidelines of business conduct throughout the Bank.
The system of internal controls is further supported by a pro-
fessional staff of internal auditors who conduct periodic audits of
C O N S O L I D A T E D F I N A N C I A L S TA T E M E N T S
A u d i t o r s ’ R e p o r tTo the Shareholders of The Bank of Nova Scotia
We have audited the Consolidated Balance Sheets of The
Bank of Nova Scotia as at October 31, 1997 and 1996, and the
Consolidated Statements of Income, Changes in Shareholders’
Equity and Changes in Financial Position for the years then ended.
These financial statements are the responsibility of the Bank’s
management. Our responsibility is to express an opinion on these
financial statements based on our audits.
We conducted our audits in accordance with generally
accepted auditing standards. Those standards require that we plan
and perform an audit to obtain reasonable assurance whether the
financial statements are free of material misstatement. An audit
includes examining, on a test basis, evidence supporting the
all aspects of the Bank’s operations. As well, the Bank’s Chief
Inspector has full and free access to the Audit Committee of the
Board of Directors.
The Superintendent of Financial Institutions Canada, at
least once a year, examines and enquires into the business and
affairs of the Bank, as he may deem necessary, to satisfy himself
that the provisions of the Bank Act, having reference to the safe-
ty of the interests of depositors, creditors and shareholders of
the Bank, are being duly observed and that the Bank is in a
sound financial condition.
The Audit Committee, composed entirely of outside
Directors, reviews the consolidated financial statements with both
management and the independent auditors before such statements
are approved by the Board of Directors and submitted to the share-
holders of the Bank.
The Conduct Review Committee of the Board of Directors,
composed entirely of outside Directors, reviews and reports its
findings to the Board of Directors on all related party transactions
having a material impact on the Bank.
KPMG and Price Waterhouse, the independent auditors
appointed by the shareholders of the Bank, have examined the con-
solidated financial statements of the Bank in accordance with gen-
erally accepted auditing standards and have expressed their opinion
upon completion of such examination in the following report to
the shareholders. The auditors have full and free access to, and meet
periodically with, the Audit Committee to discuss their audit and
findings as to the integrity of the Bank’s accounting and financial
reporting and the adequacy of the system of internal controls.
amounts and disclosures in the financial statements. An audit also
includes assessing the accounting principles used and significant
estimates made by management, as well as evaluating the overall
financial statement presentation.
In our opinion, these consolidated financial statements pre-
sent fairly, in all material respects, the financial position of the
Bank as at October 31, 1997 and 1996, and the results of its oper-
ations and the changes in its financial position for the years then
ended in accordance with generally accepted accounting principles
including the accounting requirements of the Superintendent of
Financial Institutions Canada.
Peter C. GodsoeChairman of the Boardand Chief Executive Officer
Toronto, November 26, 1997
Bruce R. BirminghamPresident
Robert W. ChisholmVice-Chairman andChief Financial Officer
KPMG Price WaterhouseChartered Accountants Chartered Accountants Toronto, November 26, 1997

S c o t i a b a n k 69
As at October 31 ($ millions) 1997 1996
A s s e t sCash resourcesCash and deposits with Bank of Canada $ 1,058 $ 1,485Deposits with other banks 17,116 13,252
18,174 14,737Securities (Note 3)
Issued or guaranteed by:Canada 8,782 9,101Provinces and municipalities 1,869 2,289
Other securities 17,348 14,515
27,999 25,905
Assets purchased under resale agreements 8,520 9,112
Loans (Note 4)
Residential mortgages 41,647 30,653Personal and credit card 17,668 16,718Business and governments 56,450 48,250
115,765 95,621OtherCustomers’ liability under acceptances 7,575 5,945Land, buildings and equipment (Note 6) 1,716 1,523Other assets (Note 7) 15,404 12,458
24,695 19,926
$ 195,153 $ 165,301
L i a b i l i t i e s a n d S h a r e h o l d e r s ’ E q u i t yDeposits (Note 8)
Personal $ 59,239 $ 47,768Business and governments 56,928 44,981Banks 22,808 25,145
138,975 117,894OtherCheques and other items in transit, net 340 459Acceptances 7,575 5,945Obligations related to assets sold under repurchase agreements 11,559 7,894Obligations related to securities sold short 3,739 6,509Other liabilities (Note 9) 18,263 15,499Non-controlling interest in subsidiaries 137 101
41,613 36,407
Subordinated debentures (Note 10) 5,167 3,251
Shareholders’ equityCapital stock (Note 11)
Preferred shares 1,468 1,325Common shares 2,567 2,161
Retained earnings (Note 2) 5,363 4,263
9,398 7,749
$ 195,153 $ 165,301
Peter C. GodsoeChairman of the Board andChief Executive Officer
Bruce R. BirminghamPresident
C O N S O L I D A T E D B A L A N C E S H E E T
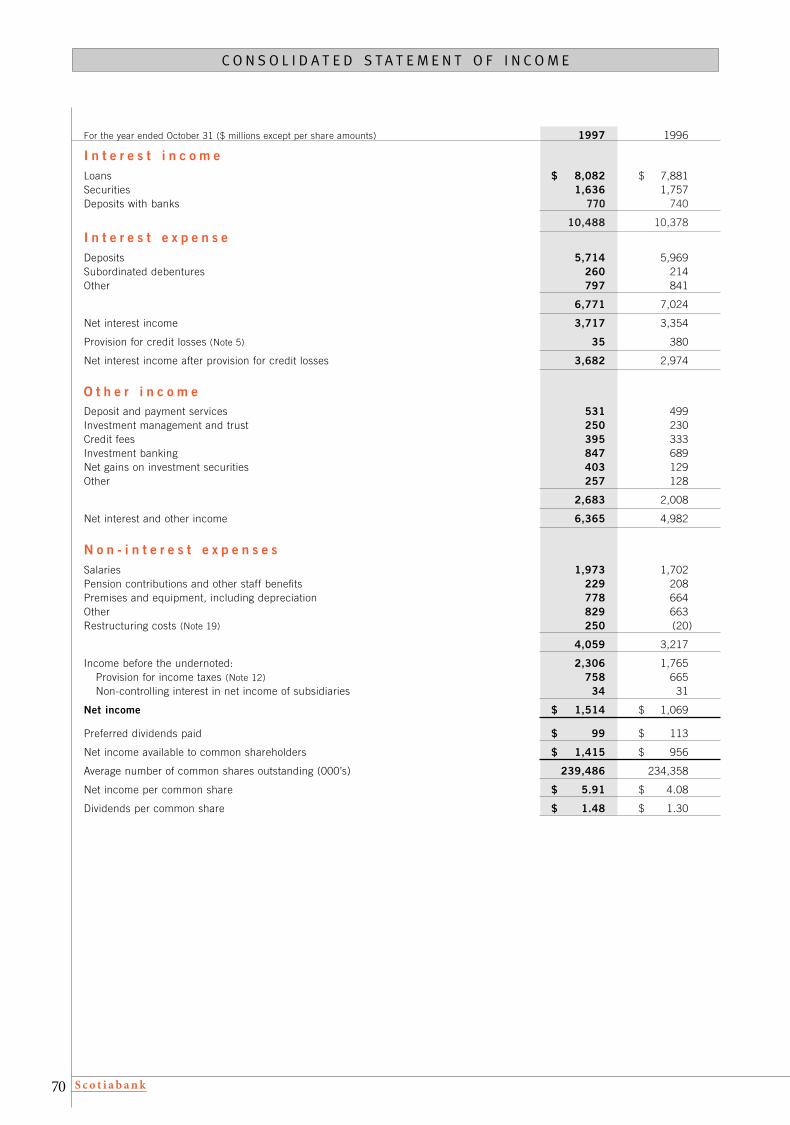
S c o t i a b a n k70
For the year ended October 31 ($ millions except per share amounts) 1997 1996
I n t e r e s t i n c o m eLoans $ 8,082 $ 7,881Securities 1,636 1,757Deposits with banks 770 740
10,488 10,378
I n t e r e s t e x p e n s eDeposits 5,714 5,969Subordinated debentures 260 214Other 797 841
6,771 7,024
Net interest income 3,717 3,354
Provision for credit losses (Note 5) 35 380
Net interest income after provision for credit losses 3,682 2,974
O t h e r i n c o m eDeposit and payment services 531 499Investment management and trust 250 230Credit fees 395 333Investment banking 847 689Net gains on investment securities 403 129Other 257 128
2,683 2,008
Net interest and other income 6,365 4,982
N o n - i n t e r e s t e x p e n s e sSalaries 1,973 1,702Pension contributions and other staff benefits 229 208Premises and equipment, including depreciation 778 664Other 829 663Restructuring costs (Note 19) 250 (20)
4,059 3,217
Income before the undernoted: 2,306 1,765Provision for income taxes (Note 12) 758 665Non-controlling interest in net income of subsidiaries 34 31
Net income $ 1,514 $ 1,069
Preferred dividends paid $ 99 $ 113
Net income available to common shareholders $ 1,415 $ 956
Average number of common shares outstanding (000’s) 239,486 234,358
Net income per common share $ 5.91 $ 4.08
Dividends per common share $ 1.48 $ 1.30
C O N S O L I D A T E D S TA T E M E N T O F I N C O M E
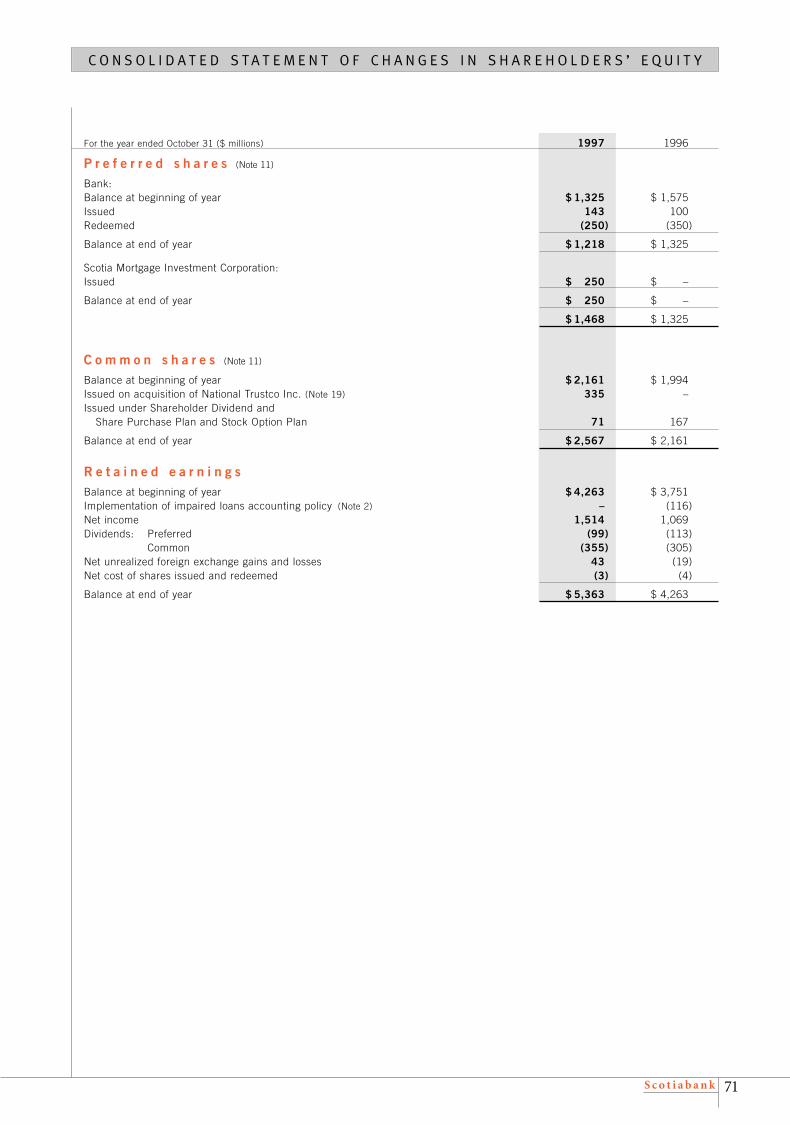
S c o t i a b a n k 71
For the year ended October 31 ($ millions) 1997 1996
P r e f e r r e d s h a r e s (Note 11)
Bank:Balance at beginning of year $ 1,325 $ 1,575Issued 143 100Redeemed (250) (350)
Balance at end of year $ 1,218 $ 1,325
Scotia Mortgage Investment Corporation:Issued $ 250 $ –
Balance at end of year $ 250 $ –
$ 1,468 $ 1,325
C o m m o n s h a r e s (Note 11)
Balance at beginning of year $ 2,161 $ 1,994Issued on acquisition of National Trustco Inc. (Note 19) 335 –Issued under Shareholder Dividend and
Share Purchase Plan and Stock Option Plan 71 167
Balance at end of year $ 2,567 $ 2,161
R e t a i n e d e a r n i n g s Balance at beginning of year $ 4,263 $ 3,751Implementation of impaired loans accounting policy (Note 2) – (116)Net income 1,514 1,069Dividends: Preferred (99) (113)
Common (355) (305)Net unrealized foreign exchange gains and losses 43 (19)Net cost of shares issued and redeemed (3) (4)
Balance at end of year $ 5,363 $ 4,263
C O N S O L I D A T E D S TA T E M E N T O F C H A N G E S I N S H A R E H O L D E R S ’ E Q U I T Y
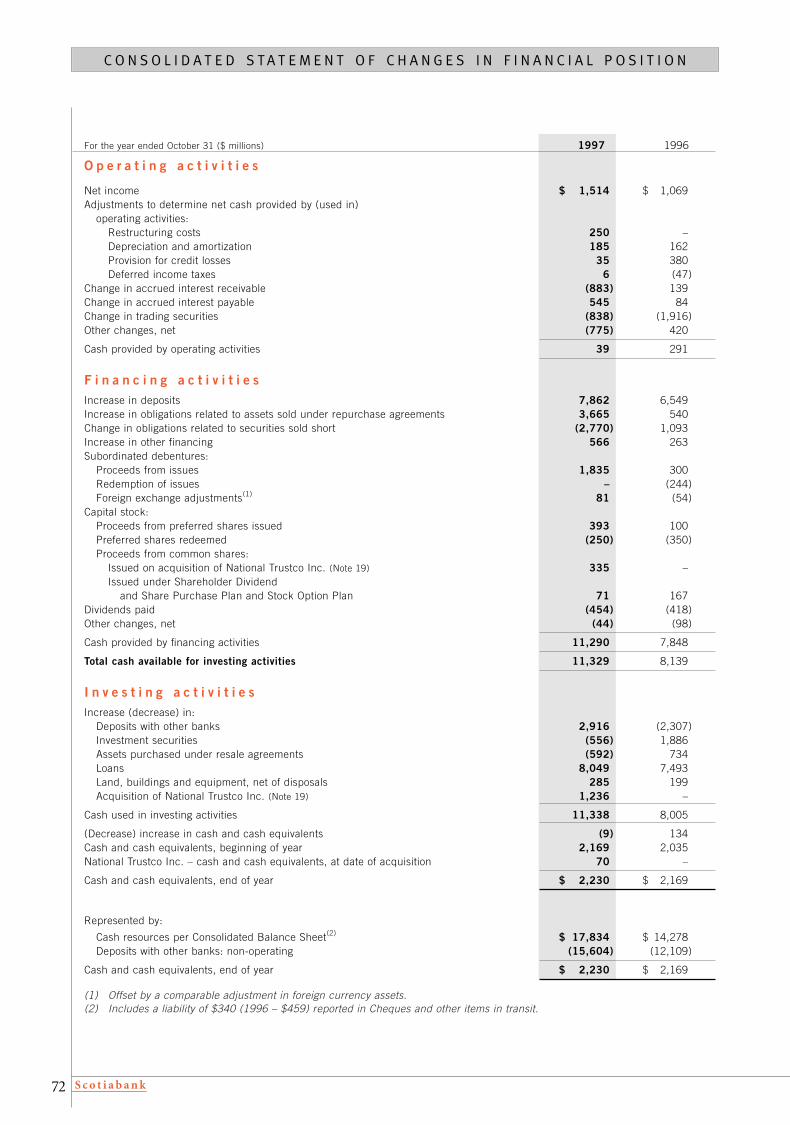
S c o t i a b a n k72
For the year ended October 31 ($ millions) 1997 1996
O p e r a t i n g a c t i v i t i e s
Net income $ 1,514 $ 1,069Adjustments to determine net cash provided by (used in)
operating activities:Restructuring costs 250 –Depreciation and amortization 185 162Provision for credit losses 35 380Deferred income taxes 6 (47)
Change in accrued interest receivable (883) 139Change in accrued interest payable 545 84Change in trading securities (838) (1,916)Other changes, net (775) 420
Cash provided by operating activities 39 291
F i n a n c i n g a c t i v i t i e sIncrease in deposits 7,862 6,549Increase in obligations related to assets sold under repurchase agreements 3,665 540Change in obligations related to securities sold short (2,770) 1,093Increase in other financing 566 263Subordinated debentures:
Proceeds from issues 1,835 300Redemption of issues – (244)Foreign exchange adjustments(1) 81 (54)
Capital stock:Proceeds from preferred shares issued 393 100Preferred shares redeemed (250) (350)Proceeds from common shares:
Issued on acquisition of National Trustco Inc. (Note 19) 335 –Issued under Shareholder Dividend
and Share Purchase Plan and Stock Option Plan 71 167Dividends paid (454) (418)Other changes, net (44) (98)
Cash provided by financing activities 11,290 7,848
Total cash available for investing activities 11,329 8,139
I n v e s t i n g a c t i v i t i e sIncrease (decrease) in:
Deposits with other banks 2,916 (2,307)Investment securities (556) 1,886Assets purchased under resale agreements (592) 734Loans 8,049 7,493Land, buildings and equipment, net of disposals 285 199Acquisition of National Trustco Inc. (Note 19) 1,236 –
Cash used in investing activities 11,338 8,005
(Decrease) increase in cash and cash equivalents (9) 134Cash and cash equivalents, beginning of year 2,169 2,035National Trustco Inc. – cash and cash equivalents, at date of acquisition 70 –
Cash and cash equivalents, end of year $ 2,230 $ 2,169
Represented by:
Cash resources per Consolidated Balance Sheet(2) $ 17,834 $ 14,278Deposits with other banks: non-operating (15,604) (12,109)
Cash and cash equivalents, end of year $ 2,230 $ 2,169
(1) Offset by a comparable adjustment in foreign currency assets.(2) Includes a liability of $340 (1996 – $459) reported in Cheques and other items in transit.
C O N S O L I D A T E D S TA T E M E N T O F C H A N G E S I N F I N A N C I A L P O S I T I O N

S c o t i a b a n k 73
n o t e d e s c r i p t i o n p a g e
1. Significant accounting policies 74
2. New accounting and reporting changes
(a) Financial instruments 76
(b) Change in the impaired loans accounting policy 76
(c) Reporting of gains and losses on securities 76
3. Securities 77
4. Loans 78
5. Impaired loans and allowance for credit losses
(a) Impaired loans 78
(b) Allowance for credit losses 79
6. Land, buildings and equipment 79
7. Other assets 79
8. Deposits 79
9. Other liabilities 80
10. Subordinated debentures 80
11. Capital stock 81
12. Income taxes 83
13. Pensions 84
14. Related party transactions 84
15. Segmented results of operations 84
16. Commitments and contingent liabilities
(a) Indirect credit commitments 84
(b) Lease commitments 85
(c) Pledging of assets 85
(d) Litigation 85
17. Financial instruments
(a) Fair value 85
(b) Interest rate risk 87
(c) Credit exposure 88
(d) Anticipatory hedges 89
18. Derivative instruments
(a) Notional amounts 89
(b) Remaining term to maturity 90
(c) Credit risk 91
(d) Fair value 92
19. Acquisition of National Trustco Inc. 93
N O T E S T O T H E C O N S O L I D A T E D F I N A N C I A L S TA T E M E N T S
i n d e x
S c o t i a b a n k74
1. Significant accounting policiesThe consolidated financial statements of The Bank of Nova
Scotia have been prepared in accordance with the Bank Actwhich states that, except as otherwise specified by theSuperintendent of Financial Institutions Canada (theSuperintendent), the financial statements are to be prepared inaccordance with generally accepted accounting principles. Thesignificant accounting policies used in the preparation of theseconsolidated financial statements, including the accountingrequirements of the Superintendent, are summarized on the fol-lowing pages. These accounting policies conform, in all materialrespects, to generally accepted accounting principles.
Certain comparative amounts have been reclassified to con-form with current year presentation.
Basis of consolidationThe consolidated financial statements include the assets,
liabilities and results of operations of the Bank and all of its sub-sidiaries and effectively controlled associated corporations afterthe elimination of intercompany transactions and balances.Subsidiaries are defined as corporations controlled by the Bankwhich are normally corporations in which the Bank owns morethan 50% of the voting shares. The purchase method is used toaccount for acquisitions of subsidiaries.
The cost of investments in subsidiaries in excess of fairvalue of the net identifiable assets acquired is amortized over theestimated periods to be benefitted, not exceeding 20 years. Theunamortized balance is recorded in Other Assets as goodwill.The value of goodwill is regularly evaluated by reviewing thereturns of the related business, taking into account the risk asso-ciated with the investment. Any permanent impairment in thevalue of goodwill is written off against earnings. Identifiableintangible assets are amortized over the estimated periods to bebenefitted and the unamortized balance is recorded in OtherAssets. The values of identifiable intangibles are regularly evalu-ated for impairment by reviewing the amount of the future netcash flows.
Investments in associated corporations, where the Bank hassignificant influence which is normally evidenced by direct orindirect ownership of between 20% and 50% of the votingshares, are carried on the equity basis of accounting and areincluded in Other Securities in the Consolidated Balance Sheet.The Bank’s share of earnings of such corporations is included inIncome from Securities in the Consolidated Statement of Income.
Translation of foreign currenciesAssets and liabilities denominated in foreign currencies are
translated into Canadian dollars at rates prevailing at the end ofthe financial year, except for the following which are recorded athistorical Canadian dollar cost: land, buildings and equipmentand foreign currency equity investments not funded in the samecurrency as the investments. All revenues and expenses denom-inated in foreign currencies are translated using averageexchange rates except for depreciation, which is based on thehistorical Canadian dollar cost of the related assets.
Unrealized translation gains and losses which arise uponconsolidation of net foreign currency investment positions inbranches, subsidiaries and associated corporations, net ofapplicable income taxes, together with any gains or losses arisingfrom hedges of those net investment positions, are credited orcharged to Retained Earnings, except as noted below. Upon saleor substantial liquidation of an investment position, the previous-ly recorded unrealized gains or losses thereon are transferredfrom Retained Earnings to the Consolidated Statement of Income.
Translation gains and losses arising from self-sustainingsubsidiaries and branches operating in highly inflationary envi-ronments, if any, are included in Other Income – InvestmentBanking.
SecuritiesSecurities are held in either the trading or investment
portfolio.Trading securities are intended to be held for a short peri-
od of time and are carried at market value. Gains and losses ondisposal and adjustments to market value are included in OtherIncome – Investment Banking.
Investment securities comprise debt and equity securitiesheld for liquidity and longer term investment. Equity securitiesin which the Bank’s holdings of voting shares are less than 20%are carried at cost, except where significant influence is demon-strated. Debt securities held in the investment account are car-ried at amortized cost with premiums and discounts beingamortized to income over the period to maturity. When there hasbeen a decline in value of debt or equity securities that is otherthan temporary, the carrying value of the securities is appropri-ately reduced. Such reductions, if any, together with gains andlosses on disposals are included in Other Income – Net Gains onInvestment Securities.
Included in the investment portfolio are bonds receivedfrom the conversion of loans to designated emerging marketswhich are recorded at their face value net of country risk provi-sions. Loan substitute securities are customer financings whichhave been restructured as after-tax investments rather thanconventional loans in order to provide the issuers with a lowerborrowing rate. Such securities are accorded the accountingtreatment applicable to loans.
Assets purchased/sold under resale/repurchase agreementsThe purchase and sale of securities under resale and
repurchase agreements are treated as collateralized lending andborrowing transactions. The related interest income and interestexpense are recorded on an accrual basis.
LoansLoans are stated net of any unearned income and of an
allowance for credit losses. Interest income is accounted for onthe accrual basis for all loans other than impaired loans.Accrued interest is included in Other Assets in the ConsolidatedBalance Sheet.
A loan is classified as impaired when, in management’sopinion, there has been a deterioration in credit quality to theextent that there is no longer reasonable assurance of timelycollection of the full amount of principal and interest. If a pay-ment on a loan is contractually 90 days in arrears, the loan willbe classified as impaired, if not already classified as such,unless the loan is fully secured, the collection of the debt is inprocess and the collection efforts are reasonably expected toresult in repayment of the loan or in restoring it to a current sta-tus within 180 days from the date a payment has become con-tractually in arrears. Finally, a loan that is contractually 180days in arrears is classified as impaired in all situations, exceptwhen it is guaranteed or insured by the Canadian government,the provinces or a Canadian government agency; such loans areclassified as impaired if the loan is contractually in arrears for365 days. Any credit card loan that has a payment that is con-tractually 180 days in arrears is written off.
When a loan is classified as impaired, recognition of inter-est in accordance with the terms of the original loan ceases. Forthose sovereign risk loans to which general country risk provi-sions apply, interest continues to be accrued in income, exceptwhen the loans are classified as impaired.
Loans are generally returned to accrual status when the timelycollection of both principal and interest is reasonably assured andall delinquent principal and interest payments are brought current.
Loan fees are recognized in income over the appropriatelending or commitment period.
S c o t i a b a n k 75
Allowance for credit lossesThe Bank maintains an allowance for credit losses, which
in management’s opinion, is adequate to absorb all credit-relat-ed losses in its portfolio of both on and off-balance sheet items,including deposits with other banks, loan substitute securities,assets purchased under resale agreements, loans, acceptances,derivative instruments and other indirect credit commitments,such as letters of credit and guarantees. The allowance for cred-it losses consists of specific provisions, provisions for doubtfulcredits, and general country risk provisions, each of which isreviewed on a regular basis. The allowance for credit lossesagainst on-balance sheet items is included as a reduction of therelated asset category, and allowances relating to off-balancesheet items are included in Other Liabilities.
Specific provisions, except those relating to credit cardloans and certain personal loans, are determined on an item-by-item basis and reflect the associated estimated credit loss. Inthe case of loans, the specific provision is the amount that isrequired to reduce the carrying value of an impaired loan to itsestimated realizable amount. Generally, the estimated realizableamount is measured by discounting the expected future cashflows at the effective interest rate inherent in the loan at the dateof impairment. When the amounts and timing of future cashflows cannot be measured with reasonable reliability, either thefair value of any security underlying the loan, net of expectedcosts of realization and any amounts legally required to be paidto the borrower, or the observable market price for the loan isused to measure the estimated realizable amount. The changein the present value attributable to the passage of time on theexpected future cash flows is reported as a reduction of theProvision for Credit Losses in the Consolidated Statement ofIncome. Specific provisions for credit card loans and certainpersonal loans are calculated using a formula method takinginto account recent loss experience.
Provisions for doubtful credits (General provisions) areestablished against the loan portfolio in respect of the Bank’score business lines where a prudent assessment by the Bank ofadverse economic trends suggests that losses may occur, butwhere such losses cannot yet be determined on an item-by-itembasis. Prior to 1997, the provision for doubtful credits wasestablished in respect of exposures to particular industries orgeographic regions.
Country risk provisions are maintained in accordancewith instructions issued by the Superintendent based on totaltransborder exposure to a prescribed group of countries. Inaccordance with those instructions, any new exposures tothose designated emerging markets after October 31, 1995are subject to the same procedures as those used for deter-mining specific provisions referred to above.
Loan securitizationsWhen the Bank enters into a transaction to transfer loans to
an unrelated third party, the Bank treats the transfer as a sale,provided that the significant risks and rewards of ownershiphave been transferred and there is reasonable assuranceregarding the measurement of the consideration derived. If theabove criteria are not satisfied, then the transfer is treated as afinancing transaction. If treated as a sale, the loan assets areremoved from the balance sheet. In determining the gain or losson sale, issuance costs are deducted from the sale proceeds.Losses on sales are recognized immediately. To the extent thatthere is recourse to the Bank under the transaction in excess ofexpected losses under recourse provisions, any gain on sale isnot recognized and is deferred until it is collected in cash andthere is no recourse to the cash. Where the Bank continues to
service the assets sold, the normal servicing fee is recognizedover the servicing period as earned.
AcceptancesThe Bank’s potential liability under acceptances is reported
as a liability in the Consolidated Balance Sheet. The Bank hasequal and offsetting claims against its customers in the event ofa call on these commitments, which are reported as an asset.
Land, buildings and equipmentLand is carried at cost. Buildings, equipment and leasehold
improvements are carried at cost less accumulated depreciationand amortization. Depreciation and amortization are calculatedusing the straight-line method over the estimated useful life ofthe related asset as follows: buildings – 40 years, equipment – 3 to 10 years, and leasehold improvements – term of lease plusone renewal option period.
Net gains and losses on disposal are included in OtherIncome – Other in the year of disposal.
Income taxesThe Bank follows the tax allocation basis of accounting for
income taxes, whereby income tax provisions or recoveries arerecorded in the years the income and expense are recognizedfor accounting purposes regardless of when related taxes areactually paid or recovered.
These provisions or recoveries include the income taxes applic-able to income included in the Consolidated Statement of Incomeand amounts charged or credited directly to Retained Earnings.Deferred income taxes, accumulated as a result of timing differ-ences, are included in Other Assets or Other Liabilities as applicable.
Precious metalsThe precious metals inventory is carried at market value
and is included in Cash Resources. The liability arising from out-standing certificates is also carried at market value and includ-ed in Other Liabilities.
Derivative instrumentsDerivative instruments are financial contracts whose value
is derived from interest rates, foreign exchange rates or otherfinancial or commodity indices. Most derivative instruments canbe characterized as interest rate contracts, foreign exchangecontracts, commodity contracts or equity contracts. Derivativeinstruments are either exchange-traded contracts or negotiatedover-the-counter contracts. Exchange-traded derivatives includefutures and option contracts. Negotiated over-the-counter deri-vatives include swaps, forwards and options.
The Bank enters into these derivative instruments toaccommodate the risk management needs of its customers, forproprietary trading and for asset/liability management purposes.
Derivative instruments designated as “trading” includederivatives entered into with customers to accommodate theirrisk management needs and derivatives transacted to generatetrading income from the Bank’s proprietary trading positions.Trading derivatives are carried at their fair values. The gains andlosses resulting from changes in fair values are included inOther Income – Investment Banking. Unrealized gains and unre-alized losses on trading derivatives are included in Other Assetsand Other Liabilities respectively. An element of revenue esti-mated to be sufficient to provide for future risks and administra-tive expenses associated with swaps and interest rate options isdeferred and amortized to Other Income – Investment Bankingover the life of the contracts.
Derivative instruments designated as “asset/liability man-agement” are those used to manage the Bank’s interest rate andforeign currency exposures. Income and expense on these

S c o t i a b a n k76
derivatives are recognized over the life of the related position asan adjustment to Net Interest Income. Realized gains and losseson terminated contracts are deferred and amortized over theremaining life of the related position. Accrued income andexpense and deferred gains and losses are included in OtherAssets and Other Liabilities, as appropriate.
Pensions and other post-retirement benefitsAssets of the pension funds are valued using a valuation
method that spreads all realized and unrealized capital gains andlosses over a five-year period. An actuarial valuation is performedeach year to determine the present value of the accrued pensionobligations based on management’s best estimates of variousassumptions, such as projected employee compensation levels
and rates of return on investments. Annual changes in net pen-
sion assets or obligations arising from experience gains or loss-
es, changes in assumptions, plan amendments and the net asset
position at the date the policy was implemented are amortized on
a straight-line basis over the expected average remaining service
life of the employee groups covered by the plan. The cumulative
difference between pension expense and funding contributions
is included in Other Assets or Other Liabilities, as appropriate.
The Bank also provides post-retirement benefits for employ-
ees which include health and dental care, and life insurance
benefits. The cost of these benefits is included in Pension
Contributions and Other Staff Benefits as incurred.
2. New accounting and reporting changes
a) Financial instrumentsIn fiscal 1997, the Bank completed its adoption of the new
accounting pronouncements established by the CanadianInstitute of Chartered Accountants on disclosure and presenta-tion of financial instruments. The principal impact on the Bank’sConsolidated Financial Statements of completing the adoption ofthese pronouncements relates to the presentation of unrealizedgains and losses on trading derivative instruments which arenow reported on a gross basis, whereas previously they werereported on a net basis in either Other Assets or Other Liabilities,as appropriate. The 1996 comparative amounts have beenrestated to reflect such amounts on a gross basis, resulting inboth Other Assets and Other Liabilities increasing by $8,040million.
b) Change in the impaired loans accounting policyIn accordance with guidelines issued by the
Superintendent, in fiscal 1996 the Bank adopted new impairedloans accounting principles established by the CanadianInstitute of Chartered Accountants. Under these guidelines,there is a requirement to measure impairment by discountingthe expected future cash flows associated with the impaired loanat the effective interest rate inherent in the loan at the date ofimpairment. The adoption of these principles by the Bank result-ed in a one-time increase in the allowance for credit lossesrecorded in the Consolidated Balance Sheet of $202 million anda corresponding cumulative charge to opening RetainedEarnings of $116 million (being net of deferred income taxes of$86 million) in fiscal 1996.
c) Reporting of gains and losses on securitiesGains and losses on securities are now reported in Other
Income, whereas previously they were reported in InterestIncome.

S c o t i a b a n k 77
3. SecuritiesRemaining term to maturity 1997 1996
No Within Three to One to Over specific Carrying Carrying
As at October 31 ($ millions) 3 months 12 months 5 years 5 years maturity value value
Investment securitiesCanadian federal
government debt $ 762 $ 1,666 $ 2,196 $ 413 $ – $ 5,037 $ 5,405Canadian provincial and
municipal debt 30 86 284 164 – 564 728Foreign government debt 455 1,180 840 1,662 – 4,137 3,307Bonds of designated
emerging markets(1) – – – 1,201 – 1,201 1,001Other debt 213 777 1,252 448 – 2,690 2,310Preferred shares 31 – 4 – 963(2) 998 760Common shares – – – – 1,516 1,516 1,314Associated corporations – – – 251 317(3) 568 596
Total investment securities 1,491 3,709 4,576 4,139 2,796 16,711 15,421
Loan substitute securities(4) 47 – 333 – – 380 414
Trading securities(5)
Canadian federal government debt 214 743 1,599 1,189 – 3,745 3,696
Canadian provincial andmunicipal debt 186 113 471 535 – 1,305 1,561
Foreign government debt 59 14 947 521 – 1,541 1,170Common shares – – – – 2,497 2,497 2,130Other 580 115 576 466 83 1,820 1,513
Total trading securities 1,039 985 3,593 2,711 2,580 10,908 10,070
Total securities $ 2,577 $ 4,694 $ 8,502 $ 6,850 $ 5,376 $ 27,999 $ 25,905
Total by currency: (in Canadian equivalent)Canadian dollar $ 1,790 $ 2,866 $ 5,524 $ 2,911 $ 4,041 $ 17,132 $ 16,889U.S. dollar 229 1,055 2,123 3,101 1,269 7,777 5,960Other currencies 558 773 855 838 66 3,090 3,056
Total securities $ 2,577 $ 4,694 $ 8,502 $ 6,850 $ 5,376 $ 27,999 $ 25,905
(1) This includes restructured bonds of designated emerging markets after deducting a country risk provision of $453 (1996 – $737). Refer to Note 5(b).
(2) Although these securities have no stated term, most of these securities provide the Bank with the contractual right to retractor otherwise dispose of these shares on earlier dates.
(3) Equity securities of associated corporations have no stated term and have been classified in the “No specific maturity” column.(4) Market value approximates carrying value.(5) Trading securities are carried at market value.
An analysis of unrealized gains and losses on investment securities is as follows:
1997 1996
Gross Gross Estimated Gross Gross EstimatedAs at October 31 Carrying unrealized unrealized market Carrying unrealized unrealized market($ millions) value gains losses value value gains losses value
Investment securitiesCanadian federal
government debt $ 5,037 $ 111 $ – $ 5,148 $ 5,405 $ 174 $ – $ 5,579Canadian provincial
and municipal debt 564 35 – 599 728 38 – 766Foreign government debt 4,137 147 12 4,272 3,307 55 5 3,357Bonds of designated
emerging markets 1,201 460 – 1,661 1,001 601 – 1,602Other debt 2,690 36 6 2,720 2,310 53 2 2,361Preferred shares 998 84 8 1,074 760 69 1 828Common shares 1,516 228 37 1,707 1,314 215 17 1,512Associated corporations 568 – – 568 596 – – 596
Total investment securities $ 16,711 $ 1,101 $ 63 $ 17,749 $ 15,421 $ 1,205 $ 25 $ 16,601
The net unrealized gains on investment securities of $1,038 million (1996 – $1,180 million) decreased to $817 million (1996 – $1,056 million) after the net fair value of derivative instruments associated with these securities is taken into account.
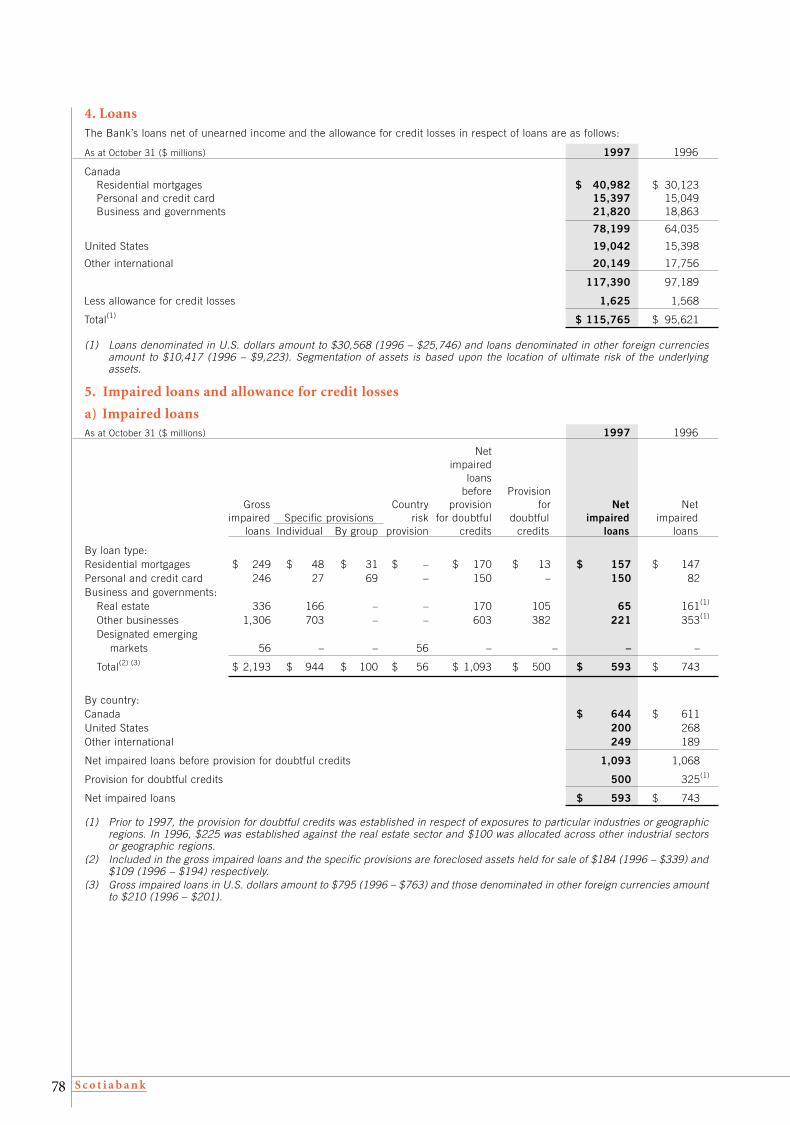
S c o t i a b a n k78
4. LoansThe Bank’s loans net of unearned income and the allowance for credit losses in respect of loans are as follows:
As at October 31 ($ millions) 1997 1996
CanadaResidential mortgages $ 40,982 $ 30,123Personal and credit card 15,397 15,049Business and governments 21,820 18,863
78,199 64,035
United States 19,042 15,398
Other international 20,149 17,756
117,390 97,189
Less allowance for credit losses 1,625 1,568
Total(1) $ 115,765 $ 95,621
(1) Loans denominated in U.S. dollars amount to $30,568 (1996 – $25,746) and loans denominated in other foreign currenciesamount to $10,417 (1996 – $9,223). Segmentation of assets is based upon the location of ultimate risk of the underlyingassets.
5. Impaired loans and allowance for credit losses
a) Impaired loansAs at October 31 ($ millions) 1997 1996
Netimpaired
loansbefore Provision
Gross Country provision for Net Netimpaired Specific provisions risk for doubtful doubtful impaired impaired
loans Individual By group provision credits credits loans loans
By loan type:Residential mortgages $ 249 $ 48 $ 31 $ – $ 170 $ 13 $ 157 $ 147Personal and credit card 246 27 69 – 150 – 150 82Business and governments:
Real estate 336 166 – – 170 105 65 161(1)
Other businesses 1,306 703 – – 603 382 221 353(1)
Designated emerging markets 56 – – 56 – – – –
Total(2) (3) $ 2,193 $ 944 $ 100 $ 56 $ 1,093 $ 500 $ 593 $ 743
By country:Canada $ 644 $ 611United States 200 268Other international 249 189
Net impaired loans before provision for doubtful credits 1,093 1,068
Provision for doubtful credits 500 325(1)
Net impaired loans $ 593 $ 743
(1) Prior to 1997, the provision for doubtful credits was established in respect of exposures to particular industries or geographicregions. In 1996, $225 was established against the real estate sector and $100 was allocated across other industrial sectorsor geographic regions.
(2) Included in the gross impaired loans and the specific provisions are foreclosed assets held for sale of $184 (1996 – $339) and$109 (1996 – $194) respectively.
(3) Gross impaired loans in U.S. dollars amount to $795 (1996 – $763) and those denominated in other foreign currencies amountto $210 (1996 – $201).
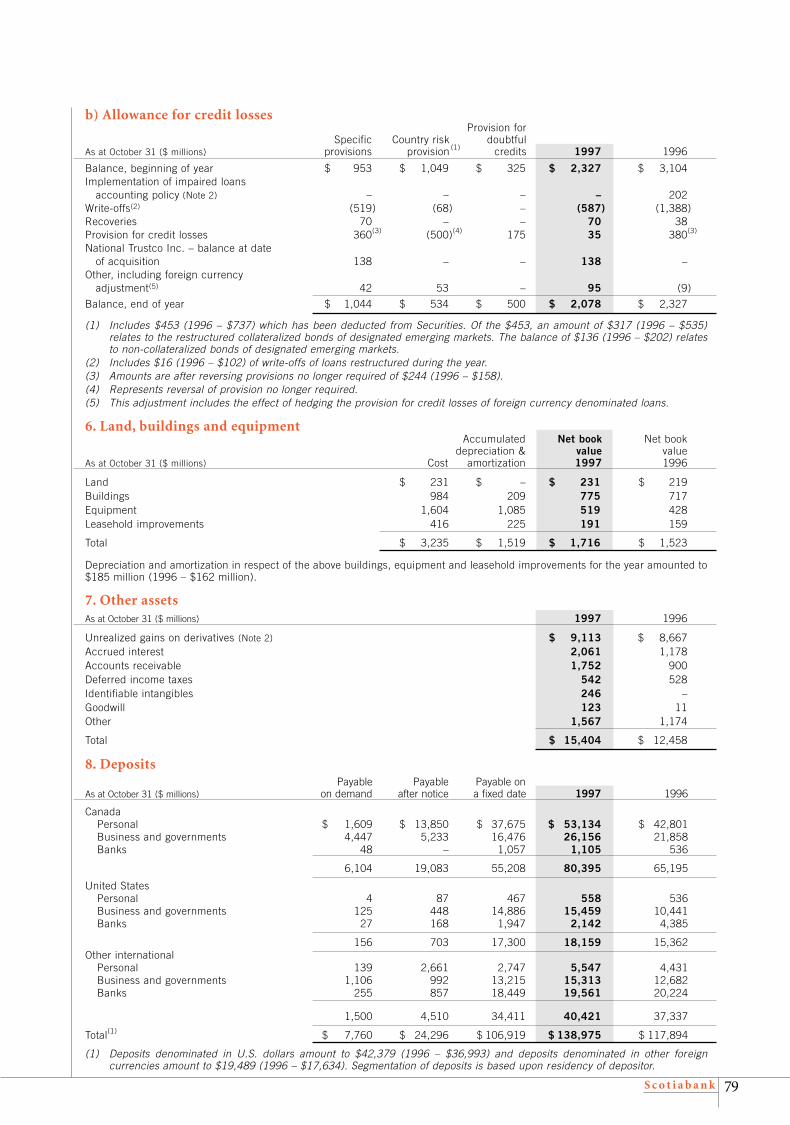
S c o t i a b a n k 79
b) Allowance for credit lossesProvision for
Specific Country risk doubtfulAs at October 31 ($ millions) provisions provision (1) credits 1997 1996
Balance, beginning of year $ 953 $ 1,049 $ 325 $ 2,327 $ 3,104Implementation of impaired loans
accounting policy (Note 2) – – – – 202Write-offs(2) (519) (68) – (587) (1,388)Recoveries 70 – – 70 38Provision for credit losses 360(3) (500)(4) 175 35 380(3)
National Trustco Inc. – balance at date of acquisition 138 – – 138 –
Other, including foreign currency adjustment(5) 42 53 – 95 (9)
Balance, end of year $ 1,044 $ 534 $ 500 $ 2,078 $ 2,327
(1) Includes $453 (1996 – $737) which has been deducted from Securities. Of the $453, an amount of $317 (1996 – $535)relates to the restructured collateralized bonds of designated emerging markets. The balance of $136 (1996 – $202) relatesto non-collateralized bonds of designated emerging markets.
(2) Includes $16 (1996 – $102) of write-offs of loans restructured during the year.(3) Amounts are after reversing provisions no longer required of $244 (1996 – $158).(4) Represents reversal of provision no longer required.(5) This adjustment includes the effect of hedging the provision for credit losses of foreign currency denominated loans.
6. Land, buildings and equipmentAccumulated Net book Net book
depreciation & value valueAs at October 31 ($ millions) Cost amortization 1997 1996
Land $ 231 $ – $ 231 $ 219Buildings 984 209 775 717Equipment 1,604 1,085 519 428Leasehold improvements 416 225 191 159
Total $ 3,235 $ 1,519 $ 1,716 $ 1,523
Depreciation and amortization in respect of the above buildings, equipment and leasehold improvements for the year amounted to$185 million (1996 – $162 million).
7. Other assetsAs at October 31 ($ millions) 1997 1996
Unrealized gains on derivatives (Note 2) $ 9,113 $ 8,667Accrued interest 2,061 1,178Accounts receivable 1,752 900Deferred income taxes 542 528Identifiable intangibles 246 –Goodwill 123 11Other 1,567 1,174
Total $ 15,404 $ 12,458
8. DepositsPayable Payable Payable on
As at October 31 ($ millions) on demand after notice a fixed date 1997 1996
CanadaPersonal $ 1,609 $ 13,850 $ 37,675 $ 53,134 $ 42,801Business and governments 4,447 5,233 16,476 26,156 21,858Banks 48 – 1,057 1,105 536
6,104 19,083 55,208 80,395 65,195
United StatesPersonal 4 87 467 558 536Business and governments 125 448 14,886 15,459 10,441Banks 27 168 1,947 2,142 4,385
156 703 17,300 18,159 15,362Other international
Personal 139 2,661 2,747 5,547 4,431Business and governments 1,106 992 13,215 15,313 12,682Banks 255 857 18,449 19,561 20,224
1,500 4,510 34,411 40,421 37,337
Total(1) $ 7,760 $ 24,296 $ 106,919 $ 138,975 $ 117,894
(1) Deposits denominated in U.S. dollars amount to $42,379 (1996 – $36,993) and deposits denominated in other foreign currencies amount to $19,489 (1996 – $17,634). Segmentation of deposits is based upon residency of depositor.

S c o t i a b a n k80
9. Other liabilities
As at October 31 ($ millions) 1997 1996
Unrealized losses on derivatives (Note 2) $ 8,834 $ 8,467Accrued interest 2,531 1,986Accounts payable and accrued expenses 1,202 565Deferred income 289 184Liabilities of subsidiaries, other than deposits 1,429 1,328Gold and silver certificates 2,512 1,946Other 1,466 1,023
Total $ 18,263 $ 15,499
10. Subordinated debentures
($ millions)
These debentures are direct, unsecured obligations of the Bank and are subordinate to the claims of the Bank’s depositors andother creditors. The Bank, where appropriate, enters into interest rate and cross currency swaps to hedge the related risks.
The outstanding debentures as at October 31 are:
Maturity date Interest rate Terms(1) (currency in millions) 1997 1996
October, 1998 77⁄20% ¥10,000 with interest payable in Australian dollars $ 117 $ 117
November, 1998 47⁄8% SFr 150 151 158
October, 1999 9% US $200 282 267
March, 2001 112⁄5% 100 100
March, 2001 103⁄4% 150 150
July, 2001 107⁄20% Redeemable in whole or in part at any time 200 200
March, 2003 81⁄10% 300 300
May, 2003 67⁄8% US $250 352 335
March, 2004 72⁄5% ¥10,000 with interest payable in Australian dollars redeemable in whole, but not in part, on March 29, 1999 117 117
December, 2006 6% Redeemable in whole or in part at any time. After December 4, 2001, interest will be payable at an annual rate equal to the 90 day Bankers’ Acceptance rate plus 1% 350 –
June, 2007 61⁄4% Redeemable in whole or in part at any time. After June 12, 2002, interest will be payable at an annual rate equal to the 90 day Bankers’ Acceptance rate plus 1% 300 –
July, 2007 61⁄2% US $500. Redeemable in whole or in part on any interest payment date on or after July 15, 2002. After July 15, 2002, interest will be payable at an annual rate equal to the US dollar three month LIBOR rate plus 1% 704 –
September, 2008 61⁄4% US $250 352 335
February, 2011 72⁄5% Redeemable in whole or in part on or after February 8, 2001. After February 8, 2006, interest will be payable at an annual rate equal to the 90 day Bankers’ Acceptance rate plus 1% 300 300
July, 2012 61⁄4% Redeemable in whole or in part at any time. On orafter July 16, 2007, interest will be payable at an annual rate equal to the 90 day Bankers’ Acceptance rate plus 1% 500 –
September, 2013 83⁄10% Redeemable in whole or in part on or after September 27, 1998 250 250
June, 2025 89⁄10% Redeemable in whole or in part on or after June 20, 2000 250 250
August, 2085 Floating US $278 bearing interest at a floating rate of 1⁄8 of 1% over the offered rate for six month Eurodollar deposits; redeemable in whole or in part on any interest payment date 392 372
Total $ 5,167 $ 3,251

S c o t i a b a n k 81
11. Capital stockAuthorized:
Preferred Shares: An unlimited number of shares without nominal or par value, the aggregate consideration of which shall notexceed $4 billion.
Common Shares: An unlimited number of shares without nominal or par value, the aggregate consideration of which shall not exceed $5 billion.
Issued and fully paid as at October 31
($ millions except share amounts) 1997 1996
Number of shares Number of sharesoutstanding Amount outstanding Amount
Series 5 Preferred Shares(1) – $ – 10,000,000 $ 250
Series 6 Preferred Shares(2) 12,000,000 300 12,000,000 300
Series 7 Preferred Shares(3) 8,000,000 200 8,000,000 200
Series 8 Preferred Shares(4) 9,000,000 225 9,000,000 225
Series 9 Preferred Shares(5) 10,000,000 250 10,000,000 250
Series 10 Preferred Shares(6) 438,278 4 10,000,000 100
Series 11 Preferred Shares(6) 9,561,722 239 – –
Preferred Shares issued by the Bank 49,000,000 $ 1,218 59,000,000 $ 1,325
Preferred Shares issued by Scotia Mortgage Investment Corporation(7) 250,000 250 – –
Total Preferred Shares 49,250,000 $ 1,468 59,000,000 $ 1,325
Common Shares:Outstanding at beginning of year 237,446,611 $ 2,161 232,256,402 $ 1,994
Issued to acquire National Trustco Inc. (Note 19) 5,682,167 335 – –
Issued under Shareholder Dividend and Share Purchase Plan(8) 786,814 43 5,098,734 164
Issued under Stock Option Plan(9) 990,560 28 91,475 3
Outstanding at end of year(8) (9) 244,906,152 $ 2,567 237,446,611 $ 2,161
Total capital stock $ 4,035 $ 3,486
(1) Series 5 Non-cumulative Preferred Shares were entitled tonon-cumulative preferential cash dividends payable quar-terly in an amount per share equal to the greater of (i)$0.578125 and (ii) 116% of the regular dividend for thesame quarter, if any, declared on each common share of theBank. With regulatory approval, the shares were redeemedby the Bank on October 29, 1997.
(2) Series 6 Non-cumulative Preferred Shares are entitled tonon-cumulative preferential cash dividends payable quar-terly in an amount per share of $0.446875. With regulatoryapproval, the shares may be redeemed by the Bank on orafter October 29, 2002, in whole or in part, by either thepayment of cash or the issuance of common shares. On andafter April 28, 2003, the Preferred Shares Series 6 will beconvertible at the option of the holder into common sharesof the Bank, subject to the right of the Bank prior to theconversion date to redeem for cash or find substitute pur-chasers for such preferred shares.
(3) Series 7 Non-cumulative Preferred Shares are entitled tonon-cumulative preferential cash dividends payable quar-terly in an amount per share of $0.44375. With regulatoryapproval, the shares may be redeemed by the Bank on orafter July 29, 2002, in whole or in part, at declining premi-ums, by either the payment of cash or the issuance of com-mon shares. On and after January 27, 2005, the PreferredShares Series 7 will be convertible at the option of the hold-er into common shares of the Bank, subject to the right ofthe Bank prior to the conversion date to redeem for cash orfind substitute purchasers for such preferred shares.
(4) Series 8 Non-cumulative Preferred Shares are entitled tonon-cumulative preferential cash dividends payable quar-terly in an amount per share of $0.4375. With regulatoryapproval, the shares may be redeemed by the Bank on orafter January 29, 2003, in whole or in part, at declining pre-miums, by either the payment of cash or the issuance ofcommon shares. On and after July 27, 2005, the Preferred
The aggregate maturities of the debentures, assuming holders redeem at the earliest possible dates under the terms of issue,are as follows:
Less than 1 year $ 117From 1 to 2 years 433From 2 to 5 years 450From 5 to 10 years 2,123Over 10 years 2,044
$ 5,167
(1) In accordance with the provisions of the Capital Adequacy Guideline of the Superintendent, all redemptions are subject to regulatory approval.

S c o t i a b a n k82
Shares Series 8 will be convertible at the option of the hold-er into common shares of the Bank, subject to the right ofthe Bank prior to the conversion date to redeem for cash orfind substitute purchasers for such preferred shares.
(5) Series 9 Non-cumulative Preferred Shares are entitled tonon-cumulative preferential cash dividends payable quar-terly in an amount per share of $0.421875. With regulato-ry approval, the shares may be redeemed by the Bank onor after April 28, 2003, in whole or in part, at declining pre-miums, by either the payment of cash or the issuance ofcommon shares. On and after October 27, 2005, thePreferred Shares Series 9 will be convertible at the optionof the holder into common shares of the Bank, subject tothe right of the Bank prior to the conversion date to redeemfor cash or find substitute purchasers for such preferredshares.
(6) On March 28, 1996, the Bank issued 10,000,000 Units for$100 million. Each Unit consists of one Non-cumulativePreferred Shares Series 10 and one Non-cumulativePreferred Shares Series 11 Purchase Warrant. ThePreferred Shares Series 10 were entitled to non-cumulativepreferential cash dividends, payable quarterly in anamount per share of $0.16625. From and after October 29,1997, such quarterly cash dividends have been reduced to$0.02 per share. On each of October 29, 1997, January28, 1998, and April 28, 1998, the Preferred Shares Series 10 are convertible into Non-cumulative PreferredShares Series 11 with the concurrent exercise of an equalnumber of Warrants together with a cash payment of$15.00 per Warrant. Consequently, the conversion of onePreferred Shares Series 10, the exercise of one Warrantand a cash payment of $15.00 will entitle the holder toreceive one Preferred Shares Series 11. With regulatoryapproval, any such shares not converted may be redeemedby the Bank at par on or after April 26, 2001, in whole orin part, by the payment in cash of $10.00 for each suchshare together with declared and unpaid dividends to theredemption date.
On October 29, 1997, 9,561,722 Units were convert-ed into Preferred Shares Series 11. The Preferred SharesSeries 11 are entitled to non-cumulative preferential cashdividends payable quarterly in an amount per share of$0.375. The first of such dividends, if declared, shall bepaid on January 28, 1998. With regulatory approval, theshares may be redeemed by the Bank on or after January28, 2004, in whole or in part, by either the payment of cashor the issuance of common shares. On and after January27, 2006, the Preferred Shares Series 11 will be convert-ible at the option of the holder into common shares of theBank, subject to the right of the Bank prior to the conver-sion date to redeem for cash or find substitute purchasersfor such preferred shares.
(7) On October 31, 1997, Scotia Mortgage InvestmentCorporation, a subsidiary of the Bank, issued 250,000Preferred Shares Class A for $250 million. Each PreferredShare Class A will be entitled to non-cumulative preferen-tial cash dividends, if and when declared, payable semi-annually in an amount per share of $32.85. The first ofsuch dividends, if declared, shall be paid on April 30,1998. Scotia Mortgage Investment Corporation is a mort-gage investment corporation, as defined in the federalincome tax act, and as such the dividends received by aholder of the Preferred Shares Class A, which is resident inCanada, will be treated as interest for Canadian federalincome tax purposes. With regulatory approval, on or afterOctober 31, 2007, Preferred Shares Class A may beredeemed in whole by the payment of cash by ScotiaMortgage Investment Corporation or at the option of theBank exchanged for common shares of the Bank. On orafter October 31, 2007, the Preferred Shares Class A willbe exchangeable at the option of the holder into commonshares of the Bank, subject to the right of the Bank prior tothe exchange date to purchase for cash or find substitutepurchasers for such shares. Under certain circumstancesthe Preferred Shares Class A of Scotia MortgageInvestment Corporation will be automatically exchanged,without the consent of the holder, into Non-cumulativePreferred Shares Series Z of the Bank which would bearthe same dividend rate and similar redemption features.
(8) As at October 31, 1997, common shares totalling7,938,958 have been reserved for future issue under termsof the Shareholder Dividend and Share Purchase Plan. OnNovember 1, 1996, the Bank amended the ShareholderDividend and Share Purchase Plan to eliminate the 5%share price discount and to provide that the Bank mayelect whether common shares issued under the plan areeither newly issued treasury shares or purchased on theopen market.
(9) Under terms of the Stock Option Plan, options to purchasecommon shares may be granted to selected employees atan exercise price not less than the closing price of thecommon shares on the Toronto Stock Exchange on the last trade date prior to the date of the grant. The optionsare exercisable no later than 10 years after the date of the grant.
The maximum number of common shares to be issuedover the life of the Stock Option Plan is 12,000,000. Optionsto purchase 6,957,390 common shares at a weighted aver-age price per share of $37.82 were outstanding as atOctober 31, 1997. During 1997, options to purchase990,560 shares were exercised at a weighted average priceof $28.12 and 168,875 options were forfeited.
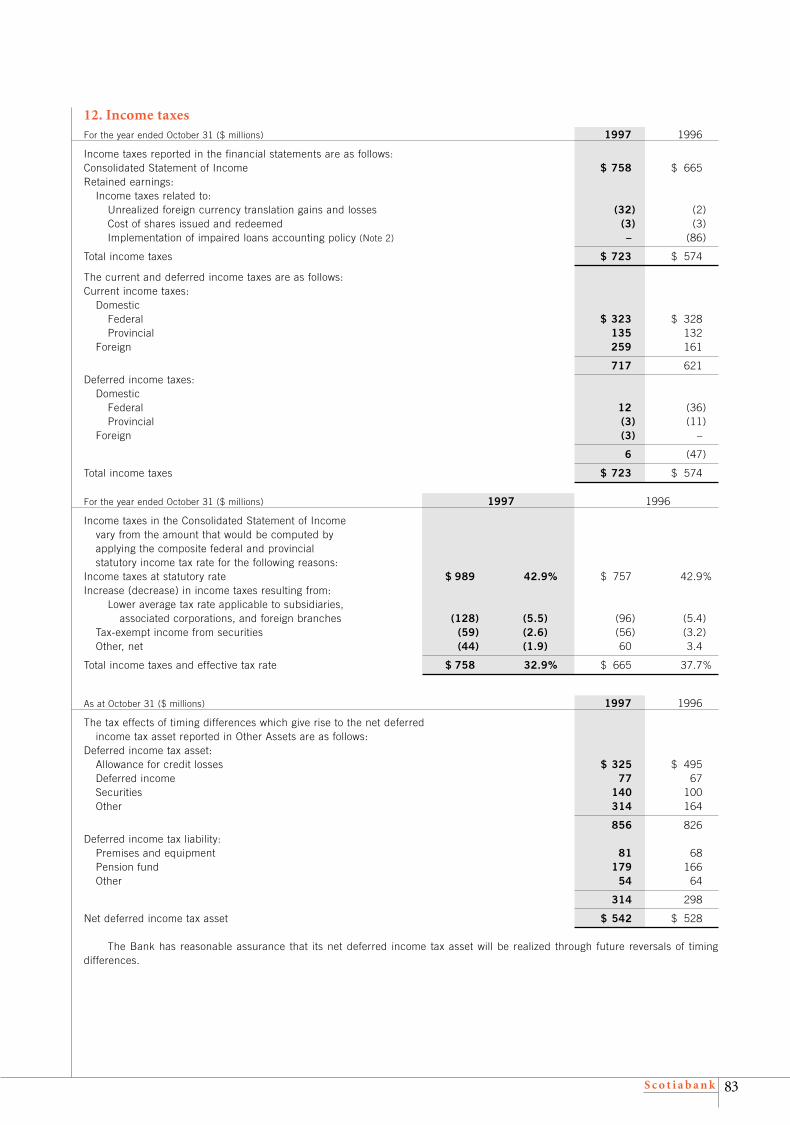
S c o t i a b a n k 83
12. Income taxesFor the year ended October 31 ($ millions) 1997 1996
Income taxes reported in the financial statements are as follows:Consolidated Statement of Income $ 758 $ 665Retained earnings:
Income taxes related to:Unrealized foreign currency translation gains and losses (32) (2)Cost of shares issued and redeemed (3) (3)Implementation of impaired loans accounting policy (Note 2) – (86)
Total income taxes $ 723 $ 574
The current and deferred income taxes are as follows:Current income taxes:
DomesticFederal $ 323 $ 328Provincial 135 132
Foreign 259 161
717 621Deferred income taxes:
DomesticFederal 12 (36)Provincial (3) (11)
Foreign (3) –
6 (47)
Total income taxes $ 723 $ 574
For the year ended October 31 ($ millions) 1997 1996
Income taxes in the Consolidated Statement of Income vary from the amount that would be computed by applying the composite federal and provincial statutory income tax rate for the following reasons:
Income taxes at statutory rate $ 989 42.9% $ 757 42.9%Increase (decrease) in income taxes resulting from:
Lower average tax rate applicable to subsidiaries, associated corporations, and foreign branches (128) (5.5) (96) (5.4)
Tax-exempt income from securities (59) (2.6) (56) (3.2)Other, net (44) (1.9) 60 3.4
Total income taxes and effective tax rate $ 758 32.9% $ 665 37.7%
As at October 31 ($ millions) 1997 1996
The tax effects of timing differences which give rise to the net deferred income tax asset reported in Other Assets are as follows:
Deferred income tax asset:Allowance for credit losses $ 325 $ 495Deferred income 77 67Securities 140 100Other 314 164
856 826Deferred income tax liability:
Premises and equipment 81 68Pension fund 179 166Other 54 64
314 298
Net deferred income tax asset $ 542 $ 528
The Bank has reasonable assurance that its net deferred income tax asset will be realized through future reversals of timing differences.
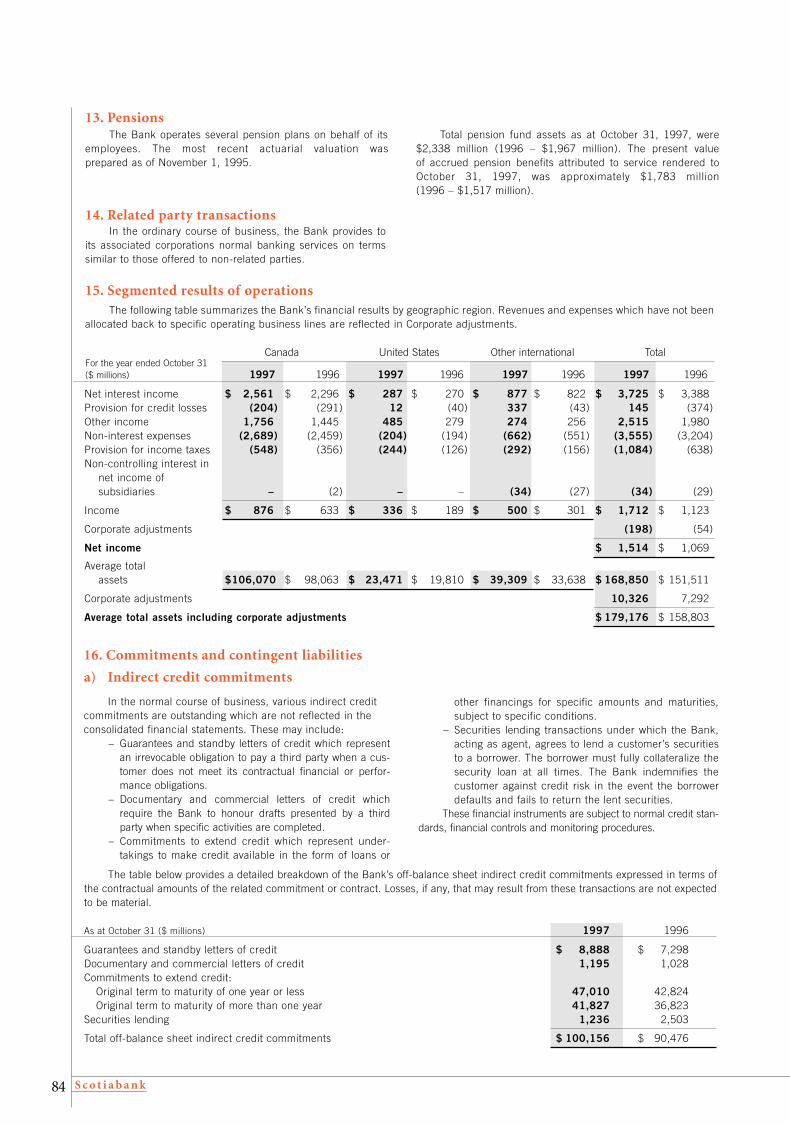
S c o t i a b a n k84
15. Segmented results of operationsThe following table summarizes the Bank’s financial results by geographic region. Revenues and expenses which have not been
allocated back to specific operating business lines are reflected in Corporate adjustments.
Canada United States Other international TotalFor the year ended October 31($ millions) 1997 1996 1997 1996 1997 1996 1997 1996
Net interest income $ 2,561 $ 2,296 $ 287 $ 270 $ 877 $ 822 $ 3,725 $ 3,388Provision for credit losses (204) (291) 12 (40) 337 (43) 145 (374)Other income 1,756 1,445 485 279 274 256 2,515 1,980Non-interest expenses (2,689) (2,459) (204) (194) (662) (551) (3,555) (3,204)Provision for income taxes (548) (356) (244) (126) (292) (156) (1,084) (638)Non-controlling interest in
net income of subsidiaries – (2) – – (34) (27) (34) (29)
Income $ 876 $ 633 $ 336 $ 189 $ 500 $ 301 $ 1,712 $ 1,123
Corporate adjustments (198) (54)
Net income $ 1,514 $ 1,069
Average total assets $106,070 $ 98,063 $ 23,471 $ 19,810 $ 39,309 $ 33,638 $ 168,850 $ 151,511
Corporate adjustments 10,326 7,292
Average total assets including corporate adjustments $ 179,176 $ 158,803
13. PensionsThe Bank operates several pension plans on behalf of its
employees. The most recent actuarial valuation was prepared as of November 1, 1995.
Total pension fund assets as at October 31, 1997, were$2,338 million (1996 – $1,967 million). The present value of accrued pension benefits attributed to service rendered toOctober 31, 1997, was approximately $1,783 million (1996 – $1,517 million).
16. Commitments and contingent liabilities
a) Indirect credit commitments
In the normal course of business, various indirect creditcommitments are outstanding which are not reflected in theconsolidated financial statements. These may include:
– Guarantees and standby letters of credit which representan irrevocable obligation to pay a third party when a cus-tomer does not meet its contractual financial or perfor-mance obligations.
– Documentary and commercial letters of credit whichrequire the Bank to honour drafts presented by a thirdparty when specific activities are completed.
– Commitments to extend credit which represent under-takings to make credit available in the form of loans or
other financings for specific amounts and maturities,subject to specific conditions.
– Securities lending transactions under which the Bank,acting as agent, agrees to lend a customer’s securitiesto a borrower. The borrower must fully collateralize thesecurity loan at all times. The Bank indemnifies thecustomer against credit risk in the event the borrowerdefaults and fails to return the lent securities.
These financial instruments are subject to normal credit stan-dards, financial controls and monitoring procedures.
14. Related party transactions In the ordinary course of business, the Bank provides to
its associated corporations normal banking services on termssimilar to those offered to non-related parties.
The table below provides a detailed breakdown of the Bank’s off-balance sheet indirect credit commitments expressed in terms ofthe contractual amounts of the related commitment or contract. Losses, if any, that may result from these transactions are not expectedto be material.
As at October 31 ($ millions) 1997 1996
Guarantees and standby letters of credit $ 8,888 $ 7,298Documentary and commercial letters of credit 1,195 1,028Commitments to extend credit:
Original term to maturity of one year or less 47,010 42,824Original term to maturity of more than one year 41,827 36,823
Securities lending 1,236 2,503
Total off-balance sheet indirect credit commitments $ 100,156 $ 90,476
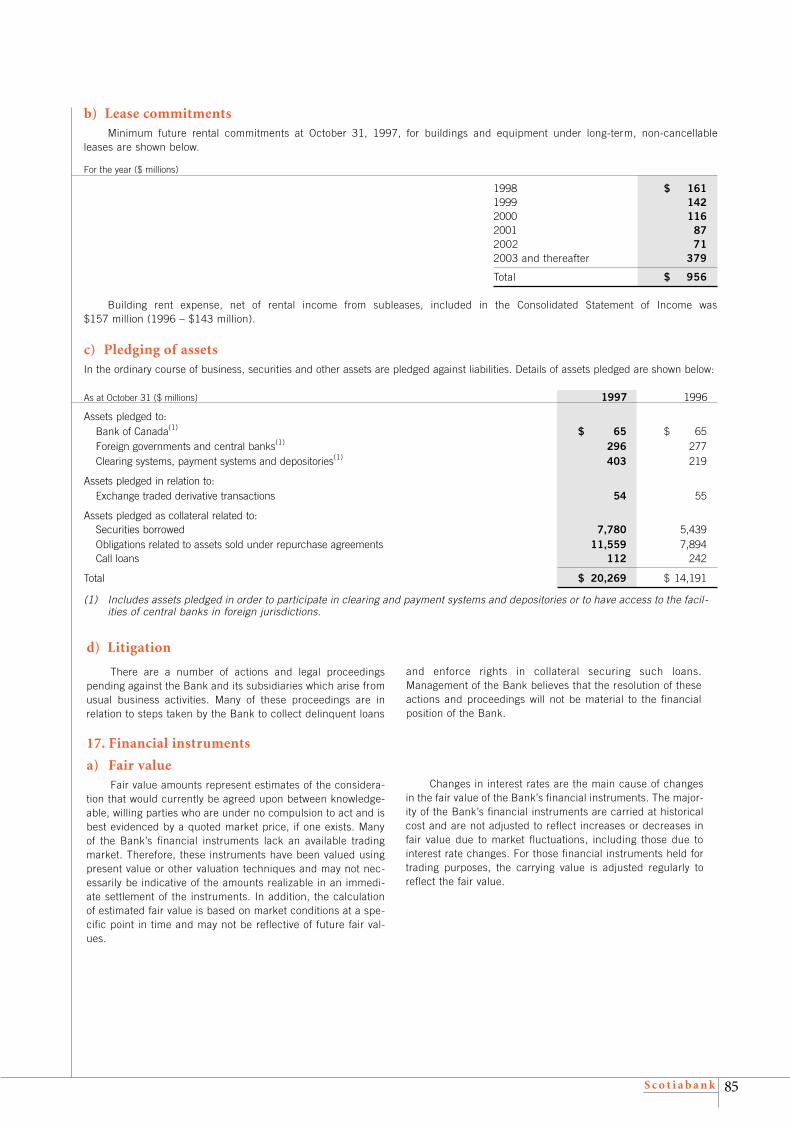
S c o t i a b a n k 85
b) Lease commitmentsMinimum future rental commitments at October 31, 1997, for buildings and equipment under long-term, non-cancellable
leases are shown below.
For the year ($ millions)
1998 $ 1611999 1422000 1162001 872002 712003 and thereafter 379
Total $ 956
Building rent expense, net of rental income from subleases, included in the Consolidated Statement of Income was $157 million (1996 – $143 million).
c) Pledging of assetsIn the ordinary course of business, securities and other assets are pledged against liabilities. Details of assets pledged are shown below:
As at October 31 ($ millions) 1997 1996
Assets pledged to:Bank of Canada(1) $ 65 $ 65Foreign governments and central banks(1) 296 277Clearing systems, payment systems and depositories(1) 403 219
Assets pledged in relation to:Exchange traded derivative transactions 54 55
Assets pledged as collateral related to:Securities borrowed 7,780 5,439Obligations related to assets sold under repurchase agreements 11,559 7,894Call loans 112 242
Total $ 20,269 $ 14,191
(1) Includes assets pledged in order to participate in clearing and payment systems and depositories or to have access to the facil-ities of central banks in foreign jurisdictions.
d) Litigation
There are a number of actions and legal proceedingspending against the Bank and its subsidiaries which arise fromusual business activities. Many of these proceedings are inrelation to steps taken by the Bank to collect delinquent loans
and enforce rights in collateral securing such loans.Management of the Bank believes that the resolution of theseactions and proceedings will not be material to the financialposition of the Bank.
17. Financial instruments
a) Fair valueFair value amounts represent estimates of the considera-
tion that would currently be agreed upon between knowledge-able, willing parties who are under no compulsion to act and isbest evidenced by a quoted market price, if one exists. Manyof the Bank’s financial instruments lack an available tradingmarket. Therefore, these instruments have been valued usingpresent value or other valuation techniques and may not nec-essarily be indicative of the amounts realizable in an immedi-ate settlement of the instruments. In addition, the calculationof estimated fair value is based on market conditions at a spe-cific point in time and may not be reflective of future fair val-ues.
Changes in interest rates are the main cause of changesin the fair value of the Bank’s financial instruments. The major-ity of the Bank’s financial instruments are carried at historicalcost and are not adjusted to reflect increases or decreases infair value due to market fluctuations, including those due tointerest rate changes. For those financial instruments held fortrading purposes, the carrying value is adjusted regularly toreflect the fair value.

S c o t i a b a n k86
1997 1996
Total Fair value Total Total Fair valueFair value book over/(under) fair book over/(under)
As at October 31 ($ millions) Trading Non-trading Total value book value value value book value
AssetsCash resources $ – $ 18,174 $ 18,174 $18,174 $ – $ 14,737 $ 14,737 $ –Securities (Note 3) 10,908 18,129 29,037 27,999 1,038 27,085 25,905 1,180Assets purchased under
resale agreements 8,520 – 8,520 8,520 – 9,112 9,112 –Loans – 117,430 117,430 115,765 1,665 97,138 95,621 1,517Customers’ liability under
acceptances – 7,575 7,575 7,575 – 5,945 5,945 –Other – 4,120 4,120 4,120 – 2,511 2,511 –
LiabilitiesDeposits – 140,407 140,407 138,975 1,432 119,245 117,894 1,351Acceptances – 7,575 7,575 7,575 – 5,945 5,945 –Obligations related to
assets sold under repurchase agreements 11,559 – 11,559 11,559 – 7,894 7,894 –
Obligations related to securities sold short 3,739 – 3,739 3,739 – 6,509 6,509 –
Other – 9,138 9,138 9,138 – 7,279 7,279 –Subordinated debentures – 5,445 5,445 5,167 278 3,406 3,251 155
Derivatives (Note 18) 53 716 769 704(1) 65 740 455(1) 285
(1) This amount represents a net asset.
The book value of financial assets and financial liabilities held for purposes other than trading may exceed its fair value due primarily to changes in interest rates. In such instances, the Bank does not reduce the book value of these financial assets and financial liabilities to their fair values as it is the Bank’s intention to hold them to maturity.
Determination of fair valueThe following methods and assumptions were used to esti-
mate the fair values of on-balance sheet financial instruments:The fair values of Cash Resources, Assets Purchased
under Resale Agreements, Customers’ Liability underAcceptances, Other Assets, Obligations Related to Assets Soldunder Repurchase Agreements, Obligations Related toSecurities Sold Short, Acceptances and Other Liabilities areassumed to approximate their carrying values, due to theirshort-term nature.
The fair value of securities is assumed to be equal to theestimated market value of securities provided in Note 3. Thesevalues are based on quoted market prices, when available.When a quoted price is not readily available, market values areestimated using quoted market prices of similar securities, orother valuation techniques.
The estimated fair value of loans reflects changes in thegeneral level of interest rates that have occurred since the loanswere originated. The particular valuation methods used are asfollows:
– For loans to designated emerging markets, fair value is basedon quoted market prices.
– For floating rate loans, fair value is assumed to be equal tobook value as the interest rates on these loans automaticallyreprice to market.
– For all other loans, fair value is determined by discounting theexpected future cash flows of these loans at market rates forloans with similar terms and risks.
The fair values of deposits payable on demand or afternotice or floating rate deposits payable on a fixed date areassumed to be equal to their carrying values. The estimated fairvalues of fixed rate deposits payable on a fixed date are deter-mined by discounting the contractual cash flows, using marketinterest rates currently offered for deposits with similar termsand risks.
The fair values of subordinated debentures and liabilities ofsubsidiaries, other than deposits (included in other liabilities),are determined by reference to current market prices for debtwith similar terms and risks.
The following table sets out the fair values of on-balance sheet financial instruments and derivative instruments of the Bankusing the valuation methods and assumptions described below. The fair values disclosed do not reflect the value of assets and lia-bilities that are not considered financial instruments, such as land, buildings and equipment.

S c o t i a b a n k 87
b) Interest rate riskThe following table summarizes carrying amounts of balance sheet assets, liabilities and equity, and off-balance sheet financial
instruments in order to arrive at the Bank’s interest rate gap based on the earlier of contractual repricing or maturity dates. To arriveat the Bank’s view of its effective interest rate gap, adjustments are made to factor in expected mortgage and loan repayments basedon historical patterns, and to reclassify the Bank’s trading instruments to the immediately rate sensitive category.
1997Immediately(1) Within Three to One to Over Non-rate
As at October 31 ($ millions) rate sensitive 3 months 12 months 5 years 5 years sensitive Total
Cash resources $ 1,239 $ 11,655 $ 3,874 $ – $ – $ 1,406 $ 18,174Trading securities 262 949 940 3,567 2,634 2,556 10,908Investment and loan substitute
securities 894 2,041 4,125 3,872 3,483 2,676(2) 17,091Assets purchased under resale
agreements – 7,651 765 104 – – 8,520Loans 20,113 40,425 17,480 35,717 1,462 568(3) 115,765
Other assets – – – – – 24,695(4) 24,695
Total assets 22,508 62,721 27,184 43,260 7,579 31,901 195,153
Deposits 10,609 70,941 28,133 19,864 250 9,178 138,975Obligations related to assets
sold under repurchaseagreements – 11,328 231 – – – 11,559
Obligations related tosecurities sold short – 80 420 1,325 1,619 295 3,739
Subordinated debentures – – 509 883 3,775 – 5,167Other liabilities – – 277 257 – 25,781(4) 26,315
Shareholders’ equity – – – – – 9,398(4) 9,398
Total liabilities and shareholders’ equity 10,609 82,349 29,570 22,329 5,644 44,652 195,153
On-balance sheet gap 11,899 (19,628) (2,386) 20,931 1,935 (12,751) –
Off-balance sheet gap – (2,593) 8,640 (4,107) (1,940) – –Interest rate sensitivity gap based
on contractual repricing 11,899 (22,221) 6,254 16,824 (5) (12,751) –
Adjustment to expected repricing 29 1,870 2,742 (4,229) (495) 83 –Total interest rate sensitivity gap $ 11,928 $ (20,351) $ 8,996 $ 12,595 $ (500) $ (12,668) $ –
Cumulative gap 11,928 (8,423) 573 13,168 12,668 – –
As at October 31, 1996
Total interest rate sensitivity gap $ 11,790 $ (18,632) $ 2,123 $ 13,545 $ 452 $ (9,278) $ –
Cumulative gap 11,790 (6,842) (4,719) 8,826 9,278 – –
(1) Represents those financial instruments whose interest rates change concurrently with a change in the underlying interest ratebasis, for example, prime rate loans.
(2) This includes financial instruments such as common shares, non-term preferred shares, and shares in associated corporations.(3) This includes impaired loans.(4) This includes non-financial instruments.
The tables on the following page summarize average effective yields, by the earlier of the contractual repricing or maturity dates,for the following on-balance sheet rate-sensitive financial instruments (these rates are shown before and after adjusting for the impactof related derivatives used by the Bank for asset/liability risk management purposes).
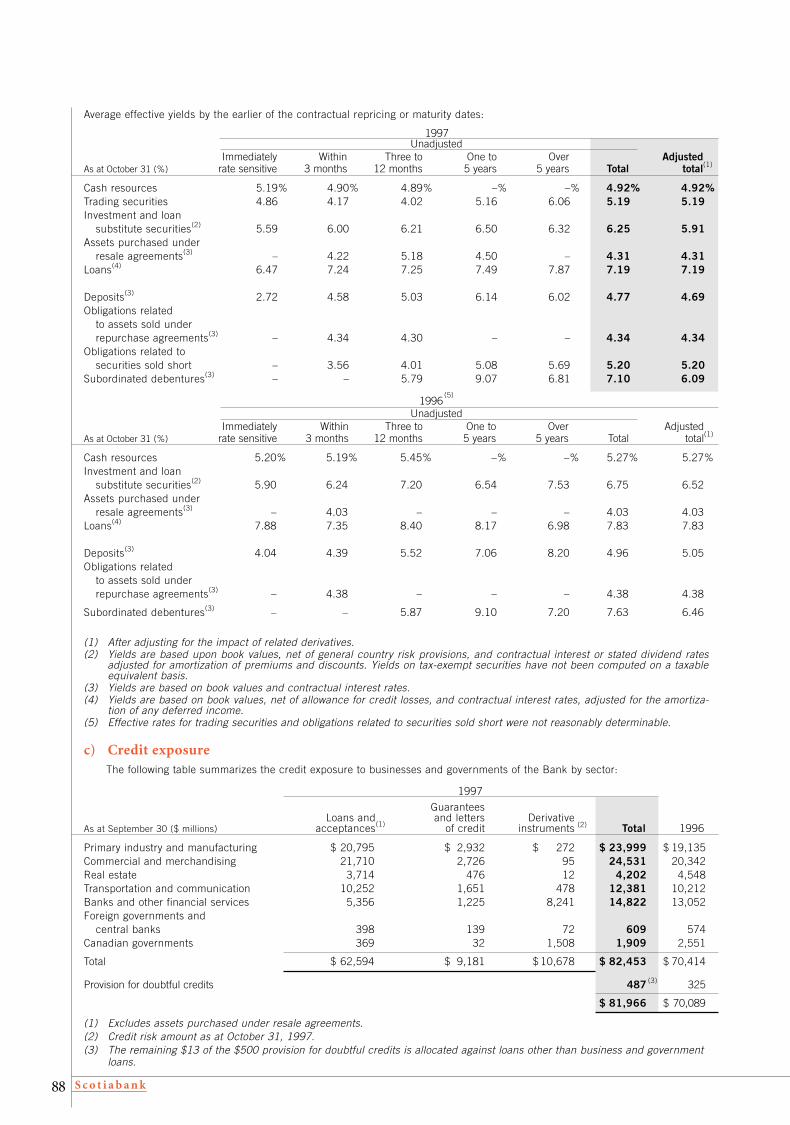
S c o t i a b a n k88
Average effective yields by the earlier of the contractual repricing or maturity dates:
1997Unadjusted
Immediately Within Three to One to Over AdjustedAs at October 31 (%) rate sensitive 3 months 12 months 5 years 5 years Total total(1)
Cash resources 5.19% 4.90% 4.89% –% –% 4.92% 4.92%Trading securities 4.86 4.17 4.02 5.16 6.06 5.19 5.19Investment and loan
substitute securities(2) 5.59 6.00 6.21 6.50 6.32 6.25 5.91Assets purchased under
resale agreements(3) – 4.22 5.18 4.50 – 4.31 4.31Loans(4) 6.47 7.24 7.25 7.49 7.87 7.19 7.19
Deposits(3) 2.72 4.58 5.03 6.14 6.02 4.77 4.69Obligations related
to assets sold under repurchase agreements(3) – 4.34 4.30 – – 4.34 4.34
Obligations related to securities sold short – 3.56 4.01 5.08 5.69 5.20 5.20
Subordinated debentures(3) – – 5.79 9.07 6.81 7.10 6.09
1996(5)
UnadjustedImmediately Within Three to One to Over Adjusted
As at October 31 (%) rate sensitive 3 months 12 months 5 years 5 years Total total(1)
Cash resources 5.20% 5.19% 5.45% –% –% 5.27% 5.27%Investment and loan
substitute securities(2) 5.90 6.24 7.20 6.54 7.53 6.75 6.52Assets purchased under
resale agreements(3) – 4.03 – – – 4.03 4.03Loans(4) 7.88 7.35 8.40 8.17 6.98 7.83 7.83
Deposits(3) 4.04 4.39 5.52 7.06 8.20 4.96 5.05Obligations related
to assets sold under repurchase agreements(3) – 4.38 – – – 4.38 4.38
Subordinated debentures(3) – – 5.87 9.10 7.20 7.63 6.46
(1) After adjusting for the impact of related derivatives.(2) Yields are based upon book values, net of general country risk provisions, and contractual interest or stated dividend rates
adjusted for amortization of premiums and discounts. Yields on tax-exempt securities have not been computed on a taxableequivalent basis.
(3) Yields are based on book values and contractual interest rates.(4) Yields are based on book values, net of allowance for credit losses, and contractual interest rates, adjusted for the amortiza-
tion of any deferred income.(5) Effective rates for trading securities and obligations related to securities sold short were not reasonably determinable.
c) Credit exposureThe following table summarizes the credit exposure to businesses and governments of the Bank by sector:
1997
GuaranteesLoans and and letters Derivative
As at September 30 ($ millions) acceptances(1) of credit instruments (2) Total 1996
Primary industry and manufacturing $ 20,795 $ 2,932 $ 272 $ 23,999 $ 19,135Commercial and merchandising 21,710 2,726 95 24,531 20,342Real estate 3,714 476 12 4,202 4,548Transportation and communication 10,252 1,651 478 12,381 10,212Banks and other financial services 5,356 1,225 8,241 14,822 13,052Foreign governments and
central banks 398 139 72 609 574Canadian governments 369 32 1,508 1,909 2,551
Total $ 62,594 $ 9,181 $ 10,678 $ 82,453 $ 70,414
Provision for doubtful credits 487 (3) 325
$ 81,966 $ 70,089
(1) Excludes assets purchased under resale agreements.(2) Credit risk amount as at October 31, 1997.(3) The remaining $13 of the $500 provision for doubtful credits is allocated against loans other than business and government
loans.

S c o t i a b a n k 89
18. Derivative instruments
a) Notional amountsThe following table provides the aggregate notional amounts of off-balance sheet derivative instruments outstanding by type and
segregated between those used by the Bank in its dealer capacity (Trading) and those used in the Bank’s asset/liability risk manage-ment process (ALM). The notional amounts of these contracts represent the derivatives volume outstanding and do not represent thepotential gain or loss associated with the market risk or credit risk of such instruments. The notional amounts represent the amountto which a rate or price is applied to determine the amount of cash flows to be exchanged.
As at October 31 ($ millions) 1997 1996
Trading ALM Total Trading ALM Total
Interest rate contractsExchange traded:
Futures $ 42,549 $ 18,589 $ 61,138 $ 32,969 $ 10,711 $ 43,680Options purchased 14,352 – 14,352 15,001 68 15,069Options written 586 – 586 4,932 – 4,932
57,487 18,589 76,076 52,902 10,779 63,681Over-the-counter:
Forward rate agreements 106,335 44,107 150,442 46,276 33,522 79,798Swaps 357,650 61,813 419,463 269,642 39,588 309,230Options purchased 35,084 2,059 37,143 40,330 – 40,330Options written 43,176 – 43,176 47,196 – 47,196
542,245 107,979 650,224 403,444 73,110 476,554
Total $ 599,732 $ 126,568 $ 726,300 $ 456,346 $ 83,889 $ 540,235Foreign exchange contractsExchange traded:
Futures $ 100 $ – $ 100 $ 487 $ – $ 487Options purchased 182 – 182 745 – 745Options written 141 – 141 476 – 476
423 – 423 1,708 – 1,708Over-the-counter:
Spot and forwards 179,579 12,119 191,698 175,189 26,065 201,254Swaps 25,965 4,686 30,651 30,482 2,262 32,744Options purchased 13,446 – 13,446 10,014 – 10,014Options written 15,268 – 15,268 9,594 – 9,594
234,258 16,805 251,063 225,279 28,327 253,606
Total $ 234,681 $ 16,805 $ 251,486 $ 226,987 $ 28,327 $ 255,314Other derivative contracts(1)
Exchange traded $ 208 $ – $ 208 $ 194 $ – $ 194Over-the-counter 8,632 1,730 10,362 6,054 215 6,269
Total $ 8,840 $ 1,730 $ 10,570 $ 6,248 $ 215 $ 6,463
Total notional amountsoutstanding $ 843,253 $ 145,103 $ 988,356 $ 689,581 $ 112,431 $ 802,012
(1) Consists of equity, precious metals, and base metals derivatives.
d) Anticipatory hedgesIn its normal course of business, the Bank may decide to
hedge anticipatory transactions such as future foreign revenuesand expenses and planned deposit campaigns. As at October
31, 1997, and 1996, there were no material anticipatory hedgesoutstanding.
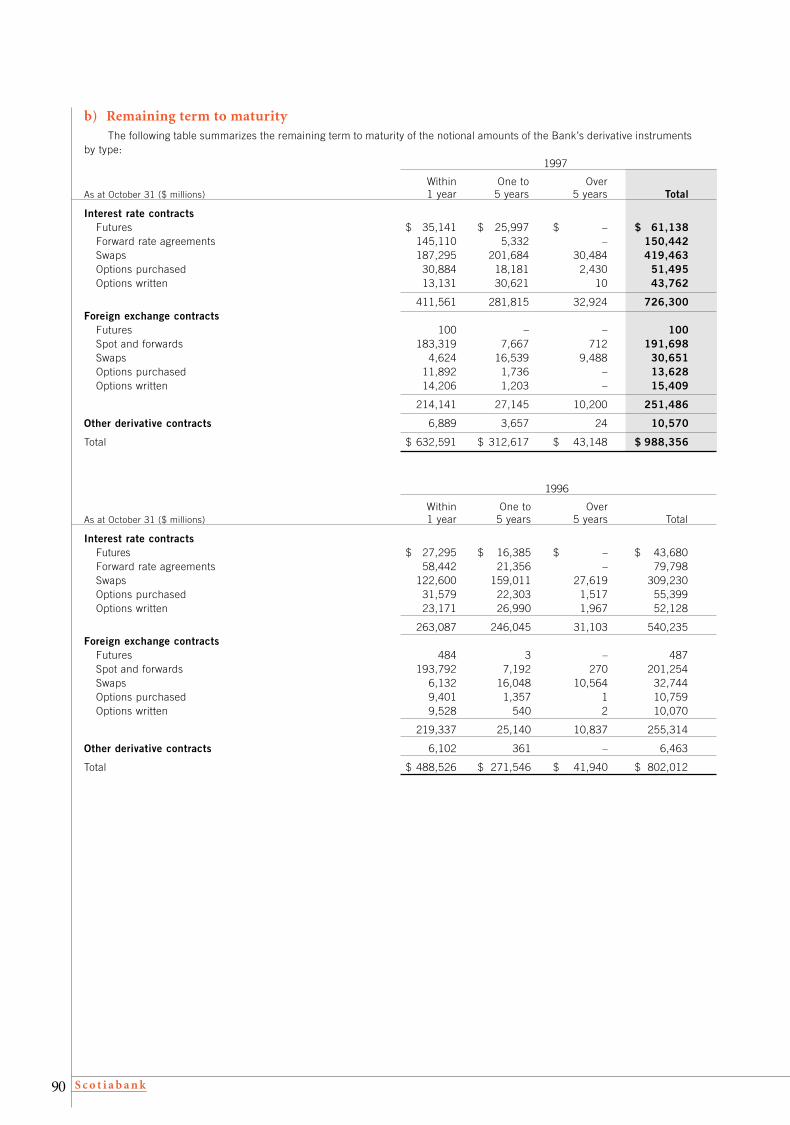
S c o t i a b a n k90
b) Remaining term to maturityThe following table summarizes the remaining term to maturity of the notional amounts of the Bank’s derivative instruments
by type:1997
Within One to OverAs at October 31 ($ millions) 1 year 5 years 5 years Total
Interest rate contractsFutures $ 35,141 $ 25,997 $ – $ 61,138Forward rate agreements 145,110 5,332 – 150,442Swaps 187,295 201,684 30,484 419,463Options purchased 30,884 18,181 2,430 51,495Options written 13,131 30,621 10 43,762
411,561 281,815 32,924 726,300Foreign exchange contracts
Futures 100 – – 100Spot and forwards 183,319 7,667 712 191,698Swaps 4,624 16,539 9,488 30,651Options purchased 11,892 1,736 – 13,628Options written 14,206 1,203 – 15,409
214,141 27,145 10,200 251,486
Other derivative contracts 6,889 3,657 24 10,570
Total $ 632,591 $ 312,617 $ 43,148 $ 988,356
1996
Within One to Over As at October 31 ($ millions) 1 year 5 years 5 years Total
Interest rate contractsFutures $ 27,295 $ 16,385 $ – $ 43,680Forward rate agreements 58,442 21,356 – 79,798Swaps 122,600 159,011 27,619 309,230Options purchased 31,579 22,303 1,517 55,399Options written 23,171 26,990 1,967 52,128
263,087 246,045 31,103 540,235Foreign exchange contracts
Futures 484 3 – 487Spot and forwards 193,792 7,192 270 201,254Swaps 6,132 16,048 10,564 32,744Options purchased 9,401 1,357 1 10,759Options written 9,528 540 2 10,070
219,337 25,140 10,837 255,314
Other derivative contracts 6,102 361 – 6,463
Total $ 488,526 $ 271,546 $ 41,940 $ 802,012

S c o t i a b a n k 91
The following table summarizes the credit exposure of the Bank’s derivatives. The credit risk amount (CRA) represents the esti-mated replacement cost, or positive fair value, for all contracts without taking into account any master netting or collateral ar range-ments that have been made. The CRA does not reflect actual or expected losses.
The credit equivalent amount (CEA) is the CRA plus an add-on for potential future exposure. The add-on amount is based on aformula prescribed in the Capital Adequacy Guideline of the Superintendent. The risk weighted balance is the CEA multiplied by coun-terparty risk factors prescribed by this guideline.
1997 1996
CreditCredit risk Potential equivalent Risk Credit risk Risk
Notional amount future amount weighted amount weightedamount (CRA) exposure (CEA) balance (CRA) balance
As at October 31 ($ millions) (a) (b) (a) + (b)
Interest rate contractsFutures $ 61,138 $ – $ – $ – $ – $ – $ –Forward rate agreements 150,442 73 27 100 22 79 39Swaps 419,463 6,291 1,464 7,755 1,522 6,212 1,523Options purchased 51,495 216 127 343 93 283 101Options written 43,762 – – – – – –
726,300 6,580 1,618 8,198 1,637 6,574 1,663Foreign exchange contracts
Futures 100 – – – – – –Spot and forwards 191,698 2,330 2,017 4,347 1,126 2,314 1,044Swaps 30,651 1,286 1,585 2,871 499 1,408 469Options purchased 13,628 159 195 354 79 43 49Options written 15,409 – – – – – –
251,486 3,775 3,797 7,572 1,704 3,765 1,562
Other derivative contracts 10,570 323 385 708 159 36 72
Total derivatives $ 988,356 $ 10,678 $ 5,800 $ 16,478 $ 3,500 $ 10,375 $ 3,297
Less: impact of master netting agreements 3,141 957 3,213 621
Total $ 7,537 $ 2,543 $ 7,162 $ 2,676
c) Credit riskAs with on-balance sheet assets, derivative instruments are
subject to credit risk. Credit risk arises from the possibility thatcounterparties may default on their obligations to the Bank.However, whereas the credit risk of on-balance sheet assets isrepresented by the principal amount net of any applicableallowance for credit losses, the credit risk associated with deriv-atives is normally a small fraction of the notional amount of thederivative instrument. Derivative contracts expose the Bank tocredit loss only if changes in market rates affect a counterpar-ty’s position unfavourably and the counterparty defaults on pay-ment. Accordingly, credit risk of derivatives is represented bythe positive fair value of the instrument.
Negotiated over-the-counter derivatives often presentgreater credit exposure than exchange-traded contracts. Thenet change in the exchange-traded contracts is normally settleddaily in cash with the exchange. Holders of these contracts look
to the exchange for performance under the contract. The Bankstrives to limit credit risk by dealing with counterparties that itbelieves are creditworthy, and manages its credit risk for deriva-tives through the same credit risk process applied to on-balancesheet assets.
The Bank pursues opportunities to reduce its exposure tocredit losses on derivative instruments. These opportunitiesinclude entering into master netting arrangements with counter-parties. The credit risk associated with favourable contracts iseliminated by a master netting arrangement to the extent thatunfavourable contracts with the same counterparty are not set-tled before favourable contracts. The Bank’s overall exposure tocredit risk on derivative instruments subject to a master nettingarrangement can change substantially within a short period sinceit is affected by each transaction subject to the arrangement.

S c o t i a b a n k92
d) Fair valueFair values of exchange-traded derivatives are based on
quoted market prices. Fair values of over-the-counter (OTC)derivatives are determined using pricing models, which take into
account current market and contractual prices of the underlyinginstruments, as well as time value and yield curve or volatilityfactors underlying the positions.
The following table summarizes the fair value of derivatives segregated by type and segregated between trading and those deriv-atives used in the Bank’s asset/liability risk management process (ALM).
1997 1996
Trading(1) ALM(1)(2) Total Total
As at October 31 ($ millions) Favourable Unfavourable Favourable Unfavourable Favourable Unfavourable Favourable Unfavourable
Interest rate contractsForward rate agreements $ 59 $ 60 $ 14 $ 24 $ 73 $ 84 $ 79 $ 74Swaps 5,464 4,662 827 669 6,291 5,331 6,212 5,069Options 211 263 5 – 216 263 283 301
5,734 4,985 846 693 6,580 5,678 6,574 5,444Foreign exchange contracts
Forwards 2,028 2,014 302 237 2,330 2,251 2,314 2,482Swaps 899 1,697 387 107 1,286 1,804 1,408 1,581Options 159 104 – – 159 104 43 50
3,086 3,815 689 344 3,775 4,159 3,765 4,113
Other derivative contracts 105 72 218 – 323 72 36 78
Total fair value $ 8,925 $ 8,872 $ 1,753 $ 1,037 $ 10,678 $ 9,909 $ 10,375 $ 9,635
Less: impact of master netting agreements 3,141 3,141 3,213 3,213
Total $ 7,537 $ 6,768 $ 7,162 $ 6,422
(1) Fair values have been segregated between those contracts which are in a favourable position (positive fair value) and those contracts which are in an unfavourable position (negative fair value).
(2) The fair values of these derivative financial instruments partially offset the changes in fair values of related on-balance sheetfinancial instruments.
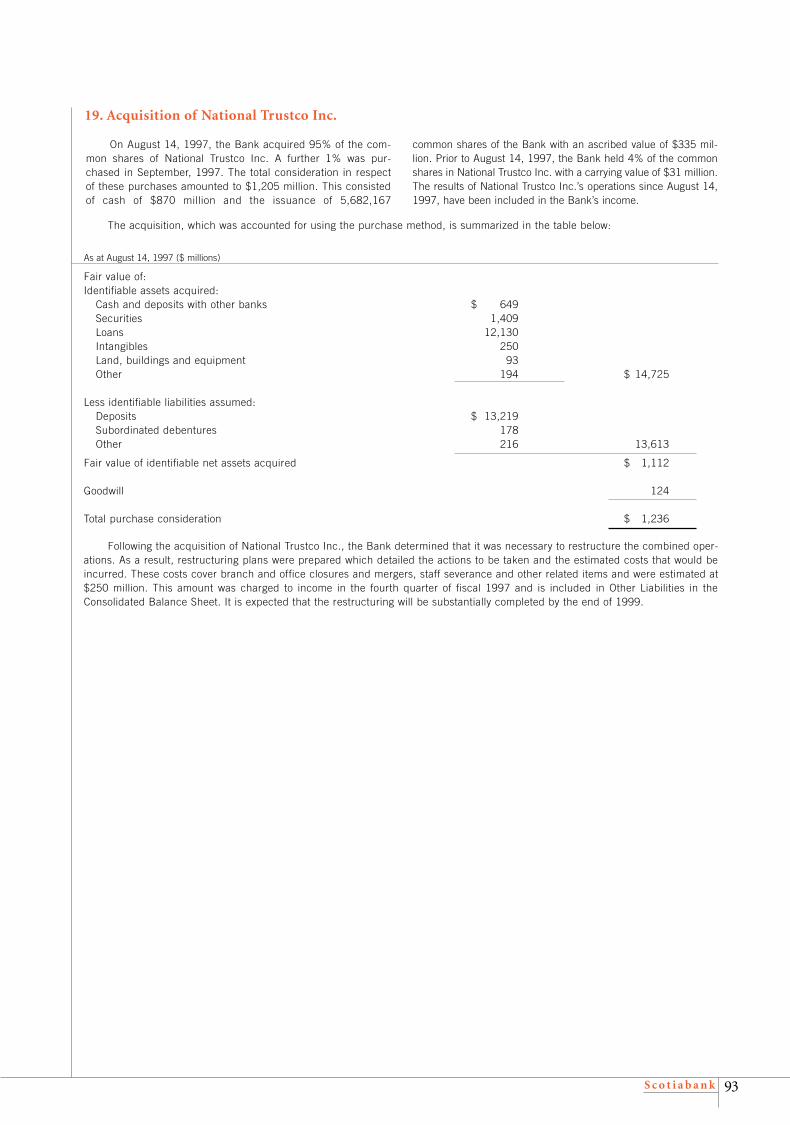
S c o t i a b a n k 93
19. Acquisition of National Trustco Inc.
On August 14, 1997, the Bank acquired 95% of the com-mon shares of National Trustco Inc. A further 1% was pur-chased in September, 1997. The total consideration in respectof these purchases amounted to $1,205 million. This consistedof cash of $870 million and the issuance of 5,682,167
common shares of the Bank with an ascribed value of $335 mil-lion. Prior to August 14, 1997, the Bank held 4% of the commonshares in National Trustco Inc. with a carrying value of $31 million.The results of National Trustco Inc.’s operations since August 14,1997, have been included in the Bank’s income.
The acquisition, which was accounted for using the purchase method, is summarized in the table below:
As at August 14, 1997 ($ millions)
Fair value of:Identifiable assets acquired:
Cash and deposits with other banks $ 649Securities 1,409Loans 12,130Intangibles 250Land, buildings and equipment 93Other 194 $ 14,725
Less identifiable liabilities assumed:Deposits $ 13,219Subordinated debentures 178Other 216 13,613
Fair value of identifiable net assets acquired $ 1,112
Goodwill 124
Total purchase consideration $ 1,236
Following the acquisition of National Trustco Inc., the Bank determined that it was necessary to restructure the combined oper-ations. As a result, restructuring plans were prepared which detailed the actions to be taken and the estimated costs that would beincurred. These costs cover branch and office closures and mergers, staff severance and other related items and were estimated at$250 million. This amount was charged to income in the fourth quarter of fiscal 1997 and is included in Other Liabilities in theConsolidated Balance Sheet. It is expected that the restructuring will be substantially completed by the end of 1999.
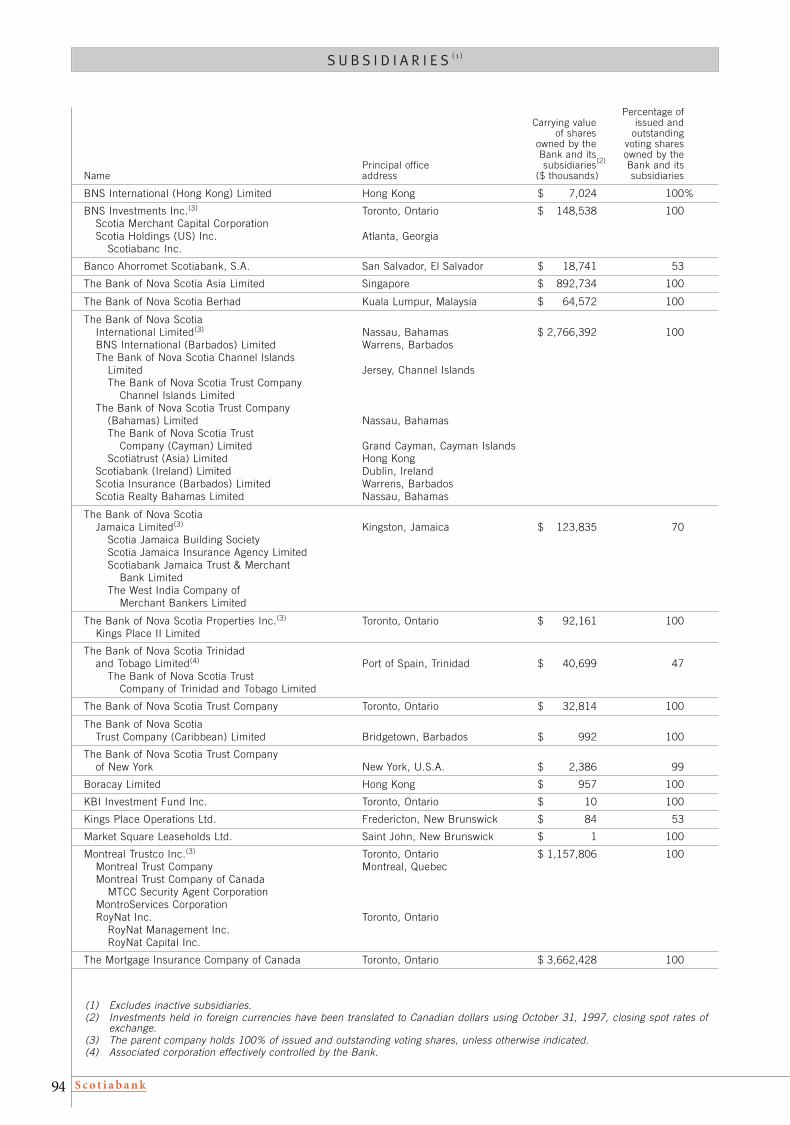
S c o t i a b a n k94
Percentage of Carrying value issued and
of shares outstanding owned by the voting shares Bank and its owned by the
Principal office subsidiaries(2) Bank and its Name address ($ thousands) subsidiaries
BNS International (Hong Kong) Limited Hong Kong $ 7,024 100%
BNS Investments Inc.(3) Toronto, Ontario $ 148,538 100Scotia Merchant Capital CorporationScotia Holdings (US) Inc. Atlanta, Georgia
Scotiabanc Inc.
Banco Ahorromet Scotiabank, S.A. San Salvador, El Salvador $ 18,741 53
The Bank of Nova Scotia Asia Limited Singapore $ 892,734 100
The Bank of Nova Scotia Berhad Kuala Lumpur, Malaysia $ 64,572 100
The Bank of Nova ScotiaInternational Limited(3) Nassau, Bahamas $ 2,766,392 100BNS International (Barbados) Limited Warrens, BarbadosThe Bank of Nova Scotia Channel Islands
Limited Jersey, Channel IslandsThe Bank of Nova Scotia Trust Company
Channel Islands LimitedThe Bank of Nova Scotia Trust Company
(Bahamas) Limited Nassau, BahamasThe Bank of Nova Scotia Trust
Company (Cayman) Limited Grand Cayman, Cayman IslandsScotiatrust (Asia) Limited Hong Kong
Scotiabank (Ireland) Limited Dublin, IrelandScotia Insurance (Barbados) Limited Warrens, BarbadosScotia Realty Bahamas Limited Nassau, Bahamas
The Bank of Nova ScotiaJamaica Limited(3) Kingston, Jamaica $ 123,835 70
Scotia Jamaica Building SocietyScotia Jamaica Insurance Agency LimitedScotiabank Jamaica Trust & Merchant
Bank Limited The West India Company of
Merchant Bankers Limited
The Bank of Nova Scotia Properties Inc.(3) Toronto, Ontario $ 92,161 100Kings Place II Limited
The Bank of Nova Scotia Trinidadand Tobago Limited(4) Port of Spain, Trinidad $ 40,699 47
The Bank of Nova Scotia TrustCompany of Trinidad and Tobago Limited
The Bank of Nova Scotia Trust Company Toronto, Ontario $ 32,814 100
The Bank of Nova ScotiaTrust Company (Caribbean) Limited Bridgetown, Barbados $ 992 100
The Bank of Nova Scotia Trust Company of New York New York, U.S.A. $ 2,386 99
Boracay Limited Hong Kong $ 957 100
KBI Investment Fund Inc. Toronto, Ontario $ 10 100
Kings Place Operations Ltd. Fredericton, New Brunswick $ 84 53
Market Square Leaseholds Ltd. Saint John, New Brunswick $ 1 100
Montreal Trustco Inc.(3) Toronto, Ontario $ 1,157,806 100Montreal Trust Company Montreal, Quebec Montreal Trust Company of Canada
MTCC Security Agent CorporationMontroServices CorporationRoyNat Inc. Toronto, Ontario
RoyNat Management Inc.RoyNat Capital Inc.
The Mortgage Insurance Company of Canada Toronto, Ontario $ 3,662,428 100
(1) Excludes inactive subsidiaries.(2) Investments held in foreign currencies have been translated to Canadian dollars using October 31, 1997, closing spot rates of
exchange.(3) The parent company holds 100% of issued and outstanding voting shares, unless otherwise indicated.(4) Associated corporation effectively controlled by the Bank.
S U B S I D I A R I E S ( 1 )

S c o t i a b a n k 95
Percentage of Carrying value issued and
of shares outstanding owned by the voting shares Bank and its owned by the
Principal office subsidiaries(2) Bank and its Name address ($ thousands) subsidiaries
National Trustco Inc.(3) Toronto, Ontario $ 1,169,513 100 %National Trust Company
Victoria & Grey Mortgage CorporationCassels Blaikie & Co. LimitedCassels Blaikie Investment Management LimitedNatrusco Investment Funds Limited
N.T. Insurance Company Inc. Bridgetown, BarbadosNational Trust and Banking Corporation
(Caribbean) Limited Grand Cayman, Cayman Islands
Nova Scotia Inversiones Limitada Santiago, Chile $ 57,435 100
ScotiaMcLeod Corporation(3) Toronto, Ontario $ 281,011 100ScotiaMcLeod Holdings Inc.
ScotiaMcLeod Inc.ScotiaMcLeod Financial Services Inc.Scotia Capital Markets (USA) Inc. New York, U.S.A.ScotiaMcLeod Realty Services Inc. Toronto, OntarioStructured MBS Incorporated
Scotia Export Finance Corporation Toronto, Ontario $ 25 100
Scotia General Insurance Company Toronto, Ontario $ 24,521 100
Scotia International Limited(3) Nassau, Bahamas $ 18,231 100Scotiabank (Anguilla) Limited The Valley, Anguilla, West IndiesCorporacion Mercaban de Costa Rica, S.A. (80%) San Jose, Costa Rica
Scotiabank de Costa Rica, S.A.ScotiaValores Puesto de Bolsa, S.A.
Scotia Mercantile Bank (80%) Grand Cayman, Cayman Islands
Scotia Investment Management Ltd. Toronto, Ontario $ 9,582 100
Scotia Life Insurance Company Toronto, Ontario $ 23,044 100
Scotia Mortgage Corporation Scarborough, Ontario $ 325,662 100
Scotia Mortgage Investment Corporation St. John’s, Newfoundland $ 58,975 100
Scotia Properties Quebec Inc. Toronto, Ontario $ 20,398 100
Scotia Realty Limited Toronto, Ontario $ 51,790 100
Scotia Realty Antilles N.V. St. Maarten, Netherlands Antilles $ 2,891 100
Scotia Realty Cayman Limited Grand Cayman, Cayman Islands $ 7,282 100
Scotia Securities Inc.(3) Toronto, Ontario $ 90,407 100Scotia Discount Brokerage Inc.
Scotiabank de Puerto Rico Hato Rey, Puerto Rico $ 168,086 99
Scotiabank Europe plc London, England $ 407,936 100
Tour Scotia Ltée Montreal, Quebec $ 125 50

S c o t i a b a n k96
As at October 31 ($ millions) 1997 1996 1995(2)
A s s e t s
Cash resourcesCash and deposits with Bank of Canada $ 1,058 $ 1,485 $ 1,233Deposits with other banks 17,116 13,252 15,495Cheques and other items in transit, net – – –
18,174 14,737 16,728
SecuritiesIssued or guaranteed by:
Canada 8,782 9,101 8,235Provinces and municipalities 1,869 2,289 1,561
Other securities 17,348 14,515 12,178
27,999 25,905 21,974
Assets purchased under resale agreements 8,520 9,112 8,378
LoansResidential mortgages 41,647 30,653 28,581Personal and credit card 17,668 16,718 15,274Business and governments 56,450 48,250 44,855
115,765 95,621 88,710
OtherCustomers’ liability under acceptances 7,575 5,945 5,563Land, buildings and equipment 1,716 1,523 1,485Other assets 15,404 12,458 4,351
24,695 19,926 11,399
$ 195,153 $ 165,301 $ 147,189
L i a b i l i t i e s a n d S h a r e h o l d e r s ’ E q u i t y
DepositsPersonal $ 59,239 $ 47,768 $ 45,538Business and governments 56,928 44,981 41,747Banks 22,808 25,145 24,060
138,975 117,894 111,345
OtherCheques and other items in transit, net 340 459 277Acceptances 7,575 5,945 5,563Obligations related to assets sold under repurchase agreements 11,559 7,894 7,354Obligations related to securities sold short 3,739 6,509 5,416Other liabilities 18,263 15,499 6,532Non-controlling interest in subsidiaries 137 101 133
41,613 36,407 25,275
Subordinated debentures 5,167 3,251 3,249
Shareholders’ equityCapital stock
Preferred shares 1,468 1,325 1,575Common shares 2,567 2,161 1,994
Retained earnings 5,363 4,263 3,751
9,398 7,749 7,320
$ 195,153 $ 165,301 $ 147,189
(1) Certain comparative amounts have been reclassified to conform with current year presentation.(2) Pre 1996 comparative amounts have not been restated to reflect the reporting of unrealized gains and unrealized losses on
trading derivative instruments on a gross basis in Other Assets and Other Liabilities respectively, as they were not reasonablydeterminable.
T E N - Y E A R S TA T I S T I C A L R E V I E W

S c o t i a b a n k 97
1994 1993 1992 1991 1990 1989 1988
$ 1,220 $ 1,119 $ 1,078 $ 1,008 $ 1,033 $ 1,117 $ 81610,168 7,515 6,692 5,766 6,759 7,054 7,224
– – 567 248 52 579 154
11,388 8,634 8,337 7,022 7,844 8,750 8,194
9,117 5,684 4,429 3,327 2,449 2,691 2,8242,074 1,315 1,339 1,040 578 301 531
14,375 10,839 8,460 6,174 5,158 4,447 3,883
25,566 17,838 14,228 10,541 8,185 7,439 7,238
4,304 4,606 1,706 1,306 1,329 606 111
26,767 18,600 16,703 14,596 12,787 10,808 9,07913,372 11,599 11,113 11,601 11,864 11,102 10,45642,336 37,399 38,530 34,628 33,842 31,474 31,169
82,475 67,598 66,346 60,825 58,493 53,384 50,704
4,796 3,921 3,726 5,380 7,695 7,831 5,6531,200 1,099 1,110 1,043 999 853 7873,199 2,814 1,924 2,038 2,263 1,971 1,988
9,195 7,834 6,760 8,461 10,957 10,655 8,428
$ 132,928 $ 106,510 $ 97,377 $ 88,155 $ 86,808 $ 80,834 $ 74,675
$ 42,431 $ 31,288 $ 29,058 $ 27,539 $ 25,530 $ 23,097 $ 20,36635,660 30,009 30,902 25,000 25,501 26,117 25,84021,664 16,451 16,667 15,294 14,248 12,180 12,869
99,755 77,748 76,627 67,833 65,279 61,394 59,075
365 450 – – – – –4,796 3,921 3,726 5,380 7,695 7,831 5,6535,798 4,926 2,574 1,986 1,802 1,377 7685,989 4,191 2,779 1,953 1,871 1,550 7636,793 6,158 4,413 4,471 4,435 3,561 4,031
175 56 51 17 19 17 15
23,916 19,702 13,543 13,807 15,822 14,336 11,230
3,016 3,156 2,128 1,979 1,832 1,758 1,293
1,100 1,300 1,000 1,000 750 550 3501,839 1,429 1,308 1,201 1,106 1,016 9543,302 3,175 2,771 2,335 2,019 1,780 1,773
6,241 5,904 5,079 4,536 3,875 3,346 3,077
$ 132,928 $ 106,510 $ 97,377 $ 88,155 $ 86,808 $ 80,834 $ 74,675
C O N S O L I D A T E D B A L A N C E S H E E T(( 11 ))

S c o t i a b a n k98
For the year ended October 31 ($ millions except per share amounts) 1997 1996 1995
I n t e r e s t i n c o m eLoans $ 8,082 $ 7,881 $ 8,007Securities 1,636 1,757 1,991Deposits with banks 770 740 597
10,488 10,378 10,595
I n t e r e s t e x p e n s eDeposits 5,714 5,969 6,166Subordinated debentures 260 214 209Other 797 841 1,046
6,771 7,024 7,421
Net interest income 3,717 3,354 3,174Provision for credit losses 35 380 560
Net interest income after provision for credit losses 3,682 2,974 2,614
Other income 2,683 2,008 1,498
Net interest and other income 6,365 4,982 4,112
N o n - i n t e r e s t e x p e n s e sSalaries 1,973 1,702 1,438Pension contributions and other staff benefits 229 208 214Premises and equipment expenses, including depreciation 778 664 588Other 803 663 604Restructuring costs 250 (20) –Write off of goodwill 26 – –
4,059 3,217 2,844
Income before the undernoted: 2,306 1,765 1,268Provision for income taxes 758 665 371Non-controlling interest in net income of subsidiaries 34 31 21
Net income $ 1,514 $ 1,069 $ 876
Preferred dividends paid $ 99 $ 113 $ 104
Net income available to common shareholders $ 1,415 $ 956 $ 772
Average number of common shares outstanding (000’s) 239,486 234,358 228,598
Net income per common share(2) $ 5.91 $ 4.08 $ 3.38
Dividends per common share $ 1.48 $ 1.30 $ 1.24
(1) Certain comparative amounts have been reclassified to conform with current year presentation.(2) Net income per common share has been calculated on the daily average of equivalent fully paid common shares outstanding.(3) Pre 1992 comparative amounts have not been restated to reflect the reclassification of gains and losses on securities from
Interest Income to Other Income as they were not reasonably determinable.
T E N - Y E A R S TA T I S T I C A L R E V I E W

S c o t i a b a n k 99
1994 1993 1992 1991(3) 1990 1989 1988
$ 6,090 $ 5,382 $ 5,729 $ 6,650 $ 6,836 $ 6,253 $ 5,1991,287 1,243 1,201 1,299 1,072 959 684
391 313 357 484 616 638 492
7,768 6,938 7,287 8,433 8,524 7,850 6,375
4,149 3,706 4,191 5,287 5,936 5,335 4,093172 133 134 166 180 156 85487 434 374 462 436 287 149
4,808 4,273 4,699 5,915 6,552 5,778 4,327
2,960 2,665 2,588 2,518 1,972 2,072 2,048567 465 449 374 238 895 465
2,393 2,200 2,139 2,144 1,734 1,177 1,583
1,606 1,380 1,197 883 831 850 658
3,999 3,580 3,336 3,027 2,565 2,027 2,241
1,401 1,255 1,153 1,075 966 916 786182 144 117 101 76 63 59533 481 461 421 364 323 266578 483 443 399 369 360 292175 – – – – – –162 – – – – – –
3,031 2,363 2,174 1,996 1,775 1,662 1,403
968 1,217 1,162 1,031 790 365 838455 490 475 391 271 135 32531 13 11 7 7 8 6
$ 482 $ 714 $ 676 $ 633 $ 512 $ 222 $ 507
$ 97 $ 92 $ 79 $ 79 $ 69 $ 34 $ 25
$ 385 $ 622 $ 597 $ 554 $ 443 $ 188 $ 482
218,713 208,282 203,083 197,449 190,198 185,149 175,613
$ 1.76 $ 2.98 $ 2.94 $ 2.81 $ 2.33 $ 1.01 $ 2.74
$ 1.16 $ 1.12 $ 1.04 $ 1.00 $ 1.00 $ 0.88 $ 0.76
C O N S O L I D A T E D S TA T E M E N T O F I N C O M E(( 11 ))

S c o t i a b a n k100
For the year ended October 31 ($ millions) 1997 1996 1995
P r e f e r r e d s h a r e sBank:Balance at beginning of year $ 1,325 $ 1,575 $ 1,100Issued 143 100 675Redeemed (250) (350) (200)
Balance at end of year $ 1,218 $ 1,325 $ 1,575
Scotia Mortgage Investment Corporation:Issued $ 250 $ – $ –Balance at end of year $ 250 $ – $ –
$ 1,468 $ 1,325 $ 1,575
C o m m o n s h a r e sBalance at beginning of year $ 2,161 $ 1,994 $ 1,839Issued on acquisition of National Trustco Inc. 335 – –Issued to acquire Montreal Trustco Inc. – – –Issued to acquire The McLeod Young Weir Corporation – – –Issued under Shareholder Dividend and
Share Purchase Plan, and Stock Option Plan 71 167 155
Balance at end of year $ 2,567 $ 2,161 $ 1,994
R e t a i n e d e a r n i n g sBalance at beginning of year $ 4,263 $ 3,751 $ 3,302Implementation of impaired loans accounting policy (Note 2) – (116) –Net income 1,514 1,069 876Dividends: Preferred (99) (113) (104)
Common (355) (305) (283)Income taxes related to appropriations for contingencies – – –Net unrealized foreign exchange gains and losses 43 (19) (15)Net cost of shares issued and redeemed (3) (4) (25)
Balance at end of year $ 5,363 $ 4,263 $ 3,751
T E N - Y E A R S TA T I S T I C A L R E V I E W
Common Share InformationReturn on equity (%) 20.2 15.8 14.2Earnings per share ($)(3) 5.91 4.08 3.38Dividends per share ($) 1.48 1.30 1.24Dividend payout (%)(4) 25.1 31.9 36.7Dividend yield (%)(5) 2.7 3.7 4.6Price/earnings ratio(5) 9.2:1 8.7:1 8.1:1Number of shares outstanding (000’s) 244,906 237,447 232,256Book value per common share ($) 32.38 27.05 24.73Share price ($)(6):
High 68.20 42.40 30.25Low 41.10 28.38 24.25Close – October 31 62.15 42.25 28.88
Capital RatiosCapital ratios (%):
Risk-adjustedTier 1 6.90 6.69 6.67Total 10.42 8.85 9.65
Assets to capital ratio(7) 14.2:1 16.4:1 15.2:1
Common equity to total assets 4.06 3.89 3.90
Other InformationAverage total assets ($ millions) 179,176 158,803 137,988Return on assets (%) .85 .67 .64Number of branches and offices 1,658 1,464 1,460Number of employees(8) 38,648 34,592 33,717Number of Cashstop banking machines 1,801 1,526 1,429
(1) Certain comparative amounts have been reclassified to conform with current year presentation.(2) Pre 1996 comparative amounts have not been restated to reflect the separate reporting of unrealized gains and losses on trad-
ing derivative instruments in Other Assets and Other Liabilities as they were not reasonably determinable.(3) Net income per common share has been calculated on the daily average of equivalent fully paid common shares outstanding.(4) Dividend payments as a percentage of Net Income Available to Common Shareholders.
T E N - Y E A R S TA T I S T I C A L R E V I E W

S c o t i a b a n k 101
1994 1993 1992 1991 1990 1989 1988
$ 1,300 $ 1,000 $ 1,000 $ 750 $ 550 $ 350 $ 350– 300 – 250 200 200 –
(200) – – – – – –
$ 1,100 $ 1,300 $ 1,000 $ 1,000 $ 750 $ 550 $ 350
$ – $ – $ – $ – $ – $ – $ –$ – $ – $ – $ – $ – $ – $ –$ 1,100 $ 1,300 $ 1,000 $ 1,000 $ 750 $ 550 $ 350
$ 1,429 $ 1,308 $ 1,201 $ 1,106 $ 1,016 $ 954 $ 720– – – – – – –
280 – – – – – –– – – – – – 185
130 121 107 95 90 62 49
$ 1,839 $ 1,429 $ 1,308 $ 1,201 $ 1,106 $ 1,016 $ 954
$ 3,175 $ 2,771 $ 2,335 $ 2,019 $ 1,780 $ 1,773 $ 1,652– – – – – – –
482 714 676 633 512 222 507(97) (92) (79) (79) (69) (34) (25)
(253) (233) (211) (197) (190) (163) (133)– – – – – – (209)9 20 50 (37) (11) (15) (19)
(14) (5) – (4) (3) (3) –
$ 3,302 $ 3,175 $ 2,771 $ 2,335 $ 2,019 $ 1,780 $ 1,773
C O N S O L I D A T E D S TA T E M E N T O F C H A N G E S I N S H A R E H O L D E R S ’ E Q U I T Y
7.9 14.4 15.7 16.7 14.9 6.5 18.71.76 2.98 2.94 2.81 2.33 1.01 2.741.16 1.12 1.04 1.00 1.00 0.88 0.7665.8 37.5 35.3 35.6 42.9 87.0 27.5
4.1 4.4 4.8 6.6 6.9 5.4 5.516.0:1 8.6:1 7.4:1 5.4:1 6.3:1 16.3:1 5.0:1
226,259 211,272 206,187 201,061 194,784 187,694 183,62522.72 21.79 19.78 17.59 16.04 14.90 14.85
33.25 29.50 24.75 20.00 18.13 19.25 16.0023.13 21.88 19.00 10.50 11.00 13.63 11.5027.50 29.00 24.00 19.75 11.00 17.25 15.00
6.22 6.45 5.70 5.54 4.61 4.11 3.889.61 10.38 8.58 8.49 7.34 6.83 5.97
15.2:1 12.9:1 14.8:1 14.9:1 16.5:1 17.1:1 18.8:1
3.87 4.32 4.19 4.01 3.60 3.46 3.65
120,619 100,836 93,807 88,073 83,697 77,974 71,582.40 .71 .72 .72 .61 .28 .71
1,454 1,376 1,361 1,329 1,311 1,284 1,24833,272 30,375 30,675 29,616 30,114 29,618 29,1131,381 1,280 1,190 1,070 873 422 304
O T H E R S TA T I S T I C S(( 11 )) (( 22 ))
(5) Based on the average of high and low common share prices and earnings per share.(6) Based on trading on The Toronto Stock Exchange.(7) Based on guidelines issued by the Superintendent of Financial Institutions Canada, the Bank’s assets to capital ratio is cal-
culated by dividing adjusted total assets by regulatory capital (Tier 1 and Tier 2).(8) Includes all personnel (part-time stated on a full-time equivalent basis) of the Bank and all its subsidiaries.

S c o t i a b a n k102
S TA T E M E N T O F C O R P O R A T E G O V E R N A N C E P R A C T I C E S
The Board of Directors and management of the Bank
believe that good corporate governance is essential to the effec-
tive, efficient and prudent operation of the Bank’s business.
Accordingly, the Bank has established an internal control
environment with strong corporate governance structures and
procedures in place. These structures and procedures are in
compliance with guidelines for effective corporate governance
adopted by the Toronto and Montreal Stock Exchanges in 1995
in connection with corporate governance disclosure require-
ments (the “Exchange guidelines”).
The Bank's governance system is founded on an extensive
and interrelated network of Board activities and Bank policies. It
is supported by strong management supervision, internal audits,
external audit by two independent chartered accounting firms
and the annual examination by the Office of the Superintendent
of Financial Institutions (OSFI). The Board annually certifies
adherence to the Canada Deposit Insurance Corporation
(CDIC) Standards of Sound Business and Financial Practices.
Furthermore, all directors, officers and employees of the Bank
must comply with the standards of conduct set out in
Scotiabank's Guidelines for Business Conduct.
The Compliance Department’s mandate includes specific
administrative, consultative and educative responsibilities, as
well as the establishment of a compliance network throughout all
areas of the Bank and its subsidiaries. There is also a Head of
Global Compliance for Scotia Capital Markets. A primary focus
of compliance activities is consumer and investor protection.
The policies and procedures of National Trust are being
integrated with the Corporate Governance system of the Bank
and its wholly owned domestic subsidiaries.
The Mandate of the Board of Directors
The Board of Directors supervises the management of the
Bank's business and affairs with the objective of maintaining the
strength and integrity of the Bank. In particular, the Board
oversees the Bank's strategic direction and organization
structure to reflect these objectives and to serve the interests of
the Bank, its customers, investors and employees.
Board responsibilities include establishing the Bank's
principal risk management policies and related monitoring
systems. The Board monitors the integrity of internal control
systems and oversees the major activities performed by the Bank.
Also, the Board appoints the Chief Executive Officer and other
senior management and establishes appropriate officer compensa-
tion. Specific decisions requiring Board approval are outlined in
the Bank Act, as are specific duties of the Board and its committees.
The Board fulfills its responsibilities and duties in a variety
of ways. For example, at least annually, the Board is apprised of
internal control and risk management policies and practices
related to credit, capital, foreign exchange, interest rates, liquidi-
ty, trading (including derivative products), securities portfolio
management, real estate appraisals and country risk.
In addition, the Board regularly reviews the performance of
the Bank, on a consolidated basis, as well as the performance of
individual divisions and major subsidiaries. Results are compared
and measured against previously established and approved plans,
performance in past years and against industry peers.
Throughout the year, the Board holds meetings where
management is invited to make presentations and respond to
questions. To facilitate fulfillment of some responsibilities and to
assist its decision making, the Board has formed committees of
the Board to review in greater depth specific areas of its mandate.
The assessment of management performance by the Board
is conducted with the assistance of the Human Resources
Committee. These assessments are based on both quantitative
and qualitative information, taking into account such factors as
experience and sustained personal performance, demonstrated
leadership ability and the achievement of business objectives.
Quantitative criteria include achievement of profit plan targets,
superior returns on both assets and shareholders' equity, and
meeting productivity and loan loss targets. Qualitative measures
include maintenance of exceptional customer service and busi-
ness ethics, preservation of the highest levels of customer safety
and security as determined by various regulatory and audit
reviews, and continuance as a superior employer.
In order to maintain good communications with various
constituencies, the Board has required the Bank to put in place
facilities and mechanisms so that investors, customers and the
general public may easily obtain information and make
enquiries. Shareholders and investment institutions may direct
their questions to the Secretary of the Bank or Investor Relations,
Finance Division.
The Board has ensured that the Bank has established
procedures to inform customers about borrowing costs and
transaction fees and to respond to customer enquiries and
complaints. Generally, comments or complaints are dealt with
directly by the branches or vice-presidents’ offices. Unresolved
customer complaints are heard and dealt with impartially by the
Bank’s Ombudsman, who reports directly to the Chief Executive
Officer. The Scotiabank Ombudsman has the power to review
and make recommendations on all retail and small business
customer service decisions made within the Bank. For small
S c o t i a b a n k 103
business disputes, customers have the additional option to
access the Scotia Business Credit Mediation Program. As a last
resort, customers can go directly to the Canadian Banking
Ombudsman, whose mandate has expanded to include personal
banking complaints, for an impartial review of the situation. The
Public and Corporate Affairs Department is also available to
respond to queries from the media and general public.
The Board approves the Management Discussion and
Analysis of Financial Condition and the results of operations
in the Annual Report. In addition, senior officers meet with
industry analysts each quarter to discuss the Bank's operating
results and banking trends.
The Board of Directors
At the fiscal year end, the Bank's Board of Directors was
composed of 29 members — business and community leaders,
active on the regional, national and international scene —
providing an important breadth of expertise. In order to reflect
the broad geographic and industrial diversity of their customer
bases, the boards of major international banks, such as
Scotiabank, are typically larger than those of companies in other
industries. The number of directors authorized by by-law ranges
from a minimum of seven, as required by the Bank Act, to a
maximum of 35 directors.
There were 11 meetings of the Board during the 1997
fiscal year.
The maintenance of a diverse and highly qualified group of
directors is critical to the effectiveness of the Board. The
Corporate Governance Committee of the Board, which is
composed exclusively of outside directors, is charged with
identifying, evaluating and recommending nominees for
directorship, assisted by submissions made by directors and
management. The committee assesses nominee candidates
based on their individual suitability, keeping in mind the size of
the Board and the desired diversity of composition. Upon
joining the Board, directors receive information concerning
their duties and responsibilities under the Bank Act and other
applicable legislation. All directors are provided with a
"Corporate and Governance Information" booklet which is
updated annually.
A Directors’ Share Purchase Plan has been implemented to
encourage directors to apply part or all of their Board fees to
acquire the Bank’s shares.
The Exchange guidelines recommend that the majority of
every board and board committee be comprised of unrelated
directors. An unrelated director is a director who is independent
of management and is free from any interest and any business or
other relationship which could or could reasonably be perceived
to materially interfere with the director’s ability to act with a view
to the best interests of the corporation, other than interests and
relationships arising from shareholding. Directors drawn from
the ranks of management are related directors.
The Bank has adopted measures to promote the indepen-
dence of the Board. Conflict of interest guidelines and
procedures for directors and officers have been in place for many
years. Board committees are chaired by outside directors, and
Bank directors and officers are requested, when appropriate, to
absent themselves for part of Board or committee meetings to
allow independent discussion of particular items. The Corporate
Governance Committee has responsibility for reviewing the
relationship between management and the Board. The Board has
implemented a procedure for a director to engage an outside
adviser at the Bank's expense with the authority of the chair of
the Corporate Governance Committee.
In addition, the Bank Act contains provisions concerning
self-dealing, the definition of affiliated directors and the compo-
sition of the Board and certain Board committees. Pursuant to
Bank Act provisions, affiliated directors may comprise not more
than two-thirds of the Board. Of the 29 members of the Bank's
Board, six are affiliated as defined in the Act, including two
directors from management. Having considered the relevant
definitions in the Exchange guidelines and the directors having
individually considered their respective interests and relation-
ships, it has been determined that the Board has six related
directors, which include all of the affiliated directors.
The performance of the Board is monitored by the
Corporate Governance Committee and the Chairman of the
Board. The Board of Directors and the Corporate Governance
Committee have been and continue to be proactive and diligent
in developing and reviewing the Bank's corporate governance
structures and procedures.
Committees of The Board of Directors
There are six standing committees of the Board and three
regional advisory committees. All directors participate in at
least one standing committee and a portion of the membership
of each committee rotates periodically. The majority of standing
committee members are Canadian residents and unrelated
directors, as defined in the Exchange guidelines. The majority of
the members of the Audit and Conduct Review Committees are
not affiliated and all members of both committees are
outside directors.

S c o t i a b a n k104
Audit Committee
Chair: David Morton
Members: Lloyd I. Barber, E. Kendall Cork, N. Ashleigh Everett,
Robert B. Findlay, M. Keith Goodrich, Henry N.R. Jackman,
Ian McDougall, Elizabeth Parr-Johnston, Paul J. Phoenix,
Arthur R.A. Scace.
The Audit Committee's mandate incorporates requirements
under the Bank Act, the Securities Act, OSFI and the CDIC, and
includes the following responsibilities:
i) reviewing the annual statement of the Bank and such
returns of the Bank as specified by the Superintendent
of Financial Institutions;
ii) ensuring that appropriate internal controls are in place
and reviewing investments and transactions that could
adversely affect the well-being of the Bank;
iii) meeting with the independent Auditors and, similarly,
meeting with the Bank's internal Audit Department to
discuss the annual statement of the Bank, the returns
and relevant transactions and the effectiveness of the
Bank's internal control procedures.
The committee met five times during this fiscal year, and the
independent Auditors and the Bank's internal Audit Department
were invited to attend all the meetings. Once a year, the
committee meets with staff from OSFI to receive its report on the
annual examination of the Bank.
Conduct Review Committee
Chair: David H. Race
Members: Lloyd I. Barber, Malcolm R. Baxter, C.J. Chen,
Sir Denis Mountain, Helen A. Parker.
The responsibilities of the committee are in accordance
with the Bank Act. The mandate includes:
i) reviewing the Bank’s procedures for verifying that
transactions with related parties of the Bank comply
with the Bank Act, reviewing the practices of the Bank
to identify any transactions with its related parties that
may have a material effect on the Bank’s stability or
solvency and establishing criteria for determining
whether the value of transactions with related parties
of the Bank are nominal or immaterial to the Bank;
and
ii) monitoring procedures established by the Board to
identify and resolve conflicts of interest, to restrict the
use of confidential information, to deal with certain
customer complaints and to provide disclosure of
information to customers as required by the Bank Act.
Annually, the Board reports to OSFI on the proceedings
of the committee.
The committee had two meetings during this fiscal year to
which the independent Auditors and the Bank’s internal Audit
Department were invited.
Corporate Governance Committee
Chair: Gerald J. Maier
Members: Sir Graham Day, Pierre J. Jeanniot, John T. Mayberry,
H. Harrison McCain, Robert L. Pierce, Jonathan A. Wolfe.
The committee's mandate is to enhance the Bank's corpo-
rate governance through a process of continuing assessment and
making policy recommendations on the Bank's approach to
corporate governance. Further, the members determine suitable
candidates for nominees as directors, periodically review the
mandates of committees of the Board, propose agenda items
and content of submissions for Board meetings and review the
relationship between management and the Board.
The committee met three times during this fiscal year.
Executive Committee
Chair: Robert L. Pierce
Members: E. Kendall Cork, Sir Graham Day, Peter C. Godsoe,
Henry N.R. Jackman, Pierre J. Jeanniot, Gerald J. Maier,
H. Harrison McCain, David Morton, Paul J. Phoenix,
David H. Race, Cedric E. Ritchie, Allan C. Shaw.
Generally, the committee serves as an advisor to manage-
ment and reviews credits and special risks prior to these items
being put before the Board. The mandate of the committee is to:
i) advise executive management on highly sensitive or
major strategic issues and on special risk situations;
ii) examine and report to the Board on the public issues
facing the Bank and to recommend policies as applicable.
During intervals between Board meetings, the committee
may exercise all of the powers of the Board, subject to the
limitations under the Bank Act or as determined by the Board.
There were 14 meetings of the committee during this
fiscal year.
Human Resources Committee
Chair: Sir Graham Day
Members: L. Lemaire, H. Harrison McCain, David Morton,
Robert L. Pierce, Isadore Sharp, Allan C. Shaw.
The Human Resources committee determines the compen-
sation to be paid to senior executives and senior officers, the
general criteria and design of incentive bonus and stock option

S c o t i a b a n k 105
David W. BarrToronto
Kenneth V. Cox,D.Sc., LL.D.Saint John,New Brunswick
George C. HitchmanToronto
John J. Jodrey,D.C.L., D.Eng.Hantsport, Nova Scotia
The Right Honourable Lord Keith of CastleacreLondon, England
Gordon F. MacFarlaneSurrey,British Columbia
Donald MaclarenOttawa
Malcolm H.D. McAlpineHerts, England
William S. McGregorEdmonton
Cyrus H. McLean, LL.D.Vancouver
David E. MitchellCalgary
Thomas G. Rust,C.M., LL.D.Vancouver
Judson W. SinclairToronto
Marie Wilson, Q.C.Toronto
Honorary Directors neither attend meetings of theBoard, nor receive remuneration.
plans and the distribution of related awards, the senior level
organization structure, staffing and succession planning. The
Committee also assesses the performance of the Chief Executive
Officer, and reviews assessments made of other executive
officers.
During this fiscal year, the committee held five meetings.
Pension Committee
Chair: David H. Race
Members: Lloyd I. Barber, Malcolm R. Baxter, Bruce R.
Birmingham, C.J. Chen, Sir Denis Mountain, Helen A. Parker.
The Pension Committee monitors and supervises the
administration of the Scotiabank Pension Plan and the
administration and investment of the fund maintained in
connection with the Pension Plan. Specifically, the committee
considers all amendments to the Pension Plan and approves the
fund's Statement of Investment Policies and Procedures, which
it reviews annually. The committee also recommends to the
Board the appointment or removal of the Custodian of the Fund
and retains competent professional actuaries and auditors,
whose reports are reviewed by the committee.
The committee met two times during this fiscal year.
Regional Advisory Committees
The regional advisory committees have been established in
Quebec, Alberta, British Columbia/Yukon and act in an advisory
rather than decision-making capacity.
These committees have been established to provide better
opportunities for directors residing in particular regions to
participate to a greater extent in the Bank's affairs in those
regions. The committees provide advice and counsel of a
general nature to local senior management, including matters
relating to the acquisition of new business and regional
commercial trends.
The committees also review regional forecasts and results,
business development opportunities, and provide advice on the
selection of new branch sites.
Asian Advisory Council
The Asian Advisory Council is chaired by the Chairman of
the Board of the Bank and includes a number of outside
advisors. It assists the Bank's Senior Executive Management by
providing advice concerning strategic, socio-economic, political
and business development issues in Asian countries. There was
one meeting of the council during the 1997 fiscal year.
Scotiabank’s Board of Directors
The contributions made by the members of the Board of
Directors are vital to the Bank’s success, and are gratefully
acknowledged. Members continued to serve the Bank and its
shareholders with their customary skill, dedication and insight
during the past year.
Newly appointed as directors during the year were Mr.
Arthur R.A. Scace, Chairman, McCarthy Tétrault, the
Honourable Henry N.R. Jackman, Chairman and President, E-L
Financial Corporation Limited, and Ms. N. Ashleigh Everett,
President, Royal Canadian Securities Limited.
Because of the age limitation provision in the By-laws of the
Bank, Mr. H. Harrison McCain and Mr. Cedric E. Ritchie will not
be standing for re-election to the Board at the upcoming Annual
Meeting. Mr. McCain has served the Bank and the Board since
January 1971 and Mr. Ritchie since September 1972. As well,
Mr. Robert B. Findlay will not be standing for re-election.
Mr. Findlay has served the Board since January 1995.
Each of these individuals has served the Bank with distinc-
tion and will be greatly missed.
The Bank regrets to note the passing, earlier this year, of Mr.
Albert T. Baker. A Director from 1955 through 1977, and
Honorary Director to June 1997, Mr. Baker served the Bank and
the Board faithfully and well.
Honorary Directors

B o a r d o f d i r e c t o r s
S c o t i a b a n k106
Peter C. GodsoeMr. Godsoe is Chairman of the Board and Chief
Executive Officer of The Bank of Nova Scotia. He has
been a Scotiabank director since February 1, 1982,
and currently sits on the Executive Committee. He
lives in Toronto, Ontario.
N. Ashleigh EverettMs. Everett is President of Royal Canadian Securities
Limited. She has been a Scotiabank director since
October 28, 1997, and currently sits on the Audit
Committee. She lives in Winnipeg, Manitoba.
Lloyd I. Barber, C.C., S.O.M., LL.D., Ph.D.Dr. Barber is President Emeritus of the University of
Regina. He has been a Scotiabank director since
September 28, 1976, and currently sits on the Audit,
Conduct Review and Pension Committees. He lives in
Regina Beach, Saskatchewan.
Robert B. FindlayMr. Findlay is the former President and Chief
Executive Officer of MacMillan Bloedel Limited. He
has been a Scotiabank director since January 31, 1995,
and currently sits on the Audit Committee. He lives in
West Vancouver, British Columbia.
Malcolm R. BaxterMr. Baxter is Chairman, President and Chief
Executive Officer of Baxter Foods Limited. He has
been a Scotiabank director since March 31, 1992, and
currently sits on the Conduct Review and Pension
Committees. He lives in Saint John, New Brunswick.
M. Keith Goodrich Mr. Goodrich is the retired Chairman of Moore
Corporation Limited. He has been a Scotiabank
director since August 28, 1990, and currently sits on
the Audit Committee. He lives in Lake Forest, Illinois.
Bruce R. BirminghamMr. Birmingham is President of The Bank of Nova
Scotia. He has been a Scotiabank director since
September 29, 1992, and currently sits on the Pension
Committee. He lives in Oakville, Ontario.
The Honourable Henry N.R. JackmanMr. Jackman is Chairman and President of E-L
Financial Corporation Limited. He has been a
Scotiabank director since September 30, 1997, and
currently sits on the Executive and Audit Committees.
He lives in Toronto, Ontario.
C.J. ChenMr. Chen is Managing Partner of Allen & Gledhill. He
has been a Scotiabank director since October 30, 1990,
and currently sits on the Conduct Review and Pension
Committees. He lives in Singapore.
Pierre J. Jeanniot, O.C.Mr. Jeanniot is Director General of the International
Air Transport Association. He has been a Scotiabank
director since June 26, 1990, and currently sits on the
Executive and Corporate Governance Committees.
He lives in Canton de Vaud, Switzerland.
E. Kendall CorkMr. Cork is Managing Director of Sentinel Associates
Limited. He has been a Scotiabank director since
December 4, 1973, and currently sits on the Executive
and Audit Committees. He lives in Toronto, Ontario.
Laurent LemaireMr. Lemaire is President and Chief Executive
Officer of Cascades Inc. He has been a Scotiabank
director since March 31, 1987, and currently sits
on the Human Resources Committee. He lives in
Kingsey Falls, Quebec.
Sir Graham DaySir Graham is Counsel to Stewart McKelvey Stirling
Scales. He has been a Scotiabank director since
October 31, 1989, and currently sits on the Executive,
Human Resources and Corporate Governance
Committees. He lives in Hantsport, Nova Scotia.
Gerald J. MaierMr. Maier is Chairman of TransCanada PipeLines
Limited. He has been a Scotiabank director since
February 25, 1986, and currently sits on the Executive
and Corporate Governance Committees. He lives in
Calgary, Alberta.

S c o t i a b a n k 107
John T. MayberryMr. Mayberry is President and Chief Executive
Officer of Dofasco Inc. He has been a Scotiabank
director since March 29, 1994, and currently sits on
the Corporate Governance Committee. He lives in
Burlington, Ontario.
Paul J. PhoenixMr. Phoenix is a corporate director. He has been a
Scotiabank director since June 21, 1985, and cur-
rently sits on the Executive and Audit Committees.
He lives in Burlington, Ontario.
H. Harrison McCain, C.C., LL.D.Mr. McCain is Chairman of the Board of McCain
Foods Limited. He has been a Scotiabank director
since January 13, 1971, and currently sits on the
Executive, Corporate Governance and Human
Resources Committees. He lives in Florenceville,
New Brunswick.
Robert L. Pierce, Q.C.Mr. Pierce is Chairman and Chief Executive Officer
of Foothills Pipe Lines Ltd. and Chairman of
Gasoducto GasAndes (Argentina) S.A., Gasoducto
GasAndes, S.A. He has been a Scotiabank director
since February 16, 1971, and currently sits on the
Executive, Corporate Governance and Human
Resources Committees. He lives in Calgary, Alberta.
Ian McDougallMr. McDougall is former Vice-Chairman and Chief
Financial Officer of Inco Limited. He has been a
Scotiabank director since February 24, 1981, and cur-
rently sits on the Audit Committee. He lives in
Lynbrook, New York.
David H. RaceMr. Race is Chairman of CAE Inc. and Chairman of
the Executive Committee. He has been a Scotiabank
director since November 27, 1992, and currently sits
on the Executive, Pension and Conduct Review
Committees. He lives in Toronto, Ontario.
David MortonMr. Morton is a company director and former
Chairman and Chief Executive Officer of Alcan
Aluminium Limited. He has been a Scotiabank direc-
tor since March 31, 1987, and currently sits on the
Executive, Audit and Human Resources Committees.
He lives in Westmount, Quebec.
Cedric E. Ritchie, O.C.Mr. Ritchie is a corporate director, and former
Chairman of the Board and Chief Executive Officer
of The Bank of Nova Scotia. He has been a
Scotiabank director since September 26, 1972, and
currently sits on the Executive Committee. He lives in
Don Mills, Ontario.
Sir Denis Mountain, Bt.Sir Denis is a corporate director. He has been a
Scotiabank director since March 14, 1978, and cur-
rently sits on the Pension and Conduct Review
Committees. He lives in London, England.
Arthur R.A. Scace, Q.C.Mr. Scace is Chairman of McCarthy Tétrault. He has
been a Scotiabank director since March 25, 1997, and
currently sits on the Audit Committee. He lives in
Toronto, Ontario.
Helen A. ParkerMrs. Parker is a company director. She has been a
Scotiabank director since November, 26, 1976, and
currently sits on the Pension and Conduct Review
Committees. She lives in Sidney, British Columbia.
Isadore Sharp, O.C.Mr. Sharp is Chairman and Chief Executive Officer of
Four Seasons Hotels Inc. He has been a Scotiabank
director since March 27, 1990, and currently sits on
the Human Resources Committee. He lives in
Toronto, Ontario.
Elizabeth Parr-Johnston, Ph.D.Dr. Parr-Johnston is President and Vice-Chancellor of
the University of New Brunswick. She has been a
Scotiabank director since October 26, 1993, and cur-
rently sits on the Audit Committee. She lives in
Fredericton, New Brunswick.
Allan C. ShawMr. Shaw is Chairman and Chief Executive Officer of
The Shaw Group Limited. He has been a Scotiabank
director since September 30, 1986, and currently sits
on the Executive and Human Resources Committees.
He lives in Halifax, Nova Scotia.
Jonathan A. WolfeMr. Wolfe is President and Chief Operating Officer of
The Oshawa Group Limited. He has been a Scotiabank
director since January 26, 1993, and currently sits on
the Corporate Governance Committee. He lives in
Toronto, Ontario.
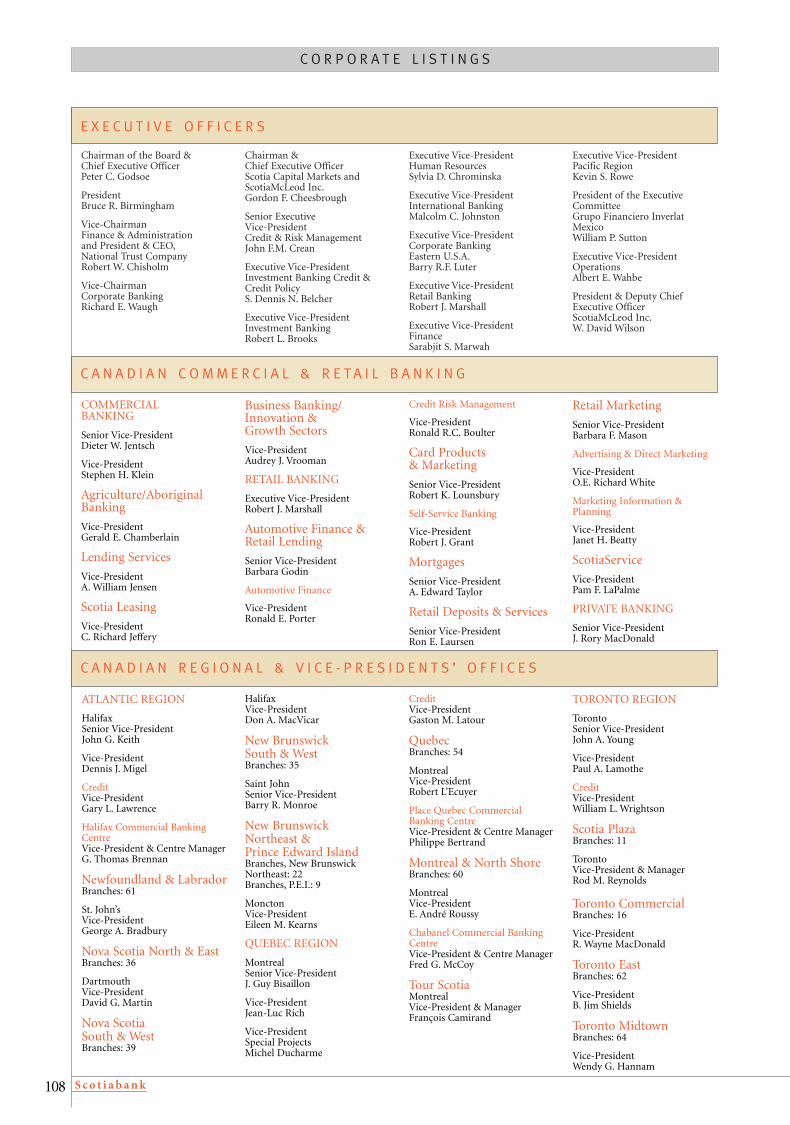
C O R P O R A T E L I S T I N G S
Chairman of the Board & Chief Executive OfficerPeter C. Godsoe
President Bruce R. Birmingham
Vice-Chairman Finance & Administrationand President & CEO,National Trust CompanyRobert W. Chisholm
Vice-ChairmanCorporate BankingRichard E. Waugh
Executive Vice-President Pacific RegionKevin S. Rowe
President of the ExecutiveCommitteeGrupo Financiero InverlatMexicoWilliam P. Sutton
Executive Vice-PresidentOperationsAlbert E. Wahbe
President & Deputy ChiefExecutive OfficerScotiaMcLeod Inc.W. David Wilson
Chairman & Chief Executive OfficerScotia Capital Markets andScotiaMcLeod Inc.Gordon F. Cheesbrough
Senior Executive Vice-President Credit & Risk ManagementJohn F.M. Crean
Executive Vice-PresidentInvestment Banking Credit &Credit PolicyS. Dennis N. Belcher
Executive Vice-PresidentInvestment BankingRobert L. Brooks
Executive Vice-President Human ResourcesSylvia D. Chrominska
Executive Vice-PresidentInternational BankingMalcolm C. Johnston
Executive Vice-PresidentCorporate Banking Eastern U.S.A.Barry R.F. Luter
Executive Vice-PresidentRetail Banking Robert J. Marshall
Executive Vice-President FinanceSarabjit S. Marwah
E X E C U T I V E O F F I C E R S
C A N A D I A N C O M M E R C I A L & R E TA I L B A N K I N G
C A N A D I A N R E G I O N A L & V I C E - P R E S I D E N T S ’ O F F I C E S
COMMERCIALBANKING
Senior Vice-PresidentDieter W. Jentsch
Vice-PresidentStephen H. Klein
Agriculture/AboriginalBanking
Vice-PresidentGerald E. Chamberlain
Lending Services
Vice-PresidentA. William Jensen
Scotia Leasing
Vice-PresidentC. Richard Jeffery
Business Banking/Innovation & Growth Sectors
Vice-PresidentAudrey J. Vrooman
RETAIL BANKING
Executive Vice-PresidentRobert J. Marshall
Automotive Finance &Retail Lending
Senior Vice-PresidentBarbara Godin
Automotive Finance
Vice-PresidentRonald E. Porter
Credit Risk Management
Vice-PresidentRonald R.C. Boulter
Card Products& Marketing
Senior Vice-PresidentRobert K. Lounsbury
Self-Service Banking
Vice-PresidentRobert J. Grant
Mortgages
Senior Vice-PresidentA. Edward Taylor
Retail Deposits & Services
Senior Vice-PresidentRon E. Laursen
Retail Marketing
Senior Vice-PresidentBarbara F. Mason
Advertising & Direct Marketing
Vice-PresidentO.E. Richard White
Marketing Information &Planning
Vice-PresidentJanet H. Beatty
ScotiaService
Vice-PresidentPam F. LaPalme
PRIVATE BANKING
Senior Vice-PresidentJ. Rory MacDonald
ATLANTIC REGION
HalifaxSenior Vice-PresidentJohn G. Keith
Vice-PresidentDennis J. Migel
CreditVice-PresidentGary L. Lawrence
Halifax Commercial BankingCentreVice-President & Centre ManagerG. Thomas Brennan
Newfoundland & LabradorBranches: 61
St. John’sVice-PresidentGeorge A. Bradbury
Nova Scotia North & EastBranches: 36
DartmouthVice-PresidentDavid G. Martin
Nova Scotia South & WestBranches: 39
TORONTO REGION
TorontoSenior Vice-PresidentJohn A. Young
Vice-PresidentPaul A. Lamothe
CreditVice-PresidentWilliam L. Wrightson
Scotia PlazaBranches: 11
TorontoVice-President & ManagerRod M. Reynolds
Toronto CommercialBranches: 16
Vice-PresidentR. Wayne MacDonald
Toronto EastBranches: 62
Vice-PresidentB. Jim Shields
Toronto MidtownBranches: 64
Vice-PresidentWendy G. Hannam
HalifaxVice-PresidentDon A. MacVicar
New BrunswickSouth & WestBranches: 35
Saint JohnSenior Vice-PresidentBarry R. Monroe
New Brunswick Northeast & Prince Edward IslandBranches, New BrunswickNortheast: 22Branches, P.E.I.: 9
MonctonVice-PresidentEileen M. Kearns
QUEBEC REGION
MontrealSenior Vice-PresidentJ. Guy Bisaillon
Vice-PresidentJean-Luc Rich
Vice-PresidentSpecial ProjectsMichel Ducharme
CreditVice-PresidentGaston M. Latour
QuebecBranches: 54
MontrealVice-PresidentRobert L’Ecuyer
Place Quebec CommercialBanking CentreVice-President & Centre ManagerPhilippe Bertrand
Montreal & North Shore Branches: 60
MontrealVice-PresidentE. André Roussy
Chabanel Commercial BankingCentreVice-President & Centre ManagerFred G. McCoy
Tour ScotiaMontrealVice-President & ManagerFrançois Camirand
S c o t i a b a n k108

Toronto NorthBranches: 53
Vice-PresidentJoe E. Brandt
Toronto WestBranches: 64
Vice-PresidentGarry B. Preston
Commercial BankingCentresEtobicoke Commercial BankingCentreVice-President & ManagerJames R. Gervais
Midtown Commercial BankingCentreVice-President & ManagerMary Jo Field
North York Commercial BankingCentreVice-President & ManagerBrendan J. Fox
Vaughan Commercial BankingCentreVice-President & ManagerLes R. Neate
York Commercial Banking CentreVice-President & ManagerIan C. McFetters
ONTARIO REGION
TorontoSenior Vice-PresidentWarren K. Walker
Vice-PresidentFirdos Somji
CreditVice-PresidentsWilliam H. HunterGreg B. Hurst
Central Ontario &MuskokaBranches: 53
BarrieVice-PresidentWayne K. Haley
Hamilton & PeninsulaBranches: 54
HamiltonVice-PresidentAziz Haque
Ontario Central WestBranches: 52
KitchenerVice-PresidentHeidi Ryan
Kitchener-Waterloo CommercialBanking CentreVice-President & ManagerSteve Cannon
Ontario NorthBranches: 32
SudburyVice-PresidentSteve F. Varey
Ontario WestBranches: 53
LondonVice-PresidentDavid M. Poole
London Commercial BankingCentreVice-President & ManagerTom J. Jesty
Windsor Commercial BankingCentreVice-President & ManagerDon E.F. Marlatt
Ottawa & WestBranches: 49
KanataVice-PresidentLorne B. Babcock
Ottawa Centre & EastBranches: 42
OttawaVice-PresidentClaude S. Norfolk
Ottawa Commercial BankingCentreVice-President & ManagerThomas F. Mesman
PRAIRIE REGION
CalgarySenior Vice-PresidentDavid J. Chapman
Vice-PresidentH. Dennis Chambers
CreditVice-PresidentBlayne F. Lensen
Manitoba & NorthwesternOntarioBranches, Manitoba: 40Branches, N.W. Ontario: 8
WinnipegVice-PresidentKenneth J. Cranston
SaskatchewanBranches: 49
SaskatoonVice-PresidentJack F. McEwen
Alberta North & Northwest TerritoriesBranches: 66
EdmontonVice-PresidentLaurence G. Beatty
Alberta SouthBranches: 66
CalgaryVice-PresidentR. Alexander Connolly
BRITISH COLUMBIA& YUKON REGION
VancouverSenior Vice-PresidentGeorge E. Marlatte
Vice-PresidentTom J. Malone
CreditVice-PresidentColin D. Laight
Multicultural BankingVice-PresidentRobert L. O’Keefe
Real EstateVice-PresidentBrian M. McGuire
Greater VancouverBranches: 51
VancouverVice-PresidentD. Ray Tripp
Vancouver Commercial BankingCentre & Main BranchVice-President & Centre ManagerBrian W. Fowles
British ColumbiaNorthwest & YukonBranches, B.C.: 43Branch, Yukon Territory: 1
VancouverVice-PresidentBeverley V. Voice
British ColumbiaSoutheastBranches: 45
VancouverVice-PresidentR. Jack McKinty
C O R P O R AT E B A N K I N G
Group HeadRichard E. Waugh
Corporate Banking,Strategic Planning &Development
Division HeadRaymond G. Darke
Unit HeadAlex R. Bortoluzzi
Corporate Banking,Administration
Unit HeadDavid W. Whitaker
AUTOMATED SERVICES,COMMERCIAL & CORPORATE BANKING
Division HeadJ. Drew Brown
Unit HeadMark A. Boot
CASH & TREASURYMANAGEMENT SERVICES
Division HeadL. Paul LeBlanc
Unit HeadCarmen Giordano
CORPORATE BANKING
Division HeadsJohn C. EbyBarry R.F. LuterJohn E. OliverBorden R. OsmakKevin R. Ray
AtlantaOffice HeadWilliam J.G. Brown
BostonOffice HeadTerrance M. Pitcher
CalgaryOffice HeadMichael S. Jackson
ChicagoOffice HeadChristopher J. Allen
HalifaxOffice HeadRandy S. Hartlen
HoustonOffice HeadLarry D. Lloyd
MontrealOffice HeadRené Faribault
New YorkDivision HeadBarry R.F. Luter
Unit HeadsJohn W. CampbellTerry K. FryettJames N. Tryforos
PortlandOffice HeadMichael Brown
San FranciscoOffice HeadJames S. York
TorontoUnit HeadsRobert V. Finlay
Robert A. GrayStephen P. HartMichael G. Locke
VancouverOffice HeadDonald R. German
INTERNATIONAL PROJECT FINANCE
Unit HeadsAnthony S. CourtwrightPeter D.E. Wilson
CORPORATE BANKINGLATIN AMERICA
ArgentinaRepresentative OfficeVice-President & ManagingDirectorRoy D. Scott
MexicoRepresentative OfficeVice-President & Country HeadAntonio J. Uribe
PeruSenior Vice-President & Country HeadJim T. Meek
S c o t i a b a n k 109

TorontoUnit HeadBrian E. Maloney
VenezuelaRepresentative OfficeVice-President & Country HeadJohn W. Stevens
CORPORATE BANKINGEUROPE
LondonManaging Head, EuropeanOperationsKevin R. Ray
Unit HeadsKevin C. ClarkGerald P. FerrisRobyn L. HarringtonJohn R. Heeds
New YorkOffice HeadMelvin J. Mandelbaum
San FranciscoOffice HeadB. Lorne Ogmundson
TorontoUnit HeadJames A. Gaiger
VancouverOffice HeadDonald R. German
MONTREAL TRUST CORPORATE SERVICES
Division HeadL. Paul LeBlanc
Unit HeadOperationsRobert Mackenzie
Regional Office HeadsQuebecGuy Langevin
Central Jane Matthews
Western CanadaMark L.P. Ferguson
PacificJ. Robert Morris
REAL ESTATE BANKING
Division HeadJohn E. Oliver
Real EstateBanking Offices
CalgaryOffice HeadMichael S. Jackson
QuebecOffice HeadGary R. Graham
C R E D I T & R I S K M A N A G E M E N T
I N V E S T M E N T B A N K I N G
Senior Executive Vice-PresidentJohn F.M. Crean
COMMERCIAL CREDIT
Senior Vice-PresidentsDavid W. RitceyDonald S. Teslyk
Vice-PresidentsRichard O. Bubb-ClarkeStanford A. HieronsLarry T. KenyonLorne W. MittonHenry ReimerFrank I. Verseghy
CORPORATE CREDIT
Senior Vice-PresidentsRichard W. Hale-SandersBarry J. Webb
Vice-PresidentsDavid F. AblettJohn B. ChisholmG. Walter MillerAllan G. Portis
INTERNATIONALBANKING CREDIT
Senior Vice-PresidentS.M. (Mickey) Kitchell
Vice-PresidentsBrian G. CunninghamMark L. Green
REAL ESTATE AND SPECIALACCOUNTS MANAGEMENTCREDIT
Senior Vice-PresidentJohn W. Agnew
Vice-PresidentsSteven E. BenfordF. George Wilson
INVESTMENT BANKINGCREDIT & CREDIT POLICY
Executive Vice-PresidentS. Dennis N. Belcher
Investment Banking Credit
Vice-PresidentsFred M. GoddardDonna M. Groskorth
Special AccountsManagement
Vice-PresidentJameel E. Sethi
Policy & InformationSystems
Senior Vice-PresidentAmeen Karmally
Vice-PresidentEdward D. Moriarty
Senior Vice-President,Credit & Risk ManagementPeter F.J. Heffernan
Analytics
Vice-President,Trading PolicyRichard Haines
SCOTIA CAPITAL MARKETS
Chairman of the Board & CEOScotia Capital Markets andScotiaMcLeod Inc.Gordon F. Cheesbrough
President & Deputy CEOScotiaMcLeod Inc.W. David Wilson
Chief Administrative Officer,Scotia Capital Markets, andSenior Vice-President & Head ofIntegrated Support ServicesMark I. Greenspan
Chairman & CEO Scotia Capital Markets (USA) Inc.F. Edward Price
Managing Director & ChiefAdministrative OfficerScotia Capital Markets (USA) Inc.Joseph M. Spillane
Managing Head,Scotia Capital Markets &Corporate Banking EuropeOperationsKevin Ray
Managing Director, Head ofScotia Capital Markets Europeand Global Head of Precious &Base MetalsLawrence J. Scott
Investment BankingCentres
DirectorGarry B. Fredrickson
Atlantic Investment Banking Centre HalifaxAssociate DirectorAndrew R. Thomas
Quebec Investment Banking CentreMontrealDirectorShaun Casey
Branch Treasury ServicesTorontoDirectorWilson G. Dow
Ontario InvestmentBanking CentreDirectorCarrie M.P. Denton
Manitoba & SaskatchewanInvestment Banking CentreWinnipegDirectorWalter Sikora
Alberta Investment Banking CentreCalgaryDirectorRichard M. Masters
Managing Director, Head ofAsian OperationsIan A. Berry
SingaporeManaging DirectorGlenn W.D. Martin
TokyoManaging Director & Head ofTokyo OperationsJeffrey P. Fairley
Managing Director & Head of Global ComplianceJoan C. Smart
Managing Director & Head of Scotia Capital MarketsHuman ResourcesRuth G. Woods
Global Trading
Managing Directors & Co-HeadsThomas A. HealyJ. Anthony Woodward
Managing Director & GlobalHead of Fixed IncomeJohn Madden
Managing Director & Global Headof Derivative ProductsC. John Schumacher
Managing Director & GlobalHead of Foreign ExchangeBarry M. Wainstein
Investment Dealer
Deputy ChairmenScotiaMcLeod Inc.Gordon J. HomerRichard E. LintDaniel F. Sullivan
Managing Director & Head ofInvestment BankingScot A. Martin
Managing Director & Head ofMergers & AcquisitionsWilliam N. Gula
Managing Director & Head of Western CanadaIan D. Bruce
Managing Director & GlobalHead of Institutional EquityBrian J. Porter
Managing Director & Head ofEquity ResearchDiane Urquhart
Managing Director & Head ofPrivate Client Financial ServicesChristopher J. Hodgson
Managing Director & Head ofQuebec RegionJacques O. Nadeau
S c o t i a b a n k110

Pacific Investment Banking CentreVancouverDirectorTodd K. McLaughlin
GLOBAL TREASURY
Executive Vice-PresidentRobert L. Brooks
I N T E R N AT I O N A L B A N K I N G
Executive Vice-PresidentMalcolm C. Johnston
ASIA/PACIFIC
Executive Vice-PresidentKevin S. Rowe
Senior Vice-PresidentRobin S. Hibberd
Vice-PresidentsGary M. GortonD. Matt HarrisSusan E. LewandowskiStuart J. Spence
LATIN AMERICA
Executive Vice-PresidentWilliam P. Sutton
CARIBBEAN ANDCENTRAL AMERICA
Senior Vice-PresidentRobert H. Pitfield
Vice-PresidentsColin D. McKieMario J. Nobrega
Retail Banking
Vice-PresidentJim Louttit
Marketing
Vice-PresidentDavid R. Lewis
Trade Finance &Correspondent Banking
Senior Vice-PresidentTimothy G. Plumptre
Vice-PresidentsJames G. LiddellGeorge K. Morton
BRANCHES,REPRESENTATIVE OFFICES& SUBSIDIARIES
AnguillaScotiabank Anguilla Ltd.Managing DirectorA. Walter MacCalman
AntiguaManagerLeonard Wright
ArgentinaVice-President & ManagingDirector, Latin AmericaRoy D. Scott
Bahamas(13 branches)Vice-PresidentAnthony C. Allen
Barbados(8 branches)Vice-PresidentPeter F. Van Schie
N.T. Insurance Company Inc.ChairmanKeith Lewis
Scotia Insurance(Barbados) LimitedManaging DirectorWalter P. Meinig
Belize(4 branches)ManagerClaude E. Marcel
Cayman Islands(2 branches)Vice-PresidentAlan Brodie
ChinaBeijingChief RepresentativeBohua Guo
GuangzhouManagerKenneth K. Lam
Costa RicaScotiabank de Costa Rica, S.A.(4 branches)General ManagerAlberto R. Tarabotto
DominicaManagerC. Monte Smith
Dominican Republic(14 branches)Vice-PresidentAriel D. Perez
EgyptCountry ManagerMohamed Jahangir
El SalvadorBanco Ahorromet Scotiabank, S.A.(30 branches)PresidentJuan Federico Salaverria
Executive DirectorJosé Carlos Bonilla
Managing DirectorLuis Boggiano
Greece(7 branches)Vice-PresidentAlbert Horsting
Grenada(2 branches)ManagerLawrence A. Aqui
Guyana(3 branches)ManagerJ.F. (Ian) Cooper
Haiti(3 branches)ManagerBernard A. Theard
Hong KongVice-President & ManagerPatrick N. Rooney
BNS International (Hong Kong) LimitedManaging DirectorD. Matt Harris
India(3 branches)
South Asia Sub ContinentSenior Vice-PresidentDouglas H. Stewart
MumbaiVice-President & ManagerBhaskar Desai
CoimbatoreManagerDenis Vaz
New DelhiAsst. General Manager & ManagerAshok Khanna
JamaicaThe Bank of Nova Scotia Jamaica Limited(45 branches)Managing DirectorWilliam E. Clarke
Japan(2 branches)
TokyoVice-PresidentRobert Ulmer
OsakaManagerKazumi Suzuki
Republic of KoreaVice-President & ManagerClaude D. Morin
LebanonManagerVahe Kouyoumjian
MalaysiaLabuanManagerM.S. (Corito) Sevilla
The Bank of Nova ScotiaBerhadManaging DirectorRasool Khan
MexicoSenior Representative Antonio J. Uribe
Netherlands Antilles(2 branches)
St. MaartenManagerRobert G. Judd
PanamaManagerTerry S. McCoy
The PhilippinesManagerCristina Sadler
Puerto RicoScotiabank de Puerto Rico(13 branches)
Chairman & CEODavid F. Babensee
President & ChiefOperating OfficerIvan Mendez
St. Kitts & Nevis(3 branches)ManagerWayde A. Christie
St. Lucia(3 branches)Vice-PresidentJames A. Batterton
St. VincentManagerTom Wilkins
SingaporeManager, Credit & MarketingY.K. Heng
The Bank of Nova Scotia Asia LimitedManaging DirectorWah Sun Seong Koon
TaiwanVice-President & ManagerBenny S.H. Cheong
Thailand(2 branches)
Bangkok International BankingFacilityVice-President & ManagerKobsak Duangdee
Provincial International BankingFacilityManagerVirut Danarthikhom
Turks & Caicos Islands(2 branches)ManagerTimothy J. Augustin
VietnamRepresentativeEric Naggiar
Virgin Islands (British)ManagerTerry C. Bell
Virgin Islands (U.S.)(5 branches)Vice-President – St. ThomasRobert Haines
(4 branches)Vice-President – St. CroixRalph T. Chan
Vice-PresidentsIan D. BallardKeith C. BirdAnthony L. DaleyEdward E. JablonkyChristopher MassiahBrian D. McKenzieKimberlee B. McKenzieLorne G. RintoulKathryn E. WardMichael WarmanCharles M. Wickett
Integrated SupportServices (ISS)Managing Director & Chief Financial Officer,ScotiaMcLeod Inc. & Deputy Head, ISST. Hugh McNabney
Senior Vice-PresidentsNorman K.J. GrahamJeffrey C. HeathGail J. Smith
InvestmentsSenior Vice-PresidentRussell A. Morgan
Funding – Mid-TermVice-PresidentMarc C. Durocher
Bond Investments/SecurityLendingVice-PresidentGary J. Bundscho
S c o t i a b a n k 111

C O R P O R AT E A D M I N I S T R AT I O N
I N T E R N A T I O N A L S U B S I D I A R I E S A N D A S S O C I A T E D C O M PA N I E S
FINANCE &ADMINISTRATION
Vice-ChairmanRobert W. Chisholm
Finance
Executive Vice-PresidentSarabjit S. Marwah
Senior Vice-President & Chief AccountantJohn K. Mitchell
Senior Vice-President &ComptrollerDaniel L. Chui
Vice-PresidentsKevin HarraherColleen M. JohnstonLawrence R. MastermanLinda D. McNeilMichael W. O’BeeWilliam E. Park
Pensions
Senior Vice-PresidentRamsay R. Holmes
Taxation
Senior Vice-PresidentReginald W. Kowalchuk
Vice-PresidentsMunir A. SulemanDeborah J. ToazeRichard S. Tucker
Real Estate
Senior Vice-PresidentAndrew B. Lennox
Vice-PresidentsWilliam D. HulmeJohn O. LemyreDavid R. MorleyStephen M. MorsonJack G. Nixon
Executive OfficesAdministration
Senior Vice-President & SecretaryR. Peter Gerad
Vice-President Morley A. Smith
Audit
Senior Vice-President &Chief InspectorPeggy Mulligan
Senior Vice-President &Deputy Chief InspectorThomas C. Nicol
Senior Vice-President, Loan AuditJohn W. Roblin
Vice-PresidentsRonald C. BlackCarol BrandtDavid F. CooperDavid H. DayeMarianne B. Hasold-SchilterSteve R. HawkinsAzeem H. KassamMarian LawsonSteven LuckenRichard D. McLeanKaren OttBradley J. RowseLister M. SmithClay UllrichPierre W. Wong
GENERAL COUNSEL
Senior Vice-President & General CounselGeorge E. Whyte
Vice-President & Asst. General CounselMadelaine A. Hare
Asst. General CounselsRonald B. LindsayWilliam J. MandziaKenneth E. Thorlakson
Compliance
Senior Vice-PresidentL. Louise Cannon
Vice-PresidentDavid A. Smith
HUMAN RESOURCES
Executive Vice-PresidentSylvia D. Chrominska
Senior Vice-PresidentShirley P. Fudge
Vice-PresidentsMarjory R. ButtrumDiane S. CaravanNoel G. GreenPatricia KrajewskiLloyd A. LavalleyDavid G. Merrow
OPERATIONS
Executive Vice-PresidentAlbert E. Wahbe
Banking Operations
Senior Vice-PresidentAlan R. Macdonald
Vice-PresidentsBarry F. DolanGary D. EwertGary W. MacDonaldHenry A. Regnitter
Domestic & ExecutiveOffices SystemsDevelopment
Senior Vice-PresidentMichael D. Evans
Vice-PresidentsHarry GlaserSusan HarrisonGordon Jang
Domestic Branch Platform
Senior Vice-PresidentTerry C. Maloney
Vice-PresidentAlan P. Hosey
Domestic CustomerService Centres
Senior Vice-PresidentW. Robert Stark
Vice-PresidentsMary Anne ChambersMichael HayesBrian A. KingFrank She
Planning, Administration& Project Management
Vice-PresidentThomas E. Russell
Systems Operations &Technical Services
Senior Vice-PresidentJean-Charles Petitclerc
Vice-PresidentsDonald H. CockburnKarl B. LoneyMary Ellen Trimble
Systems Security & Controls
Vice-PresidentPaul K. Wing
Wholesale & InternationalSystems Development
Senior Vice-PresidentDavid K. Gill
Vice-PresidentsLise ContantWilliam R. FlintCarol Davis-KibornWayne W. Heath
PUBLIC & CORPORATEAFFAIRS AND ECONOMICS
Senior Vice-President &Chief EconomistWarren Jestin
Public Affairs
Vice-PresidentSandra N. Stewart
Corporate &Government Affairs
Vice-President Ian R. McIntosh
Economics
Vice-Presidents Aron GampelPatricia M. Mohr
SECRETARY
Senior Vice-President & SecretaryR. Peter Gerad
Security & Investigation
Vice-President and Chief Security OfficerWally Kalichuk
ArgentinaBanco Quilmes, S.A.Buenos Aires
ChairmanRicardo P. Fiorito
DirectorAnatol von Hahn
Managing DirectorGabriel Coqueuigniot
Vice-PresidentsRick G. DurhamNolan MillerGlen Tugman
Channel IslandsThe Bank of Nova Scotia Channel
Islands LimitedThe Bank of Nova Scotia Trust
Company Channel Islands Limited
St. Helier, Jersey
Managing DirectorKenneth C. Brierley
ChileBanco Sud AmericanoSantiago
ChairmanJosé Borda Aretxabala
Vice-President & SeniorRepresentativeRobert Garneau
BahamasPrime Bank and Trust (Bahamas)Limited
ChairmanRoberto C. Cavanna
The Bank of Nova Scotia International Limited
The Bank of Nova Scotia Trust Company (Bahamas) Limited
Scotia International LimitedNassau
Managing DirectorChristopher A. Barnes
Cayman IslandsThe Bank of Nova Scotia TrustCompany (Cayman) Limited
Managing DirectorRonald E. Tompkins
National Trust and Banking Corporation(Caribbean) Limited
ChairmanKeith Lewis
Scotia Mercantile Bank
General ManagerAlberto R. Tarabotto
S c o t i a b a n k112

C A N A D I A N S U B S I D I A R I E S
The Bank of Nova ScotiaTrust CompanyTorontoPresident & CEOJ. Rory MacDonald
Treasurer & Chief Financial OfficerHiram W. Lau
Cassels Blaikie & Co.LimitedTorontoPresident & COOJ. Alan Brown
Cassels Blaikie InvestmentManagement LimitedTorontoChairmanJ. Christopher Barron
Montreal Trust CompanyMontreal Trust Company
of CanadaMontroServices
CorporationMontrealPresident & CEORobert W. Chisholm
Executive Vice-PresidentL. Paul LeBlanc
Senior Vice-PresidentsRobert L. MackenzieEugene J. Rovas
Regional Vice-Presidents
QuebecGuy Langevin
CentralJane Matthews
WesternMark L.P. Ferguson
PacificJ. Robert Morris
Scotia Merchant CapitalCorporationTorontoManaging DirectorsAndrew R. BrentonS. Jane Rowe
Scotia MortgageCorporationScarboroughPresidentA. Edward Taylor
Vice-PresidentSeth M. Cechetto
Scotia MortgageInvestment CorporationSt. John’sChairman & CEORobert W. Chisholm
PresidentGeorge A. Bradbury
Scotia Securities Inc.Natrusco Investment
Funds LimitedTorontoPresident & CEOAndrew H. Scipio del Campo
Vice-PresidentWoodrow L. Pelley
Victoria & Grey MortgageCorporationTorontoPresident & CEORobert W. Chisholm
The Mortgage InsuranceCompany of CanadaTorontoChairman & CEORobert W. Chisholm
President Oscar Zimmerman
Senior Vice-President William D. Alexander
Vice-President Andrew Donnelly
National Trust CompanyTorontoPresident & CEORobert W. Chisholm
RoyNat Inc.TorontoPresident & CEOJ. Brooke Frizzell
Executive Vice-President & ChiefOperating Officer David R. Swaine
Senior Vice-PresidentsEarl M.H. LandeKeith C. Moorse
Scotia Discount Brokerage Inc.TorontoPresident & CEOAndrew H. Scipio del Campo
Senior Vice-PresidentBruce E. Dickson
Vice-PresidentCharles J. Mecke
CalgaryVice-PresidentNancy J. Bowley
HalifaxVice-PresidentDiana C. Bacon
MontrealVice-PresidentDonal P. Ryan
Toronto Vice-PresidentCarl Martin-Harris
Vancouver Vice-PresidentSandra L. Dignan
Scotia Export FinanceCorporationTorontoPresident & COOJohn M. Lightbody
Scotia General Insurance Company
Scotia LifeInsurance Company
TorontoPresident & CEOOscar Zimmerman
Senior Vice-PresidentWilliam D. Alexander
Vice-PresidentsJanet L. CrawfordLaura J. HowellEmily LeungRandy J. MacFarlanePeter I. NobleDavid C. Self
Scotia InvestmentManagement Ltd.TorontoPresident & CEOWilliam J. Smith
Vice-Presidents John R. Bright Jack CookAnthony GenuaJeffrey S. GordonBruce J. GrantierJames L. HamnettRichard J. Marshall
EnglandScotiabank Europe plcLondon
Managing DirectorRoger A. Ellis
Hong Kong Scotiatrust (Asia) Limited
Managing DirectorClement C.H. Tay
IndonesiaP.T. Bank AryaPanduarta Tbk.
IrelandScotiabank (Ireland) LimitedDublin
Managing DirectorPeter Kluge
Unit HeadRobert Masters
MexicoGrupo FinancieroInverlat S.A. de C.V.Mexico City
ChairmanXavier Autrey Maza
Vice-ChairmanCarlos Muriel
President of the Executive CommitteeWilliam P. Sutton
Deputy Managing DirectorsBanco Inverlat, S.A.Peter C. CardinalFrancisco GómezTimothy P. HaywardLuis T. IvandicJames F. O’DonnellCarlos Verduzco
Managing Director, Casa de BolsaInverlat, S.A. de C.V.Jorge Salim Alle
Netherlands AntillesMaduro & Curiel’s Bank N.V.Willemstad, Curaçao
Chairman of the Supervisory BoardMay Henriquez
PresidentLionel Capriles
Managing DirectorsWilliam H. FabroRonald Gomes Casseres
PeruBanco Sudamericano S.A.Lima
ChairmanRoberto C. Cavanna
CEORicardo W. Ferradas
The PhilippinesSolidbank CorporationMakati City
President & CEO Deogracias N. Vistan
Executive Vice-PresidentsChristopher A. Bell-KnightRoland L.R. BorotraMohan Y. KulkarniJose L. Querubin
Trinidad & TobagoThe Bank of Nova Scotia Trinidad & Tobago Limited(21 branches)
The Bank of Nova Scotia Trust Company of Trinidad &Tobago Limited(2 branches)
Port of Spain
Managing DirectorRichard P. Young
United StatesThe Bank of Nova Scotia TrustCompany of New YorkNew York
PresidentBarry R.F. Luter
Scotiabanc Inc.Scotia Holdings (US) Inc.Atlanta
PresidentBarry R.F. Luter
Vice-President & ManagingDirectorWilliam J.G. Brown
S c o t i a b a n k 113

s h a r e h o l d e r s ’ i n f o r m a t i o n
Annual Meeting
Shareholders are invited to attend the 166th Annual Meeting of
The Bank of Nova Scotia, to be held on January 27, 1998,
at The Westin Hotel, 11 Colonel By Drive, Ottawa, Ontario,
Canada, beginning at 10:00 a.m. (eastern standard time).
Shareholdings and Dividends
Information regarding your shareholdings and dividends may
be obtained by writing to or calling the Transfer Agent.
Direct Deposit Service
Shareholders may have dividends deposited directly into
accounts held at financial institutions which are members of
the Canadian Payments Association. To arrange direct deposit
service, please write to the Transfer Agent.
Dividend and Share Purchase Plan
Common and preferred shareholders wishing to acquire addi-
tional common shares of the Bank may take advantage of a
cost-free Dividend and Share Purchase Plan. The Plan provides
a convenient method for eligible shareholders either to invest
cash dividends in new common shares of the Bank, or to
receive dividends in the form of additional common shares of
the Bank (stock dividends), as defined in the Plan. As well, eli-
gible shareholders may invest up to $20,000 per fiscal year of
the Bank and debenture holders may apply interest received on
fully registered Bank subordinated debentures in the purchase
of additional common shares, as defined in the Plan.
Participants pay no brokerage commission or service charges of
any kind, and all administrative costs of the Plan are paid by
the Bank. For additional information on participation in the
Plan, please write to the Transfer Agent.
Listing of Shares
Common shares of the Bank are listed for trading on the
Vancouver, Alberta, Winnipeg, Toronto, Montreal and London
stock exchanges. Options on the Bank’s common shares are list-
ed for trading on the Toronto exchange.
Series 6, 7, 8, 9 and 11 Preferred Shares and Units of the
Bank are listed on the Toronto and Montreal stock exchanges.
Stock Symbols
The trading symbols for the Bank’s shares on Canadian
exchanges are:
Common–BNS
Series 6, Preferred–BNS.PR.E Series 9, Preferred–BNS.PR.H
Series 7, Preferred–BNS.PR.F Series 11, Preferred–BNS.PR.I
Series 8, Preferred–BNS.PR.G Units–BNS.UN.
The CUSIP numbers for the Bank’s shares on Canadian
exchanges are:
Common–064149 10 7
Series 6, Preferred–064149 70 1 Series 9, Preferred–064149 87 5
Series 7, Preferred–064149 80 0 Series 11, Preferred–064149 84 2
Series 8, Preferred–064149 88 3 Units–064149 86 7.
Dividend Record and Payment Dates
Subject to approval by the Board of Directors, the payment date
for common and all preferred shares, is usually the third last
business day of each fiscal quarter, being the months of
January, April, July and October.
The record date is the first Tuesday of the month in which
dividends are paid. If the first Tuesday falls on a statutory holi-
day, it will be the next business day.
Valuation Day Price
For Canadian income tax purposes, The Bank of Nova Scotia’s
common stock was quoted at $31.13 per share on Valuation
Day, December 22, 1971. This is equivalent to $5.188 after
adjustment for the two-for-one stock split in 1976 and the
three-for-one stock split in 1984.
Quarterly Earnings Reporting
For 1998, Scotiabank’s quarterly earnings are anticipated to be
announced around the last Tuesday of February, May and
August and the first Wednesday of December.
Duplicated Communication
Some registered holders of The Bank of Nova Scotia shares
might receive more than one copy of shareholder mailings, such
as this Annual Report. Every effort is made to avoid duplica-
tion, but when shares of the same class or series are registered
in different names and/or addresses, multiple mailings result.
Shareholders who receive, but do not require, more than
one mailing for the same ownership are requested to write to
the Transfer Agent and arrangements will be made to combine
the accounts.
S c o t i a b a n k114

t a b l e o f c o n t e n t s
■ The Scotiabank Group 1
■ Highlights 2
■ Letter to shareholders 4
■ Questions & answers 8
■ Business highlights 10
■ Competitive advantages 12
■ Glossary 20
■ 1997 financial report 21
Management’s discussion and analysis 22
Consolidated financial statements 67
■ Corporate governance & Board of directors 102
■ Corporate listings 108
■ Shareholder information 114
Scotiabank’s goal is to be Canada’s best and most successful
financial services company.
We will achieve this by focusing on our core strengths:
diversification, risk management, productivity, customer
satisfaction and our Scotiabank team.
In all relationships with our stakeholders, we rely on our
core values: a customer focus; honesty, integrity and candour;
hard work and smart work; two-way commitment between
employees and the bank; and teamwork.
Putting people first is central to who we are.
Cover: Emilce Andrea Correa is one of 1,800 employees of Banco Quilmes, Scotiabank’s Argentine
partner. Page 1: Left: Familiar Scotiabank signage at the main branch in Moncton, New Brunswick.
Centre: Stephanie Sorensen works as a retail lending administration officer at the Toronto Midtown
Commercial Banking Centre. Right: PC banking at your fingertips.
Corporate HeadquartersScotiabank, Scotia Plaza, 44 King Street West, Toronto, Ontario, Canada M5H 1H1
Transfer AgentMontreal Trust Company of Canada, 151 Front Street West, 8th Floor, Toronto, Ontario, Canada M5J 2N1
The SecretaryScotiabank, 44 King Street West, Toronto, Ontario, Canada M5H 1H1
http://www.scotiabank.ca
For product, corporate and financial information
Corporate HeadquartersTel.: (416) 866-6161
Fax: (416) 866-3750
E-mail: [email protected]
Annual Report and Other Financial ReportsTel.: (416) 866-3925
Fax: (416) 866-4988
Financial Analysts, Portfolio Managers and other Institutional InvestorsTel.: (416) 866-5982
Fax: (416) 866-7867
E-mail: [email protected]
Transfer AgentTel.: (416) 981-9633; 1-800-663-9097
Fax: (416) 981-9507
Secretary’s DepartmentTel.: (416) 866-4790
Fax: (416) 866-5090
For complete addresses, please refer to the Worldwide Directory. To obtain a copy, contact:
Public and Corporate Affairs, 44 King Street West, Toronto, Ontario
Tel.: (416) 866-3925
Fax: (416) 866-4988
William E. Bailey, 44 King Street West, Toronto, Ontario, Canada M5H 1H1
Tel.: (416) 933-3299; 1-800-785-8772
Fax: (416) 933-3276
Senior Long-Term Debt Commercial PaperCBRS A+(high) CBRS A-1+
DBRS AA DBRS R-1(middle)
IBCA AA- Moody’s P-1
Moody’s Aa3 Standard & Poor’s A-1+
Standard & Poor’s AA-
Non-Cumulative Preferred SharesCBRS P-2
DBRS Pfd-1(low)
S c o t i a b a n k 115
C o n t a c t a n d g e n e r a l i n f o r m a t i o n
Design: Sutton/Javelin Communications, Toronto Principal photography: Michael Fiala, Larry Newland Typesetting: Graphic Services, Scotiabank Printing: Arthurs-Jones Inc.Translation: KPMG (Management’s Discussion and Analysis), Price Waterhouse (Consolidated Financial Statements), Translation Department, Quebec Regional Office, ScotiabankProduced by: Public and Corporate Affairs, Scotiabank
C R E D I T R AT I N G S
B Y M A I L
O N L I N E
O F F I C E O F T H E O M B U D S M A N
WO R L D W I D E D I R E C T O R Y
B Y P H O N E , FA X A N D E - M A I L

Executive OfficesScotia Plaza, 44 King Street West, Toronto, Ontario, Canada M5H 1H1
Since welcoming its first customers in 1832, Scotiabank has grown into a major
international financial institution, with over 1,600 branches and offices in more
than 50 countries around the world – as well as affiliates and joint venture partners
in Latin America and Asia. Our assets now total $195 billion.
1 9 9 7 a n n u a l r e p o r t
global reach
local strength
personal commitment
19
97
a
nn
ua
l r
ep
or
t