local living wage dividend...t h e s m i t h i n s t i t u t e 6 executive summary tens of thousands...
TRANSCRIPT

By Paul Hunter
The local Living Wage dividend: An analysis of the impact of the Living Wage on ten city regions

The Smith InstituteThe Smith Institute is an independent think tank which provides a high-level forum for thought leadership and debate on public policy and politics. It seeks to engage politicians, senior decision makers, practitioners, academia, opinion formers and commentators on promoting policies for a fairer society.
The Living Wage Foundation The real Living Wage is the only rate calculated according to what people need to make ends meet. It provides a voluntary benchmark for employers that choose to take a stand by ensuring their staff earn a wage that meets the costs and pressures they face in their everyday lives.
The UK Living Wage is currently £8.75 per hour. There is a separate London Living Wage rate of £10.20 per hour to reflect the higher costs of transport, childcare and housing in the capital. These figures are calculated annually by the Resolution Foundation and overseen by the Living Wage Commission, based on the best available evidence on living standards in London and the UK.
The Living Wage Foundation is the organisation at the heart of the movement of businesses, organisations and individuals who campaign for the simple idea that a hard day’s work deserves a fair day’s pay. We recognise and celebrate the leadership shown by responsible employers who voluntarily choose to go further and pay a real Living Wage based on the cost of living, not just the government minimum. There are currently over 4,400 accredited employers.
This report was funded with the support of Aviva, the People’s Health Trust, and the Barrow Cadbury Trust. The research was conducted independently of these organisations and any views presented are the author’s own.
People’s Health Trust People’s Health Trust believes in a world without health inequalities. We work to ensure that where you live does not unfairly reduce the length of your life, or the quality of your health.
The Trust was set up to address health inequalities in Great Britain and create fairer places in which to grow, live, work and age. Through our funding and support, we encourage people led approaches as a means of addressing the underlying structural causes of health inequalities – supporting citizens to take greater control over what happens in their lives.
We know work is a social determinant of health, and that good and well-paid work is a precursor to improved health.
The Barrow Cadbury TrustThe Barrow Cadbury Trust is an independent charitable foundation, committed to bringing about socially just change. We focus on a small number of distinct policy areas and try to influence them by building an evidence base, advocating for change and ensuring the voices of people affected by social injustices are heard in the debate.

T H E S M I T H I N S T I T U T E
This report represents the views of the author and not those of the Smith Institute
Published by The Smith Institute
© The Smith Institute September 2018
The local Living Wage dividend: An analysis of the impact of the Living Wage on ten city regions
By Paul Hunter

Contents
PrefaceThe ‘real’ Living Wage
Executive summary
Introduction Inclusive growth Productivity and low pay Will the Living Wage help?
Who pays and who gains: Understanding the local impact of the Living WageWho pays?Who gains?MultipliersSpillovers Wage leakages
The local economic benefits of the Living WageWhich city regions? Living Wage premiumLocal Living Wage dividendThe Living Wage: Economic development and devo deals
Conclusion and policy recommendations
Notes
T H E S M I T H I N S T I T U T E
2
33
6
10101112
161618212222
2424252527
30
32

Preface
Since its introduction in the UK in 2001, the campaign for employers to go beyond the government minimum to voluntarily pay a real Living Wage has raised the wages of at least 150,000 people.1 It has made employees feel properly valued for the work they do and the contribution they make. It has improved the incomes of some the poorest families and delivered wages high enough to live on. The benefits are not just confined to workers. There is also a growing body of evidence showing the advantages to accredited employers and wider society. Despite these improvements, around a fifth of workers are still paid less than the voluntary Living Wage (affecting women more than men, more part-time workers than full-time, and with low pay concentrated in accommodation and food services and retail). A large share of these low paid workers are known to be employed in our major cities and city regions, and they are more likely than higher paid workers to be concentrated in just a handful of firms.2
Although the share of employees in low pay is sometimes higher in city regions, there has been very little national attention given to the potential impact the real Living Wage could have on local economies. However, with the first elections of metro mayors and a new policy focus on cities and combined authorities, questions about whether to fully champion the Living Wage as a driver of inclusive growth throughout the UK have become more pertinent. The evidence in this report and others clearly demonstrates the power of the Living Wage to boost wages for those on low incomes and make the labour market fairer and more inclusive.
However, when assessing the impact of the real Living Wage on city economies the key consideration is whether increased wages for low income workers boosts productivity, or whether costs are simply passed on to others locally, with little additional economic benefit. This report seeks to address this question, and explores how the take-up of the real Living Wage is likely to impact growth within a city region.
Evaluating the impacts of the real Living Wage at a spatial level is complex and depends on several variables, not least the state of the local labour market and the types of business activity. The starting point for this assessment is to look at how the government approaches the issue of a higher wage floor and examining the evidence from the impact of the introduction of the National Minimum Wage. Based on the findings from studies on the National Minimum Wage the approach adopted in the report is to see wages as an investment which can create value, rather than a cost to be cut. Instead of simply pushing up prices or unemployment, a credible and fair Living Wage could pay for itself through productivity gains, as employees become more committed and employers seek to get more out of the workers they are investing in.
Using these findings, the report sets out potential scenarios for what an increased Living Wage take-up would mean in 10 major city regions geographically spread across the country. This includes the impact on the wages of those slightly above the real Living Wage, multipliers created by additional spending power of workers, and how the Treasury would benefit from increased tax revenues and reduced benefit payments.
The report’s findings suggest that if Living Wage take-up is scaled up there are significant potential benefits to local economies, with higher wages boosting productivity and providing additional local spending. And this shift to the high road could be encouraged by mayors and local councils making business and skills support contingent on paying the Living Wage. As a large proportion of the financial gain goes straight to central government there could be potential for elected mayors and combined authorities to strike new deals with ministers focused on sharing the rewards, and further driving local economic and productivity growth.
Growth does not have to come through a race to the bottom on wages. Fairer wages can drive higher local growth. Whilst not a silver bullet, the report does demonstrate that the real Living Wage offers local authority, city region and national policymakers one way of turning some of the rhetoric around inclusive growth into a reality.
The ‘real’ Living Wage The real Living Wage is a voluntary pay rate which is independently calculated, based on what people need to get by. The campaign began when the National Minimum Wage stood at just £3.70 with the objective of persuading employers to pay a wage that supported a decent standard of living.
Organisations sign up to become Living Wage employers, accredited by the Living Wage Foundation, if all staff, including those performing outsourced functions, are paid the required rate. Research has shown that Living Wage employers believe that paying a decent wage, as well as being the right thing to do, offers real business benefits. Since the start of the campaign, over 150,000 employees have directly received a pay rise and over 4,400 organisations are accredited.
Current rates apply to those 18 and older and are £10.20 in London and £8.75 in the rest of the country. This is at least a 12% premium on the National Minimum Wage, which for over-25-year olds was rebranded the National Living Wage.
T H E S M I T H I N S T I T U T E
3

T H E S M I T H I N S T I T U T E
4

T H E S M I T H I N S T I T U T E
5
Executive summary
T H E S M I T H I N S T I T U T E
6
Executive summary
Tens of thousands of employees have benefited from the campaign for a real Living Wage. This report shows how the benefits can be extended to local communities, with a particular focus on the impact on city regions and combined authorities (covering: London, Greater Manchester Combined Authority, West Midlands Combined Authority, Cambridgeshire and Peterborough Combined Authority, North East Combined Authority, West of England Combined Authority, Liverpool City Region, Sheffield City Region, Cardiff Capital Region and Glasgow City Region).
The analysis demonstrates that when employers commit to pay their staff a real Living Wage, it not only benefits low paid workers, but can also help increase local productivity and drive inclusive growth. Studies into the introduction of the government’s National Minimum Wage have concluded that it did not lead to higher prices or less employment but was paid for by increased productivity. This suggests that increasing wages to the independently-calculated Living Wage could result in increased productivity as workers feel more valued and management is likely to get more from its employees.
Using official data and economic modelling based on the Labour Force Survey, Annual Survey of Hours and Earnings and Family Resource Survey, and academic research, including studies for the Low Pay Commission, the report identifies the potential benefits a Living Wage can offer to cities and city regions.
Headline findingsBased on the assumption of a quarter of low-paid workers in ten UK city regions moving up to the real Living Wage, the report finds:
• Over half a million workers would secure an average annual pay rise of over £1,700. • This would not only help create more inclusive local economies but could also deliver additional annual economic growth
worth £560m across the ten city regions by boosting productivity, and generate £350m in increased tax receipts and benefit savings for the Treasury.
• If half of this £350m boost to the Treasury was returned by central government to city regions, the annual local economic benefit could increase to £1.1bn, when taking into account multiplier effects such as increased local spending by low paid workers and investment from government driving further economic activity.
• The evidence in this report demonstrates that valuing employees and investing in them, rather than seeing workers as a cost to be cut, creates wins for the individual and the local economy.
City and city region Living Wage benefit
• If a quarter of low paid workers in each of the ten city regions (over half a million people) move up to the real Living Wage, our analysis shows that over a year Greater Manchester’s economy would grow by £53m, London by £294m, and the West Midlands Combined Authority by £51m. Both Cambridgeshire and Peterborough and the West of England Combined Authority area would grow by £15m each. Liverpool City Region would benefit by £30m, the North East Combined Authority by £29m, Sheffield City Region by £22m, Cardiff Capital Region by £24m, and Glasgow City Region by £27m
• Even using the conservative assumptions presented in this report - which assume some of the cost of paying the real Living Wage is absorbed through reductions in hours and lower profits – the Liverpool City Region would grow by £10m, Sheffield City Region by £8m and the West Midlands by £17m.
• Under the main scenario, workers moving up to the real Living Wage in London would on average benefit by £2,710 per year, £1,340 in Greater Manchester, £1,230 in West Midlands (Combined Authority), £1,170 in Cardiff Capital Region and £1,180 in Glasgow City Region.
• The Treasury would be a significant beneficiary, gaining around £350m. This figure excludes other additional benefits, such as reducing the costs to local public services (e.g. lower demand on the health service and criminal justice system).
Living Wage devolution deals
• Given the benefits to the public purse and broad consensus for greater decentralisation, there is scope for devolution deals which split the £350m in public savings and additional tax revenue generated by the increase in wages, between the Treasury and city regions.
• Returning a share of the Living Wage public savings to the city regions could result in a larger Living Wage dividend, with the extra spending creating additional economic activity. This dividend is likely to be largest for spending on infrastructure, and if it supports additional affordable housing it could help further deliver inclusive growth.
• Government should develop (building on Manchester’s New Economy’s ‘Cost Benefit Tool’) a methodology and tool for calculating the public-sector savings of increasing pay levels to the Living Wage.

Actions by city regions
• Given the evidence, city regions and local authorities that are not already accredited should seek to become Living Wage employers and integrate the Living Wage into their economic development strategies. This could come in the form of Living Wage clauses in public procurement contracts or public support (advice, skills training etc) for businesses, voluntary organisations and sectors being contingent on moving to the Living Wage.
• The number and percentage of real Living Wage jobs should be measured by cities and city regions as an indicator of economic improvement and strength.
• The Living Wage Foundation should work with city regions to design and launch a scheme to champion place-based approaches to the Living Wage, building on its Living Wage Places pilot. The Living Wage Places pilot is scoping the potential to create Living Wage Cities, Regions and Zones through partnerships between the Living Wage Foundation, local authority and city leaders and ‘anchor institutions’, to encourage Living Wage accreditation among local employers.
Table 1: The Annual Living Wage Dividend by Place
Living Wage
Premium
Living Wage Income Premium (after
taxes and benefit reductions)
Local Living Wage Dividend (economic
benefit to area)
Benefit to Public Finances
Local Living Wage Dividend (with a
devo-deal)
London £2,710 £1,760 £294,000,000 £198,000,000 £572,000,000
Greater Manchester £1,340 £870 £53,000,000 £32,000,000 £98,000,000
West Midlands (Combined Authority)
£1,230 £800 £51,000,000 £31,000,000 £95,000,000
Cambridgeshire and Peterborough
£1,210 £790 £15,000,000 £9,000,000 £27,000,000
West of England £1,200 £780 £15,000,000 £9,000,000 £28,000,000
Liverpool City Region £1,300 £850 £30,000,000 £18,000,000 £55,000,000
North East Combined Authority
£980 £640 £29,000,000 £17,000,000 £53,000,000
Sheffield City Region £1,020 £660 £22,000,000 £13,000,000 £41,000,000
Cardiff Capital Region
£1,170 £760 £24,000,000 £15,000,000 £45,000,000
Glasgow City Region £1,180 £770 £27,000,000 £16,000,000 £49,000,000
Total/average £1,730 £1,130 £560,000,000 £358,000,000 £1,061,000,000
T H E S M I T H I N S T I T U T E
7

T H E S M I T H I N S T I T U T E
8

T H E S M I T H I N S T I T U T E
9
Introduction

T H E S M I T H I N S T I T U T E
10
Introduction
Cities and city regions are increasingly seen as important economically and politically. According to the Government’s Foresight Programme: “Cities matter to the UK. They are the concentrations of the UK’s population, trade, commerce, cultural and social life. They are also the sites where most of the UK’s future growth, both population and economic, is forecast to occur. The UK’s future is now closely linked to that of its cities.”3 This view is shared by many in local government and the business community, as well as by international agencies like the OECD and IMF.
This new economic orthodoxy, connected to economies of agglomeration,4 sees cities as engines of growth and key to tackling the UK’s poor productivity performance. Although some have questioned the evidence,5 and others the government’s piecemeal approach to city devolution,6 there has been a steady increase in the number of city deals and devolution agreements. These bespoke deals usually involve a transfer of powers and freedoms to support local growth, albeit with modest funding packages. Liverpool City Region’s deals, a typical example, cover transport, some skills provision and business support. The second devo deal for the West Midlands includes housing, construction skills and transport. Greater Manchester is perhaps further down the track with several deals, which have also included the NHS and social care.7
These devo deals have been made with combined authorities, mostly made up of local authorities and business-led Local Enterprise Partnerships. A condition of the deals was that combined authorities would have directly elected mayors, responsible for economic and spatial planning with a mix of powers and functions (provided for in the devolution agreements).8 In May 2017 metro mayors were elected in Greater Manchester, West Midlands, Liverpool City Region, Cambridgeshire and Peterborough, Tees Valley, West of England, and subsequently in 2018 in Sheffield City Region. In other city regions, combined authorities have been established but there has been no agreement on having a mayor.
10 city regions examinedThis report examines the impact of the Living Wage in 10 areas across England, Wales and Scotland. They were chosen based on size but also to provide a geographic spread. The geography of the areas is based on administrative boundaries. Given the different governance arrangements (see below) they are mainly referred to in the report as city regions.
• London: Directly elected executive mayor since 2000 covering Greater London area• Greater Manchester Combined Authority: Combined authority with directly elected mayor• West Midlands Combined Authority: Combined authority with directly elected mayor• Cambridgeshire and Peterborough: Combined authority with directly elected mayor• North East Combined Authority: Combined authority but has no directly elected mayor• West of England Combined Authority: Combined authority with directly elected mayor• Liverpool City Region: Combined authority with directly elected mayor• Sheffield City Region: Combined authority with directly elected mayor• Cardiff Capital Region: Not a combined authority, comprised of 10 local authorities working together to deliver the Cardiff Capital
Region City Deal• Glasgow City Region: Not a combined authority, comprised of eight local authorities to deliver its City Deal.
Although the devo deals are focused on supporting local (mainly private sector) growth, most city regions continue to stress the importance of tackling low pay. Indeed, several city councils maintain a long-standing commitment to the real Living Wage and have embedded it in their economic strategies. Birmingham City Council, for example, initially obtained Living Wage employer accreditation in part to maximise the social, economic and environmental value of its procurement, but now views it as a means of “laying the foundation for a prosperous city, built on an inclusive economy”. Manchester City Council’s economic strategy for the next 10 years, meanwhile, aims to “ensure everybody is paid at least a real living wage”. Glasgow City Council claims its living wage is a powerful force for establishing a basic standard of living for employees across the city.9
Inclusive growthSome elected mayors and councils in city regions have sought to blend their devo-deals with local strategies to create so-called inclusive growth. Although a broad and amorphous concept,10 the World Economic Forum, the Scottish Government, and European Union have defined it broadly in similar terms, as growth which benefits and provides economic opportunities for all.
The idea is gaining traction – including among elected mayors.11 According to the Centre for Cities: “While governments have been able to boast of record rates of employment in recent years, wages have stagnated and the levels of in-work poverty now exceed those of out-of-work poverty. This disconnection, with economic growth failing to translate into fewer people living in poverty, has driven inclusive growth up both the political and economic agendas”.12 The RSA Commission on Inclusive Growth commented that “traditional metrics of economic performance, such as GDP or at a regional level GVA, are a poor guide to social and economic welfare. They do not tell us anything about how the opportunities and benefits of growth are distributed across different spatial areas and social or income groups”.13

As part of inclusive growth plans, some cities and city regions are also targeting Living Wage campaigns at low paid staff in local ‘anchor institutions’: the major public and private sector employers with strong historical, social and/or cultural roots in the area, such as local authorities, universities, hospitals and schools, football clubs, airports and iconic landmarks. These institutions have a responsibility to play their part in supporting local people’s living standards, but their significance also lies in their ability to play a leadership role when it comes to the Living Wage, with a potential knock-on effect on other local employers deciding to join the campaign. As research by the Cardiff Business School has demonstrated there are cluster effects driving take-up. They note: “Over a third of employers said that peers had exercised at least some influences over their decision and this kind of influence can be seen in the population of Living Wage employers, which includes clusters of firms in particular industries.”14 Thus the evidence suggests that the campaign and major employers can change social norms to increase take-up.
Other local authorities are including Living Wage clauses in public procurement contracts, often linked to social value policies.15 Such approaches seek to counter the damage, as evidenced by the IMF, an unequal society has on growth itself.16
In-work povertyOne of the emerging trends over the last decade has been the rise of in-work poverty, with households in which at least one member is in work now outnumbering those where no one is working.17 This is in part caused by low wages, which is leading to considerable physical and emotional stress and adversely affecting people’s quality of life. Polling for the Living Wage Foundation found that over a third of people paid below the Living Wage said they had skipped meals regularly for financial reasons, over four in ten stated that they had fallen behind household bills and a third said their pay negatively effects their relationship with their partner.18 Such findings are signs of economic and social exclusion, not of people that feel included. In contrast, more than eight in ten felt being paid the real Living Wage would improve their happiness and over seven in ten thought it would help improve their mental or physical health.
Productivity and low payImproving living standards is contingent on achieving sustained productivity growth.19 However, it is not inevitable that it will benefit the majority of the workforce or those on the lowest wages, especially given the decoupling of wage growth from productivity growth.20 Leading labour market academics, such as Steve Machin and Paul Gregg, have argued that alongside low unemployment, both productivity gains and restoring the link between productivity and average earnings will be necessary to secure sustained real wage gains for UK workers.21 Even then, it is certainly not the case that this will tackle incidence of low pay. The UK (and its city regions) has had a persistent low pay problem, which preceded the decoupling of wage and productivity growth and has not shifted despite the introduction of the National Minimum Wage (which was very effective in tackling levels of extreme low pay).22 Across the ten areas looked at in this report, there are 2.3m paid below the real Living Wage. The problem is, of course, most pronounced in some low productivity areas, where on average one in four workers are paid below the real Living Wage.
Figure 1: Proportion of UK workers that are low paid
Source: OECD Stat
T H E S M I T H I N S T I T U T E
11
0%
5%
10%
15%
20%
25%
30%
35%
40%
1976
1978
1980
1982
1984
1986
1988
1990
1992
1994
1996
1998
2000
2002
2004
2006
2008
2010
2012
2014
2016

T H E S M I T H I N S T I T U T E
12
Nevertheless, increasing productivity growth in the city regions will be critical to increasing pay regardless of its distribution. At the moment the UK and its core cities lag well behind the rest of Europe. Nationally the UK lags behind US, France and Germany, all of which are 30% more productive per worker. While, only six cities (London, Slough, Reading, Milton Keynes, Aberdeen and Aldershot) have higher than average productivity than the average across 330 European cities. And more than half of UK cities (38) are among the bottom quarter for productivity.23
The Industrial Strategy White Paper24 signalled the government’s intention to address the so-called ‘productivity puzzle’ and develop ‘local industrial strategies’ to be agreed by March 2019. The White Paper stated: “These strategies will help identify priorities to improve skills, increase innovation and enhance infrastructure and business growth.” New funding streams, such as the ‘Strength in Places Fund’ (2017) have also been introduced to help raise local productivity.
However, the productivity challenge is not simply about geography or the composition of the UK economy (that low productivity industries and sectors form too large a part of the UK economy, which is reflected in many of our cities). Within industrial sectors the UK fares poorly against European counterparts. These sectors include lower skilled and lower paid sectors. For example, in the low-paying distributive trades, repairs, transport, accommodation & food services. The Gross Value Added per hour in these industries is much lower than in manufacturing and lower than in many other EU states (e.g. a third lower than in France).25 Moreover, labour market projections suggest these low paid sectors will grow faster than the average.26 It will therefore be even more important that there is a sustained focus on increasing productivity in these areas.
The evidence both nationally and locally suggests this productivity problem is a result of the UK having more employers competing on low skill, low pay, low investment business models than our more productive European counterparts, who are often competing on quality rather than price or cost. These low pay business models can be profitable for individual employers, but they have consequences for workers, whilst also acting as a drag on national productivity rates.
Local economic actors have a role to play in changing this landscape, and shaping firms’ decisions about how to compete, potentially using the Living Wage as a driver for change, alongside, but also through, their new powers in skills, infrastructure and business support. And as the report highlights, it is not just that weak productivity is impacting wages, but that low, or unfair pay, is likely to result in low productivity.27 Efforts that local authorities, combined authorities and others can, and do, make to tackle low pay are therefore an important component in advancing the economic interests of a local area.
Increased productivity also provides wider social benefits to local workers and communities. The work of Professor Sir Michael Marmot and his team at University College London revealed how social determinants of health, including low pay and insecure work, are harmful to health, specifically mental health problems and musculoskeletal disorders. Marmot notes, “jobs that are insecure, low-paid and that fail to protect employees from stress and danger make people ill.”28 Other studies have shown the most stress-causing aspects of work include low pay, with low pay being a predictor of obesity, anxiety and depression, low birth weights and hypertension.29 One has even found that people with a low paid or highly stressful job may not enjoy better health than those who are unemployed.30
Furthermore, health and economic performance are strongly interlinked with good health. Understood as a form of human capital, good health is not just a source for human well-being but also local, regional and national productivity.31 It stands to reason that workers are unlikely to be very productive if they are unwell. Ill heath also comes at a cost to the NHS. The Joseph Rowntree Foundation has estimated that poverty costs the NHS £29bn per year. The JRF suggests the total bill is around £69bn when including costs to schools, police and criminal justice system, children’s services and housing.32
A low pay, low productivity local economy is also a major constraint on the push to create a sustainable, self-funded English local government system. Reducing cost pressures on local services will require more than better demand management and efficiency gains. A key component to achieving more financial control and less reliance on central government funding will be helping to move people into better paid work, thereby reducing in-work poverty and reliance on tax credits and other benefits.33
Will the Living Wage help?Whilst tackling low pay will be critical to fiscal rebalancing and to creating genuinely inclusive city regions, little research has been undertaken to understand whether increasing the take-up of the real Living Wage per se will benefit an area as a whole. Or whether it would simply shift money around within local areas, suck money out to the Treasury, or result in disemployment (either fewer hours or put people out of employment).
This report seeks to address these questions and examines the complexities and likely scale of the impact. It first explores how a pay rise to the real Living Wage would be paid for. In particular, how the Office for Budgetary Responsibility (OBR) models for changes in the National Minimum Wage and what the introduction of the statutory National Minimum Wage can tell us about how firms and employees are likely to react to a further rise.

The report also looks at who benefits, how much would go to workers through higher wages, and how much the Treasury would benefit through increased tax receipts and reduced benefits. These findings are then applied to 10 city regions across the country to determine the scale of the potential benefits.
As the results below show, even under a conservative scenario, the outcomes for an area are positive while also helping to raise people’s incomes and quality of life, improve a city’s fiscal position and move towards genuine inclusive growth. This is largely because the evidence shows that employees should be valued as an asset to be invested in not a cost to be cut, and when they are, including by paying the real Living Wage, this creates wins for the individual and the local economy. Such evidence would suggest that there would not just be social, but also economic merit, in local authorities, public agencies and key economic actors shaping the decisions of business to incentivise increased investment in people, including through reductions in low pay, so they are more productive. This could come in the form of Living Wage clauses in public procurement contracts or public support (advice, skills training etc) for businesses/organisations or sectors being contingent on moving to the Living Wage.
Table 2: Who is paid below the Living Wage in Britain and where?
Proportion paid below the real Living Wage
Proportion paid below the real Living Wage
Women 28% Hotels & restaurants 67%
Men 18% Wholesale & retail 40%
Arts & recreation 38%
Part time 45% Agriculture 37%
Full time 15% Admin & support services 37%
Other service activities 32%
East Midlands 27% Health & social work 22%
Yorkshire and the Humber 27% Manufacturing 16%
West Midlands 27% Real estate 14%
North East 26% Construction 13%
Wales 26% Water supply & waste 13%
North West 25% Transport & storage 12%
South West 24% Info. & comms. 7%
East 23% Public admin 4%
Scotland 20% Finance 4%
London 20% Education 0%
South East 19% Prof. & technical 0%
Source: D’Arcy, C Low Pay Britain 2018 (Resolution Foundation)
T H E S M I T H I N S T I T U T E
13

T H E S M I T H I N S T I T U T E
14

T H E S M I T H I N S T I T U T E
15
Who pays and who gains: Understanding the local impact of the Living Wage
T H E S M I T H I N S T I T U T E
16
Who pays and who gains: Understanding the local impact of the Living Wage
The big question when it comes to the Living Wage and local growth is who pays for the increased wage bill, and who gains?34
This section of the report outlines how the impacts can be calculated with reference to the OBR’s assessment of the increase in the National Minimum Wage. It also looks at empirical studies into the impact of the statutory minimum wage and its subsequent increases.
Whilst the real Living Wage is different in the pay level and design (being voluntary not statutory), these lessons are applied in the approach adopted for this report. It also incorporates findings from other studies showing why increased pay leads to productivity gains, including those exploring the impact of the real Living Wage.
The section also outlines who benefits. As people earn more, means-tested benefits and tax credits are withdrawn for those in low income households. In addition, taxes on earnings increase as wages ratchet up. As this money benefits HM Treasury (and not directly the local area) then the boost in wages and spending power are dampened. This section looks at the scale of what is called the ‘Marginal Deduction Rate’ (MDR), to see how much will be retained locally and how much will go to central government.
The final scale of the impact will also depend on the size of any multiplier effects, as employees spend more locally; whether there are wage spillovers as slightly higher paid workers expect to keep wage differentials; and any leakages as workers may not live, and therefore spend, in the local area that they work. These are factors also considered in the evaluation.
Who pays?An intuitive model of who pays for a pay rise is that the cost is passed through to the consumer in the form of higher prices, to the business owner in reduced profits, or the employee in the form of reduced hours. Or a combination of any of these.
Such a scenario, if all employees, consumers and business owners were locally based, would result in no overall economic impact on the local economy as someone benefits at someone else’s expense. Factoring in the impact of the tax and benefit implications would turn a neutral impact negative. As HM Treasury would receive more taxes and pay out less in social security payments, then a proportion of the increased hourly wage paid for by the consumer or business would go to the Treasury rather than remain locally. In such a scenario any multipliers start to work in reverse.
However, this model ignores the potential impact high wages may have on productivity. Higher wages have the potential to incentivise workers. They also have the potential to challenge employers over how to get the most out of employees, and to encourage them to think differently about how to compete – moving from low pay, low skill business models to those that benefit from a more skilled and motivated workforce. More negatively from the workers’ perspective this can result in less work if investment in labour is replaced by investment in capital, or more simply that employees are expected to work more intensely.
These potential factors need to be understood before we can understand the impact on the local economy.
When modelling the likely impact of an increase in the minimum wage, the OBR used a mix of these factors, bar productivity gains, to forecast the impact of the introduction of a higher minimum wage for over 25-year olds (the government’s National Living Wage). The OBR model is summarised below:
an elasticity of demand for labour of -0.4… This means total hours worked fall by 0.4 per cent for every 1.0 per cent increase in wages; half the effect on total hours will come through employment and half through average hours; …We assume that the wage costs that would otherwise have been paid in the absence of this policy provide a rough guide to the average productivity of the hours lost;that firms pass on around half of the increase in unit labour costs to consumers through price increases, meaning that profits are slightly lower
OBR, Economic and fiscal outlook (July 2015)
Unsurprisingly then, the OBR’s assumptions mean the government’s National Living Wage was expected to act as a brake on output. At a local level, if applied to extending the independently-calculated real Living Wage, then it would result in fewer hours worked and lost output as a result. And the total wage bill would be paid through increased prices and reduced profits. Added together, and because the Treasury would take a proportion of the additional wage bill in taxes and reduced benefits, this could mean the extension of the independent Living Wage acts as a bigger brake locally than nationally.
However, as mentioned, the lacuna in much of the debate concerns levels of productivity. The OBR assumptions are that firms are

likely to respond by reducing hours, the number of employees, the number aged over 25 (to escape the premium) or increasing prices. Productivity at an individual level is not considered. Indeed, the OBR explicitly states that “We would not expect these changes to affect hourly productivity for specific individuals, but the composition of employment could change sufficiently to affect the average.”35
Studies into the impact of the government minimum wage since it was introduced are instructive. There is little evidence of the NMW leading to price rises. For example, a study by labour market experts concluded that “there is scant evidence on this score”.36 In the context of the independent, real Living Wage, the fact that it is voluntary could also make price rises less feasible. With the real Living Wage not universally adopted those firms who have moved to paying their employees more may struggle to pass these costs onto the consumer and stay competitive.
Evidence from the introduction of the National Minimum Wage on profits is not so clear. A detailed study commissioned by the Low Pay Commission found: “no significant profit effects in the period before the introduction of the NMW nor do we find significant profit effects during the NMW periods in the vertical placebo.”37 An earlier study by the same authors found some negative effect on the profits of smaller, low paying firms.38 In the context of this research, the spatial impact of reduced profits would also be absorbed diffusely as not all business owners live locally. Examination of business ownership shows that 29% of economic output is from companies owned abroad. A further 28% is owned by UK big businesses, who are likely to have shareholders based across the UK and the globe.39
The dog that did not bark when the statutory National Minimum Wage was introduced was an increase in unemployment. Despite scare stories in the lead up to its introduction, the evidence suggests there were no disemployment impacts (either fewer people working or fewer hours worked).40 Economic theory would suggest that disemployment effects would kick in at some point. But the conventional model that statutory wage floors create disemployment is not supported by the evidence.41
The evidence instead points towards productivity gains. As economists Riley and Rosazza Bondibene note: “Our results suggest that these labour cost increases amongst low-paying firms may have been met by increases in labour productivity.”42 What is more, this increase in productivity does not appear to come from jobs being replaced in capital labour substitution (investment in capital replacing investment in workers) or reductions in employment. Such findings are further developed by other academic studies, which find that the National Minimum Wage led to increased productivity, and that living wages could enhance productivity.43
The explanations for why pay rises for the bottom pay deciles boosts productivity relate to both behavioural changes from employers and employees.
Some studies have shown that higher wage floors create incentives for employers to offer more training. Evidence suggests that after the introduction of the minimum wage training was not reduced in an effort to cut costs and some evidence that it actually increased.44 There certainly seems scope for increased training with those on lower pay less likely to have workplace training.45
Some explanations have pointed towards better organisational and management practices. Research into fast food restaurants from the USA (based on payroll data and survey of managers and employees) found no negative impact on employment or hours. Instead managers found that they could offset costs through improved operational efficiencies and improved HR practices.46 Other studies have focused on the impact on employees, be it through a reduction in lower levels of job churn,47 reduction in supervision required48 and employee effort.49 The latter corresponds with the fair-wage effort theory which has shown that workers have a conception of a fair wage and when their actual wage is less than the fair wage, “workers supply a corresponding fraction of normal effort.”50 Others have argued that reductions in wage differentials can increase work team cohesiveness to boost productivity.51
This makes intuitive sense. As previous surveys of employees conducted by the Smith Institute have shown, concerns at the workplace are often focused on poor management practices (with workers as likely to request training for managers as for themselves). They have also highlighted other issues which impact on productivity, such as low morale over pay, and its impact on workplace trust. One survey showed that employees were keen to help increase productivity but felt they would not be listened to and were demotivated too because they felt they would not receive a fair share of the rewards if output increased.52
Studies into the real Living Wage have found similar results. A study by the Cardiff Business School into the experiences of the employers that have voluntarily committed to join the movement for a real Living Wage found 85% stated that it enhanced their reputation as an employer; nearly 60% noted that it had improved relationships between managers and staff and over half said that it had improved retention.53 In USA the introduction of living wages were also found to increase productivity.54 It also led to reduced staff turnover, something also found by Nobel-winning economist Joseph Stiglitz.55 Research by Queen Mary University also found similar benefits, including the ability to improve the quality of recruits by increasing pay.56
It could be argued that there are limits to possible productivity gains, especially if the gains have already been made after the initial introduction of the government’s National Minimum Wage. There has in fact been some evidence that profits have been affected over
T H E S M I T H I N S T I T U T E
17

T H E S M I T H I N S T I T U T E
18
the longer term as minimum wage rates increase and productivity gains stabilise. However, recent research demonstrates that low-paying sectors in the UK are significantly less productive than other European countries.57 Indeed, it is worth restating that overall France and Germany are 30% more productive than the UK - and as noted this holds true when comparing low-paid sectors in the UK with other European countries.
This in part reflects the UK’s so-called ‘low skills equilibrium’, “in which the majority of enterprises are staffed by poorly trained managers and workers producing low-quality goods and services.”58 Whilst businesses are acting rationally there is a system failure, whereby the state and societal institutions frustrate demand for improvements in skills. As has been noted in a study for government, “simply increasing the supply of intermediate and higher-level skills at a regional level is unlikely to have any significant impact, unless it is accompanied by other policies aimed a changing business behaviour.”59
One suggestion to address this problem is to simply raise the wage floor.60 However, whilst better pay may increase employee effort, it is important that Living Wage employers do not just see it as a way of demonstrating their credentials as good corporate citizens, but also a timely juncture to examine operational practices and HR issues to boost output by lower paid workers. Indeed, it also follows that if local economic actors are aiming to increase Living Wage take-up, that they have imbedded in their strategies ways of incentivising increased take-up of the Living Wage by supporting businesses move to ‘higher road’ business plans and strategies.
This support would seem to go hand in hand with greater take-up of the real Living Wage (and breaking out of the cycle of low skill, low valued added products and services) as businesses will want to protect and enhance their profitability. Given this, as well as evidence from studies on the National Minimum Wage, the overarching assumption used about the impact on increased take-up of the real Living Wage is that it will be met by productivity gains rather than disemployment, higher prices or lower profits.
Whilst this is the working assumption, given the inherent uncertainties of an increase above the National Minimum Wage, we have also explored a more cautious scenario. As mentioned, numerous studies have suggested that there has not been a negative impact on employment or hours, including regionally. However, as Professor Alan Manning notes: “Regional labour markets do not behave like national ones so although a regional analysis gives us little cause for concern it cannot give us complete confidence that a hike in the national rate of the minimum wage would see no effect.”61 Furthermore, others have pointed towards small employment effects within industries.62 As such, the data is analysed for a more cautious scenario based on lower end assumptions from the OBR and some evidence from the National Minimum Wage about the longer term impact on profits.
As such, the more conservative scenario assumes:
• A small reduction in hours. Elasticity is assumed to be 0.15% fewer hours per 1% increase in pay. This is the lower end of OBR’s assumptions because the independent Living Wage is voluntary and firms are expected to abide by the spirit of the Living Wage. Despite reduced hours workers would still be financially better off.
• Prices are not expected to rise as firms are unlikely to increase them as they will continue to compete with other firms not raising wages.
• Half the wage increase will be paid via lower profits. As over half of economic output (GVA) comes from large or foreign owned firms, 50% of the lower profits are expected to be absorbed outside the area.
• The remaining half of the costs will be met by increases in productivity.
Who gains?Who gains matters as much as who pays when considering the impact on local economies of extending the real Living Wage. Specifically, what is the balance between gains kept locally, and those going to central government?
As the debate surrounding the introduction of Universal Credit highlighted there are high benefit deduction rates as people earn more, which the new system was in part designed to address. In particular, the Treasury benefits from higher income tax and national insurance on wages, and as a result of higher incomes, gains from lower benefit payments (mainly Working Tax Credit and Housing Benefit). The Marginal Deduction Rate (MDR: the proportion of the additional pay that goes to government in increased taxes or reduced benefits) for those on low incomes can be close to 100% for some households, it can also be at a high level for those entering work. In such cases, even under Universal Credit it can result in a very high rate upwards of 70%.63 However, large numbers who would benefit from the real Living Wage live in middle income households (see figure 2) and thus receive far fewer benefits. In such instances, the MDR is much lower.
So, to understand the relationship, the tax and benefit impact of adopting the independently-calculated higher Living Wage across the population was modelled. Based on the Family Resource Survey for 2016/17 which includes household data (not just individual employees), the model provides a headline MDR of 35% (in line with the implied MDR in other studies).64

Table 3: The Living Wage Marginal Deduction Rate
Tax/benefit impact Reduction on additional pay
Income Tax 14%
National Insurance 10%
Tax Credits 8%
Means Tested Benefits 3%
Total 35%
In making assumptions about average MDR care also needs to be given to any regional variations. In particular, whether London with a higher real Living Wage (as well as already higher wages) would have a higher MDR as effects such as lower paid workers with slightly higher wages are more likely to be above the personal allowance threshold and therefore be taxed more. It may also be assumed that increases in wages is disproportionately likely to reduce Housing Benefit/Universal Credit claims in London given both higher rents and a higher proportion of people renting.
However, London’s MDR is about average and most regions are distributed around the national average. When examining the results in more detail, whilst MDR is higher for Housing Benefit and income tax; Londoners lose less in Working Tax Credits.
The proportion of all revenue going to HMT as a result of the real Living Wage is 3.5 points higher for Londoners in both income tax and Housing Benefit and 7 percentage points lower for tax credits. It appears that whilst higher wages mean higher income tax payments it also means Working Tax Credits are relatively less important to Londoners. Indeed, total Tax Credits are equivalent to 70% of the Living Wage Premium for Londoners but 90% for those in the rest of the country. Therefore, any clawback from Treasury seems to be relatively less important for London workers.
Figure 2: The marginal deduction rate by region
As the MDR is similar for all regions, the national average (35% of additional earnings go to the Treasury) is used and applied for all places in the next section’s scenarios.
Impact for employeesWhilst this report is focused on the local economic benefits, it is also worth examining the potential benefits for individuals and households. Over the course of a year, an employee benefitting from the real Living Wage will see their earnings increase by £1,450 (the Living Wage premium). Even after increased tax payments and reduced benefits this would on average mean an additional £940 in income.
T H E S M I T H I N S T I T U T E
19
0%
10%
20%
30%
40%
50%
60%
70%
80%
90%
100%
NorthEast
NorthWest
Yorksand theHumber
EastMidlands
WestMidlands
East ofEngland
London SouthEast
SouthWest
Wales Scotland NorthernIreland
UK average

T H E S M I T H I N S T I T U T E
20
Looking at the distributional impact, the following charts show how average incomes amongst different income deciles would be affected. As the first charts show the proportion of people seeing a pay rise is skewed towards households with low to middle incomes. In particular, the proportion of working families that would benefit from the Living Wage by decile.
Figure 3: Distribution of people benefiting from the Living Wage by household income decile
Figure 4: Proportion of working families that would benefit from the Living Wage by decile
In cash terms, middle income deciles would benefit most.
Figure 5: Pay increase (£) of the Living Wage by decile
0%
2%
4%
6%
8%
10%
12%
14%
16%
1 2 3 4 5 6 7 8 9 10
0%
10%
20%
30%
40%
50%
60%
1 2 3 4 5 6 7 8 9 10
0
20
40
60
80
100
120
140
160
180
200
1 2 3 4 5 6 7 8 9 10

However, as a proportion of income those deciles with lowest income households would see the biggest relative increase in spending power (this includes households where no-one would benefit).
Figure 6: Percentage increase in income by decile
Figure 7: Percentage increase in income by decile, only families including workers
MultipliersThese distributional impacts matter not just for the individuals who will see their incomes rise, but also for our understanding of the potential multipliers. Multipliers, or the multiplier effect, is the increase in final income arising from the additional injection of spending. For example, an increase in local wages results in additional consumer spending, in turn creating additional jobs, wages and economic growth.
Under the scenario outlined above, as workers would have increased spending power we would expect this to have multiplier effects, with growth flowing from the additional spending power of workers. The OBR uses the multipliers listed in the table. This shows the different multiplier rates. So, if VAT changes resulted in £1 less tax then an expected 35p worth of additional economic activity is expected. This increases up to a doubling for capital expenditure.
Table 4: Multiplier levels
Multiplier
Change in VAT rate 0.35
Changes in the personal tax allowance and National Insurance Contributions (NICs) 0.3
AME welfare measures 0.6 Implied Resource Departmental Expenditure Limits (RDEL) 0.6
Implied Capital Departmental Expenditure Limits (CDEL) 1.0
Source: HMT
T H E S M I T H I N S T I T U T E
21
0.0%
0.1%
0.2%
0.3%
0.4%
0.5%
0.6%
0.7%
0.8%
1 2 3 4 5 6 7 8 9 10
0.0%
0.5%
1.0%
1.5%
2.0%
2.5%
3.0%
1 2 3 4 5 6 7 8 9 10
T H E S M I T H I N S T I T U T E
22
The middle two rows show the expected multiplier if taxes are cut (0.3) and if welfare spending increases (0.6). As the table implies, tax cuts have a lower multiplier than benefit increases as those on higher incomes who are more likely to benefit from a tax cut than social security increases are more likely to save rather than spend.
The analysis in the previous table showed that the benefits of an increased wage floor were skewed towards those on lower to middle incomes. In line with previous research,65 because the impact of a real Living Wage is more progressive than a tax cut, but less so than benefit payments, the multiplier is expected to be in between, at a rate of 0.45.
SpilloversGiving the lowest paid employees a pay rise through the real Living Wage is likely to impact the pay of those on higher wages with more responsibility, experience or skills. Firms that become Living Wage employers may seek to keep wage differentials by paying those staff above the real Living Wage rate more. This is often called a spillover effect, whereby the impact on one group can have an impact on a seemingly unrelated group. In this case, the impact of Living Wage only directly affects those paid below the level. However, moving people up to the Living Wage could spillover to impact those paid slightly more than the Living Wage.
There is no consensus about the spillover effect of the National Minimum Wage, neither the extent of the effect or, indeed, if there was any impact at all with some studies suggesting there were none.66 Others have pointed to significant spillover effects in areas most affected by the introduction with effects evident up to 25th percentile.67
Analysis for this report of wage data between 2015-16 indicates some wage spillovers. By examining the gap between predicted number of employees paid at incremental rates just above the National Minimum Wage and actual observed numbers suggests some small spillovers. There are less people paid at the National Minimum Wage level than predictions would suggest and more than predicted for pay rates above the National Minimum Wage. This impact tails off so it is not observed beyond 1.4 times the rate of the National Minimum Wage. Whilst observable, as a proportion of the Living Wage premium it would be relatively small. Nevertheless, they appear observable and are applied in line with the impact observed for the National Minimum Wage uprating.
Wage leakagesThe local impact of any gains that flow from extended spending power that comes from real Living Wage take-up will depend on where additional wages are being spent. If money is spent outside the area, then there will be an economic leakage; where all the benefits are not contained within an area but some of it leaks out to neighbouring regions.
A host of studies have shown that people in lower paid roles work closer to where they live.68 Examining the Labour Force Survey data shows that around 90% of people paid below the real Living Wage work in the same sub-region as the one in which they live. Interestingly, and perhaps reflecting the better transport infrastructure, this drops to 80% in London. These figures are used to adjust the local economic benefits of paying the Living Wage for wage leakages beyond the local area.

T H E S M I T H I N S T I T U T E
23
The local economic benefits of the Living Wage

T H E S M I T H I N S T I T U T E
24
The local economic benefits of the Living Wage
The previous section presented evidence that higher wage floors can be productivity enhancing. Using the assumptions outlined in the previous chapter, the potential impact of increased take-up of the real Living Wage can be modelled for different places.
This depends on the hours worked in each location. The scale of the benefits is also dependent on the number of workers seeing a pay rise. This report highlights an ambitious scenario whereby there is a significant increase in the take-up of the real Living Wage with a quarter of employees currently paid below the real Living Wage moving to the accredited rate. If replicated across the country it would mean the UK would move from having higher than average rates of low pay for OECD countries to being slightly better than the norm.69
Which city regions?As the report has described, the current spatial focus for policymakers is cities and city regions. Therefore, to understand the impact that the extended Living Wage could have sub-nationally, ten city-region and combined authority areas across Britain were chosen, as listed in table 5.
Together they account for 2.3 million jobs paid below the Living Wage. This equates to slightly over a third of jobs paid below the real Living Wage in the UK. Collectively, the proportion of jobs paid below the real Living Wage in these city regions is similar to the national average (22% and 23% respectively).
As the table below shows, the proportion of jobs paid below the Living Wage does vary between one in five (19%) in the West of England Combined Authority and Glasgow City Region and over a quarter in Liverpool and Sheffield City regions (26% and 27%). In sheer number terms most are located in London, just under 40%.
Table 5: Numbers and proportion paid by the Living Wage
Number paid below the real Living Wage Proportion of paid below the real Living WageLondon 830,000 20%
Greater Manchester 265,000 23%West Midlands (Combined Authority) 280,000 25%
Cambridgeshire and Peterborough 80,000 20%West of England 85,000 19%
Liverpool City Region 155,000 26%North East Combined Authority 195,000 25%
Sheffield City Region 145,000 27%Cardiff Capital Region 140,000 24%Glasgow City Region 150,000 19%
Source: D’Arcy, C Low Pay Britain 2018 (Resolution Foundation) and authors calculation based on ASHE data
As low pay is associated with part-time hours, those paid below the real Living Wage may be more likely to work fewer hours. And average hours for those paid below the real Living Wage varies by place. The table below presents the data for the areas, and where the hours are not available at city-region scale the regional number is used.
Table 6: Average weekly hours for those paid below the Living Wage
London 30.5Greater Manchester 32.0
West Midlands Combined Authority 30.1Cambridgeshire and Peterborough* 32.8
West of England* 30.0Liverpool City Region* 28.9
North East Combined Authority* 28.2Sheffield City Region 29.2
Cardiff Capital Region* 30.3Glasgow City Region* 33.5
*Represents regional/sub-national figureSource: Author’s analysis of the Labour Force Survey
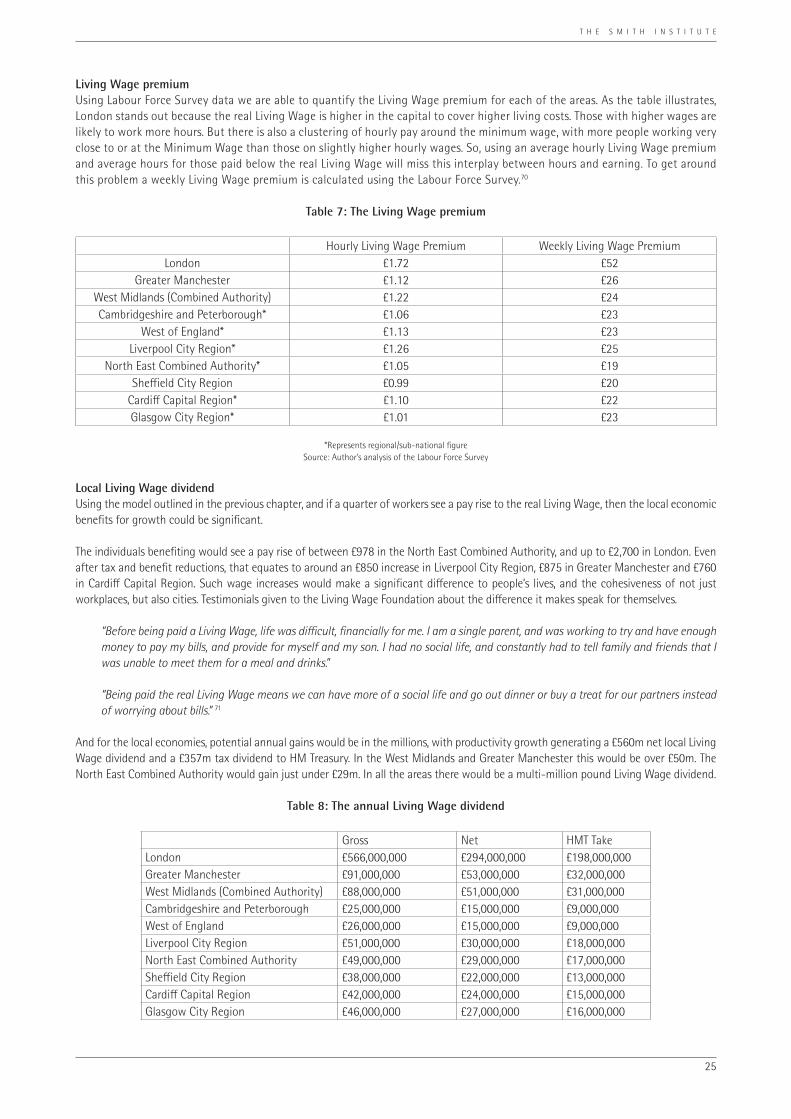
Living Wage premiumUsing Labour Force Survey data we are able to quantify the Living Wage premium for each of the areas. As the table illustrates, London stands out because the real Living Wage is higher in the capital to cover higher living costs. Those with higher wages are likely to work more hours. But there is also a clustering of hourly pay around the minimum wage, with more people working very close to or at the Minimum Wage than those on slightly higher hourly wages. So, using an average hourly Living Wage premium and average hours for those paid below the real Living Wage will miss this interplay between hours and earning. To get around this problem a weekly Living Wage premium is calculated using the Labour Force Survey.70
Table 7: The Living Wage premium
Hourly Living Wage Premium Weekly Living Wage PremiumLondon £1.72 £52
Greater Manchester £1.12 £26West Midlands (Combined Authority) £1.22 £24Cambridgeshire and Peterborough* £1.06 £23
West of England* £1.13 £23Liverpool City Region* £1.26 £25
North East Combined Authority* £1.05 £19Sheffield City Region £0.99 £20
Cardiff Capital Region* £1.10 £22Glasgow City Region* £1.01 £23
*Represents regional/sub-national figureSource: Author’s analysis of the Labour Force Survey
Local Living Wage dividendUsing the model outlined in the previous chapter, and if a quarter of workers see a pay rise to the real Living Wage, then the local economic benefits for growth could be significant.
The individuals benefiting would see a pay rise of between £978 in the North East Combined Authority, and up to £2,700 in London. Even after tax and benefit reductions, that equates to around an £850 increase in Liverpool City Region, £875 in Greater Manchester and £760 in Cardiff Capital Region. Such wage increases would make a significant difference to people’s lives, and the cohesiveness of not just workplaces, but also cities. Testimonials given to the Living Wage Foundation about the difference it makes speak for themselves.
“Before being paid a Living Wage, life was difficult, financially for me. I am a single parent, and was working to try and have enough money to pay my bills, and provide for myself and my son. I had no social life, and constantly had to tell family and friends that I was unable to meet them for a meal and drinks.”
“Being paid the real Living Wage means we can have more of a social life and go out dinner or buy a treat for our partners instead of worrying about bills.” 71
And for the local economies, potential annual gains would be in the millions, with productivity growth generating a £560m net local Living Wage dividend and a £357m tax dividend to HM Treasury. In the West Midlands and Greater Manchester this would be over £50m. The North East Combined Authority would gain just under £29m. In all the areas there would be a multi-million pound Living Wage dividend.
Table 8: The annual Living Wage dividend
Gross Net HMT TakeLondon £566,000,000 £294,000,000 £198,000,000Greater Manchester £91,000,000 £53,000,000 £32,000,000West Midlands (Combined Authority) £88,000,000 £51,000,000 £31,000,000Cambridgeshire and Peterborough £25,000,000 £15,000,000 £9,000,000West of England £26,000,000 £15,000,000 £9,000,000Liverpool City Region £51,000,000 £30,000,000 £18,000,000North East Combined Authority £49,000,000 £29,000,000 £17,000,000Sheffield City Region £38,000,000 £22,000,000 £13,000,000Cardiff Capital Region £42,000,000 £24,000,000 £15,000,000Glasgow City Region £46,000,000 £27,000,000 £16,000,000
T H E S M I T H I N S T I T U T E
25

T H E S M I T H I N S T I T U T E
26
Map 1: Annual individual and local Living Wage dividend
Glasgow City Region Employee LW Premium: £1,180
Area’s LW Premium: £27m
North East CAEmployee LW Premium: £980
Area’s LW Premium: £29m
Sheffield City RegionEmployee LW Premium: £1,020
Area’s LW Premium: £22m
Greater ManchesterEmployee LW Premium: £1,340
Area’s LW Premium: £53m
Cambridgeshire and Peterborough
Employee LW Premium: £1,210Area’s LW Premium: £15m
London Employee LW Premium: £2,710
Area’s LW Premium: £294m
Liverpool City RegionEmployee LW Premium: £1,300
Area’s LW Premium: £30m
West Midlands CAEmployee LW Premium: £1,230
Area’s LW Premium: £51m
Cardiff City RegionEmployee LW Premium: £1,170
Area’s LW Premium: £24m
West of EnglandEmployee LW Premium: £1,200
Area’s LW Premium: £15m

Even taking the conservative scenario – assuming that some of the cost in higher wages is absorbed via reduced hours and profits - there would still be considerable economic and social benefits. Employees would still, despite working fewer hours, on average receive a £950 income premium per year. The London economy would be better off by almost £100m per year, Greater Manchester and the West Midlands over £15m. The impact on local economies remains positive, even without including the additional social and public service benefits of increasing the incomes of the low paid workers.
Table 9: Annual Living Wage dividend using conservative assumptions
Net HMT Take
London £97,000,000 £121,000,000
Greater Manchester £17,000,000 £19,000,000
West Midlands (Combined Authority) £17,000,000 £19,000,000
Cambridgeshire and Peterborough £5,000,000 £5,000,000
West of England £5,000,000 £5,000,000
Liverpool City Region £10,000,000 £11,000,000
North East Combined Authority £11,000,000 £11,000,000
Sheffield City Region £8,000,000 £8,000,000
Cardiff Capital Region £7,000,000 £9,000,000
Glasgow City Region £9,000,000 £10,000,000
Such figures suggest there are significant economic and social benefits for city regions of extending Living Wage coverage. They also support city and city-region strategies for inclusive growth.
The Living Wage: Economic development and devo dealsThe findings in the report highlight the potential for the real Living Wage to support efforts to increase productivity. Some combined authorities have also set their sights on becoming self-financing. As the previous section has highlighted, the real Living Wage reduces reliance on central government by reducing benefit spending and increasing tax yields, in this scenario by £357m across the 10 city regions. Added to which there are also potential social benefits that could help reduce demand pressures and costs of public services paid for by central government. Furthermore, as some public services become devolved, local authorities and combined authorities have an interest in boosting wages to reduce the negative effects of low pay. As such the real Living Wage could offer a lot to local economic strategies focused on delivering inclusive growth.
The real Living Wage could also have significant benefits nationally. Approaches to national industrial strategies have too often overlooked what happens within the workplace. The evidence in this report suggests that improving wages does not simply flow from higher productivity but can also be a driver of enhanced productivity.
Given the benefits to national government there could be scope for government to consider Living Wage gainshare arrangements with combined authorities. If such gainshare arrangements were agreed there could be additional economic benefits for local economies. Under the Treasury estimates for infrastructure projects multipliers would be the same size as the original investment. If the funding was focused on (affordable) housing, then the multipliers could be bigger again – with £1 of spent generating £2.80 of economic activity.72 In such circumstances then the economic gains coupled with the direct impact would total £1.1bn for all ten city regions: equating to a £95m boost to the West Midlands, £28m to West of England, and £27m to Cambridgeshire and Peterborough.
As has been noted in such circumstances the real Living Wage could actually help create a modest number of jobs.73 Depending on where the investment was focused, it could also support the wider objective of creating a more inclusive approach to economic development.
T H E S M I T H I N S T I T U T E
27

T H E S M I T H I N S T I T U T E
28
Table 10: Total annual Living Wage dividend with a gainshare arrangement
Total economic boost
London £572,000,000
Greater Manchester £98,000,000
West Midlands Combined Authority £95,000,000
Cambridgeshire and Peterborough £27,000,000
West of England £28,000,000
Liverpool City Region £55,000,000
North East Combined Authority £53,000,000
Sheffield City Region £41,000,000
Cardiff Capital Region £45,000,000
Glasgow City Region £49,000,000

T H E S M I T H I N S T I T U T E
29
Conclusion and policy recommendations

T H E S M I T H I N S T I T U T E
30
Conclusion and policy recommendations
The social and financial benefits to individuals and families receiving a pay rise because of the campaign for a real Living Wage have been well documented. There is also substantial evidence showing how the real Living Wage benefits employers, as well as government (through higher tax receipts and lower benefit spending). This report adds value to that evidence base by showing how the Living Wage could also have positive local economic benefits in city regions, not least in helping boost productivity and by acting as a driver of inclusive growth.
The analysis also suggests that the real Living Wage has the potential to support combined authorities’ ambitions to become fiscally self-sufficient by boosting tax receipts from stronger growth and reducing demand (and therefore cost) of public services.
As city regions grapple with how to deliver a local economy that works for everyone, the real Living Wage could play an important role. Whilst the real Living Wage alone will not eliminate poverty, it can make a significant difference to thousands of low paid workers and contribute to improving the performance and prosperity of our city regions. Given the potential benefits of the real Living Wage, national, city and local politicians and policymakers could consider the following as ways of increasing take-up to realise a local Living Wage dividend:
Local authorities, mayors and combined authorities
• Local authorities and combined authorities that are not already accredited should seek to become Living Wage employers. This could be informed by understanding the productivity gains, contribution to inclusive growth and reduced demand for public services.
• City regions and local authorities that have not already done so should consider integrating the objective and implementation plans for increasing the number of accredited Living Wage employers into their economic strategies and business plans. This could include skills and business support being contingent on moving towards Living Wage employer status. This could both incentivise take-up and ensure that it is productivity enhancing. Thus, local authorities, combined authorities and metro mayors could leverage their budgets and powers to have industrial strategies which tackle both low pay and weak productivity.
• Local authorities and city regions could help extend the real Living Wage through public procurement. Local authorities and city regions could, for example, use their considerable purchasing power to place Living Wage labour clauses in public contracts.
• Local authority and city region efforts to extend the real Living Wage could focus on working with other so-called anchor institutions (long established large public and private sector employers that employ large numbers of people, such as universities, hospitals, airports, rail/bus companies and football clubs as well as major local retailers and other key employers). This could extend beyond procurement to the convening power of mayors and laying down the challenge to the largest and most established employers to increase pay to the real Living Wage for their workforce and contracted staff and suppliers.
• As part of city region and local authority economic development plans, Living Wage take-up should be measured as an indicator of economic improvement and strength.
• The Living Wage Foundation should work with city regions to design and launch a scheme to champion place-based approaches to the Living Wage, building on its Living Wage Places pilot. The Living Wage Places pilot is scoping the potential to create Living Wage Cities, Regions and Zones through partnerships between the Living Wage Foundation, local authority and city leaders and ‘anchor institutions’, to encourage Living Wage accreditation among local employers. Such initiatives would not only seek to improve the economic well-being of people and places, but also foster civic pride and enhance the city or area brand (as it has for employers).
Central government
• Government should work with city regions to agree Living Wage gainshare arrangements. This would enable a city region to share in the fiscal benefits of reducing the prevalence of low pay and further increase the local economic benefits of the real Living Wage. By incentivising city regions to do more to reduce low pay, central government could be net beneficiaries too.
• The Ministry of Housing, Communities and Local Government’s Cities and Local Growth Unit should consider undertaking a review of how government can support city and city-region initiatives to increase real Living Wage take-up. This could be part of central government’s push for improved productivity and greater local government self-financing.
• Government should develop a methodology and tool (building on Greater Manchester’s/New Economy’s ‘Cost Benefit Tool’) to calculate the public-sector savings (such as reduced demands on the health service) that increases in pay to the real Living Wage could have. The innovative tool could be used for Living Wage gainshare discussions and agreements with ministers.

T H E S M I T H I N S T I T U T E
31
Notes

T H E S M I T H I N S T I T U T E
32
Notes
1 Throughout the report the voluntary Living Wage is referred to as the ‘Living Wage’ or real Living Wage (not to be confused with the National Living Wage, the obligatory minimum wage)2 D’Arcy, C Low Pay Britain 2018 (Resolution Foundation)3 Government Office for Science, Future of Cities (2016)4 The basic concept of agglomeration is that firms are located near to each other in a clustering of economic activity to increase the ‘thickness’ of labour markets, foster knowledge spillovers and widen the access to suppliers and customers.5 See McCann, P The UK Regional-National Economic Problem: Geography, Globalisation and Governance (Routledge, 2016) 6 For example, see Tomaney, J “A mess of pottage? The North of Tyne deal and the travails of devolution” http://blogs.lse.ac.uk/politicsandpolicy/the-north-of-tyne-deal-and-the-travails-of-devolution/ 7 For more information on devo deals see LGA ‘Devolution deals’8 See MHCLG reports Devolution and mayors: what does it mean? (2017) 9 Accreditation by councils is considered particularly important as it encourages more local employers to pay the Living Wage - see research by the Trust for London and New Policy Institute10 Lee, N “Inclusive Growth in Cities: a sympathetic critique”, Regional Studies (2018)11 See for example, “EG Peter Wilson Lecture: Property can deliver “inclusive growth” says Manchester’s Andy Burnham,” Estates Gazette, February 201812 Centre for Cities, Funding and financing inclusive growth in cities (2017) 13 RSA Inclusive growth commission: making our economy work for everyone (2016)14 Heery, E et al The Living Wage Employer Experience (Cardiff Business School, 2017)15 See the work of the Centre for Local Economic Strategies (CLES). For example, CLES, Using Procurement Processes to Encourage Living Wage Principles (2014) and CLES, Living Wage and the Role of Local Government (2014)16 See Ostry, J et al Redistribution, Inequality, and Growth (IMF, 2014)17 Tinson, A et al Monitoring poverty and social exclusion 2016 (New Policy Institute/JRF, 2016)18 Living Wage Foundation, Life on Low Pay (2018)19 As the often-quoted Paul Krugman aphorism puts it “productivity isn’t everything, but in the long run it is almost everything”.20 Pessoa, J and Van Reenen, J “Decoupling of Wage Growth and Productivity Growth? Myth and Reality”, CEP Discussion Paper 1246, January 201221 For example see: What are the prospects for a wage recovery in the UK? (Institute for Policy Research, University of Bath, 2014) 22 The Smith Institute, Making Work Better (2014)23 Bessis, H Competing with the continent How UK cities compare with their European counterparts (Centre for Cities, 2016)24 Industrial Strategy: Building a Britain fit for the future (Crown copyright, 2017)25 Dolphin, T and Hatfield, I The Missing Pieces: Solving Britain’s Productivity Puzzle (IPPR, 2015)26 See UKCES, Working futures 2014-24 (2016)27 Akerlof, G and Yellen, J The Fair Wage-Effort Hypothesis and Unemployment (1990) http://blog.press.princeton.edu/wp-content/uploads/2013/10/camerer-chapter-16.pdf 28 Marmot Review, Fair Society, Healthy Lives (2010)29 Pfeffer, J Dying for a Paycheck (HarperCollins, 2018)30 Chandola, T and Zhang, N “Re-employment, job quality, health and allostatic load biomarkers: prospective evidence from the UK Household Longitudinal Study”, International Journal of Epidemiology, February 2018 31 Gilroy, R and Tewdwr-Jones, M Introduction: Joining the dots – making healthcare work better for the local economy (The Smith Institute, 2015)32 Bramley, G et al Counting the cost of UK poverty (JRF, 2016)33 Greater Manchester Combined Authority, “Our people, our place: The Greater Manchester Strategy” 34 This question dominated the debate about the introduction of the National Minimum Wage in 1998. It was assumed by some business representatives and politicians that it would destroy jobs, especially adult workers. This turned out not to be the case and by 2005 there was a cross-party consensus to retain the NMW. 35 OBR, Economic and fiscal outlook (July 2015)36 Draca, Machin, van Reenen, Minimum Wages and Firm Profitability (2011)37 Riley, R and Rosazza Bondibene, C The impact of the National Minimum Wage on UK Businesses (2015)38 Riley, R and Rosazza Bondibene, C The impact of the National Minimum Wage on Firm behaviour during recession (2013)39 Authors calculations based on ONS Annual Business Survey: UK non-financial business economy foreign owned business, 2014 and 2015 (2017)40 Riley and Rosazza Bondibene, Raising the standard: Minimum wages and firm productivity (2015)41 Reed, H The Economic Impact of a £1.50/hour increase in the National Minimum Wage (Landman Economics/Unite, 2014)42 Riley and Rosazza Bondibene, Raising the standard: Minimum wages and firm productivity (2015)43 Rizov, M et al “The UK National Minimum Wage’s Impact on Productivity”, British Journal of Management, May 201644 Arulampalam et al “Training and the new minimum wage”, The Economic Journal, March 2004
45 Author’s analysis of Labour Force Survey data46 Hirsch, Kaufman and Zelenska, 2011 cited in Riley 201547 Dube, A et al Minimum Wage Shocks, Employment Flows and Labor Market Frictions (IRLE Working Paper, 2014)48 Georgiadis, A “Efficiency Wages and the Economic Effects of the Minimum Wage: Evidence from a Low-Wage Labour Market”, Oxford Bulletin of economic Statistics, July 201249 Owens, M and Kagel, J “Minimum wage restrictions and employee effort in incomplete labor markets: An experimental investigation”, Journal of Economic Behavior & Organization, March 201050 Akerlof, G and Yellen, J The Fair Wage-Effort Hypothesis and Unemployment (1990) http://blog.press.princeton.edu/wp-content/uploads/2013/10/camerer-chapter-16.pdf51 Levine, L “Cohesiveness, productivity, and wage dispersion” Journal of Economic Behavior & Organization (1991) cited in Rizov, M et al “The UK National Minimum Wage’s Impact on Productivity”, British Journal of Management, May 201652 Welfare, S Working harder, not smarter: the employee contribution to meeting the UK’s productivity challenge (The Smith Institute, 2016)53 Heery, E The Living Wage Employer Experience (Cardiff Business School, 2017)54 Thompson and Chapman, 2006 cited in Wills and Lineker, The costs and benefits of the London living wage (Queen Mary University/Trust for London, 2012)55 Greenwald and Stiglitz, 1988 cited in Wills and Lineker, The costs and benefits of the London living wage (Queen Mary University/Trust for London, 2012)56 Wills, J and Linneker, B The costs and benefits of the London living wage (Queen Mary University/Trust for London, 2012)57 See Low Pay Britain 2018 (Resolution Foundation)58 Finegold, D. and Soskice, “The failure of training in Britain: analysis and prescription”, Oxford Review of Economic Policy, 198859 Wilson, D et al Tackling the Low Skills Equilibrium: A Review of Issues and Some New Evidence (DTI/Institute for Employment Research, 2003)60 See Wilson, D et al Tackling the Low Skills Equilibrium: A Review of Issues and Some New Evidence (DTI/Institute for Employment Research, 2003)61 Manning, A Minimum Wage: Maximum Impact (Resolution Foundation, 2012)62 Georgiadis, A Is the Minimum Wage Efficient? Evidence of the Effects of the UK National Minimum Wage in the Residential Care Homes Sector (University of Bristol, 2006)63 Bushe, S et al The minimum wage, taxes and benefits: How the minimum wage interacts with the tax and benefit system (NPI, 2015)64 See for example, Reed, H The Economic Impact of Extending the Living Wage to all employees in the UK (Landman Economics, 2013), Pennycock, M and Lawton, K Beyond the Bottom Line: The challenges and opportunities of a living wage (IPPR, 2013), Reed, H The Impact of Increasing the National Minimum Wage and National Living Wage to £10 per hour (Landman Economics, 2018)65 Reed, H The Economic Impact of a £1.50/hour increase in the National Minimum Wage (Landman Economics/Unite, 2014)66 Stewart, M Individual-level Wage Changes and Spillover Effects of Minimum Wage Increases (2010, University of Warwick)67 Butcher T, Dickens, R and Manning, A The Impact of the National Minimum Wage on the Wage Distribution, a report for the Low Pay Commission (University of Sussex and the London School of Economics,2009) cited in Pennycook, M and Lawton, K Beyond the Bottom Line: The challenges and opportunities of a living wage (IPPR, 2013)68 See for example, DfT, Personal Travel Factsheet: Commuting and Business Travel (2011) or Carra, M et al Modelling the relation between income and commuting distance (Royal Society, 2016)69 The latest data from OECD Stat shows that the average low pay rate was 16% in 2016 while in the UK it was 19%. 70 There can be issues around using Labour Force Survey data on wages. To increase accuracy, hourly wage data 10% below the appropriate national minimum wage rate is excluded, which produces a slightly conservative estimate of the number paid below the appropriate national minimum wage floor. 71 https://www.livingwage.org.uk/good-for-society 72 L.E.K. Consulting, Construction in the UK Economy: The Benefits of Investment (2009) – they found for every one pound spent on house building generates £2.84 of economic activity73 Reed, H The Economic Impact of a £1.50/hour increase in the National Minimum Wage (2014)
T H E S M I T H I N S T I T U T E
33

The Smith InstituteThe Smith Institute is an independent think tank which provides a high-level forum for thought leadership and debate on public policy and politics. It seeks to engage politicians, senior decision makers, practitioners, academia, opinion formers and commentators on promoting policies for a fairer society.
If you would like to know more about the Smith Institute please write to:
The Smith InstituteSomerset HouseStrandLondonWC2R 1LA
Telephone +44 (0)20 3141 7536Email [email protected] www.smith-institute.org.ukTwitter @smith_institute
The Smith Institute is a not-for-profit company (registered as SI Research Limited, 07098225)