local government national report 2014–15€¦ · local government . national report. 2014– 15....
TRANSCRIPT
Local Government National Report
2014–15
2014–15 report on the operation of the Local Government (Financial Assistance) Act 1995


Local Government National Report
2014–15
2014–15 report on the operation of the Local Government (Financial Assistance) Act 1995

© Commonwealth of Australia, 2017
ISSN 1441-5739 ISBN 978-1-925401-92-9 January 2017/INFRA2764
Ownership of intellectual property rights in this publication Unless otherwise noted, copyright (and any other intellectual property rights, if any) in this publication is owned by the Commonwealth of Australia (referred to below as the Commonwealth).
Disclaimer The material contained in this publication is made available on the understanding that the Commonwealth is not providing professional advice, and that users exercise their own skill and care with respect to its use, and seek independent advice if necessary.The Commonwealth makes no representations or warranties as to the contents or accuracy of the information contained in this publication. To the extent permitted by law, the Commonwealth disclaims liability to any person or organisation in respect of anything done, or omitted to be done, in reliance upon information contained in this publication.
Creative Commons licence With the exception of (a) the Coat of Arms; (b) the Department of Infrastructure and Regional Development’s photos and graphics; copyright in this publication is licensed under a Creative Commons Attribution 3.0 Australia Licence. Creative Commons Attribution 3.0 Australia Licence is a standard form licence agreement that allows you to copy, communicate and adapt this publication provided that you attribute the work to the Commonwealth and abide by the other licence terms. A summary of the licence terms is available from http://creativecommons.org/licenses/by/3.0/au/deed.en. The full licence terms are available from http://creativecommons.org/licenses/by/3.0/au/legalcode. This publication should be attributed in the following way: © Commonwealth of Australia 2017, Local Government National Report 2014–15.
Use of the Coat of Arms The Department of the Prime Minister and Cabinet sets the terms under which the Coat of Arms is used. Please refer to the Department’s Commonwealth Coat of Arms and Government Branding web page http://www.dpmc.gov.au/resource-centre/government/australian-government-branding-guidelines-use-australian-government-logo-australian-government-departments-and-agencies and in particular, the Commonwealth Coat of Arms Information and Guidelines publication.
Contact us This publication is available in hard copy or PDF format. All other rights are reserved, including in relation to any Departmental logos or trademarks, which may exist. For enquiries regarding the licence and any use of this publication, please contact: Director — Publishing and Communications Section Department of Infrastructure and Regional Development GPO Box 594, Canberra ACT 2601 Australia
Email: [email protected] Website: www.infrastructure.gov.au

iii
Foreword
I present to the Australian Parliament the report on the operations of the Local Government (Financial Assistance) Act 1995 (Cth) (the Act) for 2014–15.
The Australian Government recognises that communities are better served through improving the capacity of local government to deliver services to all Australians, by enhancing the performance and efficiency of the sector. The Act, and its implementation through the Financial Assistance Grant programme, is an important means used to achieve these goals.
The Financial Assistance Grant programme is providing councils with $9.3 billion from 2014–15 to 2018–19. Under this programme, the Government provided $2.3 billion in 2014–15 through four quarterly instalments made in August, November, February and May. In addition, the first two quarterly instalments of the 2015–16 Financial Assistance Grant entitlement were brought forward and paid to jurisdictions in June 2015. This bring forward provided local governments with $1.1 billion to spend according to local needs.
The Australian Government’s 2014–15 Budget paused the indexation under the Financial Assistance Grant programme for three years from 2014–15. Local governments continue to receive their legal entitlement under the Act. There have been no cuts to the Financial Assistance Grant programme. While this was an unpopular decision, the indexation pause has contributed to the important task of budget repair. The 2016–17 Budget confirmed that indexation will resume from 1 July 2017.
The Financial Assistance Grant programme distributes funds to all local governments across Australia and a larger proportion to those councils that need it most. This report provides an account of how the states and the Northern Territory allocated the 2014–15 funding between councils through their local government grants commissions. The Australian Capital Territory also receives funding as it provides local government functions.
This report provides an assessment, based on available comparable national data, of the efforts to achieve horizontal equalisation, so all communities within a jurisdiction can access a similar range and quality of services within their jurisdiction. The report also provides information on the efficiency of councils and the services they provide to Aboriginal and Torres Strait Islander communities.
In 2014–15 it was really pleasing to see the positive impact state and territory reforms are having for local governments and their communities, including:
• New South Wales’ Stronger Councils, Stronger Communities initiative to strengthen councils and their communities, streamline legislation and cut red tape;
• The Municipal Association of Victoria’s Australian-first bond issue for the local government sector through the Local Government Funding Vehicle;
• Amendments to local government legislation in Queensland assisting voters with a disability and in the Northern Territory to streamline election requirements;

• Improved council purchase and tender practices in Western Australia; and
• Tasmania’s feasibility studies into reform opportunities for councils in the southern region of Tasmania and shared service arrangements for the nine councils in the Cradle Coast region and the eight councils in the northern region.
Local governments are the life blood of their communities and this untied funding enables local governments whether it be in metropolitan, rural or remote areas, to deliver a similar range and quality of services to their local communities.
I thank state and territory governments and the local government associations who have contributed to the preparation of this report.
Senator the Hon Fiona Nash Minister for Local Government and Territories

v
Contents
Foreword .....................................................................................................................................iii
Chapter 1 Local government in Australia ................................................................................... 1Local government functions ...................................................................................... 1Population ................................................................................................................... 2Diversity ....................................................................................................................... 2Aboriginal and Torres Strait Islander councils .......................................................... 2National representation of local government ........................................................... 2Australian Government grants to local government ................................................. 3Local government finances ........................................................................................ 4Local government expenditure .................................................................................. 6
Chapter 2 Financial Assistance Grant programme .................................................................... 9History of the arrangements ...................................................................................... 9Overview of current arrangements ..........................................................................10Determining the quantum of the grant ...................................................................10Objects of the Act .....................................................................................................11Pause on indexation .................................................................................................11Determining entitlements for 2014–15 and 2015–16 .........................................11Variations in reported grants ...................................................................................16Inter-jurisdictional distribution of grant ...................................................................17Quantum of financial assistance grant allocations ................................................20National Principles for the allocation of grants under the Act ...............................21Determining the distribution of grants within jurisdictions ....................................21Eligible bodies under the Financial Assistance Grant programme .......................23Methodologies of local government grants commissions .....................................23Internet addresses for local government grants commissions .............................24Allocations to local government in 2014–15 .........................................................24Local governing bodies on the minimum grant ......................................................27Council changes .......................................................................................................32Comparing councils ..................................................................................................32Reviews of local government grants commission methodologies .........................32Impact of local government grants commission capping policies ........................33

vi
Chapter 3 Local government efficiency and performance ......................................................35Developments in long-term financial and asset management plans ....................35Performance measures between local governing bodies ......................................36Efficiency and effectiveness reforms ......................................................................38
Chapter 4 Local government and Aboriginal and Torres Strait Islander communities ..........41Reporting requirements ...........................................................................................41Closing the Gap ........................................................................................................41State, territory and local government initiatives .....................................................42
Appendix A National Principles ...................................................................................................45
Appendix B State and territory government and local government association submissions ..49Report from the New South Wales Government .....................................................50Report from the Victorian Government ...................................................................65Report from the Municipal Association of Victoria .................................................79Report from the Queensland Government ..............................................................85Report from the Local Government Association of Queensland ...........................94Report from the Western Australian Government ................................................101Report from the Western Australia Local Government Association ....................109Report from South Australia ................................................................................. 113Report from Tasmania ........................................................................................... 132Report from the Northern Territory Government ..................................................142Report from the Local Government Association of the Northern Territory .........149Report from the Australian Capital Territory Government ................................... 152Report from the Australian Local Government Association .................................157
Appendix C Comparison of local government grants commission distribution models ...........161General purpose component .................................................................................161Revenue assessments ...........................................................................................164Local road component ...........................................................................................170
Appendix D Distribution to local governing bodies in 2014–15 ..............................................173
Appendix E Ranking of local governing bodies in 2014–15 .................................................. 195
Appendix F Australian Classification of Local Governments ...................................................217
Index of local governments ............................................................................................................221
Alphabetical index ..........................................................................................................................227

vii
List of tablesTable 1-1 Share of taxation revenue by source and sphere of government in 2014–15 .......4
Table 1-2 Local government revenue sources by jurisdiction in 2014–15 ..............................5
Table 1-3 Local government expenditure by purpose and jurisdiction in 2014–15 ................6
Table 1-4 Local government assets in 2014–15 .......................................................................7
Table 1-5 Local government liabilities and net worth and debt in 2014–15 ...........................7
Table 2-1 Actual entitlements and adjustments for 2014–15 .............................................. 13
Table 2-2 Estimated entitlements and actual cash paid for 2014–15 ................................. 14
Table 2-3 2014–15 allocations of general purpose and local road grants ........................... 18
Table 2-4 2015–16 allocation and percentage change from 2014–15 allocation .............. 19
Table 2-5 National financial assistance grant allocations from 1974–75 to 2014–15 ....... 20
Table 2-6 Distribution of local governing bodies by type and jurisdiction ............................. 23
Table 2-7 Average general purpose component per capita 2014–15 .................................. 25
Table 2-8 Average local road component per kilometre 2014–15 ........................................ 26
Table 2-9 Councils on the minimum grant by jurisdiction from 2004–05 to 2014–15 ....... 28
Table 2-10 Status of most recent major methodology reviews by state .................................. 33
Table B-1 Victorian major cost drivers and average expenditures per unit ........................... 66
Table B-2 Victorian average grant revenue .............................................................................. 67
Table B-3 Victorian derivation of the average rates ................................................................ 68
Table B-4 Standard fees and charges used for each function ............................................... 69
Table B-5 Summary of the changes in estimated general purpose entitlements ................. 70
Table B-6 Recommended natural disaster assistance grants for 2014–15 ..........................71
Table B-7 Variations in the length of local roads ..................................................................... 72
Table B-8 Average annual preservation costs for each traffic volume range ........................ 72
Table B-9 Changes in estimated local roads grant entitlements in Victoria ...........................74
Table B-10 Queensland revenue assessment model ............................................................... 87
Table B-11 Outline of Queensland expenditure assessment 2014–15 .................................. 88
Table B-12 Queensland road expenditure assessment model................................................. 89
Table B-13 Allowances given for heavy vehicles in Queensland .............................................. 89
Table B-14 Western Australia’s local road component funding ............................................. 101
Table B-15 2014–15 funding for the Western Australian Special Projects ........................... 102
Table B-16 Western Australian Special Projects – Bridges..................................................... 103
Table B-17 Disabilities applied to expenditure standards in Western Australia.................... 104
Table B-18 Data sources used in Western Australia ............................................................... 104
Table B-19 Expenditure functions in the South Australian methodology .............................. 119
Table B-20 South Australia’s calculated standards by function ............................................. 121

viii
Table B-21 Datasets used by the Tasmanian State Grants Commission ..............................135
Table B-22 Northern Territory formulae for the revenue component ..................................... 144
Table C-1 Distribution models used for general purpose grants for 2014–15 allocations .. 162
Table C-2 Scope of equalisation in commissions’ models for general purpose grants ...... 164
Table C-3 Grants treated by inclusion for 2014–15 by jurisdiction ..................................... 166
Table C-4 Allocating local road grants in 2014–15 ...............................................................171
Table D-1 Distribution to councils for 2014–15 and 2015–16 ............................................174
Table E-1 New South Wales councils ranked by grant funding 2014–15 ...........................196
Table E-2 Victorian councils ranked by grant funding 2014–15.......................................... 201
Table E-3 Queensland councils ranked by grant funding 2014–15 ....................................204
Table E-4 Western Australian councils ranked by grant funding 2014–15 ......................... 207
Table E-5 South Australian councils ranked by grant funding 2014–15 ............................ 211
Table E-6 Tasmanian councils ranked by grant funding 2014–15 ...................................... 214
Table E-7 Northern Territory councils ranked by grant funding 2014–15 .......................... 215
Table F-1 Structure of the classification system ................................................................... 218
Table F-2 Categories of local governments by state at July 2014 ....................................... 219

ix
List of figuresFigure 2-1 Determining the final factor for 2014–15 ............................................................... 15
Figure 2-2 Determining the estimated factor for 2015–16 ..................................................... 16
Figure 2-3 Local government grants commissions .................................................................. 22
Figure A-1 National Principles .................................................................................................. 46
Figure A-2 What is horizontal equalisation? ..............................................................................47
Figure B-1 Net standardised expenditure (for each function) ................................................. 67
Figure B-2 Calculation of the network cost for a single traffic volume range ......................... 73

x

1
01Local government in Australia
The Australian Government recognises that the national interest is served through improving the capacity of local government to deliver services to all Australians, by enhancing the performance and efficiency of the sector. The Local Government (Financial Assistance) Act 1995 (Cth) (the Act) is an important means used to achieve these goals.
During 2014–15, Australia had 570 local governing bodies eligible to receive funding under the Australian Government’s Financial Assistance Grant programme. The Act provides the legislative basis for this programme. These 570 local governing bodies include 560 local governments and 10 declared local governing bodies: five Indigenous local governing bodies and the Outback Areas Community Development Trust in South Australia; the Trust Account in the Northern Territory; and the Silverton and Tibooburra villages as well as Lord Howe Island in New South Wales. In addition, the Australian Capital Territory receives funding through the Financial Assistance Grant programme as it maintains both territorial and local government functions.
The Act defines the term ‘local governing bodies’ in a way that includes local governments established under state and Northern Territory legislation as well as ‘declared bodies’. The term ‘council’ is used in this report to encompass all local governing bodies, recognising its common use to denote local government.
Declared bodies are provided with funding under the Financial Assistance Grant programme and are treated as local governments for the purposes of grant allocations. Declared bodies, however, are not local governments and have different legislative obligations. Due to this difference, data provided in this report relating to local government may not be directly comparable to local governing bodies. Also, data relating to local government cannot be directly compared to that for the Australian Capital Territory, as the Australian Capital Territory performs both territorial and local government functions.
Local government functionsThe structure, powers and responsibilities of the Australian and state governments were established during federation, but local government was not one of the areas identified as a Commonwealth responsibility: instead the responsibility lies with the states and Northern Territory. The states and the Northern Territory pass the legal and regulatory framework for the creation and operation of local government. As such, there are significant differences between the systems overseeing councils.
The main roles of local government are: governance, planning, community development, service delivery, asset management and regulation.
Local governments are close to their communities and have a unique insight into local and community needs. Councils determine service provision according to local needs and the requirements of state and territory legislation.

2
Local Government National Report 2014–15
PopulationThe estimated resident population of Australia at 30 June 2015 was 23 781 200, an increase of 317 100 persons or 1.3 per cent from 30 June 2014. All states and territories experienced positive population growth for the year ending 30 June 2015. Victoria recorded the fastest growth rate (1.7 per cent), while the Northern Territory and Tasmania recorded the slowest (0.4 per cent).
The Australian Bureau of Statistics publishes information on Australia’s population through the Australian Demographic Statistics, ABS cat. no. 3101.0.
DiversityConsiderable diversity can exist in local government within and between jurisdictions. This diversity extends beyond rural–metropolitan differences. In addition to size and population, other significant differences between councils include:
• the attitudes and aspirations of local communities
• fiscal position (including revenue-raising capacity), resources and skills base
• legislative frameworks, including for example voting rights and electoral systems
• physical, economic, social and cultural environments
• range and scale of functions.
Aboriginal and Torres Strait Islander councilsAboriginal and Torres Strait Islander councils have been established under a number of different legislative frameworks. They can be established under the mainstream local government legislation of a jurisdiction or through specific legislation. These councils can also be ‘declared’ to be local governing bodies by the Australian Government Minister for Local Government on advice from a state or Northern Territory minister for the purpose of providing funding under the Financial Assistance Grant programme.
National representation of local governmentThe interests of local government are represented through a number of groups, including the Council of Australian Governments and the Australian Local Government Association.
The Council of Australian Governments (COAG) is the peak inter-governmental forum in Australia. It comprises the Prime Minister, state premiers, territory chief ministers and the Australian Local Government Association President. Established in May 1992, its role is to initiate, develop and monitor implementation of policy reforms of national significance and require co-operative action by all Australian governments.
Inter-governmental agreements are established by COAG to signify the commitment of jurisdictions to implement its decisions. In many instances, these agreements are precursors to the passage of legislation at the Commonwealth, state and territory levels. Further information is available at www.coag.gov.au.

3
01 • Local government in Australia
The Australian Local Government Association is a federation of state and Northern Territory local government associations and the Australian Capital Territory Government. The Australian Local Government Association aims to add value, at the national level, to the work of state and territory associations and their member councils. It represents the interests of local government through its participation in the Council of Australian Governments and other ministerial councils. Further information is available at alga.asn.au.
Australian Government grants to local governmentThe Australian Government supports local government through the Financial Assistance Grant programme, specific purpose payments (SPPs) and direct programme funding.
In 2014–15, the Australian Government provided $3.4 billion in untied funding under the Financial Assistance Grant programme to local governing bodies and the Australian Capital Territory Government. This includes $1.1 billion of the budgeted allocation for 2015–16, which was brought forward and paid to states and territories in June 2015. The means of distributing funding provided under the Financial Assistance Grant programme is discussed in Chapter 2. Allocations to local governing bodies for 2014–15 are provided in Appendix D.
Under the Intergovernmental Agreement on Federal Financial Relations, the Australian Government provided ongoing financial support to help the states and territories deliver services to local government through:
• national SPPs to be spent in key service delivery sectors
• National Partnership payments to support delivery of specified outputs or projects, facilitate reforms or reward those jurisdictions that deliver on nationally significant reforms
• general revenue assistance, including GST payments.
The national SPPs are distributed among the states each year in accordance with the Australian Statistician’s determination of state population shares as at 31 December of that year. An equal per capita distribution of the SPPs ensures that all Australians, regardless of the jurisdiction they live in, are provided with the same share of Commonwealth funding support for state service delivery.
Total payments to the states for specific purposes constitute a significant proportion of Commonwealth expenditure. In 2014–15, payments totalled $50 billion (Australian Government, Budget measures: Budget paper No. 3, 2015–16), an increase of $4.2 billion from 2013–14 (Australian Government, Budget measures: Budget paper No. 3, 2013–14).

4
Local Government National Report 2014–15
Local government finances
Share of taxation revenue by sphere of governmentLocal government’s taxation revenue increased by 6.1 per cent from 2013–14 to $15.8 billion in 2014–15. Local government’s taxation revenue in 2014–15 amounted to 3.5 per cent of all taxes raised across all spheres of government in Australia (Table 1-1). Taxes on property were the sole source of taxation revenue for local governments (Australian Bureau of Statistics, Taxation Revenue, Australia, 2014–15, ABS cat. no. 5506.0).
Table 1-1 Share of taxation revenue by source and sphere of government in 2014–15
Revenue sourceFederal
%State
%Local
%Total
%
Taxes on income 58.0 – – 58.0
Employers payroll taxes 0.2 5.0 – 5.0
Taxes on property – 6.6 3.5 10.1
Taxes on provision of goods and services 20.9 2.5 – 23.4
Taxes on use of goods and performance activities 1.1 2.4 – 3.5
Total 80.1 16.5 3.5 100
Notes: Figures may not add to totals due to inclusion of external territories and rounding.– represents nil or figure rounded to zero.
Source: Australian Bureau of Statistics, Taxation Revenue, Australia, 2014–15, Total Taxation Revenue, ABS cat. no. 5506.0.
Local government revenue sourcesIn 2014–15, councils raised 89.7 per cent of their own revenue, with grants and subsidies making up the remaining 10.3 per cent (Table 1-2). Individual councils have differing abilities to raise revenue. These differing abilities may not be apparent when considering national or even state averages. The differences between urban, rural and remote councils including their population size, rating base and ability to levy user charges, affects the ability of a council to raise revenue.

5
01 • Local government in Australia
Table 1-2 Local government revenue sources by jurisdiction in 2014–15
Revenue source NSW Vic Qld WA SA Tas NT Total
Own-source revenue
Taxation $m 3987 4468 3480 1996 1372 363 113 15 779
% 32.8 47.5 30.4 41.8 61.0 40.4 27.4 38.2
Sales of goods and services
$m 4217 1685 3627 1032 403 163 93 11 221
% 34.7 17.9 31.7 21.6 17.9 18.2 22.6 27.1
Interest $m 311 88 286 117 23 15 9 849
% 2.6 0.9 2.5 2.4 1.0 1.7 2.2 2.1
Other* $m 2379 2100 3184 1008 173 235 131 9210
% 19.6 22.3 27.8 21.1 7.7 26.2 31.8 22.3
Total own-source revenue 10 894 8341 10 577 4153 1971 776 346 37 059
Grants and subsidies $m 1245 1071 869 627 277 123 66 4277
% 10.3 11.4 7.6 13.1 12.3 13.7 16.0 10.3
Total grant revenue 1245 1071 869 627 277 123 66 4277
Total revenue $m 12 140 9412 11 446 4780 2248 898 412 41 336
% 100 100 100 100 100 100 100 100
Notes: Figures may not add to totals due to inclusion of external territories and rounding.* Other revenue relates to items that are not recurrent and are not generated by the ordinary operations of
the organisation, including items such as parking and other fines, rental incomes, insurance claims and revaluation adjustments.
Source: Australian Bureau of Statistics, Government Finance Statistics, Australia, 2014–15, ABS cat. no. 5512.0.
Local government revenue – taxesOne way local governments raise taxes is through rates on property. In 2014–15, 38.2 per cent of local government revenue nationally came from rates. The proportion of revenue from rates varied notably between jurisdictions – from a high of 61 per cent for South Australia to a low of 27.4 per cent for the Northern Territory – and 22.3 per cent of local government revenue was classified as ‘other’ (Table 1-2).
Rates in each state and the Northern Territory are based on a land valuation. However, methods for assessing land value differ significantly between states. New South Wales rates are based on the unimproved value of the land. In Victoria and South Australia, different valuation assessments are used depending on the type or primary use of the land.
Local government revenue – other non-grant revenue sourcesOn average, local government received 27.1 per cent of its revenue in 2014–15 from the sale of goods and services (Table 1-2).
Councils in the Northern Territory relied more on government grants and subsidies than councils in other jurisdictions, as they raised only 84 per cent of their own revenue. In the remaining states, the proportion of revenue raised from own sources ranged from 86.3 per cent for Tasmanian councils to 92.4 per cent for Queensland councils (Table 1-2).

6
Local Government National Report 2014–15
Local government expenditureLocal government expenditure is dominated by housing and community amenities (23.8 per cent) followed by transport and communication (22.5 per cent) and general public services (17.2 per cent) (Table 1-3).
Table 1-3 Local government expenditure by purpose and jurisdiction in 2014–15Expenditure NSW Vic Qld WA SA Tas NT Total
Agriculture, forestry
and fishing
$m 1 3 17 0 10 0 0 32
% – – 0.2 – 0.5 – – 0.1
Education $m 57 106 2 4 – – 4 173
% 0.6 1.4 – 0.1 – – 0.9 0.5
Fuel and energy $m – – 3 3 11 – 1 17
% – – – 0.1 0.5 – 0.2 0.1
General public services $m 1478 1256 2108 516 131 137 163 5789
% 14.3 16.5 24.0 13.9 6.5 20.2 35.7 17.2
Health $m 69 159 44 64 68 11 3 417
% 0.7 2.1 0.5 1.7 3.4 1.6 0.7 1.2
Housing and community amenities
$m 2827 1615 2153 626 538 143 90 7991
% 27.3 21.2 24.5 16.9 26.6 21.1 19.7 23.8
Mining, manufacturing and construction
$m 199 – 69 38 37 – – 342
% 1.9 – 0.8 1.0 1.8 – – 1.0
Other economic affairs $m 339 386 198 117 104 30 29 1204
% 3.3 5.1 2.3 3.2 5.1 4.4 6.3 3.6
Public debt transactions $m 246 71 341 32 35 5 1 730
% 2.4 0.9 3.9 0.9 1.7 0.7 0.2 2.2
Public order and safety $m 323 169 131 131 42 7 20 825
% 3.1 2.2 1.5 3.5 2.1 1.0 4.4 2.5
Recreation and culture $m 1474 1409 948 835 463 117 59 5304
% 14.2 18.5 10.8 22.5 22.9 17.2 12.9 15.8
Social security
and welfare
$m 417 937 45 179 127 19 34 1759
% 4.0 12.3 0.5 4.8 6.3 2.8 7.4 5.2
Transport and
communications
$m 1974 1407 2590 927 451 184 47 7580
% 19.0 18.4 29.5 25.0 22.3 27.1 10.3 22.5
Other $m 960 114 133 230 7 26 7 1477
% 9.3 1.5 1.5 6.2 0.3 3.8 1.5 4.4
Total $m 10 363 7632 8782 3703 2024 679 457 33 640
% 100 100 100 100 100 100 100 100
Notes: These figures may not add to totals due to rounding.– represents nil or figure rounded to zero.
Source: Australian Bureau of Statistics, Government Finance Statistics, Australia, 2014–15, General expenses by purpose, ABS cat. no. 5512.0.
Assets and liabilitiesIn 2014–15, local government in Australia had a net worth of $399.2 billion, with assets worth $419.1 billion and liabilities worth $19.9 billion (Table 1-4 and Table 1-5).
On a state basis only councils in South Australia had a net debt position as at 30 June 2014, while all the other states had a net surplus (Table 1-5).

7
01 • Local government in Australia
Table 1-4 Local government assets in 2014–15
Assets$m
NSW Vic Qld WA SA Tas NT Total
$m $m $m $m $m $m $m $m
Fina
ncia
l
Cash and deposits 1837 1464 3841 2809 47 368 167 10 533
Advances paid – 2 – 2 30 1 – 35
Investments, loans and placements 7367 1641 2346 273 141 29 82 11 880
Other non-equity assets 1263 858 1087 321 134 44 24 3731
Equity 63 47 5382 380 62 1566 – 7502
Total 10 532 4013 12 656 3786 414 2008 273 33 682
Non
-fina
ncia
l Land and fixed assets 140 922 78 060 93 682 38 716 22 523 7424 2265 383 592
Other non-financial assets 768 826 138 72 2 25 62 1,892
Total 141 690 78 886 93 820 38 788 22 525 7449 2327 385 484
Total assets 152 222 82 898 106 476 42 574 22 939 9457 2600 419 166
Notes: These figures may not add to totals due to rounding.– represents nil or figure rounded to zero.
Source: Australian Bureau of Statistics, Government Finance Statistics, Australia, 2014–15, ABS cat. no. 5512.0.
Table 1-5 Local government liabilities and net worth and debt in 2014–15
Liabilities
NSW Vic Qld WA SA Tas NT Total
$m $m $m $m $m $m $m $m
Deposits held 60 197 6 43 188 9 – 502
Advances received 11 4 – 1 7 – – 22
Borrowing 3577 1191 5841 673 438 84 9 11 813
Unfunded superannuation liability and other employee entitlements
1352 736 641 282 181 66 25 3282
Other provisions 14 76 – 5 3 25 3 127
Other non-equity liabilities
1347 780 1186 468 264 70 59 4175
Total liabilities 6360 2985 7675 1472 1080 253 96 19 921
Net worth 145 862 79 914 98 801 41 102 21 859 9204 2504 399 245
Net debta –5557 –1716 –340 –2368 414 –304 –241 –10 112
Net financial worthb
4172 1028 4982 2314 –666 1755 178 13 761
Notes: These figures may not add to totals due to rounding.a Net debt figures are memorandum items for comparison only. They do not derive from the above
calculations. Net debt is the sum of selected financial liabilities, deposits held, advances received, government securities, loans, and other borrowing; less the sum of selected financial assets, cash and deposits; advances paid; and investments, loans and placements. Net debt is a common measure of the strength of a government’s financial position.
b Net financial worth is the difference between total financial assets and total liabilities.– represents nil or figure rounded to zero.
Source: Australian Bureau of Statistics, Government Finance Statistics, Australia, 2014–15, ABS cat. no. 5512.0.


9
02Financial Assistance Grant programme
History of the arrangementsFinancial Assistance Grant programme funding is provided under the Local Government (Financial Assistance) Act 1995 (Cth) (the Act), which replaced the Local Government (Financial Assistance) Act 1986 (Cth) from 1 July 1995.
Funding from the Australian Government to local government began in 1974–75 as determined by the Commonwealth Grants Commission on an equalisation basis.
The Local Government (Financial Assistance) Act 1986 (Cth) introduced a new indexation formula which included the Consumer Price Index and population growth. In addition, local government grants commissions were introduced to determine distributions to individual councils taking into account horizontal equalisation and a 30 per cent minimum grant principle.
The 1990 Special Premiers’ Conference determined that a local road component would be provided in addition to the general purpose component from 1 July 1991. The untied local road component was introduced to replace specific purpose funding for local roads provided under the Australian Land Transport Development Act 1988 (Cth). The local road formula, agreed to by all Premiers, is intended to help local government with the cost of maintaining local roads.
The Act introduced the untied local road component and formalised a set of National Principles. Each local government grants commission must consider the National Principles when determining allocations to local governing bodies. Further information on the National Principles is provided in Appendix A.
The objectives of the general purpose component include improving the capacity of local governments to provide their communities with an equitable level of services and increasing the efficiency and effectiveness of local government. The objective of the identified road component includes distribution for road expenditure and road asset preservation, on the basis of the relative needs of each local governing body.
Both components are paid quarterly to the states and territories to be passed on to local government without delay. The Financial Assistance Grant programme is untied in the hands of local government, which means local governments are free to spend the funding according to local priorities.
Table 2-5 shows funding under the Financial Assistance Grant programme since the introduction of the general purpose component in 1974–75 and the local road component in 1991–92.

10
Local Government National Report 2014–15
Overview of current arrangementsThe following arrangements operated when determining the 2014–15 funding distribution under the Financial Assistance Grant programme to local government:
• Before the start of the financial year, the Australian Government estimated the quantum of general purpose and local road components that local government was entitled to nationally. This is equal to the national grant entitlement for the previous financial year multiplied by the estimated escalation factor of changes in population and the Consumer Price Index.
• States and territories were advised of their estimated quantum of general purpose and local road components, calculated in accordance with the Act.
• Local government grants commissions in each state and the Northern Territory recommended to their local government minister the distribution of the general purpose and local road components among local governing bodies in their jurisdiction. The Australian Capital Territory does not have a local government grants commission, because the territory government provides local government services in lieu of having a system of local government.
• State and Northern Territory local government ministers forwarded the recommendations of the local government grants commission in their jurisdiction to the Australian Government Minister (the Minister) responsible for local government.
• When satisfied that all legislative requirements have been met, the Minister approves payment of the recommended allocations to local governing bodies in that jurisdiction.
• The Australian Government pays the grant in quarterly instalments to the states and territories, which, without undue delay, pass them on to local government as untied grants.
• When updated changes in the Consumer Price Index and population become available toward the end of the financial year, an actual escalation factor is calculated and the actual grant entitlement is determined.
• Any difference between the estimated and actual entitlements is combined with the estimated entitlement in the next year to determine that year’s cash payment. This is referred to as the adjustment.
Determining the quantum of the grantSection 8 of the Act specifies the formula that the Treasurer of the Commonwealth (the Treasurer) is to apply each year to calculate the escalation factors used to determine the funding under the Financial Assistance Grant programme. The escalation factors are based on changes in the Consumer Price Index and population.
The Act provides the Treasurer with discretion to increase or decrease the escalation factors in special circumstances. When applying this discretion, the Treasurer is required to have regard to the objects of the Act (below) and any other matter the Treasurer thinks relevant. The same escalation factor is applied to both the general purpose and local road components.

11
02 • Financial Assistance Grant programme
Objects of the ActSection 3(2) of the Act states the objects as follows.
The Parliament of Australia wishes to provide financial assistance to the states for the purposes of improving:
(a) the financial capacity of local governing bodies; and
(b) the capacity of local governing bodies to provide their residents with an equitable level of services; and
(c) the certainty of funding for local governing bodies; and
(d) the efficiency and effectiveness of local governing bodies; and
(e) the provision by local governing bodies of services to Aboriginal and Torres Strait Islander communities.
Pause on indexationIn the 2014–15 Budget, the Australian Government announced that the indexation applied to the Financial Assistance Grant programme would be paused for three years (2014–15 to 2016–17). Funding under the Financial Assistance Grant programme will remain at $2.3 billion each year from 2014–15 to 2016–17 as a result of this measure. State and territory allocations will continue to fluctuate in line with changes in population estimates provided annually by the Australian Bureau of Statistics.
The impact of the pause will not be known until the end of the pause period. However, while the funding pool will remain constant, fluctuations in populations will affect state and territory allocations each year. In line with the objectives of the Act, funding continues to be provided to all councils including minimum grant councils. Local government grants commissions continue to apply the horizontal equalisation principle that supports needier councils, including rural and remote councils.
Determining entitlements for 2014–15 and 2015–16Calculation of the 2014–15 actual entitlement and the 2015–16 estimated entitlement using the final escalation factor (the final factor) and estimated escalation factor (the estimated factor) respectively are set out in Table 2-1 and Table 2-2.
The estimated entitlement for 2014–15 was $2.3 billion. This comprised $1.6 billion under the general purpose component and $703.4 million under the identified local road component (Table 2-1).
The 2014–15 final factor was calculated using the Consumer Price Index for the year ending March 2015 and revised population growth figures to December 2013.
In June 2015, the former Deputy Prime Minister and Minister for Infrastructure and Regional Development, the Hon Warren Truss MP, announced the Australian Government’s decision to bring forward two quarters of the 2015–16 estimate into 2014–15. This resulted in payments of $1.1 billion to jurisdictions for immediate distribution to local government. This early payment was made to ensure councils were able to continue to provide important

12
Local Government National Report 2014–15
services to their communities and have early access to funding for critical infrastructure projects. The $1.1 billion included a general purpose component of $792.6 million and a local road component of $351.7 million. The brought forward payment was provided for under amendments made to the Act in 2009. Brought forward payments have been provided in each Budget from 2009–10 to 2013–14.
The final factor for 2014–15 of 2.9797 resulted in the 2014–15 actual entitlement being $3.4 billion, comprising $2.4 billion under the general purpose component and $1.1 billion under the identified local road component (Table 2-1). As the 2014–15 actual entitlement was more than the 2014–15 estimated entitlement, a negative adjustment of $35 683 was applied to the estimated entitlement in the following year (2015–16). The negative adjustment of $35 683 from 2014–15 to 2015–16 is a result of rounding inherent to the Treasurer’s Determination. As required under the Act, the Treasurer’s Determination is calculated to four decimal places. A minor adjustment is expected to occur in each year affected by the indexation pause.
The 2015–16 estimated factor was calculated using the projected Consumer Price Index for the year ending March 2016 and revised population growth figures to December 2014.
The estimated factor for 2015–16 of 0.3333 resulted in the estimated entitlement for 2015–16 being $1.1 billion, comprising $792.5 million under the general purpose component and $351.7 million under the local road component (Table 2-2).
Under the Act, population estimates are applied to the estimated and final entitlements. As such, jurisdictions experiencing a negative population change from one year to the next may receive a declining share of the general purpose component. In 2014–15, the following jurisdictions experienced a decreasing population share: Queensland, Western Australia, South Australia, Tasmania, Northern Territory and the Australia Capital Territory.

13
02 • Financial Assistance Grant programme
Tabl
e 2-
1 Ac
tual
ent
itlem
ents
and
adj
ustm
ents
for 2
014–
15
2013
–14
actu
al e
nti
tlem
ent
2014
–15
fin
al f
acto
r20
14–1
5 ac
tual
en
titl
emen
t20
14–1
5 es
tim
ated
en
titl
emen
t20
14–1
5 ea
rly
pay
men
t20
14–1
5 ad
just
men
t
$$
$$
$
Gen
eral
pur
pos
e79
8 02
6 42
9x
2.97
97=
2 37
7 87
9 35
0le
ss1
585
269
379
less
792
634
689
=–2
4 71
7
Loca
l roa
d35
4 10
7 81
2x
2.97
97=
1 05
5 13
5 04
6le
ss70
3 43
0 67
5le
ss35
1 71
5 33
8=
–10
966
Tota
l1
152
134
241
x2.
9797
=3
433
014
396
less
2 28
8 70
0 05
4le
ss1
144
350
027
=–3
5 68
3
Gen
eral
pur
po
se31
Dec
201
3 p
op
ulat
ion
NS
W25
6 09
2 08
37
465
497
761
839
141
less
507
579
529
less
253
601
909
=65
7 70
3
Vic
197
872
181
5 79
0 99
059
0 57
7 27
9le
ss39
3 72
9 71
1le
ss19
7 28
7 31
9=
–439
751
Qld
160
552
017
4 69
0 91
0 4
78 4
22 4
02le
ss31
8 93
5 21
5le
ss15
9 33
8 87
3=
148
315
WA
86 3
33 2
972
550
874
259
422
206
less
173
434
056
less
87 2
27 8
61=
–1 2
39 7
11
SA
57 8
69 5
301
677
250
171
177
435
less
114
036
315
less
56 6
49 1
90=
491
930
Tas
17 8
41 1
3251
3 95
552
458
632
less
34 9
43 8
27le
ss17
257
300
=25
7 50
5
NT
8 30
5 09
224
2 57
324
842
383
less
16 4
92 5
51le
ss8
269
069
=80
763
AC
T13
161
097
384
147
39 1
39 8
72le
ss26
118
175
less
13 0
03 1
68=
18 5
29
Tota
l79
8 02
6 42
923
316
196
2 37
7 87
9 35
0le
ss1
585
269
379
less
792
634
689
=–2
4 71
7
Loca
l ro
ad20
14–1
5 fi
nal f
acto
r
NS
W10
2 73
7 78
8x
2.97
97=
306
127
787
less
204
087
313
less
102
043
656
=–3
182
Vic
73 0
04 2
23x
2.97
97=
217
530
683
less
145
021
962
less
72 5
10 9
81=
–2 2
60
Qld
66 3
46 8
30x
2.97
97=
197
693
649
less
131
797
136
less
65 8
98 5
68=
–2 0
55
WA
54 1
43 6
05x
2.97
97=
161
331
700
less
107
555
584
less
53 7
77 7
92=
–167
5
SA
19 4
60 6
22x
2.97
97=
57 9
86 8
15le
ss38
658
279
less
19 3
29 1
40=
–604
Tas
18 7
65 2
11x
2.97
97=
55 9
14 6
99le
ss37
276
854
less
18 6
38 4
27=
–582
NT
8 29
4 91
3x
2.97
97=
24 7
16 3
52le
ss16
477
739
less
8 23
8 87
0=
–257
AC
T11
354
620
x2.
9797
=33
833
361
less
22 5
55 8
08le
ss11
277
904
=–3
51
Tota
l35
4 10
7 81
2x
2.97
97=
1 05
5 13
5 04
6le
ss70
3 43
0 67
5le
ss35
1 71
5 33
8=
–10
966
Not
e:
Brin
g fo
rwar
d am
ount
s ar
e in
clud
ed in
the
year
in w
hich
they
are
ent
itled
. So
urce
: D
epar
tmen
t of I
nfra
stru
ctur
e an
d Re
gion
al D
evel
opm
ent.

14
Local Government National Report 2014–15
Tabl
e 2-
2 Es
timat
ed e
ntitl
emen
ts a
nd a
ctua
l cas
h pa
id fo
r 201
4–15
2014
–15
actu
al e
nti
tlem
ent
2015
–16
esti
mat
ed f
acto
r20
15–1
6 es
tim
ated
en
titl
emen
t20
14–1
5 ad
just
men
t20
14–1
5 ea
rly
pay
men
t20
15–1
6 ac
tual
cas
h p
ayab
le
$$
$$
$
Gen
eral
pur
pos
e2
377
879
350
x0.
3333
=79
2 54
7 18
8p
lus
–24
717
plu
s79
2 63
4 68
9=
1 58
5 15
7 16
0
Loca
l roa
d1
055
135
046
x0.
3333
=35
1 67
6 51
1p
lus
–10
966
plu
s35
1 71
5 33
8=
703
380
883
Tota
l3
433
014
396
x0.
3333
=1
144
223
699
plu
s–3
5 68
3p
lus
1 14
4 35
0 02
7=
2 28
8 53
8 04
3
Gen
eral
pur
po
se31
Dec
201
4 p
op
ulat
ion
NS
W76
1 83
9 14
17
565
497
253
828
098
plu
s65
7 70
3p
lus
253
601
909
=50
8 08
7 71
0
Vic
590
577
279
5 88
6 43
619
7 49
4 34
2p
lus
–439
751
plu
s19
7 28
7 31
9=
394
341
910
Qld
478
422
402
4 75
0 51
315
9 38
3 27
3p
lus
148
315
plu
s15
9 33
8 87
3=
318
870
461
WA
259
422
206
2 58
1 25
086
602
873
plu
s–1
239
711
plu
s87
227
861
=17
2 59
1 02
3
SA
171
177
435
1 69
1 50
356
751
194
plu
s49
1 93
0p
lus
56 6
49 1
90=
113
892
314
Tas
52 4
58 6
3251
5 23
517
286
521
plu
s25
7 50
5p
lus
17 2
57 3
00=
34 8
01 3
26
NT
24 8
42 3
8324
4 26
58
195
274
plu
s80
763
plu
s8
269
069
=16
545
106
AC
T39
139
872
387
640
13 0
05 6
13p
lus
18 5
29p
lus
13 0
03 1
68=
26 0
27 3
10
Tota
l2
377
879
350
23 6
22 3
3979
2 54
7 18
8p
lus
–24
717
plu
s79
2 63
4 68
9=
1 58
5 15
7 16
0
Loca
l ro
ad20
15–1
6 es
tim
ated
fac
tor
NS
W30
6 12
7 78
7x
0.33
33=
102
032
391
plu
s–3
182
plu
s10
2 04
3 65
6=
204
072
865
Vic
217
530
683
x0.
3333
=72
502
977
plu
s–2
260
plu
s72
510
981
=14
5 01
1 69
8
Qld
197
693
649
x0.
3333
=65
891
293
plu
s–2
055
plu
s65
898
568
=13
1 78
7 80
6
WA
161
331
700
x0.
3333
=53
771
856
plu
s–1
675
plu
s53
777
792
=10
7 54
7 97
3
SA
57 9
86 8
15x
0.33
33=
19 3
27 0
06p
lus
–604
plu
s19
329
140
=38
655
542
Tas
55 9
14 6
99x
0.33
33=
18 6
36 3
69p
lus
–582
plu
s18
638
427
=37
274
214
NT
24 7
16 3
52x
0.33
33=
8 23
7 96
0p
lus
–257
plu
s8
238
870
=16
476
573
AC
T33
833
361
x0.
3333
=11
276
659
plu
s–3
51p
lus
11 2
77 9
04=
22 5
54 2
12
Tota
l1
055
135
046
x0.
3333
=35
1 67
6 51
1p
lus
–10
966
plu
s35
1 71
5 33
8=
703
380
883
Not
e:
Brin
g fo
rwar
d am
ount
s ar
e in
clud
ed in
the
year
in w
hich
they
are
ent
itled
. | S
ourc
e: D
epar
tmen
t of I
nfra
stru
ctur
e an
d Re
gion
al D
evel
opm
ent.

15
02 • Financial Assistance Grant programme
Figure 2-1 Determining the final factor for 2014–15Under section 8 of the Local Government (Financial Assistance) Act 1995 (Cth) (the Act), the unadjusted factor for 2014–15 was calculated as follows:
Unadjusted factor =Population of Australia at 31 Dec 2013
x
Consumer Price Index at March 2015
Population of Australia at 31 Dec 2012 Consumer Price Index at March 2014
That is:
Unadjusted factor =23 292 176
x106.8
= 1.029722 920 065 105.4
In order to account for the Australian Government’s decision to pause indexation for the three years from 1 July 2014 and the Australian Government’s decision to bring forward the first two quarter payments in 2015–16 to the 2014–15 financial year, the unadjusted factor was adjusted in accordance with section 8(1)(c) of the Act as follows:
Adjustment factor =
2014–15 adjustment amount + 2015–16 adjustment amount
2013–14 final entitlement
x1
Unadjusted factor
That is:
Adjustment factor =
2 288 700 054 + 1 144 350 027x
1= 2.8938
1 152 134 240 1.0297
Therefore, the final factor for 2014–15 was determined through the multiplication of the unadjusted factor and the adjustment factor as follows:
Final factor = unadjusted factor (1.0297) x adjustment factor (2.8938) = 2.9797

16
Local Government National Report 2014–15
Figure 2-2 Determining the estimated factor for 2015–16Under section 8 of the Local Government (Financial Assistance) Act 1995 (Cth) (the Act), the unadjusted factor for 2015–16 was calculated as follows:
Unadjusted factor =Population of Australia at 31 Dec 2014
x
Consumer Price Index at March 2016
Population of Australia at 31 Dec 2013 Consumer Price Index at March 2015
That is:
Unadjusted factor =23 622 339
x109.8
= 1.042723 292 176 106.8
In order to account for the Australian Government’s decision to pause indexation for the three years from 1 July 2014 and the Australian Government’s decision to bring forward the first two quarterly payments in 2015–16 to the 2014–15 financial year, the unadjusted factor was adjusted, in accordance with paragraph 8(1)(c) of the Act, as follows:
Adjustment factor =
2015–16 adjustment amount - 2014–15 adjustment amount
2014–15 final entitlement
x1
Unadjusted factor
That is:
Adjustment factor =
2 288 700 054 – 1 144 350 027x
1= 0.3197
3 433 050 081 1.0427
Therefore, the estimated factor for 2015–16 was determined through the multiplication of the unadjusted factor and the adjustment factor as follows:
Estimated factor = unadjusted factor (1.0427) x adjustment factor (0.3197) = 0.3333
Variations in reported grantsAt the beginning of each financial year, the quantum of the grant to local government is estimated using the estimated factor, which is based on forecasts of the Consumer Price Index and population changes for the year.
At the end of each financial year, the actual or final grant for local government is calculated using the final factor, which is based on updated Consumer Price Index and population figures.
Invariably there is a difference between the estimated and actual grant entitlements due to the differences in the estimated and final factors. This difference is combined with the estimated entitlement in the following financial year to provide the actual cash payment for the next year.

17
02 • Financial Assistance Grant programme
Consequently, there are three ways in which funding provided under the Financial Assistance Grant programme can be reported: an estimated entitlement, an actual entitlement and the actual cash paid.
Inter-jurisdictional distribution of grantThe Act specifies that the general purpose component is to be divided among the jurisdictions on a per capita basis. The distribution is based on the Australian Bureau of Statistics’ estimate of each jurisdiction’s and Australia’s population as at 31 December of the previous year.
By contrast, each jurisdiction’s share of the local road component is fixed. The distribution is based on shares determined from the former tied grant arrangements and agreed by all Premiers at the 1990 Special Premiers’ Conference (see ‘History of the Interstate Distribution of Local Road Grants’ in the 2001–02 Local Government National Report). Therefore, the local road share for each state and territory is determined by multiplying the previous year’s funding by the estimated factor as determined by the Treasurer.
Table 2-3 shows the allocation of the actual entitlement for 2014–15 among jurisdictions. Table 2-4 shows the allocation of the estimated entitlement for 2015–16 among jurisdictions and the percentage change in the grant from 2014–15 to 2015–16.

18
Local Government National Report 2014–15
Tabl
e 2-
3 20
14–1
5 al
loca
tions
of g
ener
al p
urpo
se a
nd lo
cal r
oad
gran
ts
Sta
te
Gen
eral
pu
rpos
e (G
P)
Loca
l roa
d (L
R)
Tota
l gra
nt
GP
act
ual
en
titl
emen
t $%
of
tota
l G
P p
ool
31 D
ec 2
013
pop
ula
tion
$ p
er c
apit
a
LR a
ctu
al
enti
tlem
ent $
% o
f LR
poo
lK
ilom
etre
s%
of
LR
len
gth
$ p
er k
m
Tota
l act
ual
en
titl
emen
t $%
of
tota
l g
ran
t
NS
W76
1 83
9 14
132
.04
7 46
5 49
710
2.05
306
127
787
29.0
114
6 18
422
.08
2094
.13
1 06
7 96
6 92
831
.11
Vic
590
577
279
24.8
45
790
990
101.
98 2
17 5
30 6
8320
.62
129
880
19.6
116
74.8
680
8 10
7 96
223
.54
Qld
478
422
402
20.1
24
690
910
101.
9919
7 69
3 64
918
.74
153
207
23.1
412
90.3
767
6 11
6 05
119
.69
WA
259
422
206
10.9
12
550
874
101.
7016
1 33
1 70
015
.29
127
797
19.3
012
62.4
142
0 75
3 90
612
.26
SA
171
177
435
7.20
1 67
7 25
010
2.06
57 9
86 8
155.
5077
924
11.7
774
4.15
229
164
250
6.68
Tas
52 4
58 6
322.
2151
3 95
510
2.07
55 9
14 6
995.
3014
260
2.15
3921
.09
108
373
331
3.16
NT
24 8
42 3
831.
0424
2 57
310
2.41
24 7
16 3
522.
3412
957
1.96
1907
.57
49
558
735
1.44
AC
T39
139
872
1.65
384
147
101.
89 3
3 83
3 36
13.
21n/
a–
–72
973
233
2.13
Tota
l2
377
879
350
100.
0023
316
196
*10
1.98
1 05
5 13
5 04
610
0.00
662
208
100.
0015
93.3
6 3
433
014
396
100.
00
Not
es:
Aust
ralia
n Bu
reau
of S
tatis
tics,
Aus
tralia
n D
emog
raph
ic S
tatis
tics,
Dec
embe
r 201
2, A
BS c
at.n
o. 3
101.
0.*
Excl
udes
oth
er te
rrito
ries
com
pris
ing
Jerv
is B
ay T
errit
ory,
Chris
tmas
Isla
nd a
nd th
e Co
cos
(Kee
ling)
Isla
nds.
Sour
ce:
Dep
artm
ent o
f Inf
rast
ruct
ure
and
Regi
onal
Dev
elop
men
t.

19
02 • Financial Assistance Grant programme
Tabl
e 2-
4 20
15–1
6 al
loca
tion
and
perc
enta
ge c
hang
e fro
m 2
014–
15 a
lloca
tion
Sta
te
Gen
eral
pu
rpos
e (G
P)
Loca
l roa
d (L
R)
Tota
l gra
nt
GP
es
tim
ated
en
titl
emen
t $
%
chan
ge
from
20
14–1
5 ac
tual
g
ran
t
% o
f to
tal
GP
p
ool
31 D
ec
2014
p
opu
lati
on$
per
ca
pit
a
LR
esti
mat
ed
enti
tlem
ent $
%
chan
ge
from
20
14–1
5 ac
tual
g
ran
t%
of
LR p
ool
Kilo
met
res
% o
f LR
le
ng
th$
per
km
Tota
l 201
3–14
es
tim
ated
en
titl
emen
t $
%
chan
ge
from
20
14–1
5 ac
tual
g
ran
t
% o
f to
tal
gra
nt
NS
W25
3 82
8 09
8 –
66.6
832
.03
7 56
5 49
733
.55
102
032
391
–66.
6729
.01
146
184
22.0
869
7.97
355
860
489
–66.
6831
.10
Vic
197
494
342
–66.
5624
.92
5 88
6 43
633
.55
72 5
02 9
77–6
6.67
20.6
212
9 88
019
.61
558.
2326
9 99
7 31
9–6
6.59
23.6
0
Qld
159
383
273
–66.
6920
.11
4 75
0 51
333
.55
65
891
293
–66.
6718
.74
153
207
23.1
443
0.08
225
274
566
–66.
6819
.69
WA
86 6
02 8
73–6
6.62
10.9
32
581
250
33.5
553
771
856
–66.
6715
.29
127
797
19.3
042
0.76
140
374
729
–66.
6412
.27
SA
56 7
51 1
94–6
6.85
7.16
1 69
1 50
333
.55
19 3
27 0
06–6
6.67
5.50
77 9
2411
.77
248.
0276
078
200
–66.
806.
65
Tas
17 2
86 5
21–6
7.05
2.18
515
235
33.5
518
636
369
–66.
675.
3014
260
2.15
1306
.90
35
922
890
–66.
853.
14
NT
8 19
5 27
4–6
7.01
1.03
244
265
33.5
58
237
960
–66.
672.
3412
957
1.96
635.
7916
433
234
–66.
841.
44
AC
T13
005
613
–66.
771.
6438
7 64
033
.55
11 2
76 6
59–6
6.67
3.21
––
– 2
4 28
2 27
2–6
6.72
2.12
Tota
l79
2 54
7 18
8–6
6.67
100.
0023
622
339
*33
.55
351
676
511
–66.
6710
0.00
662
208
100.
0053
1.07
1 14
4 22
3 69
9–6
6.67
100.
00
Not
es:
Aust
ralia
n Bu
reau
of S
tatis
tics,
Aus
tralia
n D
emog
raph
ic S
tatis
tics,
Dec
embe
r 201
3, A
BS c
at.n
o. 3
101.
0.*
Excl
udes
oth
er te
rrito
ries
com
pris
ing
Jerv
is B
ay T
errit
ory,
Chris
tmas
Isla
nd a
nd th
e Co
cos
(Kee
ling)
Isla
nds.
Sour
ce:
Dep
artm
ent o
f Inf
rast
ruct
ure
and
Regi
onal
Dev
elop
men
t.

20
Local Government National Report 2014–15
Quantum of financial assistance grant allocationsTable 2-5 shows cash payments under the Financial Assistance Grant programme since the introduction of the general purpose component in 1974–75 and the identified local road component in 1991–92.
Table 2-5 National financial assistance grant allocations from 1974–75 to 2014–15Year General purpose ($) Local road ($) Total ($)1974–75 56 345 000 n/a 56 345 0001975–76 79 978 000 n/a 79 978 0001976–77 140 070 131 n/a 140 070 1311977–78 165 327 608 n/a 165 327 6081978–79 179 426 870 n/a 179 426 8701979–80a 222 801 191 n/a 222 801 1911980–81 302 226 347 n/a 302 226 3471981–82 352 544 573 n/a 352 544 5731982–83 426 518 330 n/a 426 518 3301983–84 461 531 180 n/a 461 531 1801984–85 488 831 365 n/a 488 831 3651985–86 538 532 042 n/a 538 532 0421986–87 590 427 808 n/a 590 427 8081987–88 636 717 377 n/a 636 717 3771988–89 652 500 000 n/a 652 500 0001989–90 677 739 860 n/a 677 739 860
1990–91 699 291 988 n/a 699 291 9881991–92b 714 969 488 303 174 734 1 018 144 2221992–93c 730 122 049 318 506 205 1 048 628 2541993–94 737 203 496 322 065 373 1 059 268 8691994–95 756 446 019 330 471 280 1 086 917 2991995–96d 806 748 051 357 977 851 1 164 725 9021996–97 833 693 434 369 934 312 1 203 627 7461997–98 832 859 742 369 564 377 1 202 424 1191998–99 854 180 951 379 025 226 1 233 206 1771999–2000 880 575 142 390 737 104 1 271 312 2462000–01 919 848 794 408 163 980 1 328 012 7742001–02 965 841 233 428 572 178 1 394 413 4112002–03 1 007 855 328 447 215 070 1 455 070 3982003–04 1 039 703 554 461 347 062 1 501 050 6162004–05 1 077 132 883 477 955 558 1 555 088 4412005–06 1 121 079 905 497 456 144 1 618 536 0492006–07 1 168 277 369 518 399 049 1 686 676 4182007–08 1 234 986 007 547 999 635 1 782 985 6422008–09 1 621 289 630 719 413 921 2 340 703 5512009–10 1 378 744 701 611 789 598 1 990 534 3002010–11 1 446 854 689 642 012 005 2 088 866 6942011–12 1 856 603 939 823 829 803 2 680 433 7422012–13 1 525 571 456 676 940 950 2 202 512 4062013–14 798 026 429 354 107 812 1 152 134 2412014–15 2 377 879 350 1 055 135 046 3 433 014 396Total 33 357 303 309 11 811 794 273 45 169 097 583
Notes: a Grants to the Northern Territory under the programme commenced in 1979–80, with the initial allocation being $1 061 733.b Before 1991–92, local road funding was provided as tied grants under different legislation (n/a = not applicable).c In 1992–93, part of the road grant entitlement of the Tasmanian and Northern Territory governments was
reallocated to local government in these jurisdictions.d Grants to the Australian Capital Territory under the programme commenced in 1995–96.NB: All funding represents actual entitlements.
Source: Department of Infrastructure and Regional Development.

21
02 • Financial Assistance Grant programme
National Principles for the allocation of grants under the ActThe Act requires the Australian Government Minister (the Minister) to formulate National Principles in consultation with state and territory ministers for local government and a body or bodies representative of local government. The National Principles provide guidance for the states and the Northern Territory in allocating funding from the Financial Assistance Grant programme to local governing bodies within their jurisdiction. The National Principles are set out in full at Appendix A.
Determining the distribution of grants within jurisdictionsUnder sections 11 and 14 of the Act, funding under the Financial Assistance Grant programme can only be paid to jurisdictions (other than the Australian Capital Territory) that have established a local government grants commission. The Australian Capital Territory does not have a local government grants commission because its government provides municipal services instead of the territory having a system of local government.
Local government grants commissions make recommendations, in accordance with the National Principles, on the quantum of funding allocated to local governing bodies under the Financial Assistance Grant programme. The state and Northern Territory governments determine the membership of, and provide resources for, their respective local government grants commissions. Further detail on the local government grants commissions is provided in Figure 2-3.
Once each local government grants commission determines the recommended allocations to local governing bodies in its jurisdiction under the Financial Assistance Grant programme, the relevant state or Northern Territory minister recommends the allocations to the Minister for approval. The Act requires the Minister to be satisfied that the state and the Northern Territory have adopted the recommendations of their local government grants commission and that they are in accordance with the Act and the National Principles.
Section 15 of the Act requires that, as a condition for paying funding under the Financial Assistance Grant programme, the states and the Northern Territory must provide the funding to local government without undue delay and without conditions, thus giving local government discretion to use the funds for local priorities.
Further, the Act requires the state and Northern Territory treasurers to give the Minister a statement detailing payments made to local governing bodies during the previous financial year, as soon as practicable after 30 June each year, including the date the payments were made. A certificate from their respective Auditor-General certifying that the statement is correct is also required.
Funding under the Financial Assistance Grant programme is paid in equal quarterly instalments. The first payment for each financial year is paid as soon as statutory conditions are met. One of the requirements of the Act is that the first payment cannot be made before 15 August.

22
Local Government National Report 2014–15
Figure 2-3 Local government grants commissionsSection 5 of the Local Government (Financial Assistance) Act 1995 (Cth) (the Act) specifies the criteria a body must satisfy to be recognised as a local government grants commission. These criteria state that:
• the body is established by a law of a state or the Northern Territory
• the principal function of the body is to make recommendations to the state or territory government about the provision of financial assistance to local governing bodies in the state or territory
• the Australian Government Minister is satisfied that the body includes at least two people who are or have been associated with local government in the state or territory, whether as members of a local governing body or otherwise.
Section 11 of the Act requires local government grants commissions to:
• hold public hearings in connection with their recommended grant allocations
• permit or require local governing bodies to make submissions in relation to the recommendations
• make their recommendations in accordance with the National Principles.
Legislation establishing local government grants commissions in each state and the Northern Territory:
New South Wales Local Government Act 1993Victoria Victoria Grants Commission Act 1976Queensland Local Government Act 2009Western Australia Local Government Grants Act 1978South Australia South Australian Local Government Grants Commission Act 1992Tasmania State Grants Commission Act 1976Northern Territory Local Government Grants Commission Act 1986

23
02 • Financial Assistance Grant programme
Eligible bodies under the Financial Assistance Grant programmeAll local governing bodies constituted under state and territory legislation are automatically local governing bodies. In addition, section 4(2) of the Act provides for:
a body declared by the Minister, on the advice of the relevant state minister, by notice published in the Gazette, to be a local governing body for the purposes of this Act.
In addition to the Australian Capital Territory, 570 local governing bodies, including 10 declared local governing bodies made eligible under section 4(2)(b), received funding under the Financial Assistance Grant programme in 2014–15, as at 1 July 2014.
Table 2-6 Distribution of local governing bodies by type and jurisdiction
Type NSW Vic Qld WA SAc Tas NTd Total
Local governmentsa 152 79 77 138 68 29 17 560
Declared local governing bodiesb 3 – – – 6 – 1 10
Total 155 79 77 138 74 29 18 570
Notes: a Local governing bodies, eligible under section 4(2)(a) of the Local Government (Financial Assistance) Act 1995 (Cth), as they are constituted under state or territory legislation.b Declared local governing bodies under section 4(2)(b) of the Local Government (Financial Assistance) Act
1995 (Cth).c Includes Outback Communities Authority established under the Outback Communities (Administration and
Management) Act 2009 (SA).d Includes the Northern Territory Roads Trust Account.
Source: Department of Infrastructure and Regional Development.
Methodologies of local government grants commissionsLocal government grants commissions each have their own methods for allocating funds to local government in their jurisdiction.
To allocate the general purpose component, local government grants commissions assess the amount each local government would need to be able to provide a standard range and quality of services, while raising revenue from a standard range of rates and other income sources. The local government grants commissions then develop recommendations taking into account each local governing body’s assessed need. The recommended allocation of the identified local road component is based on the local government grants commissions’ assessment of each local governing bodies road expenditure needs. Local government grants commissions are required to make their recommendations in line with the National Principles under the Act.
A detailed description of each local government grants commission’s methodology can be found in Appendix B. Further information about local government grants commissions can be found on the following websites.

24
Local Government National Report 2014–15
Internet addresses for local government grants commissionsJurisdiction Internet address
New South Wales https://www.olg.nsw.gov.au/commissions-and-tribunals/grants-commission
Victoria http://www.dtpli.vic.gov.au/local-government/victoria-grants-commission
Queensland http://www.qlggc.qld.gov.au/
Western Australia https://www.dlgc.wa.gov.au/GrantsFunding/Pages/WA-LG-Grants-Commission.aspx
South Australia http://www.dpti.sa.gov.au/local_govt/LGGC
Tasmania https://www.treasury.tas.gov.au/domino/dtf/dtf.nsf/v-stategrants/home
Northern Territory http://grantscommission.nt.gov.au/
Allocations to local government in 2014–15The Australian Government Minister approved the allocations of funding under the Financial Assistance Grant programme to local governing bodies for 2014–15 as recommended by local government grants commissions through state and Northern Territory ministers. Appendix D contains the actual entitlements for 2014–15 and the estimated entitlements for 2015–16.
Table 2-7 and 2-8 provide the average general purpose allocation per capita and local road allocation per kilometre by jurisdiction and the Australian Classification of Local Governments. The results in Table 2-7 and Table 2-8 suggest there are some differences in outcomes between jurisdictions. Notwithstanding the capacity of the classification system to group similar local governing bodies, it should be noted that there remains considerable scope for divergence within these categories. For this reason, the figures should only be taken as a starting point for enquiring into outcomes. This divergence can occur because of a range of factors including isolation, population distribution, local economic performance, daily or seasonal population changes, population age and geographic differences.

25
02 • Financial Assistance Grant programme
Tabl
e 2-
7 Av
erag
e ge
nera
l pur
pose
com
pone
nt p
er c
apita
201
4–15
Juri
sdic
tion
($)
Cla
ssifi
cati
on o
f lo
cal g
over
nm
ents
NS
WV
icQ
ldW
AS
ATa
sN
T*
Ave
rag
e
Urb
an C
apita
l City
(UC
C)
21.
32 2
0.56
20.
57 2
0.50
20.
57 2
0.58
21.
30 2
0.77
Urb
an D
evel
oped
Sm
all (
UD
S)
20.
58 n
/a n
/a 2
0.50
20.
57 n
/a n
/a 2
0.55
Urb
an D
evel
oped
Med
ium
(UD
M)
20.
63 n
/a n
/a 2
0.50
20.
57 n
/a n
/a 2
0.57
Urb
an D
evel
oped
Lar
ge (U
DL)
23.
79 2
4.07
n/a
20.
50 2
0.57
n/a
n/a
22.
23
Urb
an D
evel
oped
Ver
y La
rge
(UD
V)
33.
28 3
7.28
n/a
20.
50 4
7.31
n/a
n/a
34.
59
Urb
an R
egio
nal S
mal
l (U
RS
) 1
31.5
7 1
80.0
4 1
48.0
0 8
2.78
119
.32
63.
55 2
8.47
107
.68
Urb
an R
egio
nal M
ediu
m (U
RM
) 9
5.19
144
.31
124
.49
45.
31 2
1.50
20.
58 n
/a 7
5.23
Urb
an R
egio
nal L
arge
(UR
L) 7
6.75
109
.93
45.
25 n
/a n
/a n
/a n
/a 7
7.31
Urb
an R
egio
nal V
ery
Larg
e (U
RV
) 6
9.45
73.
31 2
3.56
n/a
n/a
n/a
n/a
55.
44
Urb
an F
ringe
Sm
all (
UFS
) n
/a 7
7.63
93.
49 n
/a 3
4.23
69.
47 2
1.30
59.
22
Urb
an F
ringe
Med
ium
(UFM
) 3
9.65
35.
36 5
8.16
24.
94 2
0.78
20.
58 n
/a 3
3.25
Urb
an F
ringe
Lar
ge (U
FL)
86.
69 8
7.22
n/a
20.
50 1
02.2
2 n
/a n
/a 7
4.16
Urb
an F
ringe
Ver
y La
rge
(UFV
) 4
1.83
60.
98 n
/a 2
0.50
33.
39 n
/a n
/a 3
9.18
Rur
al S
igni
fican
t G
row
th (R
SG
) n
/a n
/a n
/a 7
3.37
n/a
n/a
n/a
73.
37
Rur
al A
gric
ultu
ral S
mal
l (R
AS
) 9
44.7
0 n
/a n
/a 8
59.9
9 7
46.4
0 5
99.3
3 n
/a 7
87.6
1
Rur
al A
gric
ultu
ral M
ediu
m (R
AM
) 4
93.9
3 6
66.1
8 1
152.
42 2
26.4
3 3
40.2
0 2
22.5
5 n
/a 5
16.9
5
Rur
al A
gric
ultu
ral L
arge
(RA
L) 3
43.1
0 4
00.7
5 n
/a 2
83.4
7 2
42.7
6 1
86.8
5 n
/a 2
91.3
9
Rur
al A
gric
ultu
ral V
ery
Larg
e (R
AV
) 2
01.0
5 2
14.1
7 3
87.1
1 9
8.11
168
.20
103
.34
21.
30 1
70.4
7
Rur
al R
emot
e E
xtra
Sm
all (
RTX
) 4
99.4
0 n
/a 5
913.
51 9
816.
46 4
67.2
7 n
/a 5
4.67
335
0.26
Rur
al R
emot
e S
mal
l (R
TS)
n/a
n/a
319
0.89
244
8.70
n/a
n/a
n/a
281
9.80
Rur
al R
emot
e M
ediu
m (R
TM)
142
4.20
n/a
135
1.30
971
.93
415
.81
n/a
100
.25
852
.70
Rur
al R
emot
e La
rge
(RTL
) 6
45.4
3 n
/a 1
403.
79 2
48.8
1 3
75.5
7 n
/a 2
31.1
2 5
80.9
4
Tota
l $ p
er c
apit
a 6
8.59
68.
53 6
8.58
68.
35 6
8.55
68.
60 7
1.01
68.
90
Not
es:
n/a
mea
ns n
ot a
pplic
able
.*
Ex
clud
es th
e N
orth
ern
Terr
itory
Tru
st F
und.
Sour
ce:
Dep
artm
ent o
f Inf
rast
ruct
ure
and
Regi
onal
Dev
elop
men
t.

26
Local Government National Report 2014–15
Tabl
e 2-
8 Av
erag
e lo
cal r
oad
com
pone
nt p
er k
ilom
etre
201
4–15
Juri
sdic
tion
($)
Cla
ssifi
cati
on o
f Lo
cal G
over
nm
ents
NS
WV
icQ
ldW
A*
SA
*Ta
sN
TA
vera
ge
Urb
an C
apita
l City
(UC
C)
395
8.52
323
2.48
2641
.43
446
5.43
193
6.81
542
0.85
357
9.73
360
5.04
Urb
an D
evel
oped
Sm
all (
UD
S)
254
7.93
n/a
n/a
217
3.90
223
9.18
n/a
n/a
232
0.34
Urb
an D
evel
oped
Med
ium
(UD
M)
292
3.80
n/a
n/a
220
7.39
203
2.92
n/a
n/a
238
8.04
Urb
an D
evel
oped
Lar
ge (U
DL)
286
7.24
153
8.90
n/a
199
3.49
193
0.91
n/a
n/a
208
2.64
Urb
an D
evel
oped
Ver
y La
rge
(UD
V)
272
1.60
161
2.59
n/a
206
8.95
187
2.90
n/a
n/a
206
9.01
Urb
an R
egio
nal S
mal
l (U
RS
) 1
406.
57 1
087.
0066
2.14
166
6.93
733
.94
324
7.57
369
9.84
178
6.28
Urb
an R
egio
nal M
ediu
m (U
RM
) 1
642.
34 1
186.
5968
1.71
117
2.25
198
9.02
370
7.03
n/a
172
9.82
Urb
an R
egio
nal L
arge
(UR
L) 2
180.
01 1
298.
3287
4.74
n/a
n/a
n/a
n/a
173
9.17
Urb
an R
egio
nal V
ery
Larg
e (U
RV
) 2
265.
88 1
484.
8314
43.5
0 n
/a n
/a n
/a n
/a 1
875.
36
Urb
an F
ringe
Sm
all (
UFS
) n
/a 1
293.
8066
9.67
n/a
759
.89
257
9.84
344
3.77
201
9.33
Urb
an F
ringe
Med
ium
(UFM
) 1
903.
82 1
436.
6942
7.62
178
7.47
640
.53
320
8.39
n/a
156
7.42
Urb
an F
ringe
Lar
ge (U
FL)
184
5.68
163
8.98
n/a
195
1.26
149
7.32
n/a
n/a
173
3.31
Urb
an F
ringe
Ver
y La
rge
(UFV
) 2
281.
13 1
635.
36 n
/a 1
917.
87 1
555.
91 n
/a n
/a 1
847.
57
Rur
al S
igni
fican
t G
row
th (R
SG
) n
/a n
/a n
/a 1
011.
28 n
/a n
/a n
/a 1
011.
28
Rur
al A
gric
ultu
ral S
mal
l (R
AS
) 9
46.9
9 n
/a n
/a 6
26.8
2 4
14.4
6 1
910.
26 n
/a 9
74.6
3
Rur
al A
gric
ultu
ral M
ediu
m (R
AM
) 1
002.
83 7
90.4
456
0.97
733
.65
266
.18
221
2.82
n/a
927
.82
Rur
al A
gric
ultu
ral L
arge
(RA
L) 1
037.
74 6
37.7
0 n
/a 1
138.
49 3
17.8
3 2
312.
55 n
/a 1
088.
86
Rur
al A
gric
ultu
ral V
ery
Larg
e (R
AV
) 1
132.
53 1
040.
4158
8.94
902
.52
265
.47
232
3.10
341
9.82
138
1.83
Rur
al R
emot
e E
xtra
Sm
all (
RTX
) n
/a n
/a54
4.76
467
.57
206
9.83
n/a
881
.13
990
.82
Rur
al R
emot
e S
mal
l (R
TS)
n/a
n/a
548.
26 4
66.2
3 n
/a n
/a n
/a 5
07.2
5
Rur
al R
emot
e M
ediu
m (R
TM)
924
.40
n/a
560.
54 4
47.2
5 4
5.62
n/a
136
7.79
669
.12
Rur
al R
emot
e La
rge
(RTL
) 9
48.6
0 n
/a56
3.49
794
.28
n/a
n/a
873
.54
794
.98
Nor
ther
n Te
rrito
ry T
rust
fund
n/a
n/a
n/a
n/a
n/a
n/a
670
.32
670
.32
Tota
l $ p
er k
ilom
etre
139
6.08
111
6.57
212
4.13
841
.60
496
.09
261
4.04
127
1.71
140
8.60
Not
es:
n/a
mea
ns n
ot a
pplic
able
.*
Aver
ages
for a
ll cl
assi
ficat
ions
in th
ese
stat
es in
clud
es s
peci
al ro
ads
gran
ts re
ceiv
ed b
y lo
cal g
over
nmen
t.So
urce
: D
epar
tmen
t of I
nfra
stru
ctur
e an
d Re
gion
al D
evel
opm
ent.

27
02 • Financial Assistance Grant programme
Local governing bodies on the minimum grantLocal governing bodies that receive the minimum grant entitlement generally fall within the classification of capital city, urban developed or urban fringe, as described in the Australian Classification of Local Government. Local governing bodies on the minimum grant are identified with a hash (#) in Appendix D. Table 2-9 provides details of the local governing bodies on the minimum grant by jurisdiction from 2002–03 to 2014–15.
The per capita grant of these local governing bodies was between $20 and $21.30 in 2014–15, with slight differences between jurisdictions (see Appendix E). The differences arise from variations in population data used by the Australian Government to calculate jurisdictions’ share and data used by local government grants commissions for allocations to individual local governing bodies.
The proportion of the population covered by local governing bodies on the minimum grant varies widely between jurisdictions. In 2014, the proportion ranged from 27.9 per cent in New South Wales to 75.5 per cent in Western Australia. This generally reflects the degree of concentration of a jurisdiction’s population in their capital city but variations can also arise because of the geographic structure of local government and differences in the methods that local government grants commissions use.
Nationally in 2014–15, 13.2 per cent of the general purpose grant went to local governing bodies on the minimum grant. It varied from 8.4 per cent in New South Wales to 22.7 per cent in Western Australia.
Local government grants commissions determine the level of assistance that each local governing body requires to function, by reasonable effort, at a standard not lower than the average standard of other local governing bodies in that jurisdiction. In doing this, they consider the revenue-raising ability and expenditure requirements of each local governing body in the jurisdiction. Where a local governing body is on the minimum grant, its local government grants commission has determined that it requires less assistance to function, by reasonable effort, at a standard not lower than the average standard of other local governing bodies in that jurisdiction.
Over the past decade, the number of local governing bodies on the minimum grant increased from 86 in 2004–05 to 104 in 2014–15. The percentage of the population in minimum grant councils increased from 33.8 per cent in 2004–05 to 44.1 per cent in 2014–15. This has resulted in an increase in the per capita grant to non-minimum grant local governments relative to that of minimum grant local governments. This trend is consistent with the objective of the Act for horizontal equalisation.

28
Local Government National Report 2014–15
Tabl
e 2-
9 Co
unci
ls o
n th
e m
inim
um g
rant
by
juris
dict
ion
from
200
4–05
to 2
014–
1520
04–0
520
05–0
620
06–0
720
07–0
820
08–0
920
09–1
020
10–1
120
11–1
220
12–1
320
13–1
420
14–1
5
NS
W
$ ge
nera
l p
urp
ose
358
832
105
374
443
598
385
938
812
406
050
359
422
066
453
442
758
903
463
479
161
471
413
267
489
045
833
508
608
083
508
237
232
$ to
min
imum
gr
ant
coun
cils
26
481
959
27
451
347
29
279
694
30
793
666
32
070
254
33
460
548
36
160
752
37
593
617
38
999
527
41 0
44 9
1342
527
921
% t
o m
inim
um
gran
t co
unci
ls7.
47.
37.
67.
67.
67.
67.
88.
08.
08.
18.
4
Pop
ulat
ion
per
ju
risd
ictio
n 6
710
408
6 7
49 2
97 6
790
811
6 8
54 0
67 6
943
884
6 9
83 6
05 7
133
854
7 2
32 0
22 7
301
607
7 28
9 77
97
409
856
Pop
ulat
ion
for
min
imum
gra
nt
coun
cils
1 6
32 6
77 1
644
799
1 7
12 9
59 1
725
814
1 7
44 7
16 1
759
235
1 8
55 2
82 1
922
430
1 9
40 9
161
960
961
2 06
6 78
8
% o
f pop
ulat
ion
in m
inim
um
gran
t co
unci
ls
24.3
24.4
25.2
25.2
25.1
25.2
26.0
26.6
26.6
26.9
27.9
Min
imum
gra
nt
coun
cils
/N
o.
LGB
s
20/
155
20/
155
21/
155
21/
155
21/
155
21/
155
22/
155
23/
155
23/
155
23/1
5524
/155
Vic
$ ge
nera
l p
urp
ose
266
191
972
276
987
692
289
188
062
305
906
191
319
394
720
336
060
498
354
852
579
360
195
861
375
393
290
393
135
181
393
289
960
$ to
min
imum
gr
ant
coun
cils
10
883
040
13
194
313
16
041
360
13
310
089
23
450
803
27
458
066
30
577
564
30
820
330
28
328
702
33 5
55 3
8133
587
740
% t
o m
inim
um
gran
t co
unci
ls4.
14.
85.
64.
47.
38.
28.
68.
67.
68.
58.
5
Pop
ulat
ion
per
ju
risd
ictio
n 4
941
398
4 9
92 6
67 5
088
427
5 1
63 6
49 5
262
390
5 3
13 7
34 5
443
134
5 5
45 8
38 5
621
116
5 6
32 5
195
739
228
Pop
ulat
ion
for
min
imum
gra
nt
coun
cils
670
083
789
522
928
552
738
401
1 2
73 9
12 1
447
208
1 5
63 4
45 1
581
774
1 4
13 9
741
600
743
1 63
3 80
8
% o
f pop
ulat
ion
in m
inim
um
gran
t co
unci
ls
13.6
15.8
18.2
14.3
24.2
27.2
28.7
28.5
25.2
28.4
28.5
Min
imum
gra
nt
coun
cils
/N
o.
LGB
s
8/8
0 9
/80
10/
80 7
/79
11/
79 1
2/79
12/
79 1
3/79
12/
79 1
3/79
13/7
9

29
02 • Financial Assistance Grant programme
2004
–05
2005
–06
2006
–07
2007
–08
2008
–09
2009
–10
2010
–11
2011
–12
2012
–13
2013
–14
2014
–15
Qld
$ ge
nera
l p
urp
ose
207
097
211
217
821
826
230
151
592
244
752
786
257
092
111
272
006
416
288
922
754
290
459
015
304
750
796
319
028
016
319
083
531
$ to
min
imum
gr
ant
coun
cils
34 0
75 6
4526
940
642
25 3
46 3
0326
876
194
27 4
68 8
8429
098
788
30 7
28 7
5750
601
267
62 2
54 6
8365
533
567
65 7
66 3
11
% t
o m
inim
um
gran
t co
unci
ls16
.512
.411
.011
.010
.710
.710
.617
.420
.420
.520
.6
Pop
ulat
ion
per
ju
risd
ictio
n3
844
405
3 92
6 21
04
049
647
4 13
1 38
94
242
789
4 17
8 23
24
421
783
4 51
0 51
04
576
882
4 55
6 41
64
653
008
Pop
ulat
ion
for
min
imum
gra
nt
coun
cils
2 08
1 20
61
599
555
1 45
4 32
31
486
720
1 45
8 82
71
489
934
1 56
7 61
52
619
274
3 11
6 56
13
138
148
3 19
6 77
2
% o
f pop
ulat
ion
in m
inim
um
gran
t co
unci
ls
54.1
40.7
35.9
36.0
34.4
35.7
35.5
58.1
68.1
68.9
68.7
Min
imum
gra
nt
coun
cils
/N
o.
LGB
s
7/1
57 3
/157
2/1
57 2
/157
2/7
3 2
/73
2/7
3 6
/73
8/7
38/
779/
77
WA
$ ge
nera
l p
urp
ose
105
930
054
110
620
829
115
836
527
123
301
075
129
395
614
137
579
902
146
620
875
151
667
051
157
781
551
171
319
297
172
194
345
$ to
min
imum
gr
ant
coun
cils
22 1
88 0
2924
661
291
25 9
01 1
3027
858
876
29 1
47 4
1131
045
359
33 1
32 0
2334
286
560
35 4
32 6
8838
760
735
39 0
26 1
05
% t
o m
inim
um
gran
t co
unci
ls21
.022
.322
.422
.622
.522
.622
.622
.622
.522
.622
.7
Pop
ulat
ion
per
ju
risd
ictio
n1
966
410
1 99
3 92
62
038
209
2 08
1 30
32
138
062
2 17
1 19
72
245
057
2 29
3 51
02
349
325
2 43
0 25
22
519
321
Pop
ulat
ion
for
min
imum
gra
nt
coun
cils
1 36
3 07
71
473
011
1 49
8 20
91
544
602
1 58
1 14
91
633
126
1 69
1 05
71
728
272
1 75
8 61
11
832
803
1 90
3 26
2
% o
f pop
ulat
ion
in m
inim
um
gran
t co
unci
ls
69.3
73.9
73.5
74.2
74.0
75.2
75.3
75.4
74.9
75.4
75.5
Min
imum
gra
nt
coun
cils
/No.
LG
Bs
28/
142
30/
142
30/
140
31/
140
31/
139
31/
139
31/
139
31/
138
30/
138
31/1
3831
/138
Coun
cils
on
the
min
imum
gra
nt b
y ju
risdi
ctio
n fro
m 2
004–
05 to
201
4–15
(con
tinue
d)

30
Local Government National Report 2014–15
2004
–05
2005
–06
2006
–07
2007
–08
2008
–09
2009
–10
2010
–11
2011
–12
2012
–13
2013
–14
2014
–15
SA
$ ge
nera
l p
urp
ose
82 4
42 4
0385
234
073
88 6
33 9
9493
329
590
96 9
48 2
0610
1 12
7 27
610
5 43
4 39
510
7 46
8 61
011
0 93
8 45
111
5 07
2 53
011
4 52
8 24
5
$ to
min
imum
gr
ant
coun
cils
13 7
32 5
6314
175
161
14 7
06 7
5415
018
873
16 0
84 8
0016
309
932
17 5
42 8
0114
330
230
17 9
38 9
0918
042
090
17 1
54 9
72
% t
o m
inim
um
gran
t co
unci
ls16
.716
.616
.616
.116
.616
.116
.613
.316
.215
.715
Pop
ulat
ion
per
ju
risd
ictio
n1
530
402
1 53
6 33
31
559
565
1 57
5 38
91
593
494
1 60
3 36
11
623
590
1 64
4 58
21
656
299
1 65
4 77
81
670
827
Pop
ulat
ion
for
min
imum
gra
nt
coun
cils
847
861
850
511
852
943
834
072
876
276
861
778
900
691
810
045
892
807
864
995
834
042
% o
f pop
ulat
ion
in m
inim
um
gran
t co
unci
ls
55.4
55.4
54.7
52.9
55.0
53.8
55.5
49.3
53.9
52.3
49.9
Min
imum
gra
nt
coun
cils
/No.
LG
Bs
22/
74 2
2/74
22/
74 2
0/74
21/
74 2
0/74
21/
74 2
0/74
20/
74 1
8/74
17/7
4
Tas
$ ge
nera
l p
urp
ose
25 8
66 2
1626
841
415
27 7
66 0
3329
129
652
30 1
63 7
8831
433
715
32 6
11 8
6433
677
077
34 4
71 5
2235
487
132
35 2
01 3
32
$ to
min
imum
gr
ant
coun
cils
781
868
810
666
837
576
1 67
6 50
52
914
651
3 99
4 95
34
775
551
3 62
0 17
83
714
379
5 21
9 53
45
182
417
% t
o m
inim
um
gran
t co
unci
ls3.
03.
03.
05.
89.
712
.714
.610
.810
.814
.714
.7
Pop
ulat
ion
per
ju
risd
ictio
n48
0 16
248
3 81
348
8 55
949
1 70
449
5 37
749
7 52
950
3 29
250
7 64
351
0 51
951
2 01
951
3 15
9
Pop
ulat
ion
for
min
imum
gra
nt
coun
cils
48 0
7148
533
48 7
9493
708
158
901
210
772
245
667
181
900
183
365
251
030
251
828
% o
f pop
ulat
ion
in m
inim
um
gran
t co
unci
ls
10.0
10.0
10.0
19.1
32.1
42.4
48.8
35.8
35.9
49.0
49.1
Min
imum
gra
nt
coun
cils
/No.
LG
Bs
1/2
9 1
/29
1/2
9 2
/29
3/2
9 4
/29
5/2
9 4
/29
4/2
95/
295/
29
Coun
cils
on
the
min
imum
gra
nt b
y ju
risdi
ctio
n fro
m 2
004–
05 to
201
4–15
(con
tinue
d)

31
02 • Financial Assistance Grant programme
2004
–05
2005
–06
2006
–07
2007
–08
2008
–09
2009
–10
2010
–11
2011
–12
2012
–13
2013
–14
2014
–15
NT
$ ge
nera
l p
urp
ose
10 7
13 8
8911
142
605
11 8
65 3
7712
590
104
13 2
03 5
6913
880
149
14 7
33 5
7215
224
579
15 5
18 2
3916
449
092
16 5
73 3
14
$ to
min
imum
gr
ant
coun
cils
–1
219
197
–1
350
251
1 77
2 17
62
424
889
2 55
5 87
23
239
988
2 71
4 71
82
889
253
2 93
8 75
1
% t
o m
inim
um
gran
t co
unci
ls–
10.9
4–
10.7
213
.42
17.4
717
.35
21.2
817
.49
17.5
617
.7
Pop
ulat
ion
per
ju
risd
ictio
n19
8 88
520
0 84
420
8 77
821
2 51
921
7 43
521
2 98
321
8 63
522
0 75
322
3 44
322
7 96
323
3 39
9
Pop
ulat
ion
for
min
imum
gra
nt
coun
cils
–69
958
–70
245
17 8
5612
4 02
912
6 42
415
6 59
713
0 29
513
3 47
113
7 95
3
% o
f pop
ulat
ion
in m
inim
um
gran
t cou
ncils
–34
.83
–33
.05
8.21
58.2
357
.82
70.9
458
.31
58.5
559
.1
Min
imum
gra
nt
coun
cils
/No.
LG
Bs
0/6
3 1
/63
0/6
2 1
/61
2/1
6 4
/16
4/1
6 6
/16
5/1
65/
165/
18
Au
stra
lia
$ ge
nera
l p
urp
ose
1 05
7 07
3 85
01
103
092
038
1 14
9 38
0 39
71
215
059
757
1 26
8 26
4 46
11
334
846
859
1 40
6 65
5 20
01
430
105
460
1 48
7 89
9 68
21
559
099
331
1 55
9 10
7 95
9
$ to
min
imum
gr
ant
coun
cils
108
143
104
108
452
617
112
112
817
116
884
454
132
908
979
143
792
535
155
473
320
174
492
170
189
383
606
205
045
473
206
184
217
% t
o m
inim
um
gran
t co
unci
ls10
.29.
89.
89.
610
.510
.811
.112
.212
.712
.713
.2
Pop
ulat
ion
per
ju
risd
ictio
n19
672
070
19 8
83 0
9020
223
996
20 5
10 0
2020
893
431
20 9
60 6
4121
589
345
21 9
54 8
5822
239
191
22 3
03 7
2622
738
798
Pop
ulat
ion
for
min
imum
gra
nt
coun
cils
6 64
2 97
56
475
889
6 49
5 78
06
493
562
7 11
1 63
77
526
082
7 95
0 18
19
000
292
9 43
6 52
99
782
151
10 0
24 4
53
% o
f pop
ulat
ion
in m
inim
um
gran
t cou
ncils
33.8
32.6
32.1
31.7
34.4
35.9
34.3
41.0
42.4
43.1
44.1
Min
imum
gra
nt
coun
cils
/No.
LG
Bs
86/
700
86/
700
86/
697
84/
695
91/
565
94/
565
97/
565
103
/564
102
/564
97/
568
104/
570
Not
e:
The
Nor
ther
n Te
rrito
ry R
oad
Trus
t is
not i
nclu
ded
as it
doe
s no
t rec
eive
an
allo
catio
n un
der t
he g
ener
al p
urpo
se c
ompo
nent
. LG
B: L
ocal
gov
erni
ng b
odie
s.So
urce
: D
epar
tmen
t of I
nfra
stru
ctur
e an
d Re
gion
al D
evel
opm
ent.
Coun
cils
on
the
min
imum
gra
nt b
y ju
risdi
ctio
n fro
m 2
004–
05 to
201
4–15
(con
tinue
d)

32
Local Government National Report 2014–15
Council changesDuring 2014–15, the number of local governing bodies in the Northern Territory increased with Victoria Daly Regional Council de-amalgamating into two councils; these being the Victoria Daly Regional Council and the West Daly Regional Council. These new entities commenced operations on 1 July 2014.
Comparing councilsCouncils often compare the grant they receive to that of other councils and assume that if another council gets a similar-sized grant, then both councils have been assessed as having a similar relative need. Such an assumption can be incorrect.
In determining the allocation of the general purpose and the local road components to councils, local government grants commissions implicitly determine a ranking for each council in their state on the basis of relative need. A comparison of councils on the basis of relative need is preferred to a comparison on the basis of the actual grant they receive. To compare relative need, analysis of the grant per capita under the general purpose component is provided in Appendix E. For the local road component, allocations for each council is divided by their length of local road to obtain a relative expenditure needs measure. In Tables E-1 to E-7 (Appendix E), councils within a state are sorted on the value of the general purpose allocation per capita and the local road allocation per kilometre.
Councils are ranked from the greatest assessed relative need to the least assessed relative need. For each state and the Northern Territory, the position of the average general purpose allocation per capita and the average local road allocation per kilometre are highlighted within the ranking of councils. These state averages are taken from Table 2-7 and 2-8.
Councils should use these rankings when comparing their allocations under the Financial Assistance Grant programme with other councils in their state. For instance, Appendix D shows that in Victoria for 2014–15 under the general purpose component, Banyule City Council received $3 648 663 while Frankston City Council received $7 580 174. This translates to each person in Banyule being allocated $29.31 per capita, while in Frankston it is $56.75 per capita. This suggests that while the two councils have similar populations and similar locations, the Victoria Grants Commission has assessed Frankston City as having the greater relative need. Frankston City Council is ranked 57th in Appendix E among Victoria’s councils for the general purpose component while Banyule City Council is ranked 64th.
Reviews of local government grants commission methodologiesLocal government grants commissions monitor outcomes and refine aspects of their allocation methodologies to be in line with the National Principle requirements of the Act. From time to time local government grants commissions review their methodologies.
Since the Act commenced in July 1995, most local government grants commissions have undertaken major reviews of their methodologies, are undertaking such examinations or have such activities planned. Table 2-10 provides the status of jurisdictional reviews as at 30 June 2015.

33
02 • Financial Assistance Grant programme
The need to review methodologies was reinforced by the 2001 Commonwealth Grants Commission review of the operations of the Act. The review identified the need for each local government grants commission to revise their methodologies to achieve consistency with the principles of relative need, other grant support and Aboriginal peoples and Torres Strait Islanders (Commonwealth Grants Commission 2001).
Table 2-10 Status of most recent major methodology reviews by state
State General purpose grants Local road grants
NSW No changes to methodology. KPMG commenced a review of the methodology in early 2015, with a final report expected by the end of 2015. In 2013–14, strategies to improve outcomes to smaller rural communities, generally those with resident populations below 10 000, were put in place.
No changes to methodology.
Vic No changes to methodology. No changes to methodology.
Qld No changes to methodology. No changes to methodology.
WA No changes to methodology since the last major review which was implemented for 2012–13 grant determinations. Expenditure and revenue standard equations were updated for new data inputs.
No changes to methodology.
SA No changes to methodology. Annual data updates are incorporated into the grant recommendations. Specific recommendations from the KPMG review to be implemented in 2015–16.
No changes to methodology.
Tas No changes to methodology. The next major review is scheduled for introduction in 2015–16.
No changes to methodology
NT No changes to methodology. Road funding methodology was reviewed in 2012–13 and 2013–14. Implementation began in 2014–15.
Source: Department of Infrastructure and Regional Development.
Impact of local government grants commission capping policiesYear-to-year variations in the data that local government grants commissions use to determine their allocations can lead to significant fluctuations in funding provided to individual local governing bodies. As unexpected changes in annual funding allocations can impede efficient planning by local governing bodies, local government grants commissions have adopted policies to ensure changes are not unacceptably large from one year to the next.
Many local government grants commissions average the data of several years to reduce fluctuations. Nevertheless, policies to limit changes by capping increases or decreases are used to limit year-to-year variations.
No local governing body receives less than the minimum grant, so local governing bodies on the minimum grant are exempt from capping. In some circumstances, a local government grants commission may decide a local governing body’s allocation should not be capped. Usually, this is to allow a larger grant increase than would otherwise be possible.


35
03Local government efficiency and performance
Under section 16 of the Local Government (Financial Assistance) Act 1995 (Cth) (the Act), an annual report must be made to the Australian Parliament on the operations of the Act. The report must include an assessment based on comparable national data of the performance of local governments, including their efficiency.
Previous Local Government National Reports have identified the difficulty of basing an assessment on comparable national data, due in large part to the different arrangements each jurisdiction uses to collect and report on local government performance.
Each year jurisdictions are asked to report on measures undertaken to improve local government efficiency and performance. These reports are provided at Appendix B.
Developments in long-term financial and asset management plansJurisdictions provided reports on their activities in the implementation and management of long-term financial and asset management plans by local government during 2014–15. A summary of the progress for each jurisdiction follows.
All councils in New South Wales report under an integrated planning and reporting framework. This framework is designed to improve councils’ strategic community planning, including long-term financial and asset management planning, as well as streamline reporting to the community. The framework requires councils to prepare the following plans:
• Community engagement strategy
• Community strategic plan – 10-Year + timeframe
• Delivery program – four-year timeframe
• Operational plan – one-year timeframe
• Resourcing strategy – including a long-term financial plan (10 years+), asset management policy, strategy and plans (10-years+), and workforce management strategy (four-years).
Victoria introduced the Local Government (Planning and Reporting) Regulations 2014 (Vic) to provide greater standardisation in the planning and reporting of Victorian councils. Key strategic documents such as the annual budget, strategic resource plan including statutory financial statements must now be presented in accordance with the Local Government Model Financial Report. This model report is updated and issued annually. The inclusion of a four-year capital works programme, including funding sources and classification of works into renewal, upgrade, enhancement or new, further enhances the long-term financial planning of councils.
Local Government Victoria issued a revised Best practice guidance in asset management practices in 2015. A key feature of this publication is its alignment with the Institute of Public

36
Local Government National Report 2014–15
Works Engineering Australasia asset infrastructure financial management manual and commitment to participating in national benchmarking.
All Queensland local governments are required to have long-term financial forecasts covering at least 10 years and to update these forecasts annually. To help local governments comply with this requirement, Queensland maintains a Local Government Forecast Model which was updated in September 2014 to incorporate improved features including the ability to undertake scenario modelling. A workshop series was conducted around Queensland to inform, educate and assist local governments in the appropriate use and features of the model.
Financial and asset management planning and implementation have been identified as areas in which Western Australian local governments require support and assistance in improving the accuracy of asset condition and useful life data. To address these challenges, the Western Australian Government has implemented a four-year project to support up to 80 country local governments to assess their current asset and financial management processes. The Western Australian Government has engaged asset management consultants to work with local governments on the project and provide training, mentoring and guidance. In 2014–15, 39 country local governments participated in the National Asset Management Assessment Framework and Asset Condition Rating Project.
Each one of South Australia’s 68 local governments is required to develop and adopt long-term financial, infrastructure and asset management plans, each covering a period of at least 10 years. In support of this work, the Local Government Association of South Australia provides advice and assistance to the sector through its ongoing Financial Sustainability Program.
After extensive consultation with the local government sector in 2013, Tasmania legislated long-term financial and strategic asset management planning for Tasmanian councils, as well as other related financial and asset management initiatives. The Tasmanian Auditor-General has been monitoring compliance with the legislative requirements. The Auditor-General’s findings indicate that since the introduction of mandatory long-term financial and asset management planning, there has been a noteworthy improvement in the financial and asset management performance of local government in Tasmania.
In 2014–15, the Northern Territory entered into a three-year agreement with the Local Government Association of the Northern Territory to provide assistance with best practice asset management guidance to councils.
The Australian Capital Territory Government during 2014–15 continued to plan, manage and review capital works projects under Capital Framework. The Territory has begun a policy implementation review to assess the success of Capital Framework and any lessons learned since its introduction in 2013. The outcomes of this review will be used to enhance and refine Capital Framework.
Performance measures between local governing bodiesAll local governments have a legislative requirement to report on their performance. These reports may be in the form of annual reports, performance statements, financial statements and/or strategic planning reports.
While not all performance information is publicly available, some jurisdictions provide a comparative analysis of local governments under their jurisdiction. This information is collected by either the responsible agency or by local government grants commissions.

37
03 • Local Government efficiency and performance
For this National Report, state and territory governments and local government associations were asked to report on measures undertaken in 2014–15 to develop and implement comparative local government performance indicators. A summary of these reports for each jurisdiction follows.
In 2014–15, New South Wales produced 2013–14 Comparative information on New South Wales local government councils which contains a range of performance indicators. The 2013–14 publication includes a whole of sector overview as well as a two-page snapshot of each council and incorporates relevant high level demographic and socio-economic indicators for each local government area. The 2013–14 publication features more user-friendly and informative modes of presenting council data. At the same time, New South Wales is undertaking further work to develop a new local government performance measurement framework. In late 2013, a discussion paper was issued as part of the first stage of council and public consultation on a new approach to performance measurement. A more detailed outline of the proposed framework and a set of draft indicators for further consultation is being prepared.
In Victoria, 2014–15 was the first year all 79 councils had to report on a range of performance indicators, following the introduction of a new, compulsory performance reporting framework. Over the year, councils collected data on indicators across 11 service areas including financial performance and sustainable capacity. Of the 66 indicators, seven are transitional measures that will be reported on from 2015–16 onwards. The framework also includes a checklist of 24 items considered essential for supporting good governance and management in local government.
To support the reporting and availability of performance information, Victoria developed the Know your council website (www.knowyourcouncil.vic.gov.au). The design and implementation of the website followed an extensive engagement and testing process with councils and the community.
For the first time, all of the performance information can be compared in one location. Councils’ results will be published annually on the Know your council website and as a part of their annual reports. Council results will be supported by their own narrative to explain results and tell their story.
In addition to comparative reporting and benchmarking, the Know your council website has a council directory and a ‘Guide to Councils’ with information about how councils work and the range of services delivered.
In 2014–15, Queensland produced the 2013–14 Queensland local government comparative information report. This report helps local governments to develop new and more effective ways to deliver services by providing an effective tool by which they can monitor trends over time and benchmark services performance, both internally and with other councils.
The Western Australian local government sector has been implementing the integrated planning and reporting reforms from July 2013. Comparative performance measures will be developed in future years once these reforms are in place. Work is continuing on improving the standard of the integrated planning and reporting documentation and community engagement strategies.
Comparisons between South Australian councils on a wide range of data are now facilitated by the annual publication by the South Australian Local Government Grants Commission of annual database reports.

38
Local Government National Report 2014–15
Until 2014, Tasmania produced the Sustainability objectives and indicators report to measure council performance on an annual basis. The Sustainability objectives and indicators report contained detailed analysis and presentation of financial, asset management and planning and development data and in particular, a number of sustainability indicators. Tasmania reviewed the Sustainability objectives and indicators project in December 2014 and evaluated is efficacy to drive a culture of continuous improvement within Tasmanian councils. The review report found that the indicators measured were valuable, but there would be benefits in reconsidering what the indicators currently measure and identifying indicators that are meaningful to a wider audience. In response to the review findings, it was proposed that the Sustainability objectives and indicators report be subsumed into a new continuous improvement framework. These recommendations are being progressed in consultation with a Continuous Improvement Framework Advisory Group.
In 2014–15, Northern Territory councils’ data was collected and aggregated into a Northern Territory-wide report. In collecting the data, a web-based self-assessment tool was released which provided a pictorial and textual report on where individual councils are positioned in relation to asset management and long-term financial planning. The intent of this tool is to empower councils with base line data and a mechanism to help them assess and evaluate their asset and financial management capacity. In addition, the Local Government Association of the Northern Territory researched the development of a framework for assessing short-term and long-term financial sustainability using a standard set of financial indicators.
The Australian Capital Territory does not undertake comparative performance measures with local governments. The Australian Capital Territory Government does undertake analysis on the Report on government services information, however this reporting focuses on ‘state-like’ government services.
Efficiency and effectiveness reformsAs part of their reports, jurisdictions were asked to provide information on the reforms undertaken during 2014–15 to improve the efficiency and effectiveness of local government service delivery. A summary for each jurisdiction follows.
In 2014–15, New South Wales initiated a comprehensive package of measures to revitalise local government. This package is designed to strengthen councils and their communities and will involve streamlining legislation, cutting red tape and improving council performance. In September 2014, the New South Wales Government released its plan to create stronger and more effective councils in A blueprint for the future of local government. This set out a pathway to achieving a shared vision of the future which recognises the differing needs of Greater Sydney, regional and rural areas and the Far West. It addresses the need to reform the system of local government and councils within it. The Fit for the future process launched as part of this package and asked councils to consider their position, assess their performance and prepare a plan to systematically improve their outlook. This encourages councils to rethink their scale and focus so they can continue to meet community needs.
In Victoria, all 79 councils in the pursuit of better practice in procurement and shared services are working collaboratively through a Regional Procurement Excellence Network. This network promotes best practice and collaboration in procurement practices.
Victoria began implementing its Fair Go Rates System which will see increases to municipal rates and charges capped in line with increases in the Consumer Price Index unless a

39
03 • Local Government efficiency and performance
council has obtained approval for a higher increase from the Essential Services Commission. In February 2015, the Essential Services Commission was commissioned to undertake an inquiry and recommend how best to implement this policy.
The preparation of the Local Government Amendment (Improved Governance) Bill 2015 continued in 2014–15 to enhance the standard of behaviour in the local government sector, improve the framework for dealing with councillor misbehaviour and strengthen the integrity of council elections.
Queensland now requires local governments to report fraud losses to both the Queensland Auditor-General and the Queensland Minister for Local Government. In addition, local governments are now required to keep written records of alleged and proven fraud-related losses. These changes provide consistency with Queensland’s reporting requirements and enable Queensland to monitor reported fraud losses from local governments to identify possible training or support needs.
In Western Australia, many local governments reviewed their activities by using the Local Government Reform Toolkit, an online resource providing best practice templates and guidance. The efficiency and effectiveness of local government service delivery has been supported by the deployment of technologies to automate processes and improve the timeliness of procurement processes. The use of eSign has seen hundreds of contracts expedited by removing the need for printing, sending and paper-based file management. eQuotes has been used to streamline thousands of purchasing engagements to a process of quotation, with auditable and transparent records.
South Australia undertook a state-wide roll out of the Council Member Induction Training programme following the introduction of the Training Standard for Council Members in November 2014. Thirty-five councils participated in the rollout, resulting in 310 council members successfully completing the training requirement. This training programme was also released in an online format with great success. Twenty-seven councils bought the site licence, providing unlimited access for 12 months. The flexibility and accessibility of this approach was well received by the sector and played a major role in enabling council members to complete this training requirement.
In February 2015, Tasmania began discussions on voluntary amalgamations and strategic shared service initiatives while committing to provide financial assistance to councils who would undertake feasibility studies into voluntary amalgamations or enhanced strategic shared services. Feasibility studies to assess voluntary amalgamation and strategic shared services are underway for greater Hobart councils (Hobart City, Clarence City, Glenorchy City and/or Kingborough Councils) and south east councils (Clarence City, Sorell, Glamorgan-Spring Bay and Tasman Councils). In addition, proposals to investigate comprehensive shared service arrangements are close to completion, with agreements being drafted for the nine councils in the Cradle Coast region and the eight councils in the northern region.
From 1 January 2014, local authorities were established in 63 remote communities within nine regional councils across the Northern Territory. Each authority comprises of between six to 14 members including community nominated and regional council elected members. Local authority meetings are held at least four times per year and discuss a range of issues such as council planning, budgeting, employment and the monitoring of service delivery within their respective communities. A review of local authorities found that in their first year of operation, local authorities were delivering on their objectives to provide a stronger local voice and greater accountability for service delivery. In June 2015, the Northern Territory

40
Local Government National Report 2014–15
Government endorsed broadening the functions of local authorities as the preferred body for government’s engagement with remote communities across all portfolio areas. Planning for the implementation of this new initiative is a collaborative process with regional councils.
In December 2014, the Australian Capital Territory established Access Canberra which brings together regulators within the Australian Capital Territory Government’s primary shopfront and contact centre agency. Access Canberra aims to improve the experience of businesses, community organisations and individuals in accessing government services. Access Canberra has delivered greater efficiency for customers by joining up regulatory activities, reducing duplication, delivering better coordination of events approvals, and establishing a single point of contact – eliminating the need for businesses to negotiate multiple entry points to government.

41
04Local government and Aboriginal and Torres Strait Islander communities
Reporting requirementsSection 16 of the Local Government (Financial Assistance) Act 1995 (Cth) (the Act) requires an assessment, based on comparable national data, of the delivery of local government services to Aboriginal and Torres Strait Islander communities.
During 2014–15, all jurisdictions pursued initiatives aimed at promoting the delivery of local government services to Aboriginal and Torres Strait Islander communities. A summary of key initiatives is also provided later in this chapter.
Closing the GapIn 2008, the Council of Australian Governments (COAG) agreed to six targets for Closing the Gap between Indigenous and non-Indigenous Australians. The six COAG targets were:
• to close the gap in life expectancy between Indigenous and non-Indigenous Australians by 2031
• to halve the gap in mortality rates for Indigenous children under five by 2018
• to ensure access to early childhood education for all Indigenous four-year-olds in remote communities by 2013
• to halve the gap in reading, writing and numeracy achievement for Indigenous children by 2018
• to halve the gap in year 12 or equivalent attainment rates for Indigenous young people by 2020
• to halve the gap in employment outcomes between Indigenous and non-Indigenous Australians by 2018.
In May 2014, an additional Closing the Gap target was agreed: to close the school attendance gap between Indigenous and non-Indigenous within five years.
Closing the Gap is a long-term, ambitious framework that builds on the foundation of respect and unity provided by the 2008 National Apology to Aboriginal and Torres Strait Islander Peoples. It acknowledges that improving opportunities for Indigenous Australians requires effort from all levels of government, as well as the private and not-for-profit sectors, communities and individuals.

42
Local Government National Report 2014–15
State, territory and local government initiativesAn outline of key activities undertaken by jurisdictions and local government associations in improving the provision of local government services to Aboriginal and Torres Strait Islanders people in 2014–15 is as follows.
All councils in New South Wales are required to prepare Integrated Planning and Reporting plans to facilitate community strategic planning and delivery of council services to best meet community needs. The Integrated Planning and Reporting guidelines include the requirement for a community strategic plan to be developed in consultation with groups within the local community and based on principles of social justice. This includes the consideration of Aboriginal and Torres Strait Islander people’s needs within each local community.
The Victorian Government has committed, under its Ministerial Statement on Local Government, to implement an Aboriginal Local Government Action Plan. Over 2014–15, Local Government Victoria; the Office of Aboriginal Affairs; the Municipal Association of Victoria; and Reconciliation Victoria held a series of workshops to underpin the development of the Aboriginal Local Government Action Plan. The plan is scheduled for release in late 2016.
As an initial action, the Victorian Government has funded the Maggolee website which was launched in 2015. Maggolee is a vehicle for councils to demonstrate examples of good practice in the way they engage with Aboriginal communities. This may include policy and programmes; information on protocols and cultural awareness; key contact information; relevant local data; news and events.
The Local Government Aboriginal Employment Project, led by the Municipal Association of Victoria, continued to support local government in their active engagement with Aboriginal and Torres Strait Islanders communities. This includes support to strengthen links with local government; encourage partnerships between the state and local governments dealing with Aboriginal and Torres Strait Islanders issues; and improve outcomes for Aboriginal and Torres Strait Islander people and local government, primarily in relation to reconciliation, service delivery, employment and cultural heritage.
The Queensland Government continued to provide funding to Aboriginal and Torres Strait Islander local governments to support the provision of local government services to their communities. In 2014–15, Queensland provided $31.8 million to 16 Aboriginal and Torres Strait Islander councils. These funds are provided to support councils in the efficient delivery of services and to build long-term financial sustainability by maximising opportunities to reduce operating costs and increase own-source revenue.
Other funding provided by the Queensland Government to Aboriginal and Torres Strait Islander councils in 2014–15 included $3.5 million under the Revenue Replacement Program. This is an initiative under Queensland’s alcohol-related harm reduction strategy for the nine Aboriginal and Torres Strait Islander local governments that compulsorily surrendered their council--held liquor licences in 2009. Funding was provided under this programme to help councils to maintain community services previously funded by the profits from alcohol sales.
Under the Indigenous Economic Development Grant programme, Queensland continued its commitment to support Aboriginal and Torres Strait Islander councils to employ municipal services staff. Each eligible council received $80 000 to support 1.6 full-time equivalent positions, except for Yarrabah and Palm Island Aboriginal Shire Councils and Northern Peninsula Area Regional Council, which each received $160 000 to support 3.2 full-time equivalent positions.

43
04 • Local Government and Aboriginal and Torres Strait Islander communities
In 2014, the Western Australian Government accepted a one-off payment of $90 million to transfer responsibility for municipal and essential services from the Australian Government to Western Australia from 1 July 2015. The Western Australian Government has since embarked on a major regional services reform programme to develop new arrangements for municipal and essential services delivery to Aboriginal communities. With support from Aboriginal people, the Western Australian Government has formed leadership groups across Western Australia to work with service providers on the ground to improve lives. The Western Australian Government has adopted a State Infrastructure Strategy to guide future investment in Aboriginal communities.
Western Australia has set up an Aboriginal Procurement Working Group to increase the awareness of the Western Australian Government and local government procurement policies and processes for Aboriginal businesses and to increase procurement of Aboriginal goods and services.
During 2014–15, South Australia has been preparing to deliver the municipal services programme to Aboriginal communities across South Australia. In April 2015, the South Australian Government secured $15 million from the Australian Government to provide municipal services to Aboriginal communities outside of the Anangu Pitjantjatjara Yankunytjatjara Lands.
For the 2015–16 year, funding will provide Aboriginal communities with services such as: waste management; dog control; environmental health; road maintenance; and water provision. Of the 17 service providers funded, four are local councils or a similar body.
The Tasmanian Government report that it is not aware of any specific local government initiatives undertaken in 2014–15 in relation to services to Aboriginal and Torres Strait Islander communities.
As Aboriginal and Torres Strait Islanders comprise approximately 33 per cent of the Northern Territory population; all councils deliver services in communities where Aboriginal and Torres Strait Islander people reside. Regional councils deliver the bulk of these services in over 60 towns which are made up largely of Aboriginal residents. The diversity of services offered by all councils is measured by the resources that councils are able to muster, mostly from grant programmes, and include initiatives that are not the norm for mainstream local government.
The services provided by local government in Northern Territory range from: school nutrition programmes; remote broadcasting; safe houses and centres for women; Centrelink and Australia Post services; community stores; public housing services; night patrol services and sobering up shelters; money management; mechanical workshops; reconciliation action plans; veterinary services (animal management); childcare, crèche and out-of-school hours care; youth, sport and recreation activities; domestic violence education and community violence mediation; Remote Jobs and Communities programme; outstations/homelands maintenance; and essential services (power and water).
The ACT Aboriginal and Torres Strait Islander Agreement 2015–2018 was signed on 23 April 2015 by the Australian Capital Territory Chief Minister, the Chair of the Aboriginal and Torres Strait Islander Elected Body, the Minister for Aboriginal and Torres Strait Islander Affairs, and the Head of the Australian Capital Territory Public Service. The agreement is the overarching document that will guide Aboriginal and Torres Strait Islander affairs in the Australian Capital Territory over the next three years. The agreement leads the way for the government to support Aboriginal and Torres Strait Islander community members to fully participate in and enjoy the social, economic and wellbeing benefits of living in the Australian Capital Territory.
The agreement aims to build strong families by focusing on seven key areas: cultural identity; healthy mind, healthy body; feeling safe; connecting the community; employment and economic independence; education; and leadership. An Implementation Plan for the agreement is being developed.


45
ANational Principles
Under section 3 of the Local Government (Financial Assistance) Act 1995 (Cth) (the Act), the Australian Government provides financial assistance for local government purposes by means of grants to the states and self-governing territories for the purpose of improving:
• the financial capacity of local governing bodies;
• the capacity of local governing bodies to provide their residents with an equitable level of services;
• the certainty of funding for local governing bodies;
• the efficiency and effectiveness of local governing bodies; and
• the provision, by local governing bodies, of services to Aboriginal and Torres Strait Islander communities.
In determining allocations, local government grant commissions are required to make their recommendations in line with National Principles. The National Principles are set out in Figure A-1, while Figure A-2 describes the horizontal equalisation National Principle in greater detail.
The main objective of having National Principles is to establish a nationally consistent basis for distributing financial assistance to local government under the Act. The Act includes a requirement, under section 6(1), for the Australian Government Minister responsible for local government to formulate National Principles after consulting with jurisdictions and local government.
The formulated National Principles are a disallowable instrument under the Act. As such, any amendments, including establishment of new principles, must be tabled in both Houses of the Australian Parliament before they can come into effect. Members and senators then have 15 sitting days in which to lodge a disallowance motion. If such a motion is lodged, the respective House has 15 sitting days in which to put and defeat the disallowance motion. If the disallowance motion is defeated, the amendment stands. If the disallowance motion is passed, the amendment will be deemed to be disallowed.

46
Local Government National Report 2014–15
Figure A-1 National Principles
A. General purpose The National Principles relating to allocations of the general purpose grant payable under section 9 of the Local Government (Financial Assistance) Act 1995 (the Act) among local governing bodies are as follows:
1. Horizontal equalisationGeneral purpose grants will be allocated to local governing bodies, as far as practicable, on a full horizontal equalisation basis as defined by the Act. This is a basis that ensures that each local governing body in the State/Territory is able to function, by reasonable effort, at a standard not lower than the average standard of other local governing bodies in the State. It takes account of differences in the expenditure required by those local governing bodies in the performance of their functions and in the capacity of those local governing bodies to raise revenue.
2. Effort neutralityAn effort or policy neutral approach will be used in assessing expenditure requirements and revenue raising capacity of each local governing body. This means as far as practicable, policies of individual local governing bodies in terms of expenditure and revenue effort will not affect the grant determination.
3. Minimum grantThe minimum general purpose grant allocation for a local governing body in a year will be not less than the amount to which the local governing body would be entitled if 30 per cent of the total amount of general purpose grants to which the State/Territory is entitled under Section 9 of the Act in respect of the year were allocated among local governing bodies in the State/Territory on a per capita basis.
4. Other grant supportOther relevant grant support provided to local governing bodies to meet any of the expenditure needs assessed should be taken into account using an inclusion approach.
5. Aboriginal peoples and Torres Strait IslandersFinancial assistance shall be allocated to councils in a way which recognises the needs of Aboriginal peoples and Torres Strait Islanders within their boundaries.
6. Council amalgamationWhere two or more local governing bodies are amalgamated into a single body, the general purpose grant provided to the new body for each of the four years following amalgamation should be the total of the amounts that would have been provided to the former bodies in each of those years if they had remained separate entities.
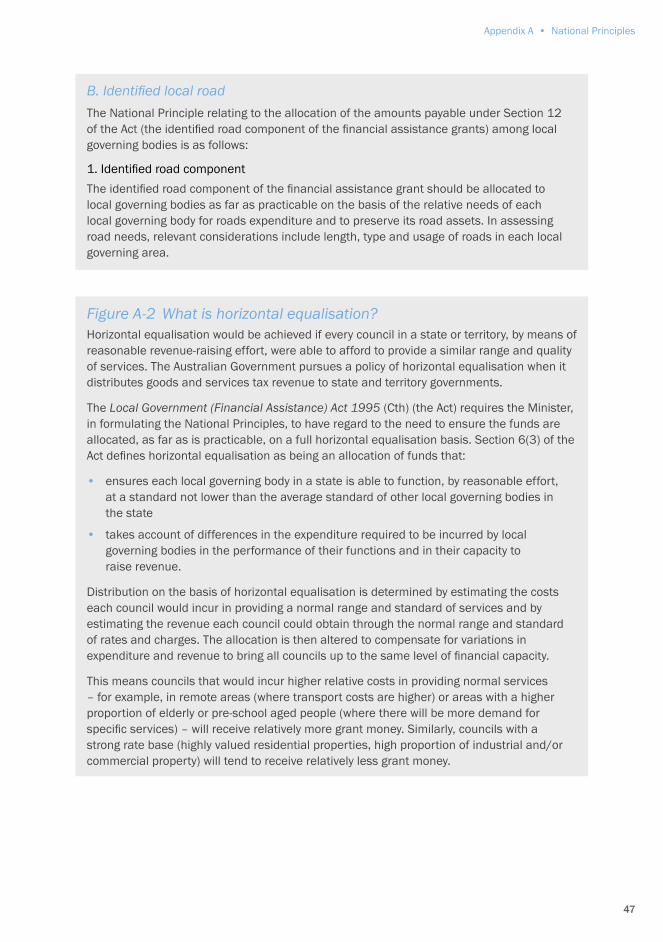
47
Appendix A • National Principles
B. Identified local road The National Principle relating to the allocation of the amounts payable under Section 12 of the Act (the identified road component of the financial assistance grants) among local governing bodies is as follows:
1. Identified road componentThe identified road component of the financial assistance grant should be allocated to local governing bodies as far as practicable on the basis of the relative needs of each local governing body for roads expenditure and to preserve its road assets. In assessing road needs, relevant considerations include length, type and usage of roads in each local governing area.
Figure A-2 What is horizontal equalisation?Horizontal equalisation would be achieved if every council in a state or territory, by means of reasonable revenue-raising effort, were able to afford to provide a similar range and quality of services. The Australian Government pursues a policy of horizontal equalisation when it distributes goods and services tax revenue to state and territory governments.
The Local Government (Financial Assistance) Act 1995 (Cth) (the Act) requires the Minister, in formulating the National Principles, to have regard to the need to ensure the funds are allocated, as far as is practicable, on a full horizontal equalisation basis. Section 6(3) of the Act defines horizontal equalisation as being an allocation of funds that:
• ensures each local governing body in a state is able to function, by reasonable effort, at a standard not lower than the average standard of other local governing bodies in the state
• takes account of differences in the expenditure required to be incurred by local governing bodies in the performance of their functions and in their capacity to raise revenue.
Distribution on the basis of horizontal equalisation is determined by estimating the costs each council would incur in providing a normal range and standard of services and by estimating the revenue each council could obtain through the normal range and standard of rates and charges. The allocation is then altered to compensate for variations in expenditure and revenue to bring all councils up to the same level of financial capacity.
This means councils that would incur higher relative costs in providing normal services – for example, in remote areas (where transport costs are higher) or areas with a higher proportion of elderly or pre-school aged people (where there will be more demand for specific services) – will receive relatively more grant money. Similarly, councils with a strong rate base (highly valued residential properties, high proportion of industrial and/or commercial property) will tend to receive relatively less grant money.


49
BState and territory government and local government association submissions
This appendix contains the submissions from state and territory governments and local government associations. Headings have been standardised and minor edits made to achieve consistency in the report.
The Local Government (Financial Assistance) Act 1995 (Cth) (the Act) requires that the relevant state and territory minister and bodies representative of local government be consulted when preparing this report.
Section 16 of the Act notes that:
1. The Minister must, as soon as practicable after 30 June in each year, cause a report or reports to be prepared about the operation of this Act in respect of the year.Note: The first report under this subsection will relate to the year beginning on 1 July 1995; see the definition of year in subsection 4(2).
2. The Minister must ensure that relevant State Ministers and a body or bodies representative of local government are consulted in connection with the preparation of a report under subsection (1).
3. The report or one of the reports must include an assessment by the Minister (based on comparable national data), in relation to the year, of:a. the extent (if any) to which the allocation of funds for local government purposes has
been made on a full horizontal equalisation basis as mentioned in paragraph 6(2)(a); and
b. the methods used by the Local Government Grants Commissions in making their recommendations; and
c. the performance by local governing bodies of their functions including:
i. their efficiency; and
ii. services provided by them to Aboriginal and Torres Strait Islander communities.
4. The Minister must cause a copy of each report to be laid before each House of the Parliament as soon as practicable after the report has been prepared.
All state and territory governments and local government associations were invited to make submissions. Local Government New South Wales did not provide a submission. Joint submissions were provided by South Australia and Tasmania. Individual submissions were received from the Australian Local Government Association; governments of New South Wales, Victoria, Queensland, Western Australia, Australian Capital Territory and Northern Territory; and the local government associations of Victoria, Queensland, Western Australia and the Northern Territory.

50
Local Government National Report 2014–15
Report from the New South Wales Government
The extent to which the allocation of funds for local government purposes for your jurisdiction has been made on a full horizontal equalisation basisBased on the New South Wales Local Government Grants Commission’s assessment model there is a widening shortfall between the assessed needs and the available funds as a result of council costs increasing at a greater rate than the escalation factor applied to the funding. The per capita minimum grant principle is an impediment to the New South Wales Local Government Grants Commission’s capacity to fund councils on a full horizontal equalisation basis.
Tools and methodologies employed to achieve horizontal equalisationThe New South Wales Local Government Grants Commission attempts to assess the extent of disadvantage across local governing bodies resulting from demographic and economic disparities. The method used excludes, as far as it is practical to do so, the policies and practises of the individual entities. The approach taken considers revenue raising capacity (revenue allowances) and cost disadvantage in the provision of services (expenditure allowances).
The principal source of income for councils is property based rates. Accordingly, the New South Wales Local Government Grants Commission’s revenue assessment model is based on comparative property values applied to a state-wide rate-in-the-dollar. Councils with low property values are assessed as being disadvantaged (positive allowances). Councils with high property values are assessed as being advantaged (negative allowances). That is, the theoretical revenue capacity of each council is equalised against the state average council. The rating, financing and entrepreneurial policies of individual councils are excluded from the modelling.
Expenditure allowances are calculated for 21 council services (for example: libraries, health, planning and building control, recreation, roads, etc.). A disability factor (or cost adjuster) is determined for each service for each council. The disability factor is the estimate of the extent of relative disadvantage, expressed as a percentage, of the state-wide average cost of providing each service. Disability factors are based on objective measures (for example: location and distance, terrain and climate, cultural and social diversity, indigenous population, age, etc.). Each council’s disability factor measure is compared to state-wide averages. The resulting disability factors are weighted to determine the final disability factor. The weighting that is applied is designed to reflect the significance of each measure in terms of its expected additional cost impact.
If, for example, it is estimated that it would cost a council 10 per cent more than the state-wide average for a library service because of demographic and geographic reasons, then the disability factor would be 10 per cent. The council would receive an allowance based on 10 per cent of the state-wide average cost for library services.
To be consistent with the horizontal equalisation principle, the approach taken is designed to exclude the policies and practices of each individual council.
Data (and its limitations) used to enable accurate assessment of horizontal equalisationThe data needs of the New South Wales Local Government Grants Commission are satisfactorily met. As far as it is possible to do so, the New South Wales Local Government Grants Commission sources its data needs from non-council agencies.

51
Appendix B • NSW
The data sourced from councils is averaged, on a rolling basis, over a number of years and is used to calculate state averages. Accordingly, the significance of any poor quality reporting, data errors or aberrations in the data has no direct impact on an individual council’s grant.
The New South Wales Local Government Grants Commission data concerns include:
• poor quality local roads and bridge length data and its subsets (vehicle movements; heavy vehicle movements; terrain; subgrade; and availability of materials etc.)
• lack of robust indicators of non-resident use and tourism (service population)
• inadequate environmental measures at local government levels.
The methodology used for distributing funding under the Financial Assistance Grant programme to local government for 2014–15 by your local government grants commissionThe New South Wales Local Government Grants Commission methodology has not changed significantly since 2013–14. The two components of the grant are distributed on the basis of principles developed in consultation with local government and consistent with the National Principles of the Local Government (Financial Assistance) Act 1995 (Cth).
General purpose componentThe general purpose component of the grant attempts to equalise the financial capacity of councils. The New South Wales Local Government Grants Commission uses the direct assessment method. The approach taken considers cost disabilities in the provision of services (expenditure allowances) and an assessment of councils’ relative capacity to raise revenue (revenue allowances).
Expenditure allowances are calculated for each council for a selected range of council services. The allowances attempt to compensate councils for expected above average costs resulting from issues that are beyond their control. Council policy decisions concerning the level of service provided or if there is a service provided at all, are not considered in order to be consistent with the effort neutral principle.
Expenditure allowances are calculated for 21 council services. These services are: general administration and governance; aerodromes; services for aged and disabled; building control; public cemeteries; services for children; general community services; cultural amenities; control of dogs and other animals; fire control and emergency services; general health services; library services; noxious plants and pest control; town planning control; recreational services; stormwater drainage and national report flood mitigation; street and gutter cleaning; street lighting; and maintenance of urban local roads, sealed rural local roads, and unsealed rural local roads.
An additional allowance is calculated for councils outside the Sydney statistical division that recognises their isolation. The general formula for calculating expenditure allowances is:
Number of units x standard cost x disability factor
where the:
• number of units is the measure of use for the service for the council. For most services the number of units is the population, for others it may be the number of properties or the length of roads

52
Local Government National Report 2014–15
• standard cost represents the state average cost for each of the 21 selected services. The calculation is based on a state-wide average of councils’ net costs, excluding extreme values, using selected items from Special Schedule 1 of councils’ financial reports, averaged over five years
• disability factor is the measure of disadvantage for the council.
A disability factor is the New South Wales Local Government Grants Commission’s estimate of the additional cost, expressed as a percentage, of providing a standard service due to inherent characteristics that are beyond a council’s control. For example, if it is estimated that it would cost a council 20 per cent more than the standard for a library service because of issues such as: non-resident borrowers aged population, student numbers, non-English speaking community, and population distribution, then the disability factor would be 20 per cent. Consistent with the effort neutral principle, the New South Wales Local Government Grants Commission does not compensate councils for cost differences that arise due to policy decisions of the council, management performance or accounting differences.
For each service the New South Wales Local Government Grants Commission has identified a number of variables that are considered to be the most significant in influencing a council’s expenditure on that particular service. These variables are termed disabilities. A council may have a disability due to inherent factors such as topography, climate, traffic, or duplication of services. In addition to disabilities identified by the New South Wales Local Government Grants Commission, other disabilities relating to individual councils may be determined. These may arise where unique circumstances have been identified as a result of council visits or special submissions. The general approach to calculating a disability factor is to take each disability relating to a service and to apply the following formula:
Disability factor = (council measure ÷ standard measure – 1) x 100 x weighting
where the:
• council measure is the individual council’s measure for the disability being assessed (population growth for example)
• standard measure is the state standard (generally the average) measure for the disability being assessed
• weighting is meant to reflect the significance of the measure in terms of the expected additional cost. The weightings have generally been determined by establishing a factor for the maximum disability based on a sample of councils or through discussion with peak organisations.
Negative scores are not generally calculated. That is, if the council score is less than the standard, a factor of zero is substituted. The factors calculated for each disability are then added together to give a total disability factor for the service.
The New South Wales Local Government Grants Commission uses the inclusion approach in the treatment of specific purpose grants for library services and local roads. This means the disability allowance is discounted by the specific purpose grant as a proportion of the standardised expenditure.
The deduction approach is used for services where the level of specific purpose payment assistance is related to council effort. This method deducts specific purpose grant amounts from all councils’ expenditure before standard costs are calculated. The New South Wales Local

53
Appendix B • NSW
Government Grants Commission considers the deduction approach to be more consistent with the effort neutral requirement specified in the National Principles.
The New South Wales Local Government Grants Commission also calculates an allowance for additional costs associated with isolation. The isolation allowance is calculated using a regression analysis model based on the additional costs of isolation and distances from Sydney and major regional centres. Only councils outside the greater Sydney statistical area are included. An additional component of the isolation allowance is included which specifically recognises the additional industrial relations obligations of councils in western New South Wales.
A pensioner rebate allowance is calculated which recognises that a council’s share of pensioner rebates is an additional cost. Councils with high proportions of ratepayers that qualify for eligible pensioner rebates are considered to be more disadvantaged than those with a lower proportion.
Revenue allowances attempt to compensate councils for their relative lack of revenue-raising capacity. Property values are the basis for assessing revenue-raising capacity because rates, based on property values, are the principal source of a council’s income. Importantly, property values are also considered to be a useful indicator of the relative economic strength of local areas.
The New South Wales Local Government Grants Commission’s methodology compares land values per property for the council to a state standard value and multiplies the result by a state standard rate-in-the-dollar. For comparative purposes the New South Wales Local Government Grants Commission purchases valuation data that has been calculated to a common base date for all councils by the New South Wales Valuer General. To reduce seasonal and market fluctuations in the property market, the valuations are averaged over three years. In the revenue allowance calculation, councils with low values per property are assessed as being disadvantaged and are brought up to the average (positive allowances), while councils with high values per property are assessed as being advantaged and are brought down to the average (negative allowances). That is, the theoretical revenue-raising capacity of each council is equalised against the state standard. The New South Wales Local Government Grants Commission’s approach excludes the rating policies of individual councils (effort neutral).
Separate calculations are made for urban and non-urban properties. Non-rateable properties are excluded from the New South Wales Local Government Grants Commission’s calculations because the calculations deal with relativities between councils, based on the theoretical revenue-raising capacity of each rateable property.
In developing the methodology, the New South Wales Local Government Grants Commission was concerned that use of natural weighting would exaggerate the redistributive effect of the average revenue standards. That is, the revenue allowances are substantially more significant than the expenditure allowances. As the National Principles provide that: ‘revenue allowances may be discounted to achieve equilibrium with the expenditure allowances’, both allowances are given equal weight. The discounting helps reduce the distortion caused to the revenue calculations as a result of the property values in the Sydney metropolitan area. The objective approach to discounting revenue allowances reduces the extreme positives and negatives calculated, yet maintains the relativities between councils established in the initial calculation.
The New South Wales Local Government Grants Commission does not specifically consider rate pegging, which applies in New South Wales. The property based calculations are essentially dealing with relativities between councils and rate pegging affects all councils.

54
Local Government National Report 2014–15
Movements in the grant allocations are caused by annual variations in property valuations, standard costs, road and bridge length, disability measures or population.
The New South Wales Local Government Grants Commission, because of the practical and theoretical problems involved, does not consider the requirements of councils for capital expenditure. In order to assess capital expenditure requirements, the New South Wales Local Government Grants Commission would have to undertake a survey of each council’s infrastructure needs and then assess the individual projects for which capital assistance is sought. This would undermine council autonomy, because the New South Wales Local Government Grants Commission, rather than the council, would be determining which projects were worthwhile. Further, councils that had failed to adequately maintain their assets could be rewarded at the expense of those that did maintain them.
The issue of funding for local water and sewerage undertakings was examined during the process of consultation between the New South Wales Local Government Grants Commission, the then Local Government and Shires Associations, and local government generally.
The Local Government and Shires Associations of the time and local governments recommended to the New South Wales Local Government Grants Commission that water and sewerage services not be included because:
• not all councils in New South Wales perform such services
• the level of funds available for other council services would be significantly diminished if such services were considered
• inclusion would result in a reduced and distorted distribution of funds to general purpose councils
• the state government makes other sources of funds and subsidies available to councils for such services.
The New South Wales Local Government Grants Commission agreed and accordingly, water and sewerage services are excluded from the distribution formula.
The New South Wales Local Government Grants Commission views income from council business activities as a policy decision and, therefore, does not consider it in the grant calculations (effort neutral). Similarly, losses are not considered either.
Debt servicing is related to council policy and is therefore excluded from the New South Wales Local Government Grants Commission’s calculations. In the same way, the consequences of poor council decisions of the past are not considered.
Generally, the level of a council’s expenditure on a particular service do not affect grant allocations. Use of a council’s expenditure is generally limited to determining a state standard cost for each selected service. The standard costs for these services are then applied to all councils in calculating their grant. What an individual council may actually spend on a service has very little bearing on the standard cost or its grant.
Efficient councils are rewarded by the effort neutrality approach to the calculations. To illustrate this, two councils with similar populations, road networks, property values, and disability measures would receive a similar grant. The efficient council can use its grant funds to provide better facilities for its ratepayers. The inefficient council cannot provide additional services to its ratepayers. Therefore, the efficient council will benefit from its efficiency.

55
Appendix B • NSW
Council categories have no bearing on the grant allocations. Categories simply provide a convenient method of grouping councils for analysis purposes.
Effective from 1 July 2006, the National Principles embodied an amalgamation principle that states:
Where two or more local governing bodies are amalgamated into a single body, the general purpose grant provided to the new body for each of the four years following amalgamation should be the total of the amounts that would have been provided to the former bodies in each of those years if they had remained separate entities.
No New South Wales councils currently require protection under this provision.
Local road componentThe method of allocating the local road component is based on a simple formula developed by the New South Wales roads authority. The formula uses councils’ proportion of New South Wales’ population, local road length and bridge length. Details of the formula are discussed below.
Formula – general purpose expenditure allowancesAllowances for most services are calculated on the following general formula:
Ac = Nc × Es × Dc
where: Ac = allowance for the council for the expenditure serviceNc = number of units to be serviced by councilEs = standard expenditure per unit for the serviceDc = disability for the council for service in percentage terms
Formula – road length allowancesIn addition to the disability allowances, road length allowances are calculated for each road type based on the following formula:
Ac = Nc × Es × Lc
–Ls
Nc Ns
where: Ac = allowance for road length allowanceNc = number of relevant properties for the councilEs = standard cost per kilometre
Lc= council’s relevant length of road per relevant property
Nc
Ls= standard relevant length of road per relevant property
Ns

56
Local Government National Report 2014–15
Isolation allowancesIsolation allowances are calculated for all non-metropolitan councils based on the formula:
Ac = Pc × ([Dsc × K1] + [Dnc × K2] + Ic)
where: Ac = the isolation allowance for each councilPc = the adjusted population for each councilDsc = the distance from each council’s administrative centre to
SydneyDnc = the distance from each council’s administrative centre to the
nearest major regional centre (a population centre of more than 20 000)
Ic = the additional per capita allowance due to industrial award obligations (if applicable)
K1 and K2 are constants derived from regression analysis
Specific purpose paymentsAllowances for services are discounted where appropriate to recognise the contribution of specific purpose grants. The discount factor that generally applies is:
1 – Gc
(Nc x Es) + Ac
where: Gc=
the specific purpose grant received by the council for the expenditure service
Nc = number of units to be serviced by councilEs = standard expenditure per unit for the serviceAc = allowance for the council for the expenditure service
Formulae – revenue allowances, generalThe general formula for calculating revenue allowances is:
Ac = Nc × ts × (Ts – Tc)
where: Ac = revenue allowance for the councilNc = number of properties (assessments)ts = standard tax rate (rate-in-the dollar)Ts = standard value per propertyTc = council’s value per property
The standard value per property (Ts) is calculated as:
Ts =Sum of rateable values for all councils
Sum of number of properties for all councils
The standard tax rate (ts) is calculated as:
ts = Sum of net rates levied for all councilsSum of rateable values for all councils

57
Appendix B • NSW
Pensioner rebates allowancesThe general formula for the allowance to recognise the differential impact of compulsory pensioner rates rebates is:
Ac = Rc × Nc × (Pc – Ps)
where: Ac = the allowance for the councilRc = the standardised rebate per property for the councilNc = the number of residential propertiesPc = the proportion of eligible pensioner assessments for the councilPs = the proportion of eligible pensioner assessments for all councils
The standardised rebate for the council is:
Rc = 0.25 × Tc × ts
where: Tc = the average value per residential property in the councilts = the standard tax rate (rate-in-the dollar) for residential
properties
The maximum value for Rc is set at $125. Tc and ts are calculated as for the revenue allowances except only residential properties are used.
PrinciplesGeneral purpose (equalisation) componentThese principles, consistent with the National Principles of the Local Government (Financial Assistance) Act 1995 (Cth), are based on an extensive programme of consultation with local government. The agreed principles are:
1. General purpose grant allocations to local governing bodies will be allocated as far as practicable on a full equalisation basis as defined in the Local Government (Financial Assistance) Act 1995 (Cth); that is a basis which attempts to compensate local governing bodies for differences in expenditure required in the performance of their functions and in their capacity to raise revenue.
2. The assessment of revenue and expenditure allowances of local governing bodies will, as far as is practicable, be independent of the policy or practices of those bodies in raising revenue and the provision of services.
3. Revenue-raising capacity will primarily be determined on the basis of property values; positive and negative allowances relative to average standards may be calculated.
4. Revenue allowances may be discounted to achieve equilibrium with expenditure allowances.
5. Generally, for each expenditure function an allowance will be determined using recurrent cost; both positive and negative allowances relative to average standards may be calculated.
6. Expenditure allowances will be discounted to take account of specific purpose grants.
7. Additional costs associated with non-resident use of services and facilities will be recognised in determining expenditure allowances.

58
Local Government National Report 2014–15
Local road componentFinancial assistance, which is made available as an identified local road component of local government financial assistance, shall be allocated so as to provide Aboriginal communities equitable treatment in regard to their access and internal local road needs.
1. Urban [metropolitan] area means an area designated as an ‘urban area’:a. the Sydney Statistical Division
b. the Newcastle Statistical District
c. the Wollongong Statistical District.
2. Rural [non-metropolitan] area means an area not designated as an ‘urban area’
3. Initial distribution:a. 27.54 per cent to local roads in urban areas
b. 72.46 per cent to local roads in rural areas
4. Local road grant in urban areas. Funds will be allocated:a. 5 per cent distributed to individual councils on the basis of bridge length
b. 95 per cent distributed to councils on the basis of
i. 60 per cent distributed on length of roads
ii. 40 per cent distributed on population
5. Local road grant in rural areas. Funds will be allocated:a. 7 per cent distributed to individual councils on the basis of bridge length
b. 93 per cent distributed to councils on the basis of
i. 80 per cent distributed on length of roads
ii. 20 per cent distributed on population
6. DataPopulation is based on the most up-to-date estimated resident population figures available from the Australian Bureau of Statistics.
Road length is based on the most up-to-date data available to the New South Wales Local Government Grants Commission for formed roads, which are councils’ financial responsibility.
Bridge length is based on the most up-to-date data available to the New South Wales Local Government Grants Commission for major bridges and culverts six metres and over in length, measured along the centre line of the carriageway, which are councils’ financial responsibility.
The method of application of the statistics shall be agreed to between representatives of the New South Wales Local Government Grants Commission and the Local Government Association of New South Wales.

59
Appendix B • NSW
Changes to the methodology for distributing funding to local government under the Financial Assistance Grant programme for 2014–15 from that used in 2013–14In 2013–14, the New South Wales Local Government Grants Commission put in place strategies to deliver improved outcomes to smaller rural communities, generally those with resident populations below 10 000. This decision, which resulted from the New South Wales Local Government Grants Commission’s observations during their rounds of public hearings, was consistent with the New South Wales Independent Local Government Review Panel’s findings. The strategies included:
• applying a weighting to the standard cost for unsealed local roads in the general purpose component of the grant on the basis that the standard cost did not reflect the inability of small rural councils to adequately fund these roads
• a reassessment of a small number of other discretionary disability factors in the administration and governance function
• removal of the urban density measure from the recreation function.
In addition, the long-standing upper capping limit that had applied to movements in the general purpose component was relaxed to more quickly move funds to smaller rural remote councils.
To help minimise the budgetary impact of sudden and unexpected grant reductions, the New South Wales Local Government Grants Commission continued the long-standing arrangement of a lower limit on grant movements for the general purpose component.
These strategies were extended for the 2014–15 year to help reduce the impact for councils most reliant on grant funding. The strategies for 2014–15 include:
• for a second year the standard cost for unsealed local roads in the general purpose component has been weighted
• replacing the population growth measure with a measure for below average population growth in the administration function
• removing the population growth measure from the planning and building control function
• reviewing and in many cases removing a number of other disability factors across a range of expenditure functions
• continued relaxing of the upper capping limit to facilitate the effect of the grant changes to rural remote councils.
When compared to 2013–14, the 2014–15 general purpose component grant outcomes results in:
• grants to metropolitan Greater Sydney reducing on average by 2.1 per cent
• grants to non-metropolitan councils increasing by 0.8 per cent
• five councils receiving double-digit increases in their general purpose component – Balranald (10.7 per cent), Bourke (12.4 per cent), Brewarrina (13.1 per cent), Carrathool (11.9 per cent), and Central Darling (11.4 per cent)
• 12 councils being protected by a capped lower limit of a five per cent reduction – Ashfield, Bankstown, Blacktown, Canterbury, Fairfield, Hawkesbury, Liverpool, Marrickville, Penrith, Queanbeyan, Sydney and Waverley
• the number of minimum grant councils increasing by one to 24, with a further two councils expected to move to the minimum grant in 2015–16.

60
Local Government National Report 2014–15
Developments in the use of long-term financial and asset management plans by local governmentAll councils in New South Wales now report under an integrated planning and reporting framework. This is designed to improve councils’ strategic community planning, including long-term financial and asset management planning, as well as streamline reporting to the community. The integrated planning and reporting framework requires councils to prepare the following plans:
• Community engagement strategy
• Community strategic plan – 10 year + timeframe
• Delivery program – four-year timeframe
• Operational plan – one-year timeframe
• Resourcing strategy – including a long-term financial plan (10 years+), asset management policy, strategy and plans (10 years+), and workforce management strategy (four years).
The integrated planning and reporting framework is designed to ensure that councils approach investing in infrastructure and economic development in a sustainable way, with a view to the future and to delivering outcomes for the community.
All New South Wales councils have planned and reported under the integrated planning and reporting framework since 1 July 2012. The New South Wales Office of Local Government supports implementation of this framework through resources, workshops and advice.
For 2014–15, the New South Wales Office of Local Government continued to provide oversight and support for councils developing and implementing long-term financial and asset management plans. In part, this has been undertaken through the Promoting Better Practice review programme, which aims to improve the viability and sustainability of councils by providing an assessment of council practices and overall health.
The Promoting Better Practice programme involved reviewing financial and asset management plans and offering support and advice to ensure they are effectively implemented as an integrated part of council’s operations. Councils’ long-term financial planning and asset management planning has improved and the New South Wales Office of Local Government will continue to work closely with councils to ensure ongoing improvements across New South Wales.
Actions to develop and implement comparative performance measures between local governing bodiesThe New South Wales Office of Local Government’s 2013–14 Comparative Information on New South Wales Local Government Councils marks the 24th year the publication has been produced. The report contains a range of performance indicators.
Data sources include council financial reports, rating records and population data from the Australian Bureau of Statistics. The information collected has also been used to calculate funding under the Financial Assistance Grant programme, analyse councils’ financial health, and check compliance of rates collected. To promote use, transparency and accountability the New South Wales Office of Local Government continues to make the publication and the raw data freely available and accessible via the internet.

61
Appendix B • NSW
The 2013–14 publication includes a whole of sector overview as well as a two-page snapshot of each council and incorporates relevant high level demographic and socio-economic indicators for each local government area.
Building on previous changes made to the report, the 2013–14 publication features more user-friendly and informative modes of presenting council data. At the same time, New South Wales is undertaking further work to develop a new local government performance measurement framework.
The New South Wales Office of Local Government is working collaboratively with councils to develop a set of core, consistent performance indicators that will build a picture of overall council performance. This framework will build on existing financial and other performance data and is designed to capture the overall efficiency and effectiveness of councils. This project will enable councils to drive their own improvement over time, enhance accountability and assist the New South Wales Government and others to better understand and support performance.
In late 2013, a discussion paper was issued as part of the first stage of council and public consultation on a new approach to performance measurement. Since that time, the New South Wales Office of Local Government has worked with councils, sector representatives and other interested organisations to develop a more detailed outline of the proposed framework and a set of draft indicators for further consultation.
Reforms undertaken during 2014–15 to improve the efficiency and effectiveness of local government service delivery
Stronger councils, stronger communitiesIn 2014–15, the New South Wales Government initiated a comprehensive package of measures to revitalise local government together with a record investment of up to $1 billion. This is designed to strengthen councils and their communities and will involve streamlining legislation, cutting red tape and improving council performance.
Building Fit for the FutureThe Fit for the Future package of local government reform follows four years of consultation and review since the Destination 2036 summit in 2011. At the summit, the New South Wales Government met face-to-face with all councils in New South Wales to discuss challenges impacting the efficiency and effectiveness of councils and to develop solutions for creating a stronger local government system. Destination 2036 triggered a number of reviews to better understand the changes local government needed to become sustainable. This included:
• Financial Sustainability Review of New South Wales Local Government
• New South Wales Local Government Infrastructure Audit
• Local Government Acts Taskforce
• Independent Local Government Review Panel.
The Local Government Acts Taskforce was appointed to review the Local Government Act 1993 (NSW) and City of Sydney Act 1988 (NSW) to ensure both laws continue to meet the current and future needs of the community and local government in New South Wales.
At the same time, the Independent Local Government Review Panel undertook a three-year independent examination of individual councils and the system of local government as a whole to investigate and identify options for governance models, structural arrangements and

62
Local Government National Report 2014–15
boundary changes in New South Wales. The Independent Local Government Review Panel’s Final Report was issued for public comment early in 2014. After considering submissions from councils and other relevant stakeholders, the New South Wales Government released its response to that report as part of the Fit for the Future package of local government reform.
Fit for the FutureIn September 2014, the New South Wales Government released its plan to create stronger and more effective councils in A blueprint for the future of local government. This set out a pathway to achieving a shared vision of the future which recognises the differing needs of Greater Sydney, regional and rural areas and the far west of New South Wales. It addresses the need to reform the system of local government and councils within it.
The Fit for the Future process, launched as part of this package, asked councils to consider their position, assess their performance and prepare a plan to systematically improve their outlook. This encourages councils to rethink their scale and focus so they can continue to meet community needs. The Fit for the Future assessment included four key criteria, with scale and capacity being the primary consideration. The other three criteria focus on councils’ current performance against standard industry benchmarks. Councils were asked to consult with their communities before submitting their proposals to the Independent Pricing and Regulatory Tribunal and the Independent Expert Panel for assessment.
Supporting councilsIn support of this package, the New South Wales Government offered significant financial and other support to help councils develop their proposals, consult their communities and plan for implementation. This support package included:
• $258 million in direct investment to support councils who are ready to undertake voluntary mergers with neighbouring councils
• $13 million in additional funding to ensure that local elected representatives are involved in transition processes where councils merge
• $5.3 million to establish and support new joint organisations
• $4 million to help small rural councils develop innovative ways of working
• expert assistance for merging councils to explore the options and prepare a sound business case
• individual support and assistance for councils from the New South Wales Office of Local Government’s One Stop Shop and regional relationship managers
• access to information, tools and technical experts to help councils prepare their Fit for the Future proposals.
These benefits will be further supported by potential savings of up to $600 million across New South Wales from cheaper finance for Fit for the Future councils and through efficiency savings of streamlined legislation and cutting red tape.
Between October 2014 and April 2015, the New South Wales Office of Local Government also offered a range of guidance material and support for councils developing their proposals, as well as undertaking a series of webinars and workshops for councils across New South Wales. Further, between May and June 2015, the Independent Pricing and Regulatory Tribunal consulted with councils on the assessment methodology for the Fit for the Future process before finalising that methodology.

63
Appendix B • NSW
Other key initiativesIn 2014–15, the New South Wales Government committed to a significant number of new reforms to improve the effectiveness and efficiency of local government in New South Wales. A number of these initiatives are underway or have already been delivered. These include:
• a new Local Government Act – this will build a new, more streamlined principles-based law centred around Integrated Planning and Reporting through a series of amendment Bills
• a new TCorp Borrowing Facility – Treasury Corporation has established a New South Wales borrowing facility to help Fit for the Future councils to access cheaper finance. This will help to provide new local infrastructure
• an independent review of regulatory and compliance burden – the Independent Pricing and Regulatory Tribunal has been commissioned to undertake this review to identify further opportunities to avoid duplication and eliminate red tape for local government and provide practical recommendations on improving the system
• improving accountability – the New South Wales Government has committed to a series of legislative and administrative changes to ensure councils manage their finances responsibly and are accountable to the community for their performance. These changes include regular sustainability assessments and support to improve; more rigorous revenue policies; and a new role for the New South Wales Auditor-General in overseeing council performance
• a review of the local government rating system – the New South Wales Government has committed to review the current rating system, to address specific equity issues raised by the Independent Local Government Review Panel, while ensuring that ratepayers are protected from unfair rate rises and pensioner concessions are maintained
• creating a model for regional joint organisations – the New South Wales Government is investing more than $5 million for joint organisations. These joint organisations will help councils to be more involved in regional planning; strengthen opportunities for regional leadership and capacity building; and ensure that people in regional communities have a strong advocate for their needs. The New South Wales Office of Local Government is working with five groupings of councils to pilot the new joint organisation model
• redirecting funding under the Financial Assistance Grant programme – the New South Wales Office of Local Government is working with the New South Wales Grants Commission to consider opportunities to redirect funding under the Financial Assistance Grant programme to communities with the greatest need. This will help smaller rural and remote communities to address some of the challenges of the future.
The New South Wales Office of Local Government is also developing a consistent performance measurement framework for councils and a comprehensive programme to support improvement. The New South Wales Joint Organisations is continuing to work with local councils on this key initiative to drive improvement in efficient and effective service delivery.
Initiatives undertaken and services provided by local governments to Aboriginal and Torres Strait Islander communitiesAll councils in New South Wales are required to prepare Integrated Planning and Reporting plans to facilitate community strategic planning and delivery of council services to best meet community needs.

64
Local Government National Report 2014–15
The Integrated Planning and Reporting framework recognises that most communities share similar aspirations such as opportunities for social interaction, liveable places, opportunities for employment, reliable services and infrastructure and a sustainable environment. The difference lies in how each council and community responds to their own particular needs.
The Integrated Planning and Reporting framework allows councils and communities to respond flexibly to local need.
The Integrated Planning and Reporting guidelines include the requirement for a community strategic plan to be developed in consultation with groups within the local community and based on principles of social justice. These requirements include considering the needs of Aboriginal and Torres Strait Islander people within each local community.
Local government reform activities in the areas of deregulation and legislative change by the New South Wales GovernmentDuring 2014–15, the following legislation was passed by the New South Wales Parliament:
• City of Sydney Amendment (Elections) Act 2015 (NSW) which gave effect to the recommendation of the New South Wales Parliament’s Joint Standing Committee on Electoral Matters that non-residential electors (who contribute in excess of 75 per cent of the rating revenue of the City of Sydney) be given a proportionate voice at elections for the council by providing for the automatic enrolment of up to two eligible non-residential electors with respect to each land holding in the City of Sydney (based on the model the applies to the City of Melbourne).
• Local Government Amendment (Elections) Act 2015 (NSW) which gave effect to other recommendations made by the New South Wales Parliament’s Joint Standing Committee on Electoral Matters including giving prescribed councils the option of conducting their elections by way of universal postal voting instead of attendance voting and allowing councils to opt to fill vacancies arising in the first 18 months of their terms through use of a count back instead of holding a by-election.
During 2014–15, the Local Government (General) Amendment (Elections) Regulation 2015 (NSW) was made which gave effect to other recommendations made by the New South Wales Parliament’s Joint Standing Committee on Electoral Matters including providing for electors of the City of Sydney to be automatically qualified for postal and pre-poll voting and requiring the New South Wales Electoral Commissioner and General Mangers as election managers to report on certain information.

65
Appendix B • Vic.
Report from the Victorian Government
The extent to which the allocation of funds for local government purposes for your jurisdiction has been made on a full horizontal equalisation basisThe Victoria Grants Commission allocates general purpose and local roads grants in accordance with the National Principles formulated under the Local Government (Financial Assistance) Act 1995 (Cth).
The methodology used for distributing funding under the Financial Assistance Grant programme to local government for 2014–15 by your Local Government Grants CommissionFor each council, a ‘raw grant’ is obtained which is calculated by subtracting the council’s ‘standardised revenue’ from its ‘standardised expenditure’.
The available general purpose grants pool is then allocated in proportion to each council’s raw grant, taking into account the requirement in the Australian Government legislation and associated National Principles to provide a minimum grant to each council. Increases and decreases in general purpose grant outcomes have been capped, which also affects the relationship between raw grants and actual grants.
Specific grants are allocated to a small number of councils each year in the form of natural disaster assistance. These grants are funded from the general purpose component and so reduce the amount allocated on a formula basis. Details of natural disaster assistance grants allocated for 2014–15 are found on page 80.
Standardised expenditureUnder the Victoria Grants Commission’s general purpose grants methodology, standardised expenditure is calculated for each council on the basis of nine expenditure functions. Between them, these expenditure functions include virtually all council recurrent expenditure.
The structure of the model ensures that the gross standardised expenditure for each function equals aggregate actual expenditure by councils, thus ensuring that the relative importance of each of the nine expenditure functions in the Victoria Grants Commission’s model matches the pattern of actual council expenditure.
The total recurrent expenditure across all Victorian councils in 2014–15 was $7122 million. Under the Victoria Grants Commission’s methodology, the gross standardised expenditure in the allocation model for 2014–15 therefore equals $7122 million, with each of the nine expenditure functions assuming the same share of both actual expenditure and standardised expenditure.
For each function, with the exception of local roads and bridges, gross standardised expenditure is obtained by multiplying the relevant major cost driver by: the average Victorian council expenditure on that function, per unit of need; and a composite cost adjustor which takes account of factors that make service provision cost more or less for individual councils than the Victorian average.

66
Local Government National Report 2014–15
Major cost drivers (‘units of need’)The major cost drivers and average expenditures per unit for each expenditure function, with the exception of local roads and bridges, are summarised in Table B-1.
Table B-1 Victorian major cost drivers and average expenditures per unit
Expenditure function Major cost driver Average expend per unit ($)
Governance Population (adjusted) 68.16
Family and community services Population 133.47
Aged and disabled services Population >60 + disability pensioners + carer’s allowance recipients
415.27
Recreation and culture Population 263.87
Waste management Number of dwellings 298.62
Traffic and street management Population 117.84
Environment Population (adjusted) 66.04
Business and economic services Population (adjusted) 166.28
Several different major cost drivers are used. These are viewed by the Victoria Grants Commission as being the most significant determinant of a council’s expenditure need for a particular function.
For three expenditure functions (governance; environment and business; and economic services), an adjusted population is used as the major cost driver to recognise the fixed costs associated with certain functional areas.
The major cost drivers used in assessing relative expenditure needs for these functions take account of high rates of vacant dwellings at the time the census is taken. Councils with a vacancy rate above the Victorian average are assumed to have a population higher than the census-based estimate. For the governance function, councils with an actual population of less than 20 000 are deemed to have a population of 20 000. For the environment function, councils with a population less than 15 000 are assumed to have a population double that amount, to a maximum of 15 000.
Cost adjustorsA number of cost adjustors are used in various combinations against each function. These allow the Victoria Grants Commission to take account of the particular characteristics of individual councils which impact on the cost of service provision on a comparable basis. Each cost adjustor has been based around a state weighted average of 1.00 with a ratio of 1:2 between the minimum and maximum values, to ensure that the relative importance of each expenditure function in the model is maintained.
The 14 cost adjustors used in the calculation of the 2014–15 general purpose grants are: aged pensioners; population growth; English proficiency; population less than six years old; environmental risk; regional significance; Indigenous population; remoteness; urban roads; scale; population density; socio-economic; population dispersion; and tourism.
Because some factors represented by cost adjustors impact more on costs than others, different weightings have been used for the cost adjustors applied to each expenditure function. The Victoria Grants Commission did not make any adjustments to the relative cost adjustor weightings for the 2014–15 allocation.

67
Appendix B • Vic.
Net standardised expenditureNet standardised expenditure was obtained for each function by subtracting standardised grant support (calculated on an average per unit basis) from gross standardised expenditure. This ensures that other grant support is treated on an inclusion basis.
Average grant revenue on a per unit basis (based on actual grants received by local government in 2013–14) is shown in Table B-2.
Table B-2 Victorian average grant revenue
Expenditure function Major cost driver Average grants per unit ($)
Governance Population (adjusted) 3.68
Family and community services Population 36.41
Aged and disabled services Population >60 + disability pensioners + carer’s allowance recipients
183.18
Recreation and culture Population 7.27
Waste management Number of dwellings 0.20
Traffic and street management Population 1.51
Environment Population (adjusted) 1.32
Business and economic services Population (adjusted) 2.95
Diagrammatically, the calculation of net standardised expenditure for each expenditure function is shown in Figure B-1.
Figure B-1 Net standardised expenditure (for each function)
Gross StandardisedExpenditure
Standardised GrantRevenue
Net StandardisedExpenditure
“Unit of Need”
“Average Grant Revenue Per Unit”
“Unit of Need”
“AverageExpenditure
Per Unit”
“Cost Adjustors”
Less Equals
Standardised expenditure for the local roads and bridges expenditure function within the general purpose grants model is based on the grant outcomes for each council under the Victoria Grants Commission’s local roads grants model. This incorporates a number of cost modifiers (similar to cost adjustors) to take account of differences between councils. Net standardised expenditure for this function for each council is calculated by subtracting other grant support (based on actual identified local roads grants and a proportion of Roads to Recovery Programme grants) from gross standardised expenditure.
The total standardised expenditure for each council is the sum of the standardised expenditure calculated for each of the nine expenditure functions.

68
Local Government National Report 2014–15
Standardised revenueA council’s standardised revenue is intended to reflect its capacity to raise revenue from its community. Relative capacity to raise rate revenue, or standardised rate revenue, is calculated for each council by multiplying its valuation base (on a capital improved value basis) by the average rate across all Victorian councils. The payments in lieu of rates received by some councils for major facilities such as power stations and airports have been added to their standardised revenue to ensure that all councils are treated on an equitable basis.
Rate revenue raising capacity is calculated separately for each of the three major property classes (residential, commercial/industrial/other and farm) using a three-year average of valuation data.
The derivation of the average rates for each of the property classes is shown in Table B-3.
Table B-3 Victorian derivation of the average rates
CategoryTotal average valuations
($ billions)Total rate revenue
($ billions)Average rate
$
Residential 1051.896 23.019 0.00287
Commercial/industrial/other 203.942 0.733 0.00360
Farm 77.851 0.244 0.00314
The Victoria Grants Commission constrains increases in each council’s assessed revenue capacity to improve stability in grant outcomes. The constraint for each council has been set at the state-wide average increase in standardised revenue adjusted by the council’s own rate of population growth to reflect growth in the property base.
A council’s relative capacity to raise revenue from user fees and charges, or ‘standardised fees and charges revenue’, also forms part of the calculation of standardised revenue.
For each council, for each of the nine functional areas, the relevant driver (such as population) is multiplied by the adjusted Victorian median revenue from user fees and charges (adjusted to remove the skewing effect of large outliers in the data). For some functions, this is then modified by a series of revenue adjustors to take account of differences between municipalities in their capacity to generate fees and charges, due to their characteristics.
The standard fees and charges used for each function (based on adjusted median actual revenues generated by local government in 2012–13) are shown in Table B-4, along with the revenue adjustors applied.
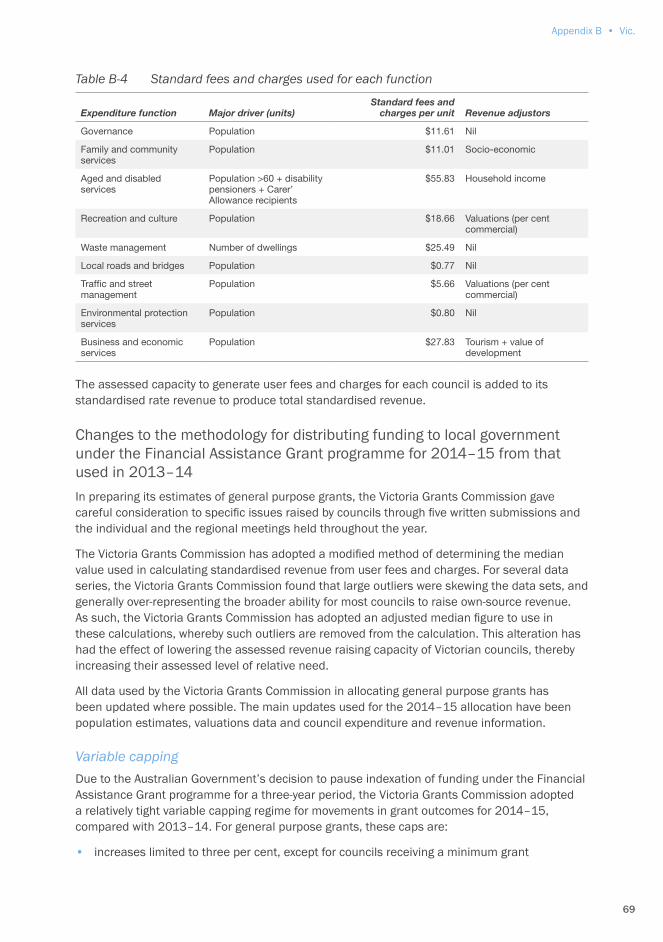
69
Appendix B • Vic.
Table B-4 Standard fees and charges used for each function
Expenditure function Major driver (units)Standard fees and
charges per unit Revenue adjustors
Governance Population $11.61 Nil
Family and community services
Population $11.01 Socio-economic
Aged and disabled services
Population >60 + disability pensioners + Carer’ Allowance recipients
$55.83 Household income
Recreation and culture Population $18.66 Valuations (per cent commercial)
Waste management Number of dwellings $25.49 Nil
Local roads and bridges Population $0.77 Nil
Traffic and street management
Population $5.66 Valuations (per cent commercial)
Environmental protection services
Population $0.80 Nil
Business and economic services
Population $27.83 Tourism + value of development
The assessed capacity to generate user fees and charges for each council is added to its standardised rate revenue to produce total standardised revenue.
Changes to the methodology for distributing funding to local government under the Financial Assistance Grant programme for 2014–15 from that used in 2013–14In preparing its estimates of general purpose grants, the Victoria Grants Commission gave careful consideration to specific issues raised by councils through five written submissions and the individual and the regional meetings held throughout the year.
The Victoria Grants Commission has adopted a modified method of determining the median value used in calculating standardised revenue from user fees and charges. For several data series, the Victoria Grants Commission found that large outliers were skewing the data sets, and generally over-representing the broader ability for most councils to raise own-source revenue. As such, the Victoria Grants Commission has adopted an adjusted median figure to use in these calculations, whereby such outliers are removed from the calculation. This alteration has had the effect of lowering the assessed revenue raising capacity of Victorian councils, thereby increasing their assessed level of relative need.
All data used by the Victoria Grants Commission in allocating general purpose grants has been updated where possible. The main updates used for the 2014–15 allocation have been population estimates, valuations data and council expenditure and revenue information.
Variable cappingDue to the Australian Government’s decision to pause indexation of funding under the Financial Assistance Grant programme for a three-year period, the Victoria Grants Commission adopted a relatively tight variable capping regime for movements in grant outcomes for 2014–15, compared with 2013–14. For general purpose grants, these caps are:
• increases limited to three per cent, except for councils receiving a minimum grant

70
Local Government National Report 2014–15
• decreases limited to minus two per cent for metropolitan and regional centre councils
• decreases limited to minus one per cent for rural councils.
Minimum grantsThe available general purpose grants pool for Victorian councils represents, on average, $68.60 per head of population (using Australian Bureau of Statistics population estimates as at 30 June 2013). The minimum grant National Principle requires that no council may receive a general purpose grant that is less than 30 per cent of the per capita average (or $20.58 for 2014–15).
Without the application of this principle, general purpose grants for 2014–15 for 13 councils – Bayside, Boroondara, Glen Eira, Hobsons Bay, Kingston, Manningham, Melbourne, Monash, Moonee Valley, Port Phillip, Stonnington, Whitehorse and Yarra – would have been below the $20.58 per capita level. The minimum grant principle has resulted in the general purpose component to these councils being increased to this level.
Estimated entitlementsA summary of the changes in estimated general purpose entitlements from 2013–14 to 2014–15 is shown in Table B-5.
Table B-5 Summary of the changes in estimated general purpose entitlements
Change in general purpose component Number of councils
Increase of more than 3%* 1
Increase of 3% (capped) 11
Increase of 0% to <3% 44
Decrease of 0% to <–1% (rural) 1
Decrease of 0% to <–2% (metro, regional centres) 11
Decrease of –1% (capped) (rural) 7
Decrease of –2% (capped) (metro, regional centres) 4
Total 79
Note: * Increase exceeds 10% due to the City of Melbourne’s minimum grant council status.
Natural disaster assistanceThe Victoria Grants Commission provides funds from the general purpose grants pool to councils which have incurred expenditure resulting from natural disasters. Grants of up to $35 000 per council per eligible event are provided to assist with repairs and restoration work. Twenty-three grants to 17 councils have been allocated for 2014–15, totalling $709 722. This is a considerable decrease from the 40 grants provided in 2013–14, totalling $1 209 661.
Recommended natural disaster assistance grants from the 2014–15 allocation are shown in Table B-6.

71
Appendix B • Vic.
Table B-6 Recommended natural disaster assistance grants for 2014–15
Council Event type ($)
Alpine Floods and bushfires (two events) 42 426
Ballarat Storms 35 000
Banyule Floods 35 000
Bass Coast Heavy rainfall 35 000
Benalla Floods and storms (two events) 70 000
Campaspe Floods 35 000
Cardinia Storms 25 662
Central Goldfields Floods and windstorms 35 000
Golden Plains Bushfires 35 000
Greater Geelong Storms 35 000
Greater Shepparton Storms 14 048
Indigo Storms and tornado (two events) 44 600
Mildura Floods 30 000
Mount Alexander Floods and storm 35 000
Pyrenees Floods and bushfires (three events) 105 000
Strathbogie Floods and bushfires (two events) 62 986
Towong Floods 35 000
Total 709 722
Methodology for local roads fundingThe Victoria Grants Commission’s formula for allocating the local roads component is based on each council’s road length (for all surface types) and traffic volumes, using average annual preservation costs for given traffic volume ranges. The methodology also includes a set of five cost modifiers for freight loading, climate, materials, sub-grade conditions and strategic routes and takes into account the deck area of bridges on local roads. The formula is designed to reflect the relative needs of Victorian councils in relation to local roads funding consistent with the National Principle relating to the allocation of local roads funding.
Road and traffic volume dataThe allocation of the local roads component for 2014–15 has been based on traffic volume data reported by all councils for the 12 months to June 2013. Similar to previous years, councils were asked to categorise their local road networks according to nine broad traffic volume ranges – four for urban roads and five for rural roads.
Victorian councils reported a total of 129 881 kilometres of local roads as at 30 June 2013, an increase of 419 kilometres or 0.3 per cent more than the length reported 12 months earlier. This is a result of growth on Melbourne’s urban fringes, as well as councils’ ongoing review of road type categories as assets registers are revised and improved. Variations are provided in Table B-7.

72
Local Government National Report 2014–15
Table B-7 Variations in the length of local roads
Change in length of local roads Number of councils
Increase of more than 5% 2
Increase of 1% to 5% 13
Increase of up to 1% 23
No change 26
Decrease of up to 1% 8
Decrease of 1% to 5% 7
Decrease of more than 5% 0
Total 79
Asset preservation costsAverage annual preservation costs for each traffic volume range were used in the allocation model to reflect the cost of local road maintenance and renewal.
The asset preservation costs remained unchanged from 2013–14 for the 2014–15 allocations are shown in Table B-8.
Table B-8 Average annual preservation costs for each traffic volume range
Local road type Daily traffic volume range Annual asset preservation cost ($)
Urban <500 3600/km
500 – <1000 4900/km
1000 – <5000 6600/km
5000+ 10 700/km
Rural Natural surface 350/km
<100 2500/km
100 – <500 5200/km
500 – <1000 5800/km
1000+ 6600/km
Timber bridge 100/m2
Concrete bridge 60/m2
Cost modifiersThe allocation model uses a series of five cost modifiers to reflect differences in circumstances between councils in relation to: the volume of freight generated by each council; climate; the availability of road-making materials; sub-grade conditions; and strategic routes.
Cost modifiers are applied to the average annual preservation costs for each traffic volume range for each council to reflect the level of need of the council relative to others. Relatively high cost modifiers add to the network cost calculated for each council, and so increase its local roads grant outcome. No changes were made to the cost modifiers for the 2014–15 allocation.
Grant calculationThe Victoria Grants Commission calculates a total network cost for each council’s local roads. This represents the relative annual costs faced by the council in maintaining its local road

73
Appendix B • Vic.
Figure B-2 Calculation of the network cost for a single traffic volume range
Length oflocal roads in
category
Assetpreservation
cost for category
Overall costfactor*
Network Costx x =
* Overall cost modifier is calculated by multiplying the cost modifier for freight, climate, materials, reactive sub-grades and strategic routes.
and bridge networks, based on average annual preservation costs and taking account of local conditions, using cost modifiers.
The network cost is calculated using traffic volume data for each council, standard asset preservation costs for each traffic volume range, and cost modifiers for freight carriage, climate, materials availability, sub-grade conditions and strategic route lengths. The deck area of bridges on local roads is included in the network cost at a rate of $60 per square metre for concrete bridges and $100 per square metre for timber bridges.
Mathematically, the calculation of the network cost for a single traffic volume range for a council is illustrated in Figure B-2.
The actual local roads grant is then determined by applying the available funds in proportion to each council’s calculated network cost.
Variable cappingDue to the Australian Government’s decision to pause indexation of funding under the Financial Assistance Grant programme for a three-year period, the Victoria Grants Commission has adopted a relatively tight variable capping regime for movements in grant outcomes for 2014–15, compared with 2013–14. For local roads grants, these caps are:
• no increases for councils receiving a minimum general purpose grant
• increases limited to three per cent for non-minimum grant councils
• decreases limited to minus two per cent for metropolitan and regional centre councils
• decreases limited to minus one per cent for rural councils.
Estimated entitlements 2014–15In general, where a significant change has occurred in a council’s local roads grant for 2014–15, this is due to a combination of:
• the significant changes made to the allocation model in 2013–14 still flowing through into the 2014–15 allocation
• changes in road classification from kerbed/un-kerbed to urban/rural road length
• changes in traffic volume data supplied by the council to the Victoria Grants Commission.
A summary of the changes in estimated local roads grant entitlements from 2013–14 to 2014–15 is shown in Table B-9.

74
Local Government National Report 2014–15
Table B-9 Changes in estimated local roads grant entitlements in Victoria
Change in local roads grant Number of councils
Increase of 3% (capped) 17
Increase of 0% to <3% 23
No change 11
Decrease of 0% to <–1% (rural) 2
Decrease of 0% to <–2% (metro, regional centres) 5
Decrease of –1% (capped) (rural) 13
Decrease of –2% (capped) (metro, regional centres) 8
Total 79
Developments in the use of long-term financial and asset management plans by local governmentThe Local Government (Planning and Reporting) Regulations 2014 (Vic) introduced greater standardisation in the planning and reporting of Victorian councils. Key strategic documents such as the annual budget, strategic resource plan including statutory financial statements must now be presented in accordance with the Local government model financial report. This model report is updated and issued annually. The inclusion of a four-year capital works program, including funding sources and also classifying works into renewal, upgrade, enhancement and new capital works further enhances the long-term financial planning of councils.
A move towards greater integration with planned Victorian infrastructure programmes has also been enhanced through this capital works reporting and analysis.
Improved alignment between long-term financial plans and asset management plans and strategies remains a priority with expenditure of $8.9 billion forecast over the next four years.
Local Government Victoria issued revised Best practice guidance in asset management practices in 2015. A key feature of this guidance has been the alignment with the Institute of Public Works Engineering Australasia Asset Infrastructure Financial Management Manual and commitment to participating in national benchmarking via the national assessment framework.
Actions to develop and implement comparative performance measures between local governing bodiesThe 2014–15 financial year was the first year all 79 councils had to report on a range of performance indicators, following the introduction of a new, compulsory performance reporting framework for Victorian councils. Over the year, councils collected data on indicators across 11 service areas including indicators of financial performance and sustainable capacity. Of the 66 indicators, seven are transitional measures that will be reported on from 2015–16 onwards. The framework also includes a checklist of 24 items considered essential for supporting good governance and management in local government.
To support the reporting and availability of performance information in one place, the new Know your council website (www.knowyourcouncil.vic.gov.au) was developed. The design and implementation of the website followed an extensive engagement and testing process with councils and the community.

75
Appendix B • Vic.
Councils’ results will be published on the new Know your council website as a part of their 2014–15 annual reports, and on an annual basis. This is the first time all performance information can be collected and compared in one location. Council results will be supported by their own narrative to explain results and tell their story.
In addition to comparative reporting and benchmarking, the Know your council website has a council directory and a ‘Guide to Councils’ with information about how councils work and the range of services delivered.
Reforms undertaken during 2014–15 to improve the efficiency and effectiveness of local government service delivery
Local government reformLocal Government Victoria continues to work collaboratively with the 79 Victorian councils in the pursuit of better practice in procurement and shared services. The formation of the Regional Procurement Excellence Network provides an important avenue to promote best practice and collaboration in procurement practices. It is via this network that successful collaborative procurement projects have been delivered.
The design of reform initiatives continues to be influenced by the accurate collation and reporting of financial data and in particular detailed analysis of established cohorts. Financial reporting reforms provide a solid foundation on which the community and governments can assess the value proposition and effectiveness of this reform tool.
Council profiling and a more sophisticated understanding of historical financial performance have been aligned to the analysis of financial strategies which, by legislation, must reflect all plans and strategies adopted by a council. This commitment to better align infrastructure provision between state and local governments will begin to bear fruit in the years ahead.
Strategic resource plansVictorian councils must prepare a four-year strategic resource plan under the Local Government Act 1989 (Vic). The strategic resource plan must take into account services and initiatives contained in any plan adopted by council and contain statements describing the required financial and non-financial resources. An analysis of council 2014–15 strategic resource plans indicated that Victorian councils collectively expect to spend over $8.95 billion on capital works over the next four years. Further analysis indicates that 74 per cent of this expenditure is committed to asset renewals and upgrades.
Natural disaster and emergency management responseLocal councils have a critical role in the planning and delivery of emergency management activities, particularly in supporting local communities. Local Government Victoria works in partnership with the Municipal Association of Victoria and Emergency Management Victoria to ensure local councils can effectively and sustainably meet their emergency management obligations.
As part of this role, Local Government Victoria provides secretariat support for municipal emergency management enhancement groups, which link councils at state and regional levels to collectively strengthen emergency management capability and capacity. The municipal emergency management enhancement groups are recognised as part of Victoria’s emergency

76
Local Government National Report 2014–15
management and planning committee structure in the Emergency management manual Victoria. The Municipal emergency management enhancement groups strategic plan 2015–20 sets the direction for greater understanding, collaboration and knowledge sharing within the emergency management sector.
The Victorian Government provides funding through the Municipal Emergency Resourcing Program to help rural, regional and peri-urban councils to ensure they have the staff and resources they need to prepare and support their communities in times of emergency. The Municipal Emergency Resourcing Program helps councils to prepare for and respond to emergency events and has supported changes in response to recommendations made by the 2009 Victorian Bushfires Royal Commission and the 2011 Victorian Floods Review, as well as activities to support vulnerable people in emergencies.
Total funding of $4.6 million was shared between 64 councils within Country Fire Authority districts in 2014-–15 through the Municipal Emergency Resourcing Program. An independent evaluation of the Municipal Emergency Resourcing Program was undertaken in 2015, and continuation of funding to all councils currently funded was announced by the Minister for Local Government in September 2015.
Initiatives undertaken and services provided by local governments to Aboriginal and Torres Strait Islander communitiesThe Victorian Government has built a community of practice within Victoria which supports councils to actively advance the interests of Aboriginal people in their roles as employer, service provider, statutory planning authority, local leader in reconciliation and procurer of services.
To underpin this, the Victorian Government has committed under its Ministerial Statement on Local Government to implement an Aboriginal Local Government Action Plan. Over 2014–15, Local Government Victoria, the Office of Aboriginal Affairs, the Municipal Association of Victoria, and Reconciliation Victoria held a series of workshops to underpin the development of the Aboriginal Local Government Action Plan. The plan is scheduled for release in 2016.
As an initial action, the Victorian Government has funded the Maggolee website. Maggolee provides examples of good practice in the way local government engage with Aboriginal communities. This includes policy and programmes, information on protocols and cultural awareness, contact information, relevant local data, news and events, among other information. The objective is for Maggolee to provide a platform to celebrate excellence and support improved practice among Victorian local governments engaging Aboriginal communities and advancing reconciliation.
The Local Government Aboriginal Employment Project, led by the Municipal Association of Victoria (which comprises representatives from all of Victoria’s 79 councils) continued to: support local government in their active engagement with Indigenous communities; support Indigenous communities as they strengthen their links with local government; encourage partnerships between the state and local governments dealing with Indigenous issues; and improve outcomes for Indigenous people and local government primarily in relation to reconciliation, service delivery, employment and cultural heritage.
Many Victorian councils continued to undertake outstanding work to advance reconciliation and improve service delivery to Aboriginal Victorians.

77
Appendix B • Vic.
Local government reform activities in the areas of deregulation and legislative change by the Victorian Government
Local Government Amendment (Improved Governance) Bill 2015The preparation of the Local Government Amendment (Improved Governance) Bill 2015 is underway to enhance the standard of behaviour in the local government sector, improve the framework for dealing with councillor misbehaviour and strengthen the integrity of council elections. This followed an extensive review undertaken of the councillor conduct framework and a range of other governance issues since May 2013. As part of this review, consultation was undertaken with the local government sector including peak bodies. Over 200 submissions were received.
The amendments to the Local Government Act 1989 (Vic) are proposed to come into operation in stages. It is envisaged that the first of these amendments will provide greater clarity to the role of councillor, mayor and CEO, abolishing funds for subdivisions and requiring councils to establish an election period policy.
Local Government Amendment (Fair Go Rates) Bill 2015In accordance with the Victorian Government’s commitment, legislation is being developed to provide a framework for capping local government rates. The Fair Go Rates System will be introduced for the 2016–17 financial year. Under the system, increases to municipal rates and charges will be capped in line with increases in the Consumer Price Index unless a council has obtained approval for a higher increase from the Essential Services Commission.
In February 2015, the Victorian Government commissioned the Essential Services Commission to undertake an inquiry and recommend how best to implement this policy.
The Fair Go Rates System will facilitate more opportunities for community engagement in prioritising the work of councils so that Victorians can be assured that their councils are pursuing greater value and have a better understanding of the work performed by councils. Sufficient flexibility has been built into the Fair Go Rates System to ensure that the financial sustainability of councils is not compromised and councils can continue to exercise their authority in responding to the needs and aspirations of the communities they serve.
Local government act reviewA comprehensive review of the Local Government Act 1989 (Vic) has commenced with the preparation of a discussion paper. The detailed discussion paper will look at all aspects of the Local Government Act 1989 (Vic) and will be made available through an interactive website designed to facilitate extensive consultation with the local government sector and the community. An independent advisory committee has been established to assess the submissions received and advise on reform directions throughout the review.
Reducing the local government reporting burdenAn initiative is underway to reduce the reporting burden on councils to enable local government to focus on delivering services important to their communities and improve efficiency. Local Government Victoria is leading work through the Local Government Inter-Departmental Network to identify local government requirements for streamlining or reduction across Victoria. Work is continuing to simplify funding agreements and further streamline reporting between state and local governments.

78
Local Government National Report 2014–15
Victorian state – local government agreementThe new Victorian State – Local Government Agreement was signed by the Victorian Minister for Local Government and Cr Bill McArthur, President of the Municipal Association of Victoria, on 10 September 2014. The simpler more practical agreement reflects feedback from mayors, council chief executive officers and peak bodies from across the state.
Councils in Victoria leading digital transformation
Melbourne City Council Chief Digital OfficerThe Melbourne City Council appointed a Chief Digital Officer to lead the council’s Smart City Office, bringing thinking and action in four key areas:
• ensuring Melbourne is a preferred location for start-ups and entrepreneurs in technology and biosciences
• building on Melbourne’s world-leading reputation as a centre for knowledge, research and higher education
• driving the transformation of City of Melbourne services to embrace customer focus, digital, agile development, and open data
• leading a decisive shift in Melbourne’s infrastructure management towards a ‘smart city’ model, getting more out of the city’s infrastructure because it talks to the internet.
Hume City Council library servicesThe Hume City Council has implemented a state-of-the-art digital management system for library services which streamlines the management of library resources and creates greater efficiency, productivity and improved customer service.
The Radio Frequency Identification System is a self-service system which transforms the way the customer interacts with the Hume City Council libraries and staff. In particular, staff are available to run programmes on the floor, providing greater levels of customer service to the community.

79
Appendix B • Vic.
Report from the Municipal Association of Victoria
Developments in the use of long-term financial and asset management plans by local governmentVictorian local government has clear statutory requirements to undertake long-term financial planning through strategic resource plans. Strategic resource plans provide a four year forecast of a council’s financial plan and is aligned to the actions within the council plan. That is, following an election, a council establishes its goals for a four-year period and the strategic resource plans provides the basis for how these goals will be achieved.
In practice, most councils provide long-term financial projections well beyond the mandatory four-year period, with many forecasting 10 years into the future. With the advent of the rates capping and variation framework, there will be an even greater focus on ensuring that the content of the strategic resource plans is well developed and underpinned by sound and realistic assumptions. Indeed, it is expected that the rates capping and variations framework structure will require councils to develop detailed business plans, service reviews and other analyses to support any required rate increases above the cap level.
Most councils in Victoria have advanced asset management planning capabilities, which have been enhanced by the Municipal Association of Victoria’s Step Asset Management Program, which is now a highly mature program that supports councils’ asset management capabilities.
Actions to develop and implement comparative performance measures between local governing bodiesThe Victorian Government’s performance measure project required councils to report the comparative performance data for the first time in their 2014–15 annual reports. The comparative data includes comprehensive range of measures including 66 service and financial measures and a checklist of 24 governance and management indicators. The data are presented on a public website (https://knowyourcouncil.vic.gov.au/) allowing the community to make comparisons between councils on a range of performance measures.
The Municipal Association of Victoria and councils have expressed some concerns about the comparability of all data presented. The exact role of community and municipal attributes in influencing councils’ performances are not well understood and will need to be explored further in the future to ensure any performance data is meaningful. Issues around comparability have been at least partially addressed by the system by providing important contextual information about each council; only allowing comparisons between similar types of councils; and restricting comparisons to four councils at any one time. However, there are some ongoing concerns that the comparisons do not address data deficiencies and can therefore mislead the community about the performance of their municipality.
Data would also be improved through the adoption of data quality statements to clearly highlight the limitations of the data sets and any factors that need to be considered in interpreting and/or comparing the data.

80
Local Government National Report 2014–15
Reforms undertaken during 2014–15 to improve the efficiency and effectiveness of local government service delivery
Local government funding vehicleThe Municipal Association of Victoria completed an Australian-first bond issue for the local government sector in 2014–15 through the Local Government Funding Vehicle.
Thirty councils from across Victoria participated in the bond issue, raising a volume of $240 million, across two tranches. The tranches provided councils with access to both five-year and seven-year fixed rate interest only loans. The Local Government Funding Vehicle is Australia’s first aggregated funding vehicle for local government and has been labelled as a landmark deal that will establish a municipal bond market in Australia. The Local Government Funding Vehicle has been estimated as having the capability to save the sector $100 million over ten years.
This project marks a major shift and maturing of the local government sector’s approach to debt – primarily moving away from traditional bank loans to directly access credit markets. The strong credit rating of the sector ensures it is able to access funding at a level below the wholesale funding costs of the major banks.
An additional consequence of the Local Government Funding Vehicle is a major shift in the behaviour of the commercial banks in response to this cheaper source of funding. In order to compete with the Local Government Funding Vehicle, the traditional bank loans available to local government have dramatically reduced in price, providing councils with extensive choice at highly competitive rates.
State-wide client management system for the Maternal and Child Health ProgramThe Municipal Association of Victoria in partnership with the Victorian Government has procured a new state-wide client management system for Maternal and Child Health Program, the Client Development Information System. The Maternal and Child Health Program is a universal service providing support for new parents and their babies from birth to 3.5 years of age and involves trained nurses monitoring the health and wellbeing of all infants in the state and seeking to provide support, guidance and monitoring and identifying at risk families.
The Client Development Information System makes the delivery of healthcare more effective and efficient by:
• improving safety and outcomes
• expediting service delivery
• maximising health care provider utilisation
• keeping costs under control by eliminating duplicate data entry and other significant redundancies.
The system was built as part of an integrated health care solution, the Electronic Knowledge and Information Data System, which is interoperable with legacy and future applications. Additionally, the Client Development Information System can easily be tailored to fit existing information requirements and workflow preferences.

81
Appendix B • Vic.
Within a reliable and secure centralised database, functionality includes: tracking client activity; service and history recording; referral workflow; appointment and clinical availability scheduling; clinical assessment; treatment and review; and detailed reporting.
Energy efficient street-lightingVictoria is facilitating the bulk change-over of inefficient mercury vapour streetlights. More than 60 councils have participated, resulting in significant energy and emissions savings as well as cost savings estimated at hundreds of millions, with associated significant environmental benefits for the community.
Planning reforms
Municipal Association of Victoria STEP Planning Improvement ProgramThe Municipal Association of Victoria in partnership with the Victorian Department of Environment, Land, Water and Planning completed a pilot of a new land use planning process improvement program to position the sector for the next wave of improvements and efficiencies.
The STEP Planning Improvement Program builds on the success of the previous Municipal Association of Victoria STEP Planning Improvement programme and responds to member feedback that to unlock further improvement in land use planning, a whole of council approach to improvement is required that looks at strategy planning, customer satisfaction and staff development.
The pilot is now complete. Feedback on the pilot is being used to inform the next steps. A total of 50 per cent of the sector has now participated in a Municipal Association of Victoria Planning Improvement Program.
Standard referral agreementsThe Municipal Association of Victoria in partnership with the Country Fire Authority established a working group of councils to develop standard referral agreements specifying conditions or requirements that an application must meet. If the conditions are met, a referral is not required and permit assessment is streamlined.
A standard referral agreement for lower categories of applications in Bushfire Management Overlay has been developed. The agreements will cut thousands of referrals out of the planning system and streamline the assessment process. The Country Fire Authority has confirmed that several councils are considering signing up to the agreements.
VicSmartThe Municipal Association of Victoria in partnership with the Victorian Department of Environment, Land, Water and Planning developed an audit and review process to assist councils with meeting the new VicSmart timeframes. Over 300 planners from across Victoria participated in the program. VicSmart is a new fast track planning process designed to streamline minor application. The system was introduced by the Victorian Government in 2014.

82
Local Government National Report 2014–15
Initiatives undertaken and services provided by local governments to Aboriginal and Torres Strait Islander communitiesSustained employment is key to the economic and social wellbeing of all Australians. For Aboriginal people to enjoy the benefits that flow from employment, they need to have jobs. Currently, very few Aboriginal people are employed in Victorian local government. To change this situation, considerable development work has been required, and for some years the Municipal Association of Victoria has been undertaking an Aboriginal employment project which seeks to assist Victorian Aboriginal people by increasing employment opportunities in local government. The Municipal Association of Victoria has provided its own resources towards this project alongside a contribution of funding from the Victorian Department of Economic Development, Jobs, Transport and Resources.
Through the development of a Victorian Local Government Aboriginal Engagement and Employment Framework, there has been increased participation of Aboriginal people in the local government sector. The framework, which is based on the structure of reconciliation action plans developed by Reconciliation Australia, has provided a tool for councils to align their employment strategies with the work councils have already undertaken through their reconciliation action plans. Specific outcomes in 2014–15 include:
• production of a state-wide employment framework tool
• facilitation and building of meaningful relationships between councils and their local Aboriginal communities is creating a better environment for employment of Aboriginal people
• the employment of an Aboriginal employment adviser at the Municipal Association of Victoria has given councillors and council staff greater confidence to become involved with and connect with local Aboriginal communities
• an associated increase of symbolic recognition of Aboriginal Australians in the local government setting, including greater numbers of councils flying the Aboriginal flag permanently outside council offices
• increased Aboriginal community knowledge of the local government sector through use of social media networks utilised by Aboriginal communities to promote local government positions
• more than 20 positions created within councils specifically for Aboriginal job candidates.
Local government reform activities in the areas of deregulation and legislative change by the Victorian Government
Rates capping and variationThe Victorian Government announced its intention to introduce a rates capping and variations framework for local government, commencing in 2016–17. In 2014–15, the Victorian Government requested that the Essential Services Commission undertake an inquiry into the appropriate framework for the rates capping and variations policy. The Essential Services Commission report will be completed in the first half of 2015–16 with the framework to commence on 1 July 2016. The proposed framework will establish a cap to rates and councils will be required to apply to the Essential Services Commission to increase their rates above the cap. It is likely that this will influence the type and level of long-term financial planning undertaken by councils.

83
Appendix B • Vic.
Governance reformThe Local Government Electoral Review panel completed its review of the sector’s electoral systems and structures. The review recommended significant reform to the electoral system used by the sector, including:
• broadening the voter franchise for council elections
• implementing compulsory voting across all voter classes
• changes to the candidate eligibility and nomination processes
• reform of campaign donation framework
• removal of candidates’ how-to-vote cards from the voter pack
• modest changes to the operation of the caretaker process
• changes to clarify the role of the Victorian Electoral Commission, including its role as a monopoly provider of electoral services to councils and their role as the handler of complaints about electoral matters
• the number of councillors for each municipality
• the basis for electoral structures selected by the Victorian Electoral Commission through their periodic electoral reviews.
Councils in Queensland leading digital transformation
Brimbank City Council – integrated online platformThe Brimbank City Council created an integrated online platform to assist residents and service users to access council’s services providing improved customer experiences for their community.
With business cases to develop the right digital infrastructure being very costly and hard to implement, Brimbank has taken a customer-centric approach through their business transformation project #CommunityFirst to make life easier for the community when dealing with council, rather than placing the primary importance on what is beneficial for the government. It is increasingly obvious that people in the community lead busy lives and typically do not seek to engage with the local council unless it is absolutely necessary, so giving them a great customer experience is very important. This has initiated some of the council’s goals to develop a new transaction based and mobile responsive website, a payment gateway and master customer database that will enable ‘one view of customer’, by April 2016. By advancing a strong digital and customer-focused agenda Brimbank City Council is aiming to show that it will yield many benefits for the community that demands to be able to interact with Brimbank City Council through digital means.
City of Boroondara online/mobile services and information modelIn building the new City of Boroondara online/mobile services and information model, the project will be adopting the design principles and criteria set down by the Australian Government Digital Service Standard. The City of Boroondara recognises that its current online and mobile presence needs to change to become a more customer centric service model in order to meet increasing customer expectations.

84
Local Government National Report 2014–15
Redevelopment of the City of Boroondara website and mobile presence as key customer-centric service channels will be a significant, enterprise-scale project that will occur on a multi-year schedule and involve substantial collaboration with both staff and the community as co-designers of the new digital services model.
The aim of the digital transformation programme is to transform the Boroondara digital customer experience into one that places the customer at the centre and delivers a more seamless, convenient and empowering experience for all customers.

85
Appendix B • Qld.
Report from the Queensland Government
The extent to which the allocation of funds for local government purposes for your jurisdiction has been made on a full horizontal equalisation basisThe Queensland Local Government Grants Commission currently uses four cost adjustors to achieve fiscal equalisation for the general purpose component, those being:
1. location – recognising that rural, remote and Indigenous communities generally have higher costs associated with service delivery
2. scale – recognising that smaller councils cannot achieve the economies of scale that larger, metropolitan councils can achieve
3. demography – recognising that the cost of service provision varies with demographic circumstances, in this case: children/youths under 19 years of age; people over 65 years of age; Aboriginal and Torres Strait Island people; and, out of recognition of higher morbidity and mortality rates, Aboriginal and Torres Strait Island people over 50 years of age
4. capacity to pay – recognising that the wider economic circumstances of a community may inhibit its ability to levy rates.
All the data for these cost adjustors is from the Australian Bureau of Statistics, except the location cost adjustor, which is based on the Accessibility/Remoteness Index for Australia, developed by the University of Adelaide. Scale and demography cost adjustors are derived from various population datasets, while capacity to pay is based on the Socio-Economic Index for Areas.
The Queensland Local Government Grants Commission has expressed a desire to use data that would indicate tourism and fly-in-fly-out and drive-in-drive-out workers. However, as this data is not currently available, expenses are not adjusted to accommodate these factors.
As below, the local roads component has remained unchanged, using the same simple formula as used in previous years. In the 2011–12 review of the methodology, submissions from councils in this regard almost uniformly agreed that the formula was appropriate.
The general purpose component was reviewed at the same time and it was decided that a higher number of the large, metropolitan councils should be on the minimum grant. The result was an increase of minimum grant councils from two to nine, with rural and Indigenous councils, which have limited revenue streams, to have their general purpose component raised significantly. To avoid sharp increases or decreases, a capping regime of plus 15 per cent and minus 10 per cent was implemented, with the aim of all councils being at their ‘natural’ allocation. Unfortunately, with the pausing of indexation under the Financial Assistance Grant programme from 2014–15, the Queensland Local Government Grants Commission felt it necessary to narrow these amounts to plus or minus three per cent until 2017–18 when the pause is removed.
The only remaining issue with regard to horizontal equalisation is road data, which can influence a council’s allocation. The Queensland Local Government Grants Commission has been undertaking audits of council road data since 2009–10, with a view to ensuring equity across Queensland. Interestingly, these audits have found approximately half of councils have been understating their road network, and thus have received a lower level of funding than they had been entitled. Therefore, the Queensland Local Government Grants Commission in its visitation programme places a large emphasis on quality of road data being submitted.

86
Local Government National Report 2014–15
The methodology used for distributing funding under the Financial Assistance Grant programme to local government for 2014–15 by your Local Government Grants Commission
General purpose componentA new methodology was implemented for the general purpose component in 2011–12 and has continued to be used since that point in time. The new methodology complies with the National Principles and no further changes were made for the 2014–15 grant allocation.
As in previous years, every local governing body in Queensland is entitled to a minimum grant under the National Principles. This minimum grant is equivalent to a per capita distribution of 30 per cent of the general purpose pool. In 2014–15, this amount equated to $20.56 per capita. The remaining 70 per cent of the general purpose pool is distributed according to relative need.
To determine relative need, the methodology derives averages for revenue raising and expenditure on service provision to be applied to all local governments within Queensland. Note that since 2013–14, data has been collected from all Indigenous councils, resulting in a more complete dataset and more accurate averages.
After application of these averages, the Queensland Local Government Grants Commission uses various cost adjustors which allow for factors outside a council’s control which affect its ability to raise revenue or provide services, again in keeping with the National Principles.
Assessing revenueThe Queensland Local Government Grants Commission uses the revenue categories of: rates; other grants and subsidies (as per the National Principles); garbage charges; and fees and charges. This is summarised in Table B-10.
The rating assessment has remained: the total state rate revenue is divided by the total state land valuation (10-year average) to derive a cent in the dollar average, which is then multiplied by each council’s total land valuation (10-year average). Note that both the state total and individual council valuation figures above are an average of ten years, to avoid excessive fluctuations.
This is then adjusted to allow for each council’s capacity to raise rates, using Australian Bureau of Statistics Socio-Economic Indexes for Areas. The methodology uses three of the indices:
• Index of Relative Socio-economic Advantage and Disadvantage (Socio-economic Indexes for Areas 2)
• Index of Economic Resources (Socio-economic Indexes for Areas 3)
• Index of Education and Occupation (Socio-economic Indexes for Areas 4).
Because Indigenous councils do not generally levy rates, 20 per cent of their Queensland Government Financial Aid allocation is used as a proxy for rate revenue.
Fees and charges are averaged on a per capita basis. Garbage revenue is averaged on the basis of the number of bins serviced for each local governing body.

87
Appendix B • Qld.
In accordance with the National Principle for other grant support, grants relevant to the expenditure categories considered by the Queensland Local Government Grants Commission are included as revenue according to the actual amounts received by council. Three grants are included by the Queensland Local Government Grants Commission, as follows:
• previous year’s local roads component of the Financial Assistance Grant programme (50 per cent)
• Queensland Government financial aid (Indigenous councils only – 20 per cent)
• minimum grant component of previous year’s general purpose component of the Financial Assistance Grant programme (100 per cent).
Table B-10 Queensland revenue assessment model
Revenue category Revenue driver(s) Unit of measure (state average)
Rates Total valuations Average cent in dollar rates: $0.01
Garbage charges Number of bins serviced $419 per bin serviced
Fees and charges Population $359 per capita
Other grants Actual grants received Identified road component of the Financial Assistance Grant programme (50 per cent used); state government financial aid (20 per cent) and minimum grant component of the general purpose grant allocation of the Financial Assistance Grant programme (100 per cent)
Assessing expenditureWith regards to the expenditure assessment, the Queensland Local Government Grants Commission includes nine service categories: administration; public order and safety; education, health, welfare and housing; garbage and recycling; community amenities, recreation, culture and libraries; building control and town planning; business and industry development; roads; and environment.
The Queensland Local Government Grants Commission considers which of the suite of cost adjustors are applied to which service categories. Table B-11 outlines the expenditure categories, the units of measure and the cost adjustors applied in assessing the cost of service provision.

88
Local Government National Report 2014–15
Table B-11 Outline of Queensland expenditure assessment 2014–15
Services cost adjustors
Service expenditure category 2014–15 unit of measure Loca
tion
Dem
ogra
ph
y –
Ind
igen
ous
Dem
ogra
ph
y –
age
Dem
ogra
ph
y –
Ind
igen
ous/
age
Sca
le
Administration Actual remuneration category + $406 per capita +
$422 per property/$135 per capita (Indigenous councils)
ü ü
Public order and safety $30 per capita ü ü ü ü ü
Education, health, welfare and housing
$26 per capita ü ü ü ü ü
Garbage and recycling $281 per bin/$94 per capita (Indigenous councils)
ü ü
Community amenities, recreation, culture and libraries
$180 per capita ü ü ü ü ü
Building control and town planning
$218 per residential property /$68 per capita (Indigenous councils)
ü ü
Business and industry development
$49 per capita ü ü
Environment $116 per residential property/$39 per capita (Indigenous councils)
ü ü
Roads Road expenditure assessment ü ü
Local roads componentThis component is allocated on the basis of the relative need of each local government for roads expenditure and to preserve its road assets. In the opinion of the Queensland Local Government Grants Commission, a formula based on road length and population best meets this National Principle for Queensland. The formula is: 62.85 per cent of the pool is allocated according to road length and 37.15 per cent of the pool is allocated according to population.
Roads expenditureThe Queensland Local Government Grants Commission uses an asset preservation model to assess road expenditure, estimating the cost to maintain a council’s road network, including bridges and hydraulics.
Table B-12 provides the traffic volumes, base cost and cost adjustors.

89
Appendix B • Qld.
Table B-12 Queensland road expenditure assessment model
Traffic volume range (adjusted vehicles per day)
Base cost
($/km)
Cost adjustors (%)
Climate Soil sub-gradeLocality on-cost Terrain
Favo
ura
ble
(TI -
50)
Ad
vers
e (T
I +10
0)
Goo
d (C
BR
>10
)
Poo
r (C
BR
<5)
MR
Rea
ctiv
e
<1.
0p/k
m^
2
<0.
1p/k
m^
2
Un
du
lati
ng
Hill
y
Mou
nta
inou
s
Rur
al
Unformed 294 – 25.0 – – – 5.0 10.0 2.0 5.0 –
<40 588 – 20.0 – – – 5.0 10.0 2.0 5.0 –
40–150 2812 – 20.0 – 10.0 10.0 5.0 10.0 2.0 5.0 –
150–250 5110 –10.0 15.0 –5.0 10.0 10.0 2.5 5.0 2.0 5.0 10.0
250–1000 7216 –7.5 10.0 –5.0 10.0 10.0 2.5 2.5 2.0 5.0 10.0
1000–3000 9136 –7.5 10.0 –5.0 10.0 10.0 2.5 2.5 2.0 5.0 10.0
>3000 12 583 –7.5 10.0 –5.0 10.0 10.0 2.5 2.5 2.0 5.0 10.0
Urba
n
<500 10 053 –7.5 10.0 –2.5 5.0 5.0 2.5 2.5 – 2.0 5.0
500–1000 15 634 –7.5 10.0 –2.5 5.0 5.0 2.5 2.5 – 2.0 5.0
1000–5000 24 853 –7.5 10.0 –5.0 10.0 10.0 2.5 2.5 – 2.0 5.0
5000–10 000 45 079 –7.5 10.0 –5.0 10.0 10.0 2.5 2.5 – 2.0 5.0
>10 000 77 046 –7.5 10.0 –5.0 10.0 10.0 2.5 2.5 – 2.0 5.0
Allowances are given for heavy vehicles, which increase the road usage, increasing a council’s road expenditure amount. These are outlined in Table B-13.
Table B-13 Allowances given for heavy vehicles in Queensland
Heavy Vehicle Allowance
Light to medium trucks, two axles = 1 vehicle
Heavy rigid and/or twin steer tandem = 2 vehicles
Semi-trailers = 3 vehicles
B doubles = 4 vehicles
Road trains = 5 vehicles
Cost adjustorsCost adjustors are indices applied to expenditure categories to account for factors outside a council’s control that impact the cost of providing services to its community.
The current methodology uses the following cost adjustors:
• location – represents the additional costs in the provision of services related to the council location and is based on the Accessibility/Remoteness Index for Areas
• scale – recognises economies of scale and is based on a sliding scale from one to two, with any council with a higher population than the average having a cost adjustor of one and the smallest council in Queensland with an adjustor of two

90
Local Government National Report 2014–15
• demography – represents the additional use of facilities and increased service requirements due to the composition of the population according to age and Indigenous descent. These are calculated on a sliding scale from one to two reflecting the proportion of residents who are Indigenous, aged, young and Indigenous people over 50 years of age.
Table B-11 identifies which cost adjustors are applied to the service categories.
Scaling backThe Queensland Local Government Grants Commission again used an equal weighting of proportional and equalisation scaling to ensure that each council received an equitable allocation, as the aggregate assessed need exceeded the quantum of the available funding for 2014–15.
Application of the minimum grant principleIn 2014–15, the Queensland Local Government Grants Commission determined, on the basis of the methodology, that the following nine councils were to receive the minimum grant allocation of the general purpose component: Brisbane City Council; Gold Coast City Council; Ipswich City Council; Logan City Council; Redland City Council; Moreton Bay Regional Council; Sunshine Coast Regional Council; Cairns Regional Council; and Noosa Shire Council.
Changes to the methodology for distributing funding to local government under the Financial Assistance Grant programme for 2014–15 from that used in 2013–14There were no changes to the methodology in 2014–15, with the exception of the capping regime used having been reduced to plus or minus three per cent.
Developments in the use of long-term financial and asset management plans by local governmentAll Queensland local governments are required to have long-term financial forecasts covering at least 10 years and to update the forecasts annually. To assist local governments to comply with this requirement, Queensland Treasury Corporation maintains the Local Government Forecast Model. The Local Government Forecast Model is available to all Queensland local governments and includes five years of historical data and 10 years of forecasts. In September 2014, Queensland Treasury Corporation released an updated Local Government Forecast Model version which incorporates improved features including the ability to undertake scenario modelling. A workshop series was conducted around Queensland to inform, educate and assist local government finance officers in the appropriate use and features of the model.
Actions to develop and implement comparative performance measures between local governing bodiesThe provision of information by the Queensland Government to the community continued through the 2013–14 Queensland local government comparative information report produced in 2014–15. This report assists local governments in their endeavours to develop new and more effective ways to deliver their services by providing an effective tool by which they can monitor trends over time and benchmark services performance both internally and with other councils.

91
Appendix B • Qld.
Reforms undertaken during 2014–15 to improve the efficiency and effectiveness of local government service deliveryFollowing the Queensland Auditor-General’s Report on Fraud Management in Local Government, the Queensland Government amended the Local Government Regulation 2012 (Qld) and the City of Brisbane Regulation 2012 (Qld) to require local governments to report fraud losses to both the Queensland Auditor-General and the Queensland Minister for Local Government. In addition, local governments are now required to keep written records of alleged and proven fraud-related losses.
These changes provide consistency with Queensland’s reporting requirements under the Financial and Performance Management Standard 2009 (Qld) and would enable the Queensland Department of Infrastructure, Local Government and Planning and the Queensland Audit Office to monitor reported fraud losses from local governments to identify possible training or support needs for those local governments disclosing large losses or numbers of losses.
Initiatives undertaken and services provided by local governments to Aboriginal and Torres Strait Islander communitiesThe Queensland Government continued to provide funding to Indigenous local governments to support the provision of local government services to their communities. In 2014–15, the funding pool for the Queensland State Government Financial Aid for Queensland’s 16 Indigenous councils was $31.8 million. This was provided across two components. $28.8 million was distributed with each council receiving an allocation, in lieu of rates, to assist in the delivery of local government services such as community and town planning, urban storm water management, roads, environment and transport and water and sewerage.
The $3 million Service Delivery Fund was the second component of the Queensland State Government financial aid in 2014–15. The objective of the Queensland State Government Financial Aid Service Delivery Fund was to support Indigenous councils to deliver services efficiently and build long-term financial sustainability by maximising opportunities to reduce operating costs and increase own-source revenue. Each Indigenous council received an allocation based on initiatives undertaken to reduce operating costs and to increase own-source revenue.
Other funding provided by the Queensland Government to Indigenous councils in 2014–15 included $3.5 million under the Revenue Replacement Program, an initiative under Queensland’s alcohol-related harm reduction strategy for nine Indigenous local governments that compulsorily surrendered their council-held liquor licences in 2009. Funding was provided to assist councils to maintain community services previously funded by the profits from alcohol sales.
Under the Indigenous Economic Development Grant programme, Queensland continued its commitment to support Indigenous councils to employ municipal services staff. Each eligible council received $80 000 to support 1.6 full-time equivalent positions, except for Yarrabah and Palm Island Aboriginal Shire Councils and Northern Peninsula Area Regional Council, which each received $160 000 to support 3.2 full-time equivalent positions.

92
Local Government National Report 2014–15
Local government reform activities in the areas of deregulation and legislative change by the Queensland GovernmentThe following local government legislative reforms implemented in 2014–15 further empower and support local governments to increase their efficiency and effectiveness:
• the Local Government Legislation Amendment Act 2014 (Qld) reforms the Local Government Electoral Act 2011 (Qld) by aligning, where appropriate, Queensland Government and local government electoral systems, including introducing voter photo identification and electronically assisted voting for the blind and vision impaired and voters needing help due to disability, motor impairment or insufficient literacy
• the Local Government and Other Legislation Amendment Act 2015 (Qld) returns to the Electoral Commission of Queensland the power to appoint the returning officer for a local government election to ensure that local government elections are run to the same standards of independence and efficiency as state and federal elections. The change continued the Queensland Reconstruction Authority after 30 June 2015 in recognition of the integral work of the Authority in preparing for, responding to, and recovering from, natural disasters
• the Building Queensland Act 2015 (Qld) came into effect on 3 December 2015 establishing Building Queensland as an independent statutory advisory body. This body aims to ensure a consistent and efficient standard of cost-benefit analysis of projects across the Queensland to make robust recommendations to the Queensland Government on infrastructure priorities
• the draft Local Government Legislation Amendment Regulation (No. 1) 2015 to implement a recommendation from the Queensland Audit Office report for the 2014–15 financial year Fraud Management in Local Government (tabled in the Queensland Parliament on 2 June 2015), that local governments report loss as a result of fraud and to keep written records of alleged and proven losses arising from fraud.
In 2012, as part of its red tape reduction initiative, the former Queensland Government undertook a review of the Local Government Act 2009 (Qld) and City of Brisbane Act 2010 (Qld), resulting in the amalgamation of six regulations under those Acts into two regulations. Regulatory requirements were decreased by 40 per cent through removing 448 requirements with the reduction largely due to a streamlining of regulation applying to local government business entities. In 2014–15, Queensland continued to work with local governments and the community to improve and reduce unnecessary regulation.
As part of its commitment to deliver better planning for Queensland, the Queensland Government has begun work on replacing the current planning legislation with a new and easy to understand planning legislation.
Councils in Queensland leading digital transformation
Townsville City Council – Cloud19 Strategy, MiTownsville Programme and Virtual TownsvilleTownsville City Council developed its Cloud19 Strategy in early 2015 to deliver a key information architecture business strategy providing the strategic direction for how council could leverage cloud services to improve service delivery and customer experience; improve asset and financial planning; and enable opportunities for collaborative partnerships within North Queensland.

93
Appendix B • Qld.
Council is progressing a managed communication, mobile, network, security and computer services tender to realise the expected benefits of the Cloud19 Strategy, while also putting in place the necessary cloud foundations, including contemporary identity management which is key to the success of cloud services implementation.
The Cloud19 Strategy has realised a number of successes, including the application of software systems: Office365, cloud-based intranet and internet redevelopment, and industry specific solutions such as Dial Before You Dig.
The recent implementation of the Virtual Desktop Strategy through a pilot deployment of 300 virtual desktops, as well as implementation of a more modern remote access solution has proven a key enabler of mobility, providing flexibility for the organisation and allowing access to information anywhere, anytime on any device.
The MiTownsville Programme was developed to leverage opportunities presented as a result of Townsville’s status as a first-release National Broadband Network site within Australia. A number of key initiatives have been successfully implemented providing direct benefit to the community, including:
• MiCouncil – public wi-fi (enhanced connectivity across numerous public spaces); Digital Citizenship (single ID pilot conducted)
• MiHub – community engagement (click to chat, video community engagement)
• MiCloud – business intelligence, data analytics, Big and Open Data (piloted to set the platform for future full scale deployment).
Spatial technologies are a key component of council’s digital programmes, with a number of initiatives integrating analytics with spatial technologies to deliver high-value analysis and modelling outcomes. Virtual Townsville provides a 3D spatial representation of Townsville for a range of applications including town planning, development assessment, disaster management and environmental modelling.
Ipswich City Council – InfoCity PlanIpswich City Council has put in place a range of online services for its ratepayers to use. It is also pushing ahead to be a leader of the digital economy with the Ipswich City Council InfoCity Plan to be underpinned by state-of-the-art broadband access. The Ipswich City Council has put in place a range of online services for its ratepayers to use, including: infringement notices, rate payments, rates enquiries, alternative payment options, invoice payments, animal registration renewal payments, new animal registration, licence payments, road closures, change of mailing address, Map Search, application enquiries, property enquiries, property and rates search, planning and development online and flood map search.

94
Local Government National Report 2014–15
Report from the Local Government Association of Queensland
Developments in the use of long-term financial and asset management plans by local governmentQueensland councils have legislative responsibilities for approximately $89 billion worth of community assets. The Local Government Association of Queensland and its subsidiaries currently provide over 50 different products, services and capabilities in the realm of asset management. Councils are asset centric businesses. A significant proportion of their annual budget is allocated to the operation, maintenance and renewal of existing assets in addition to providing new assets through capital investment. It therefore presents a significant risk and opportunity for councils requiring due care and attention.
The Queensland Auditor-General reported at June 2014, that local government assets totalled $72.1 billion with $1.5 billion spent during the financial year on asset renewals. Relative to the annual operating revenues of the Queensland State Government and the Australian Government, councils are significantly more asset intensive, and are by several degrees more responsible and more exposed to asset management efforts.
Queensland councils have (as a legislative requirement) developed, adopted and made use of long-term financial and asset management plans, with a strong focus on long-term sustainability. The Queensland Treasury Corporation maintained its local government support with its 10-year financial modelling tool and on-request financial sustainability assessments. The Local Government Association of Queensland’s Total Solutions also offers assistance to councils in improving asset management practices.
In June 2015, the Local Government Association of Queensland extended Queensland local government’s self-insurance operations to include council assets. The assets self-insurance scheme has an initial membership of 33 councils and this number is expected to increase as more councils come to the renewal date for their current cover. A key objective of the assets scheme is to directly assist member councils to enhance their asset management processes and outcomes. The first stage has commenced and involves risk engineers visiting councils and providing risk exposure and management advice for major assets. Direct support will also be provided to enhance asset registers and better integrate upgraded asset data with each council’s internal systems and operations.
In addition, activities undertaken by the Queensland Water Regional Alliance Program (a pilot launched in late 2011 in four regions to develop new joint water and sewerage management approaches) included operational staff training, aligning drinking water quality management plans across councils, price benchmarking, tendering arrangements, sharing laboratory services where possible and regional asset management frameworks. In 2015, the Queensland Government allocated $1.8 million over three years to retain and expand the Queensland Water Regional Alliance Program. Regional Queensland, along with New South Wales, is the only part of Australia where water services are provided primarily by local government.
Actions to develop and implement comparative performance measures between local governing bodiesAt the October 2014 Local Government Association of Queensland Annual Conference, Queensland councils committed to the establishment of the Better Councils, Better Communities campaign. This state-wide campaign aimed to focus attention on productivity,

95
Appendix B • Qld.
efficiency and innovation as drivers of improved financial sustainability. Three supporting initiatives were launched by the Local Government Association of Queensland to assist member councils:
• performance benchmarking service – called Ready.Set.Go.
• best practice portal – showcasing global, domestic and local case studies of local government innovation
• #77 Stories – a public website to promote the good work of Queensland councils.
The Ready.Set.Go. performance benchmarking service currently provides Queensland councils with access to 25 key performance indicators covering statutory performance ratios, financial sustainability, revenue sources, service levels, measures of efficiency along with socio-economic data. Additional key performance indicators will be added in 2016.
The service allows individual councils to compare their own performance over time (trend identification) as well as providing access to a range of simple visualisation tools that can be used to compare performance. Performance assessments within the service can be made with neighbouring shires, other Queensland councils of similar size or similar characteristics, and if required, with almost any other council within Queensland.
An additional benefit of the service is the ability to view multiple key performance indicators together helping to identify correlations and relationships between different performance measures and assisting with comprehension. Key performance indicators that lead to improved understanding and identification of asset management performance, changes in council revenues and changing socio-economic trends have been a particular focus of the project.
The Ready.Set.Go. performance benchmarking platform has been made available to all elected members and staff via the Local Government Association of Queensland’s state-wide local government portal. The Local Government Association of Queensland has also been working with both individual councils and regional groupings of councils on a number of satellite performance measurement and benchmarking projects aimed at further strengthening the collection and analysis of local government data.
Reforms undertaken during 2014–15 to improve the efficiency and effectiveness of local government service delivery
Online resourcesThe Local Government Association of Queensland continues to provide a large suite of online resources to local governments. A recent initiative was the establishment of the Legislation Compliance service. This subscription based service provides a central depository that contains local governments’ current legal compliance obligations (derived from both Australian Government and Queensland Government legislation). This service allows local governments to view, search, undertake assessments and run reports on their legal obligations. There are now 34 subscribers to the service, including one water authority. The service now contains over 6000 compliance obligations of which over 4500 are mandatory on local governments.
Shared service arrangementsQueensland councils continue to participate in large scale shared service arrangements primarily set up by the Local Government Association of Queensland as subsidiary companies.

96
Local Government National Report 2014–15
Independent analysis has shown these subsidiary businesses continue to save participating councils $100 million per annum (conservatively). They are:
• Local Government Infrastructure Services
• Total Solutions
• Propel Partnerships
• Local Buy
• Resolute IT
• LGM Queensland
• Local Government Workcare
• Queensland Local Government Health Plan.
Local Government Infrastructure ServicesLocal Government Infrastructure Services is an infrastructure advisory and innovation company celebrating 10 years serving local governments across Queensland. Local Government Infrastructure Services is wholly owned by the Local Government Association of Queensland and focused on delivering quality outcomes for councils. Significant achievements for this year include:
• securing construction approval for the first local government owned geothermal plant in Australia with a further 10 projects in development
• commencing work with Winton Shire Council to rebuild an improved visitor centre after the iconic Waltzing Matilda Centre was destroyed in a fire
• developing an innovative asset management service to support small to medium councils in decision making, resourcing and meeting regulatory requirements
• providing strategic advice on energy-saving initiatives for a range of Queensland councils, large and small, across the state
• developing a tailored waste pricing model for local government with the aim to share costs, knowledge, and future innovations.
Total SolutionsTotal Solutions is a fee-for-service tailored business solutions and training for councils. Services include industrial relations, organisational and economic development, governance and delegations support, performance management, media and communications planning, and executive level coaching and mentoring. Specifically developed during 2014–15 were:
• new accredited courses including Certificate IV and Diploma in Leadership and Management, Diploma of Local Government Administration – Asset Management Focus
• an upgraded internal audit service plus Audit Committee Panel for provision of independent audit committee members for smaller councils
• the launch of new eLearning services including hosted platform and new tailored content
• a wide range of new short courses focused on leadership and management skills and desktop applications
• new recruitment offerings to assist with hard-to-fill positions and a short-term contractor placement offering.

97
Appendix B • Qld.
Propel PartnershipsPropel Partnerships is a Special Purpose Vehicle joint venture specifically created in 2006 to partner with public sector organisations to drive efficiency and productivity primarily through customer services and support services led transformation programmes.
Propel Partnerships has in 2014–15 initiated two further partnerships creating Integrated Service Centres to provide these shared services to local governments. One of those partnerships has in its first year delivered over $1 million in efficiency gains. This year, Propel Partnerships instigated two new efficiency and productivity review market offerings designed to identify, quantify and drive efficiency and productivity across all local government operations, goods and services.
In terms of other shared services operations, the 24/7 Out of Hours and Disaster Management Contact Centre, launched in 2013 to offer standard out-of-hours call centre support and ongoing disaster management support to councils, continues to grow. Propel Partnerships has now partnered with 11 councils and four non-council clients including one Queensland Government department. In addition, a successful licensed debt recovery service is supporting three councils, and a records digitisation service is now well established supporting two additional councils.
Local BuyLocal Buy is a procurement business that was set up in 2001 to aggregate the buying power of local government, shorten procurement timeframes and streamline the interaction of business and councils. During 2014–15, key projects involved:
• developing and completing more training modules for council and on-line training services
• placement of a new officer in Townsville to service North Queensland
• completion and full operation of a Civil Works and Road Resurfacing Panel.
Resolute ITResolute IT is an information technology business that delivers web hosting, managing and consulting services, with over 80 per cent of Resolute’s customers based more than 200 kilometres from Brisbane. Resolute also assists councils with new hybrid cloud solutions.
Local Government Mutual Liability Queensland (LGM Queensland)LGM Queensland is a legal liability self-insurance scheme. The scheme’s financial position enabled it to determine that further surplus funds were available for distribution to members. With the support of the Local Government Association of Queensland, arrangements have been made for a total of $2 million to be distributed to continuing LGM Queensland members as part of the 2015–16 member contribution invoicing process. This distribution follows the membership dividend provided by way of a reduction in 2014–15 member contributions resulting in total 2014–15 contributions being less than those in 2013–14.
Members also continued to receive contribution rebates based on implementation of risk management procedures. LGM Queensland’s ongoing risk management support again included development and updating of advisory guides for management of risks associated with major local government responsibilities, upgrading of LGM Queensland’s free risk management software and on the ground professional support provided by regional risk coordinators.

98
Local Government National Report 2014–15
Local Government WorkcareLocal Government Workcare is a workers’ compensation self-insurance scheme jointly driven by Queensland councils, council controlled entities and the Local Government Association of Queensland. During 2014–15 Local Government Workcare determined that a further $2 million in surplus funds was available to be distributed to members during 2015–16. The distribution brings the total of surplus funds distributed by Local Government Workcare since its inception in 1998 to $14.4 million.
A priority of the scheme during 2014–15 has been to minimise the financial impact on members of ongoing uncertainty over workers’ compensation legislation and particularly the right of access to common law damages for workplace injuries. Local Government Workcare has taken a prudent approach to recognising savings from legislation introduced by the Queensland Government limiting common law access rights. This reflects the objective of maintaining a stable and predictable financial environment for members.
Local Government Workcare has also continued to refine the broad range of injury and risk management services provided to members. Further enhancement of the SAFE PLAN safety management system audit programme has provided members with new electronic tools that reduce the time taken to complete internal audits and prepare action plans. The internal audits form part of an integrated audit programme.
Queensland Local Government Health PlanQueensland Local Government Health Plan is a joint initiative of the Local Government Association of Queensland and Choosewell Health Link that aims to reduce health insurance costs for local government employees. This provides employees with an additional workplace benefit specific to local government and supports efforts to identify councils as attractive employees. During 2014–15, over $14 000 in health insurance policy excess reimbursements were paid to council employees of the 25 participating councils.
Initiatives undertaken and services provided by local governments to Aboriginal and Torres Strait Islander communities
Indigenous Leaders ForumTwo meetings of the Indigenous Leaders Forum comprising mayors, councillors and senior council officers of the 17 Queensland Aboriginal and Torres Strait Islander councils (including Torres Shire Council) were convened on October 2014 and May 2015. The latter forum was convened on Palm Island to help the local economy and provided an opportunity to showcase the local community. The Indigenous Leaders Forum also served as a Ministerial Round Table to provide an ideal forum for quality dialogue to occur between these council representatives and the relevant Ministers of the newly elected Queensland Government.
The forum was also attended by the Police Commissioner to discuss key policing issues as a follow-up to the second Police Summit which was convened as an adjunct to the October 2014 Indigenous Leaders Forum. This collaborative approach between the Police Commissioner and councils has proven to be very productive in improving police and community relations and policing generally in the community.

99
Appendix B • Qld.
Other key outcomes from the Indigenous Leaders Forum include:
• commitment to finalise review of alcohol management plans
• agreed strategies to redress the potential drug implications for communities
• setting deadlines for finalising the review of retail stores in communities
• developing workforce capacity strategy
• developing a strategy for addressing ongoing community health issues.
The partnership between the local government sector and the Queensland Department of Education and Training continues to reap very significant dividends. Well in excess of 80 per cent of Aboriginal and Torres Strait Islander council staff who were enrolled in designated training programmes completed prescribed training and successfully in gained and retained employment.
Local government reform activities including deregulation and legislative changesThe reporting period saw ongoing high levels of activity on planning reform. The reform process commenced under the former Queensland Government in 2012. The former Queensland Government Bills lapsed as part of the early 2015 state election. This year saw the reintroduction of these Bills as Private Members’ Bills in June 2015. Further info about these reforms can be found at the State’s planning reform website: http://dilgp.qld.gov.au/planning-reform.
Separately, many Queensland local governments have made significant advancements in planning and business processes under the existing legislation as demonstrated by the Concept to Construction – Development Assessment Innovation Project. These improvements are ongoing and are largely driven through leadership, capacity building, and operational improvements.
Councils in Queensland leading digital transformation
The Local Government Association of QueenslandIn 2014–15, the Local Government Association of Queensland conducted the second digital productivity survey leading to the release of the Digital productivity report 2015 (available at www.lgaq.asn.au). The survey was conducted to determine current practices related to:
• productivity gains from technology investments
• adoption of digital engagement platforms within local councils in Queensland
• use of technology and digital platforms.
The results provided important insights into Queensland’s economy, the receptiveness of councils to consider digitally-enabled solutions and their readiness to implement future digital change. This change is currently being driven by a number of pressing business needs within local government in Queensland, including the move towards different ways of consuming information and technology services and the changing face of digital infrastructure.

100
Local Government National Report 2014–15
Mackay Regional Council smart meteringMackay Regional Council was the first water authority in Australia to adopt a full roll out of smart metering (hourly readings) across the full water meter fleet without subsidies. The information collected is being used to drive capital efficiencies, improve operations and transform the way council interacts with their customers. The technology is enabling consumers and council to read meters to identify water leaks and high consumption faster. Consumers and landlords are able to find out their daily water consumption, how much their water use is costing them and set up email and SMS alerts to warn them of high consumption and water leaks within days of them occurring instead of waiting for the bill to arrive.
Mackay Regional Council is leading the way with modern technology and providing an improved level of service to its customers. The data collected will help optimise the network and assist in making capital investment decisions. During the last 12 months, the automatic meter reading technology has helped council identify and inform more than 4000 properties of water leaks with the average leak amounting to around 35 litres per hour per customer. By opening up new data sources, driving improved understanding and transformation operations, Mackay Regional Council is managing the cost to provide services into the future.
Cherbourg Aboriginal Shire Council – smart lighting and closed-circuit televisionThe Cherbourg Aboriginal Shire Council has implemented a solution using technologies that combine smart lighting and closed-circuit television to improve public safety and lighting in parts of Cherbourg. The solution involves the installation of LED smart lights with adaptive control and closed-circuit television on new poles that will cover key intersections and the main street in Cherbourg. While the cameras and lighting are aimed to overcome a specific problem, the platform that has been created will allow for future expansion of the project both in terms of additional sites and additional technologies. Using the technology aims to reduce the incidence of graffiti or other anti-social behaviour and will help improve the liveability of the town.

101
Appendix B • WA
Report from the Western Australian Government
The extent to which the allocation of funds for local government purposes for your jurisdiction has been made on a full horizontal equalisation basis
2014–15 general purpose component allocationsIn 2014–15, 31 local governments received the minimum grant entitlement which equated to $20.65 per capita. Local governments that received a minimum grant in 2014–15 had their grant calculated on a per capita basis, in accordance with the minimum grant principle established under the Local Government (Financial Assistance) Act 1995 (Cth). Collectively, the local governments receiving the minimum grant accounted for $39.307 million of the total general purpose component while containing 75.55 per cent of Western Australia’s population.
In 2014–15, there were still some councils receiving significantly less than their calculated equalisation requirement. The Western Australian Local Government Grants Commission has continued to phase-in increases and decreases to lessen the impact on councils. For 2014–15, the Western Australian Local Government Grants Commission adopted a maximum increase of 14.7 per cent of the gap between a council’s current grant and their equalisation requirement. Using this method, increases on the previous year’s allocations were between zero and 25 per cent. A maximum decrease of 9.34 per cent was applied for those with a declining general purpose component.
Detailed calculations and explanations are made available to local governments through the Western Australian Local Government Grants Commission’s website.
Local road grant fundingThe Western Australian Local Government Grants Commission distributes the local road component using the Asset Preservation Model, which has been in place since 1992.
Under the arrangements approved for Western Australia, seven per cent of the local road component is allocated for special projects (one-third for roads servicing remote Indigenous communities and two-thirds for bridges). The remaining 93 per cent is distributed in accordance with road preservation needs, as determined by the Western Australian Local Government Grants Commission’s Asset Preservation Model.
The Asset Preservation Model assesses the average annual costs of maintaining each local government’s road network and has the capacity to equalise road standards through the application of minimum standards. These standards help local governments that have not been able to develop their road systems to the same standard as more affluent local governments. The local road component funding splits are provided in Table B-14.
Table B-14 Western Australia’s local road component funding
Component Amount $
Roads servicing Indigenous communities 2 507 481
Bridges 5 014 961
Distributed according to the Asset Preservation Model 100 633 473
Total 108 155 915

102
Local Government National Report 2014–15
Special projects – roads servicing remote Indigenous communitiesMain Roads Western Australia contributes an additional third of the cost of special projects funded under this programme. Table B-15 provides details on the 2014–15 funding for the Special Projects – Roads Servicing Remote Indigenous Communities programme.
Table B-15 2014–15 funding for the Western Australian Special Projects
Western Australian Special Projects – Roads Servicing Remote Indigenous Communities programme Amount $
Special Project funds from Western Australian Local Government Grants Commission
2 507 481
State funds from Main Roads Western Australia 1 253 740
Total 3 761 221
The Indigenous Roads Committee advises the Western Australian Local Government Grants Commission on procedures and priorities for determining the allocations of the local road component for roads servicing remote Indigenous communities, and recommends the allocations that are made each year. Membership of the Indigenous Roads Committee is made up of representatives from each of the following organisations:
• Western Australian Local Government Grants Commission (Chair)
• Western Australian Local Government Association
• Main Roads Western Australia
• Western Australian Department of Aboriginal Affairs
• Western Australian Department of Local Government and Communities
• Australian Government Department of the Prime Minister and Cabinet.
The Indigenous Roads Committee has established funding criteria based on factors including the number of Indigenous people serviced by a road; the distance of a community from a sealed road; the condition of the road; the proportion of traffic servicing Indigenous communities; and the availability of alternative access. These criteria have provided a rational method of assessing priorities in developing a five-year programme. The Indigenous Roads Committee’s recommendations are submitted to the Western Australian Local Government Grants Commission for endorsement.
Special projects – bridgesThe Western Australian Local Government Grants Commission’s policy for allocating funds for bridges recognises that there are many local government bridges that are in poor condition, and that the preservation of these bridges must be given a high priority.
The special project funds for bridges are only allocated to preservation type projects, recognising that some of these projects may include some upgrading, and that preservation includes replacement when the existing bridge has reached the end of its economic life. Table B-16 provides details on the funding provided under Special Projects – Bridges.

103
Appendix B • WA
Table B-16 Western Australian Special Projects – Bridges
Component Amount $
Special project funds from the Western Australian Local Government Grants Commission 5 014 961
State funds from Main Roads Western Australia 2 507 481
Total 7 522 442
A Bridge Committee advises the Western Australian Local Government Grants Commission on priorities for allocating funds for bridges. Membership of the Bridge Committee is made up of representatives from the following organisations:
• Western Australian Local Government Grants Commission (Chair)
• Western Australian Local Government Association
• Main Roads Western Australia.
The Bridge Committee regularly receives recommendations from Main Roads Western Australia on funding priorities for bridges. Main Roads Western Australia inspects and evaluates the condition of local government bridges and has the expertise to assess priorities and make recommendations on remedial measures. As part of the process, local governments make applications to the Western Australian Local Government Grants Commission for bridge funding each year. The Bridge Committee’s recommendations are submitted to the Western Australian Local Government Grants Commission for endorsement.
The methodology used for distributing funding under the Financial Assistance Grant programme to local government for 2014–15 by your Local Government Grants Commission
Methodology reviewThe Western Australian Local Government Grants Commission completed a comprehensive review of its general purpose component methodology in 2012. This methodology has been applied to each grant determination in subsequent years.
General purpose componentThe Western Australian Local Government Grants Commission continues to use the balanced budget method for allocating the general purpose component. The balanced budget approach to horizontal equalisation applies to all 138 local governments in Western Australia and is primarily based on the formula: assessed expenditure need – assessed revenue capacity = assessed equalisation requirement.
Calculation of assessed revenue capacity is based on standardised mathematical formulae updated annually and involves assessing the revenue-raising capacity of each local government in the categories of: residential, commercial and industrial rates; agricultural rates; pastoral rates; mining rates; and investment earnings.
Assessed expenditure need is based on standardised mathematical formulae updated annually, involving the assessment of each local government’s operating expenditures in the provision of core services and facilities under the ‘standard’ categories of: governance; law, order and public safety; education, health and welfare; community amenities; recreation and culture; and transport. Table B-17 provides information on the disabilities applied to expenditure standards.

104
Local Government National Report 2014–15
Table B-17 Disabilities applied to expenditure standards in Western Australia
Expenditure standard Disabilities applied to expenditure standard
Governance Location, socio-economic disadvantage, Indigenous, regional centres
Law, order and public safety Location, socio-economic disadvantage, population dispersion, terrain, cyclone, special needs
Education, health and welfare Location, socio-economic disadvantage, population dispersion, medical facilities
Community amenities Location, socio-economic disadvantage, growth, population dispersion, regional centres, off-road drainage, special needs
Recreation and culture Location, socio-economic disadvantage, growth, population dispersion, climate, regional centres
Transport N/A
DisabilitiesDisabilities are determined through a combination of data specific to the disability as well as a population component. As a number of small and remote local governments have a high (more disadvantaged) disability specific data score, a weighting on population in the disabilities ensures that local governments with small populations are not compensated excessively. The 12 disabilities as determined by the Western Australian Local Government Grants Commission are, in order of significance: location; socio-economic disadvantage; growth; population dispersion; climate; Indigenous; regional centres; terrain; off-road drainage; medical; cyclone; and special needs.
Data from a wide range of sources is used to calculate the disabilities applied to the expenditure standards. Wherever possible, data is collected from independent sources such as the Australia Bureau of Statistics. Data sources are provided in Table B-18.
Table B-18 Data sources used in Western Australia
Data type Source
Accessibility Remoteness Index of Australia (ARIA+)
Centre for Social Applications of Geographic Information Systems
Socio-economic Indexes of Areas Australian Bureau of Statistics, Cat: 2033.0.55.001
Population, population forecasts Australian Bureau of Statistics Cat: 3218.0 as at 3 April 2014, Western Australian Department of Planning – Tomorrow: Population Report No. 7 2006–2026
Population dispersion Australian Bureau of Statistics QuickStats for Town site Populations
Regional centres Determined by the Western Australian Local Government Grants Commission
Indigenous population Australian Bureau of Statistics – QuickStats for Local Government Area
Terrain Western Australian Department of Home Affairs and Environment – Biophysical Attributes of Local Government
Cyclone Australian Building Standards for Cyclone Prone Areas (Australian Building Code Board)
Off-road drainage data Road Information Returns, Main Roads Western Australia
Interest expenditure/investment revenue
Western Australian Treasury Corporation, Western Australian Local Government Grants Commission Information Returns
Valuations, area, assessments Landgate (Valuer General)
Residential, commercial and industrial rates, agricultural rates, pastoral rates, mining rates
Western Australian Local Government Grants Commission Information Returns
Climate Bureau of Meteorology

105
Appendix B • WA
Changes to the methodology for distributing funding to local government under the Financial Assistance Grant programme for 2014–15 from that used in 2013–14There were no significant updates to the methodology in 2014–15.
With the view to further simplifying the balanced budget, the inclusion approach has been adopted to the data, whereby all data was included unless specifically excluded. Data categories for rating have been based on Valuer-General valuation categories.
Total assessments data has changed to include all assessments from residential, commercial, industrial, mining, agricultural and pastoral categories. Previously, pastoral assessments were excluded from total assessment figures on the basis that limited services are delivered to these properties. It was considered inequitable to include the pastoral data on the revenue side of the balanced budget whilst excluding pastoral data on the expenditure side.
Expenditure and revenue standards were calculated in the same way as 2013–14, however, equations were updated to reflect the new input data.
Disability data sets have also been updated to reflect new data where it was available including updated Estimated Resident Population as at 3 April 2014.
Developments in the use of long-term financial and asset management plans by local governmentA process of structural reform and capacity building has been under way in the Western Australian local government sector for several years. In August 2010, the Western Australian Government introduced regulations which established new requirements for Plan for the Future under the Local Government Act 1995 (WA). Under the regulations, all local governments in Western Australia were required to have developed and adopted two key documents by 30 June 2013. They are strategic community plans and corporate business plans, supported and informed by resourcing and delivery strategies. These plans also include an asset management plan, a long term financial plan and a workforce plan. These all form part of the Integrated Planning and Reporting Framework and the Advisory Standard which sets out associated performance measures.
The Western Australian Department of Local Government and Communities has a local government capacity building programme in place, supported by Royalties for Regions’ Country Local Government Fund funding. The programme seeks to assist local governments in balancing demands for a wider range of services, ageing infrastructure and revenue constraints by developing and implementing long-term approaches which integrate strategic planning, asset management, workforce and financial planning.
Financial and asset management planning and implementation have been identified as areas in which local governments require particular support and assistance in improving the accuracy of asset condition and useful life data. To address these challenges, the Western Australian Department of Local Government and Communities has developed a four-year project to support up to 80 country local governments to carry out assessments of their current asset and financial management processes, in line with nationally consistent measures set out in the National Asset Management Assessment Framework. Assistance is also provided to assess and update the condition and useful life data of one critical asset class, resulting in a more accurate calculation of the local government’s infrastructure gap. This is being achieved by using best

106
Local Government National Report 2014–15
practice asset condition assessment methodologies and updating asset management plans and long term financial plans.
The Western Australian Department of Local Government and Communities has engaged asset management consultants to work with local governments on the project and provide training, mentoring and guidance. In 2014–15, 39 country local governments participated in the National Asset Management Assessment Framework and Asset Condition Rating Project.
Actions to develop and implement comparative performance measures between local governing bodiesThe Western Australian Department of Local Government and Communities uses the Integrated Planning and Reporting Advisory Standard as the performance measurement standard and the annual Capability Survey to enable local governments to assess and report on their progress.
Local government performance, as measured by the annual Capability Survey, declined in 2014–15. An analysis of the data indicates that overall performance of the sector was impacted by the performance of metropolitan local governments. Country local governments experienced a much smaller decline in performance as measured by the survey.
During 2014–15, metropolitan local governments were actively preparing for a range of structural reforms that included mergers and boundary changes, as part of the Western Australian Government’s metropolitan reform. In February 2015, the Western Australian Government put on hold its plans for boundary reform in metropolitan Perth.
Local governments are expected to perform better in subsequent surveys as they reinstate the ongoing development of their Integrated Planning and Reporting plans and the Western Australian Government implements additional support.
Reforms undertaken during 2014–15 to improve the efficiency and effectiveness of local government service deliveryIn addition to the work being undertaken to develop local government capability in long-term financial planning and asset management, outcomes from the Western Australian Department of Local Government and Communities’ country local government capacity building programme for 2014–15, funded by the Royalties for Regions’ Country Local Government Fund, included the following:
• sixteen Elected Member Training Program sessions were conducted. An average of 10 elected members from 32 local governments attended each session
• two pilots of the Better Practice Review capacity building programme were undertaken and evaluated – review processes have been progressed with three shires
• four further regional Workforce Planning training workshops were conducted, while 22 country local governments used grant funding to implement actions from their workforce plans
• continued development of capacity to plan strategically for the future.
The Western Australian Department of Local Government and Communities has continued to support local governments through guidelines, a dedicated website, the Advisory Standard, training programmes, funding and advice.

107
Appendix B • WA
Initiatives undertaken and services provided by local governments to Aboriginal and Torres Strait Islander communitiesThe delivery of strong, sustainable services to Aboriginal Western Australians remains an important step to increasing quality of life and improving social and economic outcomes. Western Australian local governments have an important role in the delivery of services to Aboriginal communities.
In 2014, the Western Australian Government endorsed a policy position for remote Aboriginal communities. This policy framework includes the directions paper Towards a sustainable investment strategy for remote Aboriginal communities. The Western Australian Government, in agreement with the Australian Government, also developed National Principles for Reform of Infrastructure, Municipal and Essential Services.
The Western Australian Government has embarked on a major reform. With support from Aboriginal people, the Western Australian Government has formed leadership groups across Western Australia. The leadership groups work with local governments and service providers on the ground to improve service delivery. This approach aims to create opportunities to strengthen communities and benefit children and families through better services and investment locally.
Councils will provide high-level strategic advice on, and identify opportunities for, changes that could be made to Western Australian Government expenditure, policies, programmes and governance to improve outcomes for Aboriginal people in its region.
Local government has been identified as a key stakeholder in the district leadership groups to ensure community driven change will be made to the delivery of services in remote areas.
Local government reform activities in the areas of deregulation and legislative change by the Western Australian GovernmentThe Western Australian Government attempted to introduce significant local government structural reform across metropolitan Perth, with the objective of reducing 30 councils to approximately fifteen. This was discontinued when three amalgamations were defeated by electors’ polls.
Reform activities across the sector have continued to focus on long-term integrated planning, including each local government having a strategic community plan and a corporate business plan. Integrated Planning and Reporting is supported by informing strategies including asset management planning, long term financial planning and workforce planning.
Amendments to the Local Government (Functions and General) Regulations 1996 (WA) took effect on 1 October 2015. The amendments are a result of recommendations made by the Local Government Steering Committee and the Corruption and Crime Commission, with the aim of improving council purchase and tendering practices. In addition to increasing the tender threshold, the amendments enable local governments to appoint a panel of pre-qualified suppliers.
Amendments to the Local Government Act 1995 (WA), which increase local government transparency and accountability, passed the Legislative Assembly. These amendments require elected members to declare gifts and travel within ten days of receipt and for this information to be published on the council’s website.

108
Local Government National Report 2014–15
A City of Perth Bill, which recognises the special significance of the district of Perth as the capital city, is currently before the Western Australian Parliament.
The Local Government Legislation Amendment Bill, also under consideration by the Western Australian Parliament, strengthens the ability of councils to deliver services to their communities by enabling two or more councils to form a subsidiary body in order to perform a service or carry out an activity jointly. The Bill provides a model for a legal entity which will have less compliance obligations than that of a regional council, thus reducing red tape.
The regional subsidiary will be governed by a charter, which will be approved by the Western Australian Minister for Local Government. By enabling establishment by way of a charter rather than legislation as the governance and regulatory instrument, entities will be more readily able to adapt to their purpose.
The Local Government Legislation Amendment Bill also makes a number of changes to the operation of the Local Government Standards Panel. The Local Government Standards Panel gains the discretion to refuse to deal with complaints where the complaint is officially withdrawn, or where the panel determines that a complaint is frivolous or without substance. These changes will increase the efficiency of operation of the Local Government Standards Panel and allow it to focus its efforts on dealing with complaints in a timely manner.
The Western Australian Minister for Local Government has announced that the Western Australian Office of the Auditor-General will be taking over responsibility for local government auditing to increase accountability.
Councils in Western Australia leading digital transformation
City of Perth online services, wi-fi and parking mobile smartphone applicationWestern Australian local governments are increasingly providing services online. The City of Perth is leading the way by making services that previously would have required a trip to the council office available through their website.
Residents of the City of Perth can now book facilities and venues, register their dog or cat, request a bin, or apply for an extended trading permit through the city’s website. The City of Perth also provides free public wi-fi across the Perth central business district.
The City of Perth has also recently entered the mobile space with the launch of the City of Perth parking mobile smartphone application. The application provides Australia’s first real-time bay availability feature. This new feature helps drivers plan for their parking more efficiently by allowing them to view how many bays are available, in real time, across 12 of the city’s major car parks.
City of Greater Geraldton – accepting building permits online and wi-fiAs part of their Digital Strategy for the City of Greater Geraldton and the Mid West Region, the City of Greater Geraldton is also at the forefront of delivering services digitally. The City of Greater Geraldton has moved to accepting building permits online and offers wi-fi facilities across twelve locations within the City of Greater Geraldton.

109
Appendix B • WA
Report from the Western Australia Local Government Association
Developments in the use of long-term financial and asset management plans by local governmentWorking on the implementation of Integrated Planning and Reporting has been a key focus for Western Australian local government sector in recent years. The Western Australian Local Government Association worked with the Western Australian Department of Local Government and Communities, Local Government Managers Australia (Western Australia) and officer representatives from local governments to support the sector during this period of change, including a review of the Integrated Planning and Reporting Framework and guidelines documentation. The updated documents are expected to be finalised in the first half of 2016.
An improvement in the commitment to asset management and system use by councils was seen in 2014–15, with ROMAN II software usage increasing by 10 per cent across the sector. Councils are increasingly making asset management part of their day-to-day activities, with innovations such as asset management tablet devices increasingly in use by field officers across the sector.
Actions to develop and implement comparative performance measures between local governing bodiesThe Western Australian local government sector implemented Integrated Planning and Reporting from July 2013. Since then, some local governments have worked with the Western Australian Department of Local Government and Communities to assess their own performance against the future requirements of the Integrated Planning and Reporting framework. As the reforms are bedded down and Western Australian councils gain further experience with the integrated frameworks, comparative performance measures will be developed in future years. Work is continuing on improving the standard of the Integrated Planning and Reporting documentation and community engagement strategies.
Procurement compliance review checklist and benchmarkingIn February 2015, the Western Australian Crime and Corruption Commission presented the results of voluntary audits conducted on procurement and purchasing practices at five metropolitan councils. The results highlighted potential risks for these councils and the sector in current practice.
The Western Australian Local Government Association commissioned the development and roll-out of a Best Practice Procurement Self-Assessment checklist that supports the identification of procurement risks and the establishment and implementation of effective risk mitigation strategies for the participating councils. The checklist focuses on: policy frameworks; probity and compliance management; process and guidance; contract and supplier relationship management; procure-to-pay; and tender processes.
Reforms undertaken during 2014–15 to improve the efficiency and effectiveness of local government service deliveryMetropolitan local government reform, which was expected to significantly reduce the number of local governments in metropolitan Perth through amalgamations and boundary adjustments, was the focus for many in the local government sector during 2014–15.

110
Local Government National Report 2014–15
The amalgamations and boundary adjustments did not progress due to increased community involvement. This culminated in polls of electors that prevented the amalgamations from proceeding, and as a result councils reviewed their organisational and service delivery processes. The increased community interest in local government has enabled councils to harness the momentum of the metropolitan local government reform process to drive internal efficiency and effectiveness gains.
In particular, many local governments reviewed their activities by using the Local Government Reform Toolkit, an online resource providing best practice templates and guidance developed jointly by the Western Australian Local Government Association, the Western Australian Department of Local Government and Communities, and Local Government Managers Australia (Western Australia).
eSign and digital signature development, eQuotes sector and local license deploymentThe efficiency and effectiveness of local government service delivery has been supported by the Western Australian Local Government Association’s deployment of technologies to automate processes and improve the timeliness of procurement processes. eSign has enabled contracts to be expedited by removing the need for printing, sending and paper-based file management. eQuotes has allowed purchasing engagements to be streamlined to a process of quotation, with auditable and transparent records.
West Australian disabilities enterprises and social procurement developmentThe Western Australian Local Government Association has supported a range of social procurement initiatives including membership of Social Procurement Australasia, and encouragement of sector procurement from West Australian Disabilities Enterprises. By supporting changes to procurement regulations in these areas the procurement process has been made easier. The Western Australian Local Government Association has raised awareness and facilitated access to West Australian Disabilities Enterprises through network forums and a range of media options which in turn is providing increased employment opportunities for people with disabilities.
Initiatives undertaken and services provided by local governments to Aboriginal and Torres Strait Islander communities
In 2014, the Western Australian Government accepted a one-off payment of $90 million to transfer responsibility for municipal and essential services from the Australian Government to Western Australia from 1 July 2015. The Western Australian Government has since embarked on a major regional services reform programme to develop new arrangements for municipal and essential services delivery to Aboriginal communities. With support from Aboriginal people, the Western Australian Government has formed leadership groups across the state that will work with service providers on the ground to improve lives. The Western Australian Government has also adopted a State Infrastructure Strategy to guide future investment in Aboriginal communities.
Western Australian councils are participating in the leadership groups and are involved in the development of implementation plans for each district. The implementation plans aimed to replace duplicated services and short-term projects with long-term programmes run by organisations that will be accountable for their results.

111
Appendix B • WA
Current funding and service delivery is managed by the Western Australia Department of Housing. It is anticipated that the Western Australia Department of Housing will continue to fund and manage municipal service delivery into the future until alternative arrangements are identified and agreed. However, this has not been confirmed in writing with local governments or existing contractors. The Western Australian Local Government Association has continued to advocate and participate in bi-lateral discussions about reform of service delivery to Aboriginal communities. The sector continues to be concerned about the lack of detailed information available about the future expectations of local governments for municipal service delivery to Aboriginal communities.
Indigenous contracting engagement and regulatory change:Through its involvement on the Aboriginal Procurement Working Group and the amendments to the Local Government Regulations, the Western Australian Local Government Association has commenced work to promote Aboriginal business participation across the local government sector.
The Aboriginal Procurement Working Group consists of representatives from the Western Australian Department of Regional Development, the Western Australian Department of Finance, the Small Business Development Commission and Supply Nation. The aim of the Aboriginal Procurement Working Group is to increase the awareness of the Western Australian Government and local government procurement policies and processes for Aboriginal businesses and to increase procurement of Aboriginal goods and services.
The Western Australian Local Government Association has supported and been involved in the development of an Aboriginal Procurement Initiative to help increase participation in local government procurement from Aboriginal businesses. Through this programme the Western Australian Local Government Association has engaged Aboriginal businesses into its Preferred Supply Program and presented to business forums to support tendering from these businesses.
Councils in Western Australia leading digital transformation
City of Canning client relationship management systemThe City of Canning has adopted the mantra of ‘above all – service’ and has engaged information and communications technology staff and technology partners to enable a cultural change to achieve this associated goal. The City of Canning researched gaps or frustrations experienced by stakeholders when dealing with the City of Canning and then built an interconnection of systems with a client relationship management system as a central focus. Now, when a customer contacts the City of Canning (using any method they choose), staff are better informed when responding. Customer satisfaction has improved from 68 per cent to 95 per cent. Call volumes have reduced by 30 per cent as customers are getting the right information the first time. Customer service staff morale has lifted as their ability to confidently respond to callers has increased and their training time was reduced from six to two weeks.
City of Mandurah public wi-fiThe City of Mandurah has leveraged national broadband network connectivity and their requirement for public wi-fi to provide a rich range of ancillary services previously not feasible. The City has 124 closed-circuit television cameras across 17 sites. The unusual aspect of this system is that local police have direct, real-time access to it – even if on foot using an iPad.

112
Local Government National Report 2014–15
Because transmission costs are contained to the City’s own wi-fi network, instead of the more common mobile phone network solutions, effective additional costs are close to zero. The City has used sophisticated wi-fi hot spots to gather pedestrian metrics to help it better understand the division between frequent, infrequent and first-time visitors to various locations such as recreation centres, public open spaces and libraries. With this understanding, a simple thing like bin or direction sign placement can be done in a much more responsive way, improving the amenity of the City and therefore, the experience of residents and visitors.

113
Appendix B • SA
Report from South AustraliaThis report has been provided by the South Australian Government with contributions provided by the South Australian Local Government Grants Commission; the Local Government Association of South Australia; and the South Australian Office of Local Government.
The extent to which the allocation of funds for local government purposes for your jurisdiction has been made on a full horizontal equalisation basisThe methodology used by the South Australian Local Government Grants Commission to allocate funding to local government is intended to achieve an allocation of grants to local governing bodies in South Australia consistent with the National Principles.
While all of the National Principles are incorporated into the South Australian Local Government Grants Commission’s assessment process and recommendations, the over-riding principle applied to the assessment of the general purpose component is one of horizontal equalisation.
The extent to which the allocation of the general purpose component achieves full equalisation is influenced by a number of constraints, including:
• the second National Principle, which requires that each local governing body must receive a minimum entitlement per head of population (the per capita minimum grant principle)
• funds available to meet the assessed need of all councils across South Australia
• South Australia’s decreasing proportion of the Australian population
• the pause on indexation of the Financial Assistance Grant programme for three years from 2014–15 to 2016–17, originally announced as part of the 2014–15 Federal Budget
• limitations in the availability of some data items across South Australia.
The South Australian Local Government Grants Commission has incorporated a number of strategies within its methodology to address these constraints and attempt to achieve as close to full equalisation as possible.
The per capita minimum grant principleWhile the South Australian Local Government Grants Commission’s methodology primarily addresses the horizontal equalisation principle, the extent to which this principle can be applied is constrained by the application of the second National Principle – the per capita minimum grant principle.
The per capita minimum grant principle quarantines 30 per cent (or approximately $34.2 million for South Australia in 2014–15) of the pool of the general purpose component, to be provided to councils who are assessed as having a greater than average capacity to provide services. As a result of setting aside 30 per cent of the pool of funds, funding available to those councils with a less than average capacity or to fully equalise grants to councils to provide services, is reduced.
The South Australian Local Government Grants Commission’s methodology applies the per capita minimum grant to councils with a greater than average capacity as first priority and distributes the remaining funding on the basis of the relativities established in the assessment process.

114
Local Government National Report 2014–15
The limited pool of fundingThe proportion of the total pool of funding allocated to South Australia does not provide sufficient funding to meet the assessed need of councils under the current methodology. The South Australian Local Government Grants Commission assessed a total raw grant of $209.4 million in 2014–15 for councils with a below average capacity to provide services, that is excluding grants payable to per capita minimum councils, giving rise to a shortfall of $95.4 million over the amount provided.
Applying the per capita minimum grant principle to the assessment, the South Australian Local Government Grants Commission’s assessment on a full equalisation basis was $224.5 million for 2014–15, a shortfall of $110.4 million.
The South Australian Local Government Grants Commission’s process to address the shortfall involves scaling back the actual amount of grants received in proportion to the relativity established for each council in the calculation of their raw grant, to arrive at their per capita applied grant.
The South Australian Local Government Grants Commission then applies its own caps and collars and other necessary adjustments in order to manage increases and decreases in assessed grants to provide the final recommended grant.
For 2014–15, the caps and collars applied by the South Australian Local Government Grants Commission were heavily restricted by the impacts of the pause in indexation applied to Financial Assistance Grant programme. Prior, the South Australian Local Government Grants Commission typically applied caps of up to a 12 per cent increase for councils with an increasing need and collars of negative five per cent for councils with a decreasing need.
South Australia’s decreasing proportion of the national populationThe general purpose component of the Financial Assistance Grant programme is distributed to jurisdictions on a per capita basis. By contrast, each state’s Grants Commission makes recommendations on the distribution of the general purpose component primarily on the basis of horizontal equalisation.
The per capita distribution of the general purpose component to the states and territories has traditionally disadvantaged South Australia due to its decreasing share of Australia’s population.
The continual reduction in the share of the general purpose component to South Australia further restricts the South Australian Local Government Grants Commission’s ability to fully equalise grants to councils. As with the shortfall of overall funding, the South Australian Local Government Grants Commission uses it’s scaling back process to allocate the level of funding received.
Indexation pauseIn the 2014–15 Budget, the Australian Government announced that the annual indexation of the Financial Assistance Grant programme would be paused for a period of three years commencing in 2014–15.
While the overall pool of funding has not increased for 2014–15, the allocation of the general purpose component, which is distributed to jurisdictions based on a per capita share, has fluctuated as a result of shifting proportions of the Australian population. The impact of this

115
Appendix B • SA
measure on South Australia is significant as South Australia’s proportion of national population is decreasing.
The South Australian Local Government Grants Commission implemented fixed reductions for over half of South Australian local governing authorities of one per cent. Only one quarter of councils, with significantly increasing assessed need for assistance, were granted increases in funding, at a very modest increase of 0.5 per cent.
Availability of dataThe South Australian Local Government Grants Commissions methodology to assess councils’ capacity to provide services relies heavily on the assessment of an average level of service across South Australia and an assessment of each council against the average for the purposes of determining the amount of grant recommended.
In order to undertake the assessments, the South Australian Local Government Grants Commission collects a range of data items for all local governing authorities in South Australia from the Australian Government, state and local governments. The data collected enables the South Australian Local Government Grants Commission to determine a theoretical average level of service across South Australia using data that is common to all councils, including property values, the area of councils, population, road length, rate revenue, and operating expenditure and assess each council against the average using the same data.
Data items that are easy to source, regularly updated and reliable provide the South Australian Local Government Grants Commission with an effective tool to ensure that horizontal equalisation is achieved. However, some services undertaken by councils are difficult to measure and do not have reliable data sources with which to measure councils against an average. For example, the use of council services and facilities by non-residents is difficult to assess. Non-residents can be tourists passing through a council using some services briefly or residents of neighbouring councils who use certain council services as part of their regular routines. Councils do not keep records on the use of these types of services. Waste management of a park or reserve will include the collection of rubbish from residents and non-residents and it is difficult to distinguish between the two. Similar challenges are experienced with public conveniences and libraries.
Under these circumstances, the South Australian Local Government Grants Commission exercises its own judgement to provide recognition of these types of services. This approach attempts to achieve an increased level of equalisation, but is limited in its application.
The methodology used for distributing funding under the Financial Assistance Grant programme to local government for 2014–15 by your Local Government Grants Commission
General purpose componentThe methodology used to assess the general-purpose component of the Financial Assistance Grant programme is intended to achieve an allocation of grants to local governing bodies in South Australia consistent with the National Principles. The over-riding principle is one of horizontal equalisation, which is constrained by a requirement that each local governing body must receive a minimum entitlement per head of population.

116
Local Government National Report 2014–15
The South Australian Local Government Grants Commission uses a direct assessment approach. This involves the separate estimation of a component revenue grant and a component expenditure grant for each council, which are aggregated to determine each council’s overall equalisation need.
Available funds are distributed in accordance with the relativities established through this process and adjustments are made as necessary to ensure the per capita minimum entitlement is met for each council. For local governing bodies outside the incorporated areas (the Outback Communities Authority and the five Aboriginal communities) allocations are made on a per capita basis.
A standard formula is used as a basis for both the revenue and expenditure component grants.
Formulae – general financial assistanceThe formula for the calculation of the raw revenue grants is expressed as:
G= Pc x S x [ ( Us x RRIs ) – ( Uc x RRIc ) ]Ps Pc
Similarly, the formula for the calculation of the raw expenditure grants is expressed as:
G= Pc x S x [ ( Uc x CRIc ) – ( Us x CRIs ) ]Pc Ps
Subscripts of s or c are used to describe whether it applies to the state or a particular council.
G = council’s calculated relative need assessmentP = populationU = unit of measure. Some units of measure are multiplied by a weightS = standard, be it cost or revenue = (expenditure or income)/URRI = Revenue Relativity Index. CRI = Cost Relativity Index (previously known as the
disability factor). They are centred around 1.00, i.e. RRIs or CRIs equals 1.00. If more than one CRI exists for any function then they are multiplied together to give an overall CRI for that function.
In the revenue calculations for both residential and rural assessments, the South Australian Local Government Grants Commission has calculated a revenue relativity index based on the Australian Bureau of Statistics Index of Economic Resources. Where no revenue relativity index exists the RRIc = 1.0. In all expenditure calculations with the exception of roads and stormwater, there are currently no disability factors applied and consequently, CRIc = 1.0.
The raw grants, both on the revenue and expenditure sides, are then totalled to give each council’s total raw grant. Any council whose raw calculation per head is less than the per capita grant ($20.48 for 2014–15) then has the per capita grant applied. The remaining balance of the allocated grant is then apportioned to the remaining councils based on their calculated proportion of the raw grant. South Australian Local Government Grants Commission determined limits are then applied to minimise the impact on council’s budgetary processes.
In the calculation of the 2014–15 allocations, the South Australian Local Government Grants Commission constrained changes to the allocations to between –3 per cent and 0.5 per cent. Changes for the majority of councils were in the range of –1 per cent and 0.5 per cent. Four councils were reduced at higher levels of –3 per cent and 2 per cent as part of a

117
Appendix B • SA
process of decreasing grants in a manageable way for these councils. No council received an increase above 0.5 per cent. An iterative process is then undertaken until the full allocation is determined.
Component revenue grantsComponent revenue grants compensate or penalise councils according to whether their capacity to raise revenue from rates is less than or greater than the state average. Councils with below average capacity to raise revenue receive positive component revenue grants and councils with above average capacity receive negative component revenue grants.
The South Australian Local Government Grants Commission estimates each council’s component revenue grant by applying the state average rate in the dollar to the difference between the council’s improved capital values per capita multiplied by the RRIc and those for the state as a whole, and multiplying this back by the council’s population.
The South Australia average rate in the dollar is the ratio of total rate revenue to total improved capital values of rateable property. The result shows how much less (or more) rate revenue a council would be able to raise than the average for the state as a whole if it applied the state average rate in the dollar to the capital values of its rateable properties.
This calculation is repeated for each of five land use categories, namely; residential; commercial; industrial; rural; and other. To overcome fluctuations in the base data, valuations, rate revenue and population are averaged over three years. Revenue relativity indices (RRIc) are only applied to the calculations for residential and rural land use categories.
SubsidiesSubsidies that are of the type that most councils receive and are not dependent upon their own special effort, that is they are effort neutral, are treated by the inclusion approach. These include subsidies such as those for library services and roads which are included as a revenue function.
For 2014–15, the South Australian Local Government Grants Commission continued to exclude library subsidies from the grant calculations along with the libraries expenditure function due to concerns over the consistency of data provided by councils to the Public Library Services section of the South Australian Department of the Premier and Cabinet.
Component expenditure grantsComponent expenditure grants compensate or penalise councils according to whether the costs of providing a standard range of local government services can be expected to be greater than or less than the average cost for the state as a whole due to factors outside the control of councils. The South Australian Local Government Grants Commission assesses expenditure needs and a component expenditure grant for each of a range of functions and these are aggregated to give a total component expenditure grant for each council.
The methodology compares each council per capita against the South Australian average. This enables the comparison to be consistent and to compare like with like.
A main driver or ‘unit of measure’ is identified for each function. This is divided into the net expenditure on the function for the State as a whole to determine the average or ‘standard cost’ for the particular function. For example, in the case of the expenditure function built-up sealed roads, a kilometre of built-up sealed roads is the unit of measure.

118
Local Government National Report 2014–15
Using this example, the length of built-up sealed roads per capita for each council is compared with the state’s length of built-up sealed road per capita. The difference – be it positive, negative or zero – is then multiplied by the average cost per kilometre for construction and maintenance of built-up sealed roads for South Australia as a whole (standard cost). This in turn is multiplied back by the council’s population to give the component expenditure grant for the function. As already indicated this grant can be positive, negative or zero.
In addition, it is recognised that there may be other factors beyond a council’s control which require it to spend more (or less) per unit of measure than the state average. Accordingly, the methodology allows for a ‘cost relativity index’, to be determined for each expenditure function for each council. Indices are centred around 1.0, and are used to inflate or deflate the component expenditure grant for each council. In the case of roads, cost relativity indexes measure relative costs of factors such as material haulage, soil type, rainfall and drainage.
To overcome fluctuations in the base data, inputs into the expenditure assessments (with the exception of the newly revised road lengths) are averaged over three years. Table B-19 details the approach taken to expenditure functions included in the methodology.
For 2014–15, the South Australian Local Government Grants Commission continued to exclude the libraries expenditure function from the methodology. Data gathered relating to visitor numbers has shown inconsistencies over the averaging period used by the South Australian Local Government Grants Commission (three years), with some significant fluctuations in data for many councils. This issue is being investigated as part of the South Australian Local Government Grants Commission’s methodology review.

119
Appendix B • SA
Table B-19 Expenditure functions in the South Australian methodology
Expenditure function Standard cost Units of measure
Waste management Reported expendituresa Number of residential properties
Aged care services Reported expendituresa Population aged 65+ per Australian Bureau of Statistics Census and estimated resident population
Services to families and children Reported expendituresa Population aged 0–14 years per Australian Bureau of Statistics Census and estimated resident population
Health inspection Reported expendituresa Establishments to inspect
Libraries Reported expendituresa Number of library visitors
Sport and recreation Reported expendituresa Population aged 5–49 years per Australian Bureau of Statistics Census and estimated resident population
Sealed roads – built-up e Reported expendituresa Kilometres of built-up sealed road
Sealed roads – non-built-upe
Reported expendituresa Kilometres of non-built-up sealed road
Sealed roads – footpaths etc. Reported expendituresa Kilometres of built-up sealed road
Unsealed roads – built-upe Reported expendituresa Kilometres of built-up unsealed road
Unsealed roads – non-built-upe Reported expendituresa Kilometres of non-built-up unsealed road
Unformed roadse Reported expendituresa Kilometres of unformed road
Stormwater drainage maintenanceb, c Reported expendituresa Number of urban propertiesd
Community support Reported expendituresa Three year average population Socio-economic Indexes for Areas Advantage/Disadvantage cost relativity index
Jetties and wharves Reported expendituresa Number of jetties and wharves
Public order and safety Reported expendituresa Total number of properties
Planning and building control Reported expendituresa Number of new developments and additions
Bridges Reported expendituresa Number of bridges
Other needs assessments Set at 1.00 Based on South Australian Local Government Grants Commissions determined relative expenditure needs in a number of areasf
Notes: a Council’s net expenditure reported in the South Australian Local Government Grants Commissions’ Supplementary Returns.
b Includes both construction and maintenance activities. c The South Australian Local Government Grants Commission has also decided, for these functions, to use
cost relativity indexes based on the results of a previous consultancy by BC Tonkin and Associates. d Urban properties = sum [residential properties, commercial properties, industrial properties, exempt
residential properties, exempt commercial properties, exempt industrial properties]. e The South Australian Local Government Grants Commission has for these functions, used cost relativity
indexes based on the results of a consultancy led by Emcorp and Associates, in association with PPK Environment and Infrastructure. Tonkin Consulting has since refined the results.
f Comprises South Australian Local Government Grants Commission determined relative expenditure needs with respect to the following: – non-resident use/tourism/regional centre – assessed to be high, medium or low – duplication of facilities – identified by the number of urban centres and localities (as determined by the
Australian Bureau of Statistics) – isolation – measured as distance from the GPO to the main service centre for the council (as published
in the South Australian Local Government Directory; Local Government Association of South Australia) – additional recognition of needs of councils with respect to Aboriginal people – identified by the
proportion of the population identified as Aboriginal or Torres Strait Islander – unemployment – identified by the proportion of the population unemployed

120
Local Government National Report 2014–15
– capital city status – gives recognition to such things as the ability of the council to raise revenue from sources other than rates (i.e. car parking and from the Wingfield dump), and their extraordinary expenditure need (i.e. due to the requirement that they maintain the entire road network within the city and due to the daily influx of non-resident population)
– environment and coastal protection – assessed to be high, medium or low – provision of cultural and tourist facilities – assessed to be high, medium or low.
This final factor ‘Other Needs Assessment’ (also known as Function 50) originates from awareness by the South Australian Local Government Grants Commission that there are many non-quantifiable factors, which may influence a council’s expenditure, and that it is not always possible to determine objectively the extent to which a council’s expenditure is affected by these factors. The South Australian Local Government Grants Commission is aware that there are many factors which may influence a council’s expenditure and that it is not always possible to determine objectively the extent to which a council’s expenditure is affected by inherent or special factors. Therefore, in determining units of measure and cost relativity indices, the South Australian Local Government Grants Commission must exercise its judgement based on experience, the evidence submitted, knowledge gained during visits to council areas, and as a result of discussions with elected members and staff.
Calculated standards by functionThe South Australian Local Government Grants Commission uses Table B-20 to enable it to calculate a council’s raw grant for each of the given functions. To do this, the South Australian Local Government Grants Commission calculates each individual council’s unit of measure per capita, compares it with the similar figure from the table and then multiplies the difference by the standard from the table and its own population. If cost relativity indexes are applicable, then they must be included as a multiplier against the council’s unit of measure per capita.
The South Australian Local Government Grants Commission stresses that this only allows the calculation of the raw grant for the individual function, not the estimated grant. The calculation of the estimated grant is not possible as per capita minimums need to be applied and the total allocation apportioned to the remaining councils.

121
Appendix B • SA
Table B-20 South Australia’s calculated standards by functionTotal Population = 1 670 827
FunctionStandard in dollars
Unit of measure
per capitaTotal units of
measure Unit of measure
Expenditure functions
Waste management 180.13 0.41214 681 503 Number of residential properties
Aged care services 158.56 0.16443 271 890 Population aged 65+
Services to families and children 61.10 0.17716 292 949 Population aged 0–14
Health inspection 312.54 0.01228 20 309 Establishments to inspect
Libraries - - - Number of visitors
Sport and recreation 159.45 0.77568 1 282 638 Population aged 5–49
Sealed roads – built up 11 333.40 0.00641 10 596 Kilometres of sealed built-up
Sealed roads – non-built up 11 333.40 0.00456 7547 Kilometres of sealed non-built-up
Sealed roads – footpaths etc. 14 830.16 0.00641 10 596 Kilometres of sealed built-up
Unsealed roads – built up 1641.42 0.00043 716 Kilometres of formed and surfaced, and natural surface-formed built-up road
Unsealed roads – non-built up 1641.42 0.02844 47 022 Kilometres of formed and surfaced, and natural surface formed non-built-up road
Roads – unformed 88.33 0.00532 8793 Kilometres of natural surfaced unformed road
Stormwater drainage – maintenance
78.82 0.44465 735 269 Number of urban, industrial and commercial properties including exempt
Community support 45.87 0.99990 1 653 416 Three year average population Socio-economic Indexes for Areas Advantage Disadvantage cost relativity index
Jetties and wharves 12 766.25 0.00005 79 Number of jetties and wharves
Public order and safety 23.42 0.56465 933 686 Total number of properties
Planning and building control 1 504.77 0.02648 43 782 Number of new developments and additions
Bridges 7 991.12 0.00053 883 Number of bridges
Other special needs 1.00 29.17914 48 249 900 Total of dollars attributed
Revenue functions
Rates – residential 0.0034 144 253 238 265 855 929 Valuation of residential
– commercial 0.0061 19 084 31 556 158 121 Valuation of commercial
– industrial 0.0092 2682 4 434 080 509 Valuation of industrial
– rural 0.0030 20 332 33 127 689 152 Valuation of rural
– other 0.0026 10 201 16 867 796 996 Valuation of other
Subsidies 1.00 20.08652 33 214 572 The total of the subsidies

122
Local Government National Report 2014–15
Aggregated revenue and expenditure grantsComponent grants for all revenue categories and expenditure functions, calculated for each council using the method outlined above, are aggregated to give each council’s total raw grant figure.
Where the raw grant calculation per head of population for a council is less than the per capita minimum established, ($20.48 for 2014–15), the grant is adjusted to bring it up to the per capita minimum entitlement. The balance of the allocated amount, less allocation to other local governing bodies outside the incorporated areas, is then apportioned to the remaining councils based on their calculated proportion of the raw grant.
South Australian Local Government Grants Commission determined limits may then be applied to minimise the impact on council’s budgetary processes. In the calculation of the 2014–15 grant, constrained changes to councils to between -3 per cent and 0.5 per cent. An iterative process is then undertaken until the full allocation is determined.
Identified local road grantIn South Australia, the identified local road component is divided into formula grants (85 per cent) and special local road grants (15 per cent). The formula component is divided between metropolitan and non-metropolitan councils on the basis of an equal weighting of road length and population.
In the metropolitan area, allocations to individual councils are determined again by an equal weighting of road length and population. In the non-metropolitan area, allocations are made on an equal weighting of road length, population and the area of each council.
Distribution of the special local road grants is based on recommendations from the Local Government Transport Advisory Panel which is responsible for assessing submissions from regional associations on local road projects of regional significance.
Outback Communities AuthorityThe Outback Communities Authority was established in July 2010 under legislation of the South Australian Parliament and is prescribed as a local governing body for the purposes of the South Australian Local Government Grants Commission’s recommendations for distribution of funding under the Financial Assistance Grant programme.
It has a broad responsibility for management and local governance of the unincorporated areas of South Australia. The Outback Communities Authority has a particular emphasis for providing local government type services normally undertaken by councils elsewhere in South Australia.
Due to the lack of comparable data, the South Australian Local Government Grants Commission is not able to calculate the grant to the Outback Communities Authority in the same manner as other local governing bodies. Rather, a per capita grant has been established. The 2014–15 per capita grant was $373.95.
The general purpose component to the Outback Communities Authority was held to zero change for 2014–15 in recognition of the pause on indexation under the Financial Assistance Grant programme.

123
Appendix B • SA
Aboriginal communitiesSince 1994–95, the South Australian Local Government Grants Commission has allocated grants to five Aboriginal communities recognised as local governing authorities for the purposes of the Commonwealth Local Government (Financial Assistance) Act 1995 (Cth).
The Aboriginal communities are Anangu Pitjantjatjara Yankunytjatjara; Gerard Community Council Inc.; Maralinga Tjarutja; Nipapanha Community Council Inc.; and Yalata Community Council Inc.
Again due to the unavailability of data, grants for these communities are not calculated in the same manner as grants to other local governing bodies. Initially, the South Australian Local Government Grants Commission used Morton Consulting Services, who completed a study on the expenditure needs of the communities and their revenue raising capacities. Comparisons were made with communities in other states and per capita grants were established.
Grants have gradually been increased in line with the increase in the general purpose component of funding for South Australia since the initial study. For 2014–15, the per capita grant varied from $192.07 for the Gerard Community Council to $1230.71 for the Maralinga Tjarutja Community.
Changes to the methodology for distributing funding to local government under the Financial Assistance Grant programme for 2014–15 from that used in 2013–14There have been no changes to the South Australian Local Government Grants Commissions methodology for 2014–15, except for the continued exclusion of the libraries expenditure function on the expenditure side and library subsidies on the revenue side.
The South Australian Local Government Grants Commission completed a full review of its methodology and recommendations were presented by KPMG in July 2013. The South Australian Local Government Grants Commission are assessing and testing a number of the recommendations made in the review. It is expected that any changes made to the methodology will be incorporated into the South Australian Local Government Grants Commission’s recommendations for the 2016–17 Financial Assistance Grant programme.
Developments in the use of long-term financial and asset management plans by local governmentEach one of South Australia’s 68 local governments is required – by section 122 of the Local Government Act 1999 (SA) – to develop and adopt a long-term financial plan and an infrastructure and asset management plan, each covering a period of at least 10 years.
The Local Government Association of South Australia continued to provide advice and assistance to the sector in 2014–15 through its ongoing Financial Sustainability Program. During the year, resources made available to councils included:
• 2015 revisions of all but one of the Local Government Association of South Australia’s 21 financial sustainability information papers
• subsidies for hands-on expert assistance in asset and infrastructure management and long-term financial management to councils (predominantly small country councils) that had not yet adopted settings of financial sustainability
124
Local Government National Report 2014–15
• a short-term project for an Asset Management Advisory Committee of up to three experts to recommend, in consultation with councils, a strategy for the Local Government Association of South Australia to pursue research, skills development, and/or feasibility studies into a range of potential Local Government Association of South Australia asset management services
• calculation of costs for carrying out statutory duties where cost-recovery is limited by South Australian Government regulation, in anticipation of having fees raised to reflect cost recovery.
The Local Government Association of South Australia participated with the Australian Local Government Association in producing a national State of the assets 2014 report which:
• assessed the current position of councils in relation to implementation of asset management plans and long term financial plans)
• provided an assessment of the stock of sealed and unsealed roads and concrete and timber bridges in terms of condition, function and quality, with associated confidence levels
• provided additional data perspectives based on rural and urban classifications across each state and territory.
Actions to develop and implement comparative performance measures between local governing bodiesThe Local Government Association of South Australia’s former Comparative Performance Measurement Project has been discontinued. Comparisons between councils on a wide range of data are now facilitated by the annual publication by the South Australian Local Government Grants Commission of annual database reports. These reports are available at: http://www.dpti.sa.gov.au/local_govt/LGGC.
Reforms undertaken during 2014–15 to improve the efficiency and effectiveness of local government service delivery
Public healthThe Local Government Association of South Australia worked closely with the South Australian Government to deliver training and development opportunities to support council work on public health planning, and implementation of the South Australian Public Health Act 2011 (SA). This was complemented by comprehensive guidance materials; providing feedback and advice to councils regarding their regional public health plans; attendance and participation at a number of committees, presentations and workshops with councils and elected members; and ongoing communications via the Local Government Association of South Australia Circular and email.
The Local Government Association of South Australia partnered with SA Health to host a Public Health and Wellbeing: Planning for the Future workshop on 24 July 2014. The workshop featured 2007 Adelaide Thinker in Residence, Professor Ilona Kickbusch. Professor Kickbusch provided a keynote address on the critical role of local government in public health planning and action – international experiences and trends.
The Asbestos Briefing Forum was held on 28 November 2014 to outline the roles and responsibilities of different agencies (local government, SA Health, Safework SA, Environmental Protection Authority) in relation to asbestos. In addition, this forum promoted a new centralised website (www.asbestos.sa.gov.au) that local government could use to promote consistency of information to their communities regarding asbestos.

125
Appendix B • SA
The Local Government Association of South Australia, in partnership with SA Health, held a forum on regional public health plan implementation on 1 December 2014. This forum aimed to inform, update and host local government discussion on issues and developments associated with the early stages of implementing regional public health plans.
A Public Health Partnerships Forum was held on 11 May 2015. The aim of the forum was to provide councils with an update on public health partner authorities; highlight the interaction between regional public health plans and public health partner authorities; clarify emerging questions regarding public health partner authorities and public health partnerships; and provide examples of successful partnerships and identify what makes them successful.
A series of information papers and other relevant links regarding the South Australian Public Health Act 2011 (SA) and its particular application to councils were published on the Local Government Association of South Australia website and circulated to councils.
Asset managementThe Local Government Association of South Australia has convened a three-person Asset Management Advisory Committee to propose future directions for council support in the area of asset management. The committee held its first meeting in June 2015.
Climate changeWork began on the activities outlined in the Local Government Association of South Australia Climate Change Action Plan 2015–2017, which was finalised in December 2014.
The plan identified strategies that the Local Government Association of South Australia could implement to support councils in both their climate adaptation and mitigation efforts. During the year significant progress occurred in the following areas:
• LGA Renewable Energy Pilot Program
The Local Government Association of South Australia Renewable Energy Pilot Program raised more than $280 000 for the Local Government Association of South Australia Solar Innovation Fund, which was used to fund 14 innovative local government renewable or low-emission energy technology projects.
• Coastal Adaptation Decision Pathways Tool
The Coastal Adaptation Decision Pathways Tool, previously developed by the Local Government Association of South Australia, University of South Australia and Mallala Council was tested and applied on Yorke Peninsula.
• Regional climate adaptation plans
Five regions completed regional adaptation plans: Yorke and Mid North (Central Local Government Association); Eyre Peninsula (Eyre Peninsula Local Government Association); Resilient South (Cities of Onkaparinga, Marion, Holdfast Bay and Mitcham); Murray and Mallee (Murray and Mallee Local Government Association) and Barossa Valley.
Western Adelaide (Adapt West) was close to completing its regional adaptation plans by 30 June 2015, with plans for Northern and Eastern Adelaide, and Fleurieu and Kangaroo Island well under way.

126
Local Government National Report 2014–15
• Regional adaptation planning guidance
The Local Government Association of South Australia was instrumental in coordinating the development of regional adaptation plans and providing guidance and support for the planning process. In 2014–15, updated climate adaptation planning guidelines were produced by the Local Government Association of South Australia, representing the most up-to-date methods, processes and scientific data for climate adaptation planning.
• Climate change impacts on local government assets
A climate impacts overlay was developed in 2014–15 (incorporated into the Institute of Public Works Engineering Australia’s National Asset Management System Plus toolkit). Training on the use of the overlay was undertaken in Adelaide and received positive feedback.
• Science to Solutions Program
This leading practice partnership between the Local Government Association of South Australia and the South Australian Government continued in 2014–15. The Science to Solutions Program aimed to identify barriers to the uptake of climate adaptations and programme development, and provided tools and resources to facilitate uptake.– Stage one was completed in 2014–15 focusing on developing a customised research
methodology to guide a programme of detailed engagement in which staff from 42 councils participated
– Stage two will involve implementation and capacity building.
A funding agreement was signed by the project partners on 17 April 2015.
• Sea level rise problem definition Paper
The Sea level rise problem definition paper, completed in June 2014, was the basis for extensive consultation in 2014–15. For councils the main priority was the development of a well-informed South Australian Government strategic plan for the management of sea level rise.
Greenhouse and energy efficiencyIn 2014–15, the Local Government Association of South Australia called for councils to participate in the Energy and Greenhouse Gas Reporting Standards pilot which began on 6 June 2014. The pilot’s aim was to develop an emissions benchmarking programme. From this, the Local Government Association of South Australia hoped to initiate a review of criteria for the South Australian Local Government Grants Commission’s General Information Return, an economic study which will look at the business case for low energy/emissions technology and work related to sustainable street lighting.
Ageing and community servicesThe Local Government Association of South Australia made a submission on behalf of South Australian councils on several aspects of the Commonwealth Home Support Program. A number of the issues raised were addressed by the Australian Government, including extended funding agreements and a new funding package to assist councils and other providers with the transition to a new program.

127
Appendix B • SA
The Local Government Association of South Australia also worked with the Local Government Community Managers’ Network to prepare a revised Local Government Ageing Strategy. The revised strategy was intended to focus on how the needs of older people could be better integrated into councils’ services. It was intended that the revised strategy would include an implementation plan for future activities. The research and consultation stages were completed during the year.
The Local Government Association of South Australia played an instrumental role in securing the future of the Obesity Prevention and Lifestyle programme. The Local Government Association of South Australia and SA Health formed a joint working group to develop a sustainable and workable future for this important community programme, including making Obesity Prevention and Lifestyle resources available to all councils, not only those specifically participating in the programme. Other community services initiatives included: revising the Child Safe Environment Guidelines; releasing a publication showcasing council initiatives during Anti-Poverty Week; hosting a civic reception during Refugee Week; and participating in the National Local Government Cultural Forum.
Code of conductThe Local Government Association of South Australia Governance Panel handled 15 complaints referred by councils during 2014–15 year. At 30 June 2015, the Governance Panel’s funding arrangements were being reviewed.
Workforce planningDuring 2014–15, the Local Government Association of South Australia continued to provide a range of training options in the areas of need that were identified in an earlier sector-wide Workforce Planning project. The Local Government Association of South Australia’s Human Resources/Industrial Relations Panel supported councils directly with their workforce planning requirements, particularly with regard to updating and reviewing their plans. The Local Government Association of South Australia also sought expressions of interest for ageing workforce and human resource metrics projects.
Regional collaborationThe Local Government Association of South Australia Outreach Program pilot (in the Central Region and the Eyre Peninsula region) received final evaluation reports that were accepted by each region. The evaluation showed that the pilot delivered real outcomes for both regions and for the Local Government Association of South Australia Secretariat in terms of aligning needs with opportunity. In January 2015, the Local Government Association of South Australia successfully gained funding through the Local Government Research and Development Scheme to extend the Outreach Program to each of the five South Australian regions. Negotiated annual work plans were developed with each region and funds were transferred for 2015–16.
Human resourcesA discussion paper on options for award adjustments and a potential sector-wide enterprise bargaining approach was finalised and provided to councils. Indications were that councils supported work to modernise the award and address anomalies but there was not support for a sector-wide enterprise bargaining agreement.

128
Local Government National Report 2014–15
A project was established with funding from the Local Government Research and Development Scheme to scope award improvements. A reference group including employer and employee representatives was established to provide advice.
The Local Government Association of South Australia chose to enter into a tender arrangement for the delivery of human resources and industrial relations services to member councils for three years. This process resulted in the appointment of a panel of seven of the state’s most highly regarded legal, human resources and recruitment firms to deliver the required services.
The firms selected each had significant experience working within the local government environment and councils were appreciative of the high standard of advice and assistance.
Although the services provided to each council were confidential, each firm maintained contact with the Local Government Association of South Australia regarding the broader trends and issues surrounding the scope of the service, in order to assist with any sector-wide policy matters that could impact on employee relations.
Economic developmentIn 2014–15, the Local Government Association of South Australia adopted an Economic Development Statement that described the fundamental role local government could play in economic development and how that would complement the roles of the Australian and South Australian governments. It outlined 11 key economic development priorities for local government.
The Metropolitan Local Government Group ranked economic development as one of its top four priorities for both 2014 and 2015. In October 2014, the Metropolitan Local Government Group hosted an Economic Development Forum which featured presentations of best-practice case studies from nine metropolitan councils to facilitate shared learning and to promote the value of economic development to community wellbeing. A booklet capturing the case studies was distributed to participants and was published online.
The Metropolitan Local Government Group established an Economic Development Think Tank comprising a business leader from each council area to advise the Metropolitan Local Government Group and councils on economic development initiatives.
The Local Government Association of South Australia co-hosted a delegation of 25 local government representatives representing 14 councils, accompanying the Premier’s Mission to Shandong, South Australia’s sister-state in China, in May 2015. The Local Government Association of South Australia President represented the local government sector as a witness to the signing of a memorandum of understanding on strengthening business cooperation through collaboration between the prefectures of Shandong and South Australia’s local councils. This memorandum of understanding was intended to lead to the establishment of a Shandong –South Australia Local Government Economic Development Platform to facilitate and stimulate trade and investment between the regions.
Legislative changeDuring 2014–15, the Local Government Association of South Australia participated in an Environment Protection Authority working group to develop legislative drafting instructions for a Local Nuisance and Litter Control Bill. The Local Government Association of South Australia also used a local government reference group of metropolitan and regional council staff to inform this process and to respond to key issues arising from the process.

129
Appendix B • SA
Training new council membersThe Local Government Association of South Australia undertook a state-wide roll out of the Council Member Induction Training programme following the introduction of the Training Standard for Council Members in November 2014. Thirty-five councils participated in the rollout, resulting in 310 council members (and some staff) successfully completing the training requirement. Feedback received during this training was complimentary and the programme was universally well received in terms of value, structure and outcomes.
This training programme was also released in an online format with great success. Twenty-seven councils bought the site licence, providing unlimited access for 12 months. A training gap analysis and record-keeping template was also released to councils to assist with the management of mandatory training requirements.
Review of natural resource management servicesThe Local Government Association of South Australia reviewed natural resource management arrangements, in particular the Natural Resources Management Act 2004 (SA) and how local government could approach a legislative review. The Local Government Association of South Australia continued to work with councils in 2014–15 on options for natural resource management to be better aligned with other South Australian Government and local government governance and regional planning processes.
WasteFeedback was provided on the draft State waste strategy 2015–20 intended to shape the future of waste management in South Australia. Local government is a critical stakeholder in the waste management sector and the Local Government Association of South Australia continued to lobby to ensure its high-performance waste management practices were recognised and future policy would not negatively affect the sector.
Lobbying for changes to the National Television Computer Scheme took place throughout the year to ensure councils were not disadvantaged by the increasing costs of e-waste recycling. The Australian Government accepted recommendations that would improve outcomes for the scheme and local government more broadly.
Water and wastewaterThrough the Water Issues Advisory Panel, the Local Government Association of South Australia provided assistance to councils in the areas of capacity building, pricing of water and enhanced communication. Parallel to this process the Local Government Association of South Australia continued to lobby for funding of priority projects. A submission was provided to a Senate Inquiry into stormwater in April 2015.
During 2014–15 the Local Government Association of South Australia Community Wastewater Management Scheme Management Committee completed the Beachport, Mount Compass, Gladstone and Tulka schemes, providing each of those communities with a significant asset. The Truro and the Mallala schemes progressed well and are nearing practical completion.
The Local Government Association of South Australia Community Wastewater Management Scheme Management Committee continued its technical and seed-funding support of the Eyre Peninsula Joint Community Wastewater Management Scheme Services User Group incorporating nine councils. An additional user group in the Central Region started negotiating

130
Local Government National Report 2014–15
with the committee in the first half of 2015 for support funding and advisory assistance. These groups joined the South East User Group in seeking to achieve greater operational efficiencies and knowledge-sharing on a regional basis.
Legal services pilot programmeA 12-month pilot programme ended on 4 June 2015. The pilot programme aimed to assist councils with legal matters under the Local Government Act 1999 (SA). The purpose of the pilot programme was to help councils to reduce overall legal expenditure and maximise value from required expenditure. The Legal Services Pilot Program attracted the involvement of 11 councils and was independently evaluated at the end of 12 months. Following the resignation of the legal advisor, the Local Government Association of South Australia decided not to extend the pilot programme.
Public housing transferThe Local Government Association of South Australia worked closely with the South Australian Minister for Local Government during the year, seeking legislative backing to retain rate income on former South Australian Housing Trust properties. Draft legislative provisions were being considered at the end of the financial year.
Local Government Research and Development SchemeThe Local Government Research and Development Scheme continued as a primary source of funding for research in local government. Funded through tax-equivalent payments by the Local Government Finance Authority, it was overseen by an advisory committee. The scheme has approved a total of 597 projects since its inception in 1997, with a total of $25.4 million in approved funding. This has attracted significant matching funds and in-kind support from other sources.
There were 39 projects funded by the Local Government Research and Development Scheme during 2014–15.
Guidelines and model policiesThe Local Government Association of South Australia continued to provide a range of material, to assist councils to meet their governance obligations. These materials include model policies and procedures, guidelines, information papers and Codes of Practice.
At 30 June 2015, the Local Government Association of South Australia completed a five-year rolling programme for reviewing and revising its model policies, procedures and guidelines. Approximately 95 per cent of all model policies, procedures and guidelines were reviewed during that period and revised as necessary.
Initiatives undertaken and services provided by local governments to Aboriginal and Torres Strait Islander communitiesThe Local Government Association of South Australia continued to assist the Kaurna Local Government Leadership Group, which has led to 25 councils resolving to enter into Indigenous land use agreements with the Kaurna people. The land use agreements incorporate: a protocol to simplify Native Title (South Australia) Act 1994 (SA) processes; an Aboriginal heritage

131
Appendix B • SA
protocol; a planning protocol; a liaison committee; and establishment of a fund supported by participating councils.
Local government member appointments have been made in anticipation of establishment of the Land Use Agreements Liaison Committee. The 25 participating councils have collectively committed more than $185 000 to establish and operate the Land Use Agreements Liaison Committee. Work is proceeding to finalise the agreements.
During 2014–15, the South Australian Office of Local Government has been preparing to deliver the municipal services programme to Aboriginal communities across South Australia. In April 2015, the South Australian Government secured $15 million from the Australian Government to provide municipal services to Aboriginal communities outside of the Anangu Pitjantjatjara Yankunytjatjara Lands.
Local government reform activities in the areas of deregulation and legislative change by the South Australian GovernmentDuring 2014–15, the South Australian Office of Local Government progressed amendments to the Local Government Act 1999 (SA) to:
• improve local government accountability and governance by implementing recommendations made by the South Australian Ombudsman as a result of investigations and audits of local government matters
• achieve a more consistent and contemporary legislative framework for the local government sector
• reform the conflict of interest provisions, defining material conflicts as the most serious, while introducing perceived conflicts of interest, in response to repeated recommendations by the South Australian Ombudsman.
132
Local Government National Report 2014–15
Report from TasmaniaThis report has been provided by the Tasmanian Government in liaison with the Local Government Association of Tasmania.
The extent to which the allocation of funds for local government purposes for your jurisdiction has been made on a full horizontal equalisation basisHorizontal equalisation is the fundamental principle the Tasmanian State Grants Commission uses to determine the allocation of funding under the Financial Assistance Grant programme amongst Tasmanian councils. By doing so, the base grant funds should be distributed in a way that, were each council to make the same effort to raise revenue from its own sources and operated at the same level of efficiency, each would have the capacity to provide services at the same level.
The achievement of full horizontal equalisation by the Tasmanian State Grants Commission is, however, compromised both by insufficient grant funds being available to meet the calculated funding needs of councils, and the requirement for the funding allocations to also adhere to the minimum grant principle. The minimum grant principle ensures that no local governing body will be allocated a base grant less than 30 per cent of its equal per capita share. In 2014–15, this resulted in five councils assessed as without relative need, receiving an entitlement of base grant funds of $5.14 million, or 14.7 per cent of the total base grant pool. Hence, there is a reduced pool of funds available for the remaining 24 of Tasmania’s 29 councils that the Tasmanian State Grants Commission has assessed as having a relative need for support.
In arriving at its distribution recommendations, the Tasmanian State Grants Commission also takes into account the requirements of the other National Principles issued under the Local Government (Financial Assistance) Act 1995 (Cth) being effort neutrality, other grant support, Aboriginal people and Torres Strait Islanders, and council amalgamation.
The methodology used for distributing funding under the Financial Assistance Grant programme to local government for 2014–15 by your Local Government Grants CommissionComprehensive details on the Tasmanian State Grants Commission’s methodology for determining the distribution of the 2014–15 funding under the Financial Assistance Grant programme is available in the Tasmanian State Grants Commission financial assistance distribution methodology paper and the State Grants Commission annual report – Financial Assistance Grant allocation for 2014–15, available at http://www.treasury.tas.gov.au.
The general purpose component is distributed on the basis of a two pool approach, by firstly allocating the per capita grant (30 per cent of total base grant) on the basis of council population shares, and then distributing the remainder (70 per cent of total base grant) on a relative needs or equalisation basis. This is seen as the simplest and most transparent means of giving effect to third National Principle in relation to the minimum grant.
The equalisation model calculates a distribution of the relative needs pool using a balanced budget approach; that is, each council’s relative needs grant entitlement is derived from the difference between the council’s expenditure requirement necessary to provide services to a common standard with all other councils, and the council’s revenue capacity.

133
Appendix B • Tas
Councils that are assessed to have a negative standardised deficit (i.e. a surplus where revenue capacity is greater than expenditure requirement) do not receive a relative needs grant component. These councils only receive a population share of the per capita minimum grant portion of the base grant pool. The relative needs component portion of the general purpose component is allocated amongst councils assessed to have positive standardised deficits (i.e. a deficit where expenditure requirement is greater than revenue capacity) and is allocated in proportion to those standardised deficits.
Calculation of base grantsThe assessment model uses a balanced budget approach whereby the grant entitlement of a council is calculated according to the difference between expenditure requirement and revenue capacity as calculated by the Tasmanian State Grants Commission. The basic equalisation calculation is: revenue capacity – expenditure requirement = assessed surplus or deficit.
Revenue capacity is calculated by adding the three year averages of:
• the revenue a council would raise by applying the state-wide average rate in the dollar to all its rateable property (standardised revenue)
• the council’s per capita grant allocation
• certain other financial support payments.
Expenditure requirement is calculated by adding the following:
• a three-year average of the expenditure ‘required’ to provide a common range of services (standardised expenditure)
• any allowances for additional support provided by councils for either general practitioner practices or airports
• the budget result term which enables a balanced budget at a state level.
Standardised expenditure is calculated as follows:
1. calculate total state-wide spending for each expenditure category
2. share the total expenditure between councils on a per capita basis (standard expenditure)
3. apply cost adjustors to standard expenditure to reflect inherent cost advantages or disadvantages faced by individual councils in providing services.
Cost adjustors include: absentee population; scale (admin); climate; scale (other); dispersion; tourism; isolation; unemployment; population decline; worker influx and regional responsibility.
Each council’s relative need for additional support is determined based on their assessed surplus/deficit position and is interpreted by using the following approach:
• assessed deficit – expenditure requirement exceeds revenue capacity. A council will receive a share of the relative needs pool according to its share of the total state-wide deficit
• assessed surplus – revenue capacity exceeds expenditure requirement. A council will not receive a share of the relative needs pool, but will still be entitled to its population share of the per capita pool.

134
Local Government National Report 2014–15
Calculation of road componentThe Local Government (Financial Assistance) Act 1995 (Cth) National Principles require that the road grant component be allocated according to asset preservation. In accordance with this principle and to ensure that the grant allocation reflects the mix of road and bridge assets maintained by councils, the road grant is proportionally allocated according to council shares of the modelled cost of asset preservation of bridge (bridge and culvert assets) and road assets in Tasmania.
Road preservation modelThe model uses dimensions of the average Tasmanian road, as well as average costs and maintenance schedules to calculate the state average cost per kilometre per annum for councils to maintain their road networks. Three road types are included within the assessment. These are urban sealed, rural sealed and unsealed.
Cost adjustors and an allowance are applied within the model to account for relative cost advantages or disadvantages faced by councils in maintaining roads. These cost adjustors include rainfall, terrain, traffic and remoteness. An urbanisation allowance is also applied. The model calculates an assessed cost for each council to maintain its road network. The available funds are then distributed to councils based on their share of the total state-wide cost to councils.
Grant stabilityThe Tasmanian State Grants Commission is aware of councils’ preference for grant stability. In finalising grants each year the Tasmanian State Grants Commission applies a 15 per cent cap (to prevent councils grant increasing by more than 15 per cent annually), and a 10 per cent collar (to prevent council’s grants decreasing by more than 10 per cent annually) to the base grant allocations.
In determining the 2014–15 base grant allocations, the 15 per cent cap affected seven councils. The 10 per cent collar affected three councils. Caps and collars are not used in the road grant model.
Triennium reviewsThe Tasmanian State Grants Commission monitors council practices to ensure that its methods for distributing both the base and road grants are contemporary and equitable across councils. The Tasmanian State Grants Commission also monitors developments in local council policies, with a view to ensuring that the modelling reflects standard council policies.
In this context, the Tasmanian State Grants Commission operates a triennial review policy whereby major methodological changes are incorporated into its assessments every three years, with data updates and minor methodological revisions incorporated each year. This policy is designed to balance the conflict between grant stability and the desirability of updating the modelling to reflect the horizontal equalisation principle and developments in council practices.
Data sourcesThe Tasmanian State Grants Commission’s models are primarily data driven, which means that significant changes in data can influence calculated grant shares. The Tasmanian State Grants Commission takes the accuracy and consistency of data seriously and actively seeks to increase
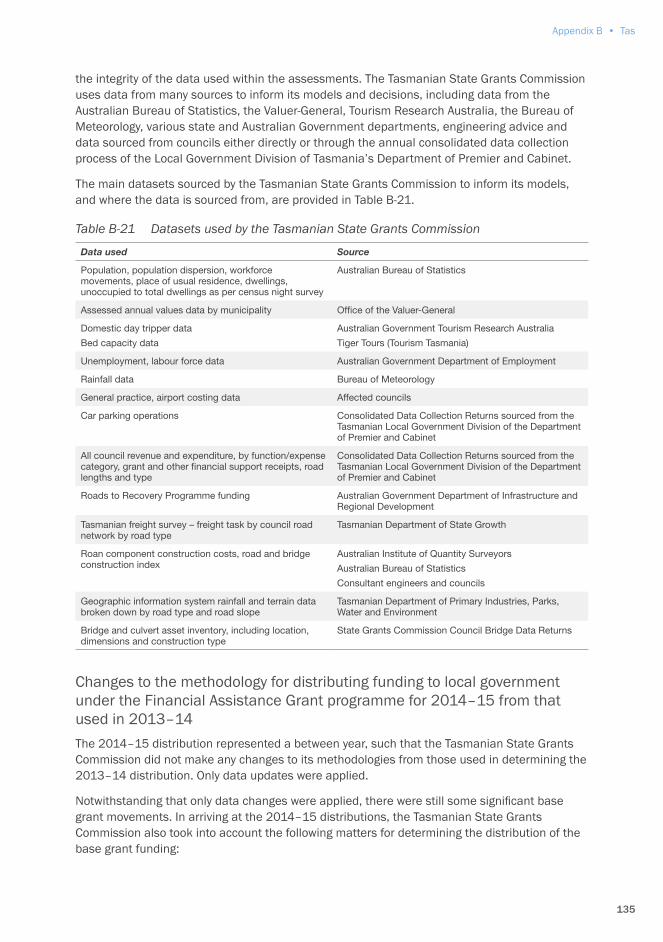
135
Appendix B • Tas
the integrity of the data used within the assessments. The Tasmanian State Grants Commission uses data from many sources to inform its models and decisions, including data from the Australian Bureau of Statistics, the Valuer-General, Tourism Research Australia, the Bureau of Meteorology, various state and Australian Government departments, engineering advice and data sourced from councils either directly or through the annual consolidated data collection process of the Local Government Division of Tasmania’s Department of Premier and Cabinet.
The main datasets sourced by the Tasmanian State Grants Commission to inform its models, and where the data is sourced from, are provided in Table B-21.
Table B-21 Datasets used by the Tasmanian State Grants Commission
Data used Source
Population, population dispersion, workforce movements, place of usual residence, dwellings, unoccupied to total dwellings as per census night survey
Australian Bureau of Statistics
Assessed annual values data by municipality Office of the Valuer-General
Domestic day tripper data
Bed capacity data
Australian Government Tourism Research Australia
Tiger Tours (Tourism Tasmania)
Unemployment, labour force data Australian Government Department of Employment
Rainfall data Bureau of Meteorology
General practice, airport costing data Affected councils
Car parking operations Consolidated Data Collection Returns sourced from the Tasmanian Local Government Division of the Department of Premier and Cabinet
All council revenue and expenditure, by function/expense category, grant and other financial support receipts, road lengths and type
Consolidated Data Collection Returns sourced from the Tasmanian Local Government Division of the Department of Premier and Cabinet
Roads to Recovery Programme funding Australian Government Department of Infrastructure and Regional Development
Tasmanian freight survey – freight task by council road network by road type
Tasmanian Department of State Growth
Roan component construction costs, road and bridge construction index
Australian Institute of Quantity Surveyors
Australian Bureau of Statistics
Consultant engineers and councils
Geographic information system rainfall and terrain data broken down by road type and road slope
Tasmanian Department of Primary Industries, Parks, Water and Environment
Bridge and culvert asset inventory, including location, dimensions and construction type
State Grants Commission Council Bridge Data Returns
Changes to the methodology for distributing funding to local government under the Financial Assistance Grant programme for 2014–15 from that used in 2013–14The 2014–15 distribution represented a between year, such that the Tasmanian State Grants Commission did not make any changes to its methodologies from those used in determining the 2013–14 distribution. Only data updates were applied.
Notwithstanding that only data changes were applied, there were still some significant base grant movements. In arriving at the 2014–15 distributions, the Tasmanian State Grants Commission also took into account the following matters for determining the distribution of the base grant funding:

136
Local Government National Report 2014–15
• changes in water and sewerage distributions to councils as a result of the move to equity-based dividend arrangements for TasWater. The Tasmanian State Grants Commission recognised this change through backcasting, whereby water and sewerage returns based on the equity arrangements were imputed into prior year’s returns data
• impacts on the rating base of both the January 2013 bushfires and the reclassification of forestry land as reserves under the Tasmanian Forestry Agreement from 1 July 2014.
Legislative changeDuring the 2014–15 year, the State Grants Commission Amendment Act 2015 (Tas) was passed by the Tasmanian Parliament and commenced on 15 May 2015. The State Grants Commission Amendment Act 2015 (Tas) amended the State Grants Commission Act 1976 (Tas) by reducing the number of members of the Tasmanian State Grants Commission from four to three, such that it now comprises two local government nominated members and a third member (Chair), nominated by the Secretary of the Tasmanian Department of Treasury and Finance and approved by the State Treasurer. Local government representation on the Tasmanian State Grants Commission was unaffected and remains unchanged at two members. This also increased the maximum appointment term for members from three years to five years and removed the position of Secretary from the statute.
Developments in the use of long-term financial and asset management plans by local governmentAfter extensive consultation with the local government sector in 2013, the Tasmanian Government amended the Local Government Act 1993 (Tas) to mandate long-term financial and strategic asset management planning for Tasmanian councils, as well as other related financial and asset management initiatives.
The amendments also provided a power for the Minister responsible for local government to make statutory rules (orders) regarding long-term financial management and strategic asset management planning, financial management and asset management strategies, asset management policies, audit panels and financial and asset management sustainability indicators.
Three ministerial orders were developed in consultation with the Local Government Association of Tasmania and the local government sector. The orders, proclaimed and gazetted in February 2014, were the:
• Local Government (Content of Plans and Strategies) Order 2014 (Tas), which outlines the minimum requirements necessary for all long-term financial and asset management planning documents
• Local Government (Management Indicators) Order 2014 (Tas), which lists the financial and asset management sustainability indicators (the same indicators that the Auditor-General reports annually to Parliament)
• Local Government (Audit Panels) Order 2014 (Tas), which provides guidance to councils on the structure, membership and primary functions of audit panels.
The Tasmanian Auditor-General has been monitoring compliance with these legislative requirements during his annual audits of Tasmanian Council’s financial statements. As of 30 June 2015, the Auditor-General found that 18 (15 in 2013–14) of the 29 councils fully complied with all three Orders and another 10 partially complied. Only one council was yet to appoint an audit panel in accordance with the Local Government (Audit Panels) Order 2014 (Tas).

137
Appendix B • Tas
In 2014–15, the Auditor-General found that 21 councils fully complied with the Local Government (Content of Plans and Strategies) Order 2014 (Tas) (compared with 17 in 2013–14) and a further eight partially complied with the order. In 2014–15, 24 councils fully complied and five partially complied with the Local Government (Management Indicators) Order 2014 (Tas). This improved from 20 fully compliant and nine partially compliant in 2013–14.
The Auditor-General’s findings are indicative that the majority of Tasmanian councils are making strong progress in the area of financial and asset management planning. Moreover, since the introduction of mandatory long-term financial and asset management planning, there has been a noteworthy improvement in the financial and asset management performance of local government in Tasmania, as measured by a number of financial and asset management sustainability indicators. The 2014-15 financial year was the first of the last nine years that the sector as a whole returned an average operating surplus, which is a significant improvement compared to the sizable operating deficits reported in prior years.
In the last 12 months, the Local Government Association of Tasmania has continued to support councils with residual funds obtained from the Commonwealth’s Local Government Reform Project. This has included direct funding to councils struggling to meet improvement targets; the development of 21 practice summaries on financial and asset management for use by councillors and council officers; and a two-day forum focused on financial and asset management best practice.
The Tasmanian Government is continuing to provide support and guidance resources to councils with respect to their long-term financial and asset management processes.
Actions to develop and implement comparative performance measures between local governing bodiesUntil 2014, the Tasmanian Government produced the Sustainability objectives and indicators report to measure council performance on an annual basis.
The Sustainability Objectives and Indicators project was a key initiative of the Tasmanian Government to drive sustainability reform and improve performance and to encourage the local government sector to do the same. The Sustainability Objectives and Indicators project formed part of the Tasmanian Government’s Financial Sustainability Framework for Local Government, of which the overall objective was to ensure the local government sector improved its sustainability and developed and improved its financial and asset management capability and capacity. The Sustainability Objectives and Indicators project was progressed in close collaboration with the Local Government Association of Tasmania.
The Sustainability objectives and indicators report contained detailed analysis and presentation of financial, asset management and planning and development data and in particular, a number of sustainability indicators.
The Tasmanian Government reviewed the Sustainability Objectives and Indicators project in December 2014 and evaluated its efficacy at driving a culture of continuous improvement within Tasmanian councils. The review report made the general finding that while there was strong support for a performance assessment system for local government in Tasmania, the Sustainability objectives and indicators report in its current form was only a useful tool for some councils. The evaluation found that the indicators measured through the Sustainability objectives and indicators report were valuable, but there would be benefits in reconsidering what the indicators currently measure and identifying indicators that are meaningful to a

138
Local Government National Report 2014–15
wider audience. The ultimate finding from the review was that the Sustainability objectives and indicators report does not drive continuous improvement and that any performance reporting needs to be supported by other tools and mechanisms to promote continuous improvement.
In response to the review findings, it was proposed that the Sustainability objectives and indicators report be subsumed into a new Continuous Improvement Framework. Options for the framework included:
• an annual performance assessment report or reports as required to meet the different needs of different audiences
• self-assessment tools to support ongoing assessment of operations and performance
• best practice promotion and case studies
• information and education aimed at improving performance in line with needs identified through the performance assessment report.
These recommendations are being progressed in consultation with the Continuous Improvement Framework Advisory Group which comprises representatives from councils, the Local Government Association of Tasmania, the Tasmanian Audit Office and the Tasmanian Department of Premier and Cabinet.
Core local government data continues to be provided to the Australian Bureau of Statistics for its local government finance statistics and to the Tasmanian State Grants Commission for its distribution of the Australian Government funding under the Financial Assistance Grant programme.
Currently, the Local Government Association of Tasmania conducts a comprehensive biennial workforce survey. It is anticipated that this data collection will be incorporated into the annual data collection conducted by the Tasmanian Government, improving the quality and cohesiveness of the data set.
Reforms undertaken during 2014–15 to improve the efficiency and effectiveness of local government service deliveryIn February 2015, the Tasmanian Minister for Planning and Local Government began discussions with mayors, deputy mayors and general managers regarding voluntary amalgamations and strategic shared service initiatives. Tasmania committed to provide financial assistance to councils who would undertake feasibility studies into voluntary amalgamations or enhanced strategic shared services. In doing so, the Tasmanian Government emphasised that proposed reforms must: be in the interest of rate payers; improve the level of services for communities; preserve and maintain local representation; and ensure that the financial status of the entities is strengthened.
Two memoranda of understanding have been signed between the Tasmanian Government and councils in the southern region of Tasmania. These outline proposals to conduct feasibility studies into local government reform opportunities including voluntary amalgamations, strategic shared services and resource sharing options for:
• Greater Hobart Councils, including Hobart City, Clarence City, Glenorchy City and/or Kingborough Councils
• South East Councils, including Clarence City, Sorell, Glamorgan-Spring Bay and Tasman Councils, and as a subset of this: Clarence City, Sorell and Tasman Councils; Sorell and Tasman Councils; and Sorell, Glamorgan Spring Bay and Tasman Councils.

139
Appendix B • Tas
In addition, proposals to investigate comprehensive shared service arrangements are close to completion, with memoranda of understanding currently being drafted for the nine councils in the Cradle Coast region and the eight councils in the northern region.
In May 2015, the Tasmanian Premier’s Local Government Council endorsed a three-year strategic action plan that will guide state government and local government collaboration in four priority areas: collaboration, economic development, governance and legislation. Several initiatives have already been completed including:
• development of a memoranda of understanding to reduce the burden and increase efficiency associated with key regulatory requirements
• an audit of shared services
• development of a Good Governance Guide (to be released in March 2016).
The Local Government Association of Tasmania continues to support service delivery improvements and efficiency for members through the following mechanisms:
• whole-of-sector procurement activity through participation in the national procurement network as well as direct engagement (such as the whole of sector public street lighting contract delivered this year for the first time as we moved to a contestable energy market)
• whole-of-sector tools to support compliance, such as updated delegations and compliance registers and the work health and safety suite of policies, procedures and guidance
• improved capacity through regular training offerings to elected members and officers.
Initiatives undertaken and services provided by local governments to Aboriginal and Torres Strait Islander communitiesThe Tasmanian Government is not aware of any specific local government initiatives undertaken in 2014–15 in Tasmania in relation to service delivery to Aboriginal and Torres Strait Islander communities.
Local government reform activities in the areas of deregulation and legislative change by the Tasmanian GovernmentIn 2014–15, the Tasmanian Government amended the following legislation:
• Burial and Cremation (Handling of Human Remains) Regulations 2005 (Tas) and the Burial and Cremation (Cemetery) Regulations 2005 (Tas)
• Local Government (Meeting Procedures) Regulations 2005 (Tas)
• Local Government (General) Regulations 2005 (Tas)
• Local Government Act 1993 (Tas) through the Local Government Amendment (Code of Conduct) Bill 2015.
The State Government reviewed the Burial and Cremations (Cemetery) Regulations 2005 (Tas) and the Burial and Cremation (Handling of Human Remains) Regulations 2005 (Tas), together with a third set of regulations, the Burial and Cremation (Cremation) Regulations 2012 (Tas), remaking and combining the three sets of regulations into a single set of regulations – the Burial and Cremation Regulations 2015 (Tas). The combined regulations were remade in June 2015.

140
Local Government National Report 2014–15
The Local Government (Meeting Procedures) Regulations 2015 (Tas) took effect from 29 June 2015 and prescribes meeting procedures for councils and council committees. The new regulations make changes to the procedures for notification of meetings, adjournment of meetings, closed meetings, council motions, minutes of meetings and miscellaneous matters.
The regulations also make a number of definitional amendments to increase clarity and consistency and remove duplication within the regulations and between the regulations and the Local Government Act 1993 (Tas).
The Local Government (General) Regulations 2015 (Tas) took effect from 29 June 2015 and amend and remake the Local Government (General) Regulations 2005 (Tas). The amendments make changes to the provisions for tenders and contracts, expenses for elected members, council land information certificates (section 337) and related questions and miscellaneous matters.
The largest legislative reform of 2014–15 was the Local Government Amendment (Code of Conduct) Bill 2015. The amended legislation provides local government with an effective, enforceable and streamlined framework to deal with councillor code of conduct complaints under the Tasmanian Local Government Act 1993 (Tas).
Other minor amendments to the Tasmanian Local Government Act 1993 (Tas) that progress the government’s commitment to streamline and enhance the legislative framework provided for local government included restricting the eligibility criteria for nominating as a councillor to persons who have their principal place of residence in Tasmania.
The Local Government Amendment (Code of Conduct) Bill 2015 has been passed by the Tasmanian Parliament, and the Tasmanian Department of Premier and Cabinet has commenced the task of implementing the new streamlined code of conduct system, including developing the model code of conduct for local government and setting up the state-wide code of conduct panel.
Councils in Tasmania leading digital transformationAll Tasmanian councils have made significant progress in the area of delivering services in a digital format. At the forefront of these is the Launceston City Council, which now delivers the following services and functions digitally:
• electronic payments and billing, along with a host of tracking and lodgement systems
• planning and building application submission and assessment approvals
• video conferencing across multiple locations
• an online community engagement platform and feedback tool
• Snap Send Solve app that lets residents report issues and provide feedback to the council in under 30 seconds
• Start Something Special app which has the latest information on accommodation, transport, services and things to see and do while in Launceston and the north of Tasmania
• live streaming of council meetings
• Twitter, Facebook, and Instagram accounts and YouTube channels.

141
Appendix B • Tas
Twenty of the 29 councils have their interim planning schemes accessible through iplan, the Tasmanian Government’s online resource for planning and development. This collaborative initiative allows the planning schemes to be searched for information relevant to a property or development. A business case is currently being developed which would allow iplan to be expanded to include all local planning schemes, manage referrals and allow for online development applications and tracking. It is seen by the local government sector as an important vehicle to support the implementation of the new single state-wide Tasmanian Planning Scheme.
As the national broadband network roll out progresses councils are exploring new digital opportunities. The Local Government Association of Tasmania has scheduled three regional breakfast forums in February 2016 which focus on the cost of not taking up the national broadband network opportunity and will highlight local government innovations from around the country. Subsequent to those forums, it is the Local Government Association of Tasmania’s intent to canvas the interest of members in pursuing a whole-of-sector digital strategy.

142
Local Government National Report 2014–15
Report from the Northern Territory Government
The extent to which the allocation of funds for local government purposes for your jurisdiction has been made on a full horizontal equalisation basisThe Northern Territory Grants Commission raise concerns with the extent that the Northern Territory is able to equalise given its circumstances and the National principles it is required to adhere to under the Local Government (Financial Assistance) Act 1995 (Cth). The following is a summary of the key concerns:
• the division of the general purpose funding pool on a per capita basis between the jurisdictions, when the legislation requires allocation within jurisdictions on the basis of horizontal equalisation. Whilst the Northern Territory Grants Commission is of the belief that the methodology achieves horizontal equalisation as best it can, there is still the situation where a jurisdiction in which local government is in its infancy, receives a total of $16.5 million to assist 17 councils to provide local government services in one of the most remote and disadvantaged environments in Australia
• a widening shortfall between the methodology’s assessed needs and the funds available, driven primarily by councils’ costs increasing at a greater rate than the escalation factor applied to the funding pool. This is further exacerbated by the Australian Government’s decision to pause indexation for three years
• the annual decrease in real terms of the funding pool, which is highlighted by the overall national pool in 1991–92 representing approximately one per cent of Australian Government revenue. In 2014–15, this figure had dropped to approximately point six of one per cent of Australian Government revenues
• a direct contradiction between the achievement of horizontal fiscal equalisation and the requirement for the respective jurisdictions to allocate all councils 30 per cent per capita minimum grant. In the Northern Territory context that means that approximately $3 million of the $16.5 million grant pool goes to councils with no assessed need for funding.
The methodology used for distributing funding under the Financial Assistance Grant programme to local government for 2014–15 by your Local Government Grants CommissionThe Northern Territory Grants Commission’s methodology conforms to the requirement for horizontal equalisation as set out in the Local Government (Financial Assistance) Act 1995 (Cth).
The Northern Territory Grants Commission, in assessing relative need for allocating general purpose funding, uses the balanced budget approach to horizontally equalise based on the formula of: assessed expenditure need minus assessed revenue capacity equalling assessed equalisation requirement.
The methodology calculates standards by applying cost adjustors and average weightings to assess each local government’s revenue raising capacity and expenditure need. The assessment is the Northern Territory Grants Commission’s measure of each local government’s ability to function at the average standard in accordance with the National Principles.

143
Appendix B • NT
PopulationThe Northern Territory’s funding is based on a total population figure using the latest Australian Bureau of Statistics estimated resident population figures and then adjusted to align with the population total from the Northern Territory Department of Treasury and Finance.
Revenue raising capacityAs the ownership of the land on which many communities are located is vested in land trusts established pursuant to the Aboriginal Lands Rights (Northern Territory) Act 1976 (Cth), it is not, for all intents and purposes, feasible to use a land valuation system solely as the means for assessing revenue raising capacity.
The collection of actual accurate financial data through the Northern Territory Grants Commission’s annual returns enabled a number of revenue categories to be introduced, including municipal, shire and regional council rates, domestic waste and interest.
In addition, to accord with the National Principles, other grant support to local governing bodies by way of the Roads to Recovery Programme, library and local roads grants are recognised in the methodology. In the case of recipients of the Roads to Recovery Programme, 50 per cent of the grant was included. Recipients of library grants and local roads grants have the total amount of the grant included.
The Northern Territory Grants Commission considers that, given unique circumstances within the Territory, this overall revenue raising capacity approach provides a reasonable indication of a council’s revenue raising capacity. For the 2014–15 allocations, financial data in respect of the 2012–13 financial year was used.
Expenditure needsThe assessment of standard expenditure is based on the Northern Territory average per capita expenditure within the expenditure categories to which cost adjustors reflecting the assessed disadvantage of each local government are applied.
The Northern Territory Grants Commission uses the nine expenditure categories in accordance with the Australian Bureau of Statistics Local Government Purpose Classifications. In the 2012–13 and 2013–14 grant calculations, an additional expenditure category was created (Regional Centre Recognition) to acknowledge the financial drains on municipal councils caused by urban drift. This expenditure category was also used for the 2014–15 grant allocations.
Cost adjustorsThe Northern Territory Grants Commission uses cost adjustors to reflect a local government’s demographics, geographical location, external access, and the area over which it is required to provide local government services. All these influence the cost of service delivery. There are three cost adjustors, being location, dispersion and Aboriginality.
Minimum grantsFor most local governments, the assessed expenditure needs exceed the assessed revenue capacity, meaning there is an assessed need. In five cases, assessed revenue capacity is greater than assessed expenditure need, meaning that there is no assessed need. However, as the legislation requires that local governments cannot get less than 30 per cent of what they would have been allocated had the funding been distributed solely on the basis of population, five local government councils still receive a grant, or what is referred to as the minimum grant.

144
Local Government National Report 2014–15
Formulae – revenue componentThe formulae for the revenue component for all councils is provided in Table B-22.
Table B-22 Northern Territory formulae for the revenue component
Assessed revenue raising capacity = Total identified local government revenue
Total local government revenue = Assessed Northern Territory average revenue plus other grant support plus budget term
Where
Revenue category = Domestic waste, garbage, general rates, general rates other, special rates parking, special rates other, fines and interest
Domestic waste = Per capita
Garbage other = Actual
General rates = Average rate
Service charges = Per capita
Interest = Actual
State income by revenue category 2012–13 = Actual state local government gross income
Actual state local government gross income 2012–13
= $135 059 737
Other grant support = Roads to Recovery Programme grant 2013–14 (50 per cent), library grant 2013–14 and roads grant 2013–14
Budget term = Population multiplied by per capita amount
Total local government revenue for 2014–15 allocations
= $297 712 818
Formulae – expenditure componentsTotal local government expenditure of $297 712 818 is apportioned over each expenditure component.
• General public services ($101 387 202)
• Community population/Northern Territory population x general public services expenditure x Aboriginality
• Public order and safety ($17 950 535)
• Community population/Northern Territory population x public order and safety expenditure x (location + dispersion + Aboriginality)
• Economic affairs ($32 052 500)
• Community population/Northern Territory population x economic affairs expenditure x (location + dispersion)
• Environmental protection ($16 350 357)
• Community population/Northern Territory population x environmental protection expenditure
• Housing and community amenities ($46 537 611)
• Community population/Northern Territory population x housing and community amenities expenditure x (location + dispersion + Aboriginality)
• Health ($2 937 643)

145
Appendix B • NT
• Community population/Northern Territory population x health expenditure x (location + dispersion + Aboriginality)
• Recreation, culture and religion ($46 037 974)
• Community population/Northern Territory population x recreation, culture and religion expenditure x (location + dispersion)
• Education ($2 641 386)
• Community population/Northern Territory population x education expenditure x (location + dispersion + Aboriginality)
• Social protection ($19 767 610)
• Community population/Northern Territory population x social protection expenditure x (location + dispersion + Aboriginality)
• Regional centre allowance ($12 050 000)
• Relevant municipal council x assessed expenditure impacts
Formula – local road grant fundingTo determine the local road grant, the Northern Territory Grants Commission applies a weighting to each council by road length and surface type. The weightings for each road type are: 27 for sealed; 12 for gravel; 10 for cycle path; seven for formed and one for unformed. The general purpose location factor is also applied to recognise relative isolation.
Changes to the methodology for distributing funding to local government under the Financial Assistance Grant programme for 2014–15 from that used in 2013–14During the course of 2013–14, the Northern Territory Government de-amalgamated Victoria Daly Regional Council into two councils; these being the Victoria Daly Regional Council and the West Daly Regional Council. This required the Northern Territory Grants Commission to incorporate the new entity into the methodology and calculate revised cost adjustors, population data and extrapolate financial data for the new council from the financial records of the Victoria Daly Regional Council. These new entities commenced operations on 1 July 2014.
Developments in the use of long-term financial and asset management plans by local governmentIn 2014–15, the Northern Territory Department of Local Government and Community Services entered into a three-year agreement with the Local Government Association of the Northern Territory to provide a range of support services to the Northern Territory local government sector. One of the initiatives included under that three-year agreement was for Local Government Association of the Northern Territory to assist with providing best practice asset management guidance to councils. During the year the Local Government Association of the Northern Territory:
• provided advice and assistance to councils on asset management practices as well as coordinated the Big Rivers Region Asset Management Working Group
• visited councils in the central Australia region to assess progress and updates on councils’ asset management plans

146
Local Government National Report 2014–15
• assisted the Alice Springs Town Council in updating its asset management plans
• assisted the Barkly Regional Council to help new staff in understanding asset management principles and identifying the current state of that particular council’s progress in asset management and long-term financial planning
• arranged two Finance Reference Group meetings (attendees at these meetings were senior council officers including: Corporate Services Directors, Chief Financial Officers, Chief Operating Officers, Finance Directors and Finance Managers). At these sessions a range of topics relating to long-term financial and asset management plans were discussed.
Actions to develop and implement comparative performance measures between local governing bodiesThe Australian Centre for Excellence in Local Government in response to the delivery of the National Asset Management System programme developed a council self-assessment tool to assist councils evaluate their progress with implementing the elements of the Local Government Planning Minister’s Council Financial Sustainability Frameworks. In 2014–15, councils’ data was collected and aggregated by the Local Government Association of the Northern Territory into a Northern Territory-wide report but separated between regional and municipal council responses.
To collect individual council data, the Local Government Association of the Northern Territory developed a web-based self-assessment tool which provided a pictorial and textual report on where individual councils are positioned in relation to asset management and long-term financial planning. The intent of this tool is to empower councils with base line data and a mechanism to aid in assessment and evaluation of their asset and financial management capacity.
During 2014–15, the Local Government Association of the Northern Territory undertook research into developing a framework for assessing short-term and long-term financial sustainability using a standard set of financial indicators.
During the year, a Model Financial Statements Working Group was established comprising of members from the Local Government Association of the Northern Territory, the Northern Territory Department of Local Government and Community Services and council staff to develop an annual financial reporting framework for the Northern Territory’s local government sector. The Model Financial Statements aims to include three standard ratios which will enable comparison of financial performance across the sector.
Reforms undertaken during 2014–15 to improve the efficiency and effectiveness of local government service deliveryLocal Authorities were established in 63 remote communities within nine regional councils across the Northern Territory and comprise between six to 14 members including community nominated and regional council elected members. Local Authority meetings are held at least four times per year and discuss a range of issues such as council planning, budgeting, employment and the monitoring of service delivery within their respective communities.
A review of Local Authorities found that in their first year of operation, Local Authorities were delivering on their objectives to deliver a stronger local voice and greater accountability for service delivery. There are 724 members of Local Authorities, 621 of whom are Indigenous (86 per cent) and 302 are female (42 per cent). In their first 12 months, Local Authorities had held 293 meetings and raised 697 actions with regional councils and 596 had been responded to (86 per cent).

147
Appendix B • NT
In June 2015, the Northern Territory Government endorsed broadening the functions of Local Authorities as the preferred body for government’s engagement with remote communities across all portfolio areas. Planning for the implementation of this new initiative is a collaborative process with regional councils.
Initiatives undertaken and services provided by local governments to Aboriginal and Torres Strait Islander communitiesLocal Authorities were established in 63 remote communities across the Northern Territory. Of the 724 members of Local Authorities, 621 are Indigenous (86 per cent) and 302 are female (42 per cent). In addition to delivering a stronger local voice and greater accountability for service delivery, one of the functions of Local Authorities is to determine local projects that reflect the needs and priorities of the local community. Examples to date include playgrounds, sporting facilities, street lighting, community festivals and public toilets. Regional councils receive funding of $5 million per year, which is allocated through a methodology that has some parallels with the methodology used for distributing funding under the Financial Assistance Grant programme.
In 2014–15, the Northern Territory Department of Local Government and Community Services provided $7.9 million in funding to one shire and nine regional councils to assist with subsidising 50 per cent of the cost of employing Indigenous staff within their councils. The grant provides financial assistance for salaries and approved on-costs for Indigenous employees delivering core council services.
Local government reform activities in the areas of deregulation and legislative change by the Northern Territory GovernmentDuring the course of 2014–15 there was amendment to the Local Government Legislation Amendment Act 2015 (NT). These amendments:
• changed the timing of the next periodic general election to 2017 (and every four years after that) and fixed polling day to be the 4th Saturday in August
• extended the period in which casual vacancies can be filled by appointment, rather than a by-election, to 18 months before a general election
• gave councils the flexibility to choose to conduct by-elections by themselves; engage an external electoral service provider; or use the services of the Northern Territory Electoral Commission for by-elections
• allowed municipal councils to choose to conduct by-elections by postal voting only and to fill the office of the principal member by appointment or election
• expanded postal voting and early voting services to all voters; re-targeted absent voting services on polling day to designated polling places in regional centres
• changed the time by which postal votes must be received from 6 pm on the 6th day after polling day to 12 noon on the 6th day after polling day
• provided the Northern Territory Electoral Commissioner with the power to set polling hours on polling day for by-elections and transferred the jurisdiction of the Local Government Tribunal to the Northern Territory Civil and Administrative Tribunal
• streamlined and aligned the rules for publishing election material to reduce costs and frequency of publication in newspapers and on council websites.
In 2014–15 there was no activity in the area of deregulation.

148
Local Government National Report 2014–15
Councils in Northern Territory leading digital transformation
East Arnhem Regional Council video conferencingThe East Arnhem Regional Council is situated in the north east of the Northern Territory and covers an area of 33 659 km2. During the wet season (October to May) many of the communities are cut off due to flooding which has, in the past, interfered with the East Arnhem Regional Council’s ability to hold ordinary council meetings. The East Arnhem Regional Council has installed video conferencing facilities in their remote community service delivery centres and its two head offices. The installation of these electronic devices has been used as a mechanism for attaining quorums for both ordinary council meetings and local authority meetings. Council meetings can proceed as scheduled and decisions regarding budgets and service delivery can be made without interruption.
City of Darwin 2014–15 Annual ReportThe City of Darwin council launched an interactive 2014–15 annual report through its webpage. This is the first interactive annual report published by a council in the Northern Territory. The web-based annual report contains shortcut icons which enables the reader to navigate directly to the contents page or to the council’s webpage. There are side navigation icons that will take the reader directly to a certain section of the report, and links to web and email addresses which will open in the reader’s browser when clicked on.

149
Appendix B • NT
Report from the Local Government Association of the Northern Territory
Developments in the use of long-term financial and asset management plans by local governmentDuring the year the Local Government Association of the Northern Territory provided limited assistance to the following councils with their long-term asset and financial planning: Roper Gulf Regional Council; Katherine Town Council; Victoria Daly Regional Council; Tiwi Islands Regional Council; Barkly Regional Council; Alice Springs Town Council; MacDonnell Regional Council; Central Desert Regional Council; City of Darwin; City of Palmerston; West Arnhem Regional Council; Belyuen Shire Council; Litchfield Council; and Wagait Shire Council.
While many of these councils have yet to formally adopt asset management plans for all categories of infrastructure assets that they are responsible for, some have developed draft documents that are to be considered by the elected members, while other councils are still much in the data collection phase of the process. While formal adoption of asset management plans has not yet occurred for most councils, all Northern Territory councils are aware of the need to have plans in place and are progressing with their development.
During 2014–15, 15 of the 18 councils (including the Local Government Association of the Northern Territory) responsible for managing local government infrastructure participated in the self-assessment of their individual performances relating to the 11 elements of the National Assessment Framework.
While there was an overall decline in performance from previous years, it is the Local Government Association of the Northern Territory’s opinion that this decline reflects a growing maturity by the council employees in interpreting the 119 characteristics that comprise the 11 elements of the National Assessment Framework and assessing their councils’ performances more critically than in previous years.
Actions to develop and implement comparative performance measures between local governing bodiesThe Local Government Association of the Northern Territory has formed a working group that is tasked with the development of model financial statements for use by Northern Territory councils that incorporate specific financial sustainability indicators that will enable comparison of sustainability amongst similar councils. While several councils have already commenced reporting in accordance with the draft model, there is an expectation that all the councils will be using a consistent format for the 2015–16 financial reports.
Reforms undertaken during 2014–15 to improve the efficiency and effectiveness of local government service deliveryDuring 2014–15, councils reported the following as being major initiatives undertaken to improve the efficiency and effectiveness in the delivery of services throughout the Northern Territory:
• expansion of strategies in waste management and operations originally implemented as a pilot project including
– modifying sites to allow waste to be sorted prior to any waste going to landfill

150
Local Government National Report 2014–15
– establishing recycling centres that sell reclaimed and recycled goods – establishing specific areas for the storage of chemical and hazard wastes – gaining recognition through Territory Tidy Towns awards
• the granting of the National Awards in Local Government for the Central Desert Regional Council for Creating great landfills in central Australia remote Aboriginal communities
• continued upgrading of council sporting facilities to allow national and smaller sporting events to occur in council areas
• endorsement of city centre master plans to inform residents and property owners of council plans including those to do with parking and cycle access
• use of solar power at council facilities to reduce utility costs
• implementation of a Community Energy Efficiency programme to minimise power consumption
• matching children services to the early childhood education and care regulations
• undertaking new activities and supporting numerous events to do with seniors, youth, and disabled persons
• refreshing home care services to meet national standards
• delivery of services to outstation living areas
• deployment of workforce mentors to retain employees in jobs.
In addition, through an initiative supported by the Northern Territory Department of Local Government and Community Services, the Local Government Association of the Northern Territory has been able to expand on its training support supplied to elected members and appointed Local Authority members on a variety of local government governance related subjects. This training is ensuring that elected and appointed representatives are becoming more widely adept in the governance and decision making processes that impact on local government service delivery.
Initiatives undertaken and services provided by local governments to Aboriginal and Torres Strait Islander communitiesAs Aboriginal and Torres Strait Islanders comprise some 33 per cent of the Northern Territory population all councils deliver services in communities where Aboriginal and Torres Strait Islander people reside. Regional councils deliver the bulk of these services in over 60 towns which are made up largely of Aboriginal residents.
Councils provide a diverse range of services to Aboriginal communities with most revenue coming from government grants. The diversity of services offered by all councils is measured by the resources that councils are able to muster mostly from grant programmes and include initiatives that are not the norm for mainstream local government.
These services range from: school nutrition programmes; remote Indigenous broadcasting; safe houses and centres for women; Centrelink and Australia Post services; community stores; public housing services; night patrol services and sobering up shelters; money management; mechanical workshops; reconciliation action plan; veterinary services (animal management); childcare, crèche and out of school hours care; youth, sport and recreation activities; domestic violence education and community violence mediation; Remote Jobs and Communities programme; outstations/homelands maintenance; and essential services (power and water).

151
Appendix B • NT
As identified in the previous section, governance related training of elected members and appointed Local Authority representatives by the Local Government Association of the Northern Territory has been increased since December 2014. The up-skilling of community residents who hold decision-making positions within councils is integral to the successful delivery of local government services to those communities.
Councils in Northern Territory leading digital transformation
City of Darwin radio frequency identification devicesThe City of Darwin has installed radio frequency identification devices in Casuarina Library to enable borrowing and returning items to be easier, including reducing check out waiting times and allowing customers to check out up to 20 items at a time and manage their library account. Preparatory work was undertaken for the City of Darwin’s digital strategy, due for completion in late 2015.
Litchfield Council personal digital assistantsLitchfield Council has introduced the use of hand-held personal digital assistants to identify required works and services, thus reducing the time that a service is unavailable for optimum use.
Constituents of the council are also encouraged to use an electronic form linked to the council’s website to notify of any identified infrastructure requiring repair.

152
Local Government National Report 2014–15
Report from the Australian Capital Territory GovernmentThe Australian Capital Territory Government administers the Australian Capital Territory as a city-state jurisdiction. As a result, there is no differentiation in Australian Capital Territory Government service provision between state-like and local-like functions. This is demonstrated by the Australian Capital Territory Government’s engagement with local government through membership of the Canberra Region Joint Organisation and the Council of Capital City Lord Mayors, as well as engagement with other jurisdictions through the Council of Australian Governments.
The Australian Capital Territory Government is increasingly focused on enhancing Canberra’s role as the regional centre for south-east New South Wales and the relationships that exist across the Canberra region. The Australian Capital Territory Government works closely with the New South Wales Government and local government in the region to address matters of common interest. The Australian Capital Territory Government also seek to engage with major cities in Australia to share solutions and advocate on issues faced by Australia’s cities.
Developments in the use of long-term financial and asset management plans by local government
The Australian Capital Territory Government infrastructure plan 2011–21The Australian Capital Territory Government infrastructure plan 2011–21, outlines future strategic objectives of:
• implementing strategic asset management and service planning across government agencies
• exploring strategic opportunities across all agencies to support innovation and quality infrastructure design
• consulting on the need for a climate change vulnerability assessment framework for Australian Capital Territory Government infrastructure
• strengthening strategic infrastructure planning by developing closer links with Australian Capital Territory Government prioritisation processes
• engaging in continuous improvement of the planning and delivery of new infrastructure investment in the Australian Capital Territory.
The Australian Capital Territory Government publishes updates to the Infrastructure Plan to inform business and community of the current projects being undertaken through its capital works programme, while outlining works the Australian Capital Territory Government is considering for future budget processes.
The Capital FrameworkDuring 2014–15, the Australian Capital Territory Government continued to plan, manage and review capital works projects under the Capital Framework. The Capital Framework seeks to improve business case development, service and asset planning, as well as project definition and scope.
As part of the Australian Capital Territory Government’s commitment to improve the delivery of capital projects, a policy implementation review has been initiated to assess the success of the Capital Framework and any lessons learned since the framework’s introduction in 2013. The outcomes of this review will be used to enhance and refine the Capital Framework.

153
Appendix B • ACT
The Partnership FrameworkDuring 2014–15, the Australian Capital Territory Government implemented the Partnerships Framework, which establishes the policy for:
• delivery of major infrastructure projects under models including design, construct, maintain, operate and public private partnership
• evaluation of unsolicited proposals under a structured framework.
The Partnerships Framework facilitated the procurement of major infrastructure projects in the Australian Capital Territory including the Australian Capital Territory Courts redevelopment, the University of Canberra Public Hospital and the Capital Metro project.
Strategic asset management plansThe Australian Capital Territory Government also supports a Strategic Asset Management programme providing financial assistance for agencies to establish strategic asset management plans for their management of the Territory’s assets. This programme seeks to foster better practice that increases the Territory’s economic capacity, reduces future costs, and grows the city in a way that meets the changing needs of the Australian Capital Territory demographic and maintains current infrastructure.
In addition to the Strategic Asset Management programme, the Australian Capital Territory Government is progressing a pilot project that will review asset management practice, in a specified directorate, against the Australian National Audit Office’s Better practice guide on the strategic and operational management of assets by public sector entities. The objective of the pilot project is to inform the Australian Capital Territory Government on ways it could improve operational efficiency and service delivery outcomes through the upgrade, divestment and acquisition of specific assets.
Actions to develop and implement comparative performance measures between local governing bodiesThe Australian Capital Territory Government does not currently undertake comparative performance measures with other local governments. The Australian Capital Territory Government does undertake analysis on the Report on Government Services information; however, this reporting focuses on ‘state-like’ government services.
Reforms undertaken during 2014–15 to improve the efficiency and effectiveness of local government service delivery
Access CanberraIn December 2014, the Australian Capital Territory Government established Access Canberra, a new agency bringing together regulators within the Australian Capital Territory Government primary shopfront and contact centre agency. Access Canberra aims to improve the experience of businesses, community organisations and individuals in accessing government services.
Access Canberra has delivered greater efficiency for customers by joining up regulatory activities, reducing duplication, delivering better coordination of events approvals, and establishing a single point of contact – eliminating the need for businesses to negotiate multiple entry points to government. For example, an events approval team was set up to be

154
Local Government National Report 2014–15
a single point of contact for organisers. The team coordinate and facilitate all event approvals (in some cases this can be up to 11 separate approvals), even if the approval is required by another government or directorate.
Initiatives undertaken and services provided by local governments to Aboriginal and Torres Strait Islander communities
The ACT Aboriginal and Torres Strait Islander Agreement 2015–18The ACT Aboriginal and Torres Strait Islander Agreement 2015–18 was signed on 23 April 2015 by the Chief Minister, the Chair of the Aboriginal and Torres Strait Islander Elected Body, the Minister for Aboriginal and Torres Strait Islander Affairs, and the Head of the Australian Capital Territory Public Service.
The agreement is the overarching document that will guide Aboriginal and Torres Strait Islander affairs in the Australian Capital Territory over the next three years. The agreement leads the way for the Australian Capital Territory Government to support Aboriginal and Torres Strait Islander community members to fully participate in and enjoy the social, economic and wellbeing benefits of living in the Australian Capital Territory.
The agreement aims to build strong families by focusing on seven key focus areas: cultural identity; healthy mind, healthy body; feeling safe; connecting the community; employment and economic independence; education; and leadership. An implementation plan for the agreement is being developed.
Local government reform activities in the areas of deregulation and legislative change by the Australian Capital Territory GovernmentAccess Canberra is responsible for administering over 100 pieces of Territory legislation, and therefore plays a key role in how the regulatory burden is experienced by regulated entities. This experience has been improved through improvements to application processes; extending licence periods; implementing joint inspections between regulators; adopting a helpful and educative approach to engaging with regulated entities; and implementing a risk-based approach to compliance.
In January 2015, the Australian Capital Territory Government announced a review of the taxi industry to examine the use of new technologies for the local industry. The Australian Capital Territory Government conducted a review of events processes resulting in actions to streamline approvals that support the hosting and delivery of major and community events for the city.
The Australian Capital Territory Government 2014 Omnibus Bill removed provisions identified as redundant or as an unnecessary administrative cost to business or government. The 2014 Bill included changes to:
• implement a simplified approval mechanism for outdoor dining on public unleased land
• extend licence periods from two to three years for casino employees and race bookmaking, race bookmaker’s agents and sports bookmaker’s agents
• remove unnecessary signage and display requirements
• remove the need for duplicate statutory declarations when lodging deeds for Powers of Attorney registration.

155
Appendix B • ACT
Legislative change – justice reform strategyThe two-year Justice Reform Strategy commenced in mid-2014 with the first year focusing on the move away from periodic detention as a sentencing option in the Australian Capital Territory and the creation of a new community-based sentencing as an alternative to imprisonment. The work has been guided by an advisory group made up of representatives from key Australian Capital Territory Government agencies, academics, the legal profession and justice interest groups.
The Crimes (Sentencing) Amendment Act 2014 (ACT) commenced on 5 December 2014 and amended the Crimes (Sentencing) Act 2005 (ACT) by limiting the circumstances in which a court could impose a sentence of periodic detention. A Bill introducing a new community-based sentence was presented on 19 November 2015 to enhance the current sentencing framework. The Justice Reform Strategy is also considering broader sentencing issues and a series of workshops are underway looking at specific justice-related themes, such as drugs and alcohol and mental health.
Courts Legislation Amendment Act 2015Commencing on 21 April 2015, the Courts Legislation Amendment Act 2015 (ACT) made amendments to a number of Acts to simplify requirements and improve efficiencies in court and coronial processes. These efficiencies were aimed at reducing delays in court proceedings, faster resolution of civil and criminal matters, and therefore reducing costs for parties. The amendments also assist in preventing the development of backlogs and allow the courts to better manage their resources. Amendments included:
• making interlocutory orders binding on subsequent trial judges
• requiring pre-trial disclosure of expert evidence
• ensuring appeals from pre-hearing orders made by the Master of the Supreme Court are now heard before the Court of Appeal rather than a single judge, therefore preventing matters being re-litigated without sufficient cause
• allowing a coroner to establish a coronial investigation scene, issue coronial investigation orders to police, and authorise police officers to collect and preserve evidence in circumstances where powers under the Crimes Act 1900 (ACT) are unavailable.
The Australian Capital Territory leading digital transformation
Digital CanberraThe Digital Canberra Action Plan 2014–18 is the roadmap of how the Australian Capital Territory Government will accelerate business engagement with the digital economy and help businesses access new customers and markets; promote Canberra as a modern, dynamic, digital city; use technology to be a more open government and to give citizens greater choice in how and when they use services; and be more innovative in how we engage with the community and local small business.
Pay by phone applicationA pay by phone application (Park Mobile) was introduced into the Australian Capital Territory with the roll out of the smart technology pay-and-display parking ticket machines in the last quarter of 2013–14. The uptake was two per cent initially and usage has steadily grown over

156
Local Government National Report 2014–15
the 2014–15 financial year to nine per cent of total revenue collected. The introduction required legislative changes to allow for e-ticket parking or ticket-less parking for the road user thereby moving parking to the cashless and smart technology realm.
CBRfree public wi-fiCanberra’s CBRfree public wi-fi network was initiated in 2014–15 in a partnership between the Australian Capital Territory Government and iiNet. CBRfree is available in many of the town centres, community centres and shops. CBRfree provides internet access for low socio-economic groups and visitors to Canberra who otherwise might find access to the internet too expensive. Increasingly the Australian Capital Territory Government is adopting a digital first approach to transactions with citizens and CBRfree is contributing to its effectiveness.

157
Appendix B • ALGA
Report from the Australian Local Government AssociationThe Australian Local Government Association highlighted in its Australian Government Budget submissions and in broader discussions around tax reform, a number of issues in relation to the fundamental components of the Financial Assistance Grant programme, namely their insufficient quantum and the failure of the indexation methodology to reflect the actual cost increases faced by councils.
Developments in the use of long-term financial and asset management plans by local governmentLocal government is confronting a significant asset management task. The local government infrastructure renewals backlog was estimated in a 2006 PriceWaterhouseCoopers report, commissioned by Australian Local Government Association, to be $14.5 billion nationally, and this is a number that will have grown over the last eight years.
To address this infrastructure renewals backlog, Australian Local Government Association identified a two-pronged approach. This involved advocating a better funding model for the Financial Assistance Grant programme, complemented by the need for internal local government reforms to ensure local community infrastructure could be better managed over the lifecycle.
The Australian Government has shown its commitment to working with local government to achieve real and meaningful outcomes for local and regional communities. This includes the establishment of the two-year Regional and Local Community Infrastructure Programme; the open dialogue being conducted on constitutional reform to recognise the place of local government in the federation; and the establishment of a Local Government Reform Fund aimed at improving asset and financial management.
The Australian Local Government Association welcomes the government’s confidence in local government and its ability to deliver infrastructure projects in order support to local communities. While this was most clearly seen through the provision of funding to deliver thousands of large and small shovel-ready projects to local and regional communities under the Regional and Local Community Infrastructure Programme, it continues through other programs today.
The Roads to Recovery Programme, which is funded to 2019, is highly valued by local and regional communities. They benefit directly from the increased utility provided by better local roads and improved road safety. It is a popular programme that has the support of all political parties, and that has enabled local government to produce value for money outcomes nationally.
The Roads to Recovery Programme provides $350 million per year. It should be made permanent in legislation to provide funding certainty to local government which, given the ongoing nature of the road asset management task, is crucial and the funding should be indexed annually to reflect the relevant cost increases faced by local governments.
The Australian Local Government Association has undertaken an analysis of the state of local roads networks. That analysis confirms there is a considerable backlog of infrastructure spending. The research shows that in order to restore and maintain the current local road network it would require additional funding of approximately $1.2 billion per annum.

158
Local Government National Report 2014–15
The Australian Local Government Association is seeking additional Australian Government funding to bridge the gap. This additional funding could comprise a combination of increased Roads to Recovery Programme funding; funding of a new strategic regional roads programme; a dedicated programme of funding for bridge maintenance; and additional identified roads grants which are part of the Financial Assistance Grant programme funding. The Australian Local Government Association has supported a review of the distribution of the funding under the Financial Assistance Grant programme identified for roads so that the funding more accurately reflects needs, noting that any changes in formula should not result in any council being financially disadvantaged.
Given the importance of roads as local government’s single largest asset, long-term security of infrastructure funding is essential for the development and implementation of long-term asset management plans.
Actions to develop and implement comparative performance measures between local governing bodiesAt the national level, there are no overarching systems designed to produce comparative performance measures and analysis between councils; performance measures that exist are established by individual state and territory governments and apply on a jurisdictional basis and state based submissions are more likely to be able to address this issue.
As a general observation, the Australian Local Government Association appreciates that accurate, timely and consistent data is critical to enable credible comparative analysis of performance and outcomes. A number of Australian Government and parliamentary reports over recent years have highlighted that lack of consolidated, quality data on local government is a significant problem.
The need to resolve data issues for local government remains important from a national perspective. The Australian Local Government Association has outlined the case for Australian Government funding to assist in the measurement of improved local government service delivery in submissions to the Australian Government Budget. In particular, the Australian Local Government Association cites the Productivity Commission’s finding in the Assessing local government revenue raising capacity report (April 2008) that: ‘[t]here is a need for the Australian Bureau of Statistics and various grants commissions to improve the consistency and accuracy of the local government data collections.’
Reforms undertaken during 2014–15 to improve the efficiency and effectiveness of local government service deliveryLocal government’s key objective is to serve its communities. Continued improvements in service delivery are also a primary objective of councils. A significant obstruction to improvements is the lack of financial security, combined with the increased overall financial pressures placed on local governments.
When the funding model for local government was devised in the early 1980s, local council’s responsibilities were generally restricted to the three ‘r’s’ (roads, rates and rubbish). However, since that time, the balance of local government resources directed towards social services continues to increase, as does the cost to provide those services.
Local government, in order to maintain service provision, often, as a result of withdrawals of state or Australian Government funds, has had to make difficult budgetary decisions. Local

159
Appendix B • ALGA
councils continue to provide essential services such as homecare, libraries, low-cost childcare and elderly and disabled support in spite of current financial issues.
In April 2006, all Australian governments signed the Intergovernmental Agreement Establishing Principles Guiding Intergovernmental Relations on Local Government Matters.
The Intergovernmental Agreement outlines a set of principles designed to establish an ongoing framework to address future cost shifting, and prevent the cost shifts that have occurred in the past. This practice costs local councils up to $1 billion each year.
The Intergovernmental Agreement expired in April 2011 and has not been re-negotiated since. Until the burden of cost shifting is lessened, the overall efficiency and effectiveness of local government service delivery will not reach its potential.
Initiatives undertaken and services provided by local governments to Aboriginal and Torres Strait Islander communitiesThe Australian Local Government Association supports the Closing the Gap initiatives and notes the important work of local councils in improving local government service delivery to Aboriginal and Torres Strait Islander communities.
Nevertheless, an audit by the Western Australian Government in 2008 provided a public estimate of $540 million to address the backlog in housing maintenance in remote Indigenous communities. This estimate did not include the impact of factors like overcrowding and total supply of housing or the cost of municipal and essential services such as roads, electricity, water, drainage, sewerage and waste removal.
In its 2015–16 Australian Government Budget submission, the Australian Local Government Association called for $2 billion in additional investment into municipal services as well as vital infrastructure and housing. The Australian Local Government Association also called for an examination of the decision made in 2014 to return primary control of municipal service delivery to the states.
This is a long-term issue which will require a continued focus, and local government, which has been active on this front, remains willing to partner with other levels of government to achieve improvements in the outcome for Indigenous communities.


161
CComparison of local government grants commission distribution models
Local government grants commissions (commissions) in each state and the Northern Territory use distribution models to determine the grant they will recommend be allocated to councils in their jurisdiction. They use one model for allocating the general purpose pool among councils and a separate model for allocating the local road pool. This appendix provides a comparison of the approaches the grants commissions used for determining 2014–15 allocations.
General purpose componentIn allocating the general purpose pool between councils within a jurisdiction, commissions are required under the Local Government (Financial Assistance) Act 1995 (Cth) (the Act) to comply with agreed National Principles (see Appendix A).
In practice, commissions determine an allocation that ensures all councils receive at least the minimum grant with the remaining allocated, as far as practicable, on a horizontal equalisation basis.
Usually, this results in commissions adopting a three-step procedure to determine the general purpose allocations.
Step 1 Commissions determine an allocation of the general purpose pool between councils on a horizontal equalisation basis.
Step 2 All councils receive at least the minimum grant. In most jurisdictions, in order for all councils to receive at least the minimum grant, allocations to some councils have to be increased relative to their horizontal equalisation grant.
Step 3 If allocations to some councils are increased in step two, then allocations to other councils must decrease relative to their horizontal equalisation grant. This is achieved by a process called ‘factoring back’.
In Step 3, because allocations to some councils are decreased, the resultant grant may be less than the minimum grant. As a result, Steps 2 and 3 of this procedure may need to be repeated until all councils receive at least the minimum grant and the general purpose pool for the jurisdiction has been completely allocated. More details on the approaches grants commissions use for Steps 1 and 3 are provided in the following.

162
Local Government National Report 2014–15
Allocating on a horizontal equalisation basisAn allocation on a horizontal equalisation basis is defined in section 6 of the Act. Horizontal equalisation:
… ensures that each local governing body in a state [or territory] is able to function, by reasonable effort, at a standard not lower than the average standard of other local governing bodies in the state [or territory]. [It] takes account of differences in the expenditure required to be incurred by local governing bodies in the performance of their functions and in their capacity to raise revenue.
The ‘average standard’ is a financial standard. It is based on the expenditure undertaken and revenue obtained by all councils in the jurisdiction.
Horizontal equalisation, as defined in the Act, is about identifying advantaged and disadvantaged councils and bringing all the disadvantaged councils up to the financial position of a council operating at the average standard. This means the task of the commissions is to calculate, for each disadvantaged council, the level of general purpose grants it requires to balance its assessed costs and assessed revenues.
When determining grant allocations on a horizontal equalisation basis, commissions use one of two distribution models:
• balanced budget – based on the approach of assessing the overall level of disadvantage for a council using a notional budget for the council
• direct assessment – based on the approach of assessing the level of disadvantage for a council in each area of expenditure and revenue.
Table C-1 shows the type of distribution model used by each commission.
Table C-1 Distribution models used for general purpose grants for 2014–15 allocations
State Model used
NSW Direct assessment model
Vic Balanced budget model after assistance for natural disaster relief is removed
Qld Balanced budget model
WA Balanced budget model
SA Direct assessment model (for local governing bodies outside the incorporated areas [the Outback Communities Authority and five Aboriginal Communities] allocations are made on a per capita basis)
Tas Balanced budget model
NT Balanced budget model
Source: Information provided by local government grants commissions in each state and territory.

163
Appendix C • Comparison of local government grants commission distribution models
The balanced budget modelVictoria, Queensland, Western Australia, Tasmania and the Northern Territory use the balanced budget approach. Their models are based on making an assessment of each council’s costs of providing services and its capacity to raise revenue, including its capacity to obtain other grant assistance.
The balanced budget model can be summarised as:
general purpose equals assessed costs of providing servicesplus assessed average operating surplus/deficitless assessed revenueless actual receipt of other grant assistance
The direct assessment modelNew South Wales and South Australia use the direct assessment approach. Their models are based on making an assessment of the level of advantage or disadvantage in each area of expenditure and revenue and summing these assessments over all areas of expenditure and revenue for all councils.
In each area of expenditure or revenue, an individual council’s assessment is compared to the average council. The direct assessment model calculates an individual council’s level of disadvantage or advantage for each area of expenditure and revenue, including for other grant assistance. It can be summarised as:
general purpose equals an equal per capita share of the general purpose poolplus expenditure needsplus revenue needsplus other grant assistance needs
The balanced budget and direct assessment models will produce identical assessments of financial capacity for each council, if the assessed average operating surplus or deficit is included in the balanced budget model.
Scope of equalisationThe scope of equalisation is about the sources of revenue raised and the types of expenditure activities that a commission includes when determining an allocation of the general purpose grant on a horizontal equalisation basis. Table C-2 shows the differences in the scope of equalisation of the commissions.
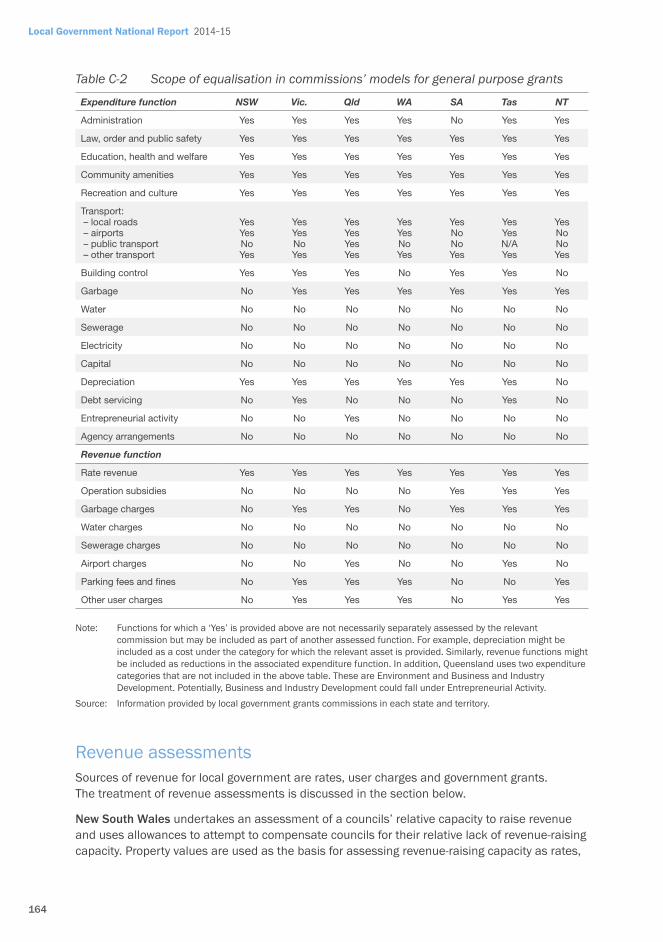
164
Local Government National Report 2014–15
Table C-2 Scope of equalisation in commissions’ models for general purpose grants
Expenditure function NSW Vic. Qld WA SA Tas NT
Administration Yes Yes Yes Yes No Yes Yes
Law, order and public safety Yes Yes Yes Yes Yes Yes Yes
Education, health and welfare Yes Yes Yes Yes Yes Yes Yes
Community amenities Yes Yes Yes Yes Yes Yes Yes
Recreation and culture Yes Yes Yes Yes Yes Yes Yes
Transport: – local roads – airports – public transport – other transport
Yes Yes No Yes
Yes Yes No Yes
Yes Yes Yes Yes
Yes Yes No Yes
Yes No No Yes
Yes Yes N/A Yes
Yes No No Yes
Building control Yes Yes Yes No Yes Yes No
Garbage No Yes Yes Yes Yes Yes Yes
Water No No No No No No No
Sewerage No No No No No No No
Electricity No No No No No No No
Capital No No No No No No No
Depreciation Yes Yes Yes Yes Yes Yes No
Debt servicing No Yes No No No Yes No
Entrepreneurial activity No No Yes No No No No
Agency arrangements No No No No No No No
Revenue function
Rate revenue Yes Yes Yes Yes Yes Yes Yes
Operation subsidies No No No No Yes Yes Yes
Garbage charges No Yes Yes No Yes Yes Yes
Water charges No No No No No No No
Sewerage charges No No No No No No No
Airport charges No No Yes No No Yes No
Parking fees and fines No Yes Yes Yes No No Yes
Other user charges No Yes Yes Yes No Yes Yes
Note: Functions for which a ‘Yes’ is provided above are not necessarily separately assessed by the relevant commission but may be included as part of another assessed function. For example, depreciation might be included as a cost under the category for which the relevant asset is provided. Similarly, revenue functions might be included as reductions in the associated expenditure function. In addition, Queensland uses two expenditure categories that are not included in the above table. These are Environment and Business and Industry Development. Potentially, Business and Industry Development could fall under Entrepreneurial Activity.
Source: Information provided by local government grants commissions in each state and territory.
Revenue assessmentsSources of revenue for local government are rates, user charges and government grants. The treatment of revenue assessments is discussed in the section below.
New South Wales undertakes an assessment of a councils’ relative capacity to raise revenue and uses allowances to attempt to compensate councils for their relative lack of revenue-raising capacity. Property values are used as the basis for assessing revenue-raising capacity as rates,

165
Appendix C • Comparison of local government grants commission distribution models
based on property values, are the principal source of council income. Property values also indicate relative economic strength of local areas.
Victoria calculates a council’s rate revenue raising capacity separately for each of the three major property classes (residential, commercial/industrial/other and farm) using a three-year average of valuation data. A council’s standardised revenue is intended to reflect its capacity to raise revenue from its community.
Relative capacity to raise rate revenue, or standardised rate revenue, is calculated for each council by multiplying its valuation base (on a capital improved value basis) by the average rate across all Victorian councils. The payments in lieu of rates received by some councils for major facilities such as power stations and airports have been added to their standardised revenue to ensure that all councils are treated on an equitable basis.
Victoria constrains increases in each council’s assessed revenue capacity to improve stability in grant outcomes. The constraint for each council has been set at the state-wide average increase in standardised revenue adjusted by the council’s own rate of population growth to reflect growth in the property base. A council’s relative capacity to raise revenue from user fees and charges, or ‘standardised fees and charges revenue’, also forms part of the calculation of standardised revenue.
For each council, for each of the nine functional areas, the relevant driver (such as population) is multiplied by the adjusted state median revenue from user fees and charges (adjusted to remove the skewing effect of large outliers in the data). For some functions, this is then modified by a series of ‘revenue adjustors’ to take account of differences between municipalities in their capacity to generate fees and charges, due to their characteristics.
Queensland uses the revenue categories of: rates; garbage charges; fees and charges; and other grants and subsidies. Queensland’s rating assessment is the total Queensland rate revenue divided by the total land valuation for Queensland. This derives a cent in the dollar average, which is then multiplied by the land valuation of each council.
In Western Australia, calculation of assessed revenue capacity is based on a standardised mathematical formula updated annually and involves assessing the revenue-raising capacity of each local government in the categories of: residential, commercial and industrial rates; agricultural rates; pastoral rates; mining rates; and investment earnings.
South Australia estimates the revenue raising capacity of each council for each of five land use categories: residential, commercial, industrial, rural, and other. To make these estimates, the state average rate in the dollar is used – that is, the ratio of total rate revenue to total improved capital values of rateable properties. This result shows how much rate revenue a council is able to raise relative to the average.
To overcome fluctuations in the base data, valuations, rate revenue and population are averaged over three years.
Tasmania assesses a council’s standardised revenue by applying a standard rate in the dollar to the assessed annual value of all rateable property in its area plus the council’s per capita grant allocation; and certain other financial support payments.
In Northern Territory the methodology calculates standards by applying cost adjustors and average weightings to assess the revenue raising capacity and expenditure need of each council. The assessment is the Northern Territory Grants Commission’s measure of the ability of each council to function at the average standard in accordance with the National Principles.

166
Local Government National Report 2014–15
As the ownership of the land on which many communities are located is vested in land trusts established pursuant to the Aboriginal Lands Rights (Northern Territory) Act 1976 (Cth), it is not, for all intents and purposes, feasible to use a land valuation system solely as the means for assessing revenue raising capacity.
The collection of actual accurate financial data through the Northern Territory Grants Commission’s annual returns enabled a number of revenue categories to be introduced, including municipal and regional council rates, domestic waste and interest.
Other grants support National PrincipleThe fourth National Principle for the general purpose grant involves the revenue assessment and states:
Other relevant grant support provided to local governing bodies to meet any of the expenditure needs assessed should be taken into account using an inclusion approach. (National Principle A4)
This National Principle requires commissions, when determining the allocations on a horizontal equalisation basis, to include all grants that are provided to councils from governments as part of the revenue that is available to councils to finance their expenditure needs. Only those grants that are available to councils to finance the expenditure of a function that is assessed by commissions should be included. Both the grants received and the expenditure it funds should be included in the allocation process.
Table C-3 provides details on the grants included by commissions in allocating the general purpose component in 2014–15.
Table C-3 Grants treated by inclusion for 2014–15 by jurisdiction
State Grants treated by inclusion in general purpose allocations
NSW Local road grant and library grant.
For other recurrent grant support the grant is deducted from the council’s expenditure before standard costs are calculated.
Vic All Australian and state government recurrent grants including each council’s local road grant and Roads to Recovery Programme grant.
Qld Allocation of minimum grant component of previous year’s general purpose grant, 50 per cent of previous years local road grant, 20 per cent of the state Aboriginal and Torres Strait Islander councils State Government Financial Aid grant.
WA 93 per cent of the local road grant, 63 per cent of the Roads to Recovery Programme grant.
SA 85 per cent of the local road grant, library grants, and the Roxby Downs unique extraordinary grant.
Tas Local road grant, Roads to Recovery Programme grant, State motor taxes collected on the registration of heavy vehicles, and distributions received from council owned water and sewerage entities.
NT Local road grant, library grant, and 50 per cent of the Roads to Recovery Programme grant.
Source: Based on information provided by local government grants commissions.
Expenditure assessmentsIn addition to expenditure on local roads, the main expenditures of councils are on general public services, including the organisation and financial administration of councils; recreation facilities; and sanitation and protection of the environment, including disposal of sewerage, stormwater drainage and garbage. Assessing local road expenditure needs for the general purpose grant is discussed in the section below.

167
Appendix C • Comparison of local government grants commission distribution models
New South Wales assesses 21 expenditure categories, including three classes of road maintenance and continues to use the direct assessment method. The New South Wales assessment includes an additional allowance for councils outside of the Sydney statistical division to recognise isolation.
Disability factors are also considered among the expenditure categories. A disability factor is the estimate of the additional cost of providing a standard service, due to inherent characteristics beyond the control of a council.
Victoria continues to use the balanced budget method and assesses nine expenditure categories.
For each function, with the exception of Local Roads and Bridges, gross standardised expenditure is obtained by multiplying the relevant major cost driver by the average Victorian council expenditure on that function, per unit of need; and a composite cost adjustor which takes account of factors that make service provision cost more or less for individual councils than the State average.
Queensland assesses against nine categories of expenditure and uses the balanced budget method. Queensland considers which of the suite of cost adjustors (location, demography–Indigenous, demography–age, demography–Indigenous/age or scale) are applied to which service categories.
Western Australia uses the balanced budget method and applies a range of disabilities to six expenditure standards. Assessed expenditure need for Western Australia is based on a standardised mathematical formula updated annually and involves the assessment of each local government’s operating expenditures in the provision of core services and facilities under the ‘standard’ categories.
South Australia uses the direct assessment model and uses 12 expenditure categories in addition to the local road categories. South Australia continues to exclude the libraries expenditure category due to consistency issues with data.
Tasmania assesses seven expenditure categories, as well as assessing local road needs, using the balanced budget model. A range of cost adjustors are applied that take into account factors that influence the cost of service provision for individual councils.
The Northern Territory uses the balanced budget approach and assesses ten expenditure categories, as well as one for local roads. Three cost adjustors are used to reflect a local governments cost of service delivery and include location, dispersion and Aboriginality.
Assessing local road expenditure needs under the general purpose grantsAs part of the expenditure needs assessment for determining the general purpose allocation, commissions also assess each council’s local road needs. The main features of the models commissions use for assessing local road needs for determining the general purpose allocations in 2014–15 are discussed below.
The New South Wales method of allocating the local road component is based on a simple formula developed by the New South Wales roads authority. The formula uses councils’ proportion of the state’s population, local road length and bridge length.
The Victorian formula for allocating local roads grants is based on the road length of each council (for all surface types) and traffic volumes, using average annual preservation costs for

168
Local Government National Report 2014–15
given traffic volume ranges. The method includes five cost modifiers for freight loading, climate, materials, sub-grade conditions, and strategic routes and takes account of the deck area of bridges on local roads.
Queensland uses an asset preservation model to assess road expenditure, estimating the cost to maintain a road network, including bridges and hydraulics. Allowances are given for heavy vehicles, which increase the road usage, increasing road expenditure for councils. Cost adjustors applied to expenditure categories include: location, scale and demography.
Western Australia calculates the local road component using the Asset Preservation Model, which has been in place since 1992. This model assesses the average annual costs of maintaining each local government’s road network and aims to equalise road standards through the application of minimum standards.
South Australia divides local road funding in the metropolitan area and non-metropolitan areas differently. In metropolitan areas, allocations to individual councils are determined by an equal weighting of road length and population. In the non-metropolitan area, allocations are made on an equal weighting of road length, population and the area of each council.
Tasmania uses a Roads Preservation Model to determine the relative road expenditure needs for each council. The Roads Preservation Model reflects the mix of road and bridge assets maintained by councils and estimates the cost of asset preservation for both roads and bridges.
Northern Territory determines the local road grant by applying a weighting to each council for road length, surface type and relative isolation. The weightings for each road type are: 27 for sealed; 12 for gravel; 10 for cycle path; seven for formed and one for unformed. The general purpose location factor is also applied to recognise relative isolation.
Needs of Indigenous communitiesThe fifth National Principle for distribution of the general purpose grants states:
Financial assistance shall be allocated to councils in a way which recognises the needs of Aboriginal peoples and Torres Strait Islanders within their boundaries. (National Principle A5)
While the special needs of Indigenous Australians are recognised when assessing the expenditure of councils on services in all jurisdictions, it remains the decision of each council as to how the grant will be spent and what services will be provided for its Indigenous residents. A summary of this recognition is provided below.
In New South Wales, all 152 councils are required to prepare plans under the integrated planning and reporting framework to respond flexibly to local need. The integrated planning and reporting guidelines include the requirement for a community strategic plan to be developed in consultation with groups within the local community and based on principles of social justice. These requirements include consideration of the needs of Aboriginal and Torres Strait Islander people within each local community.
Victoria includes a cost adjustor that reflects the Indigenous population when calculating the 2014–15 general purpose component.
Queensland applies a cost adjustor for location that recognises that rural, remote and Indigenous communities generally have higher costs associated with service delivery, and population for both Indigenous and non-Indigenous councils for Indigenous descent whereby the assessed expenditure per capita is increased in accordance with the proportion of Indigenous population and, additionally, for Indigenous people aged over 50.

169
Appendix C • Comparison of local government grants commission distribution models
Western Australia applies Indigenous as a disability for governance expenditure standard in its calculation of general purpose grants and considers Indigenous population data from the Australian Bureau of Statistics when calculating the disabilities applied to the expenditure standard.
In South Australia, grants are allocated to the five Aboriginal communities recognised as local governing authorities. Due to the unavailability of data, grants for these communities are not calculated in the same manner as grants to other local governing bodies. Initially, South Australian used a consultancy service, which completed a study on the expenditure needs of the communities and their revenue raising capacities. Comparisons were made with communities in other states and per capita grants were established. Grants have gradually been increased in line with the increase in the general purpose pool of funding for South Australia since the initial study.
Tasmania makes no special allowance for Indigenous people.
The Northern Territory applies a cost adjustor based on the proportion of the population that is Indigenous to its expenditure assessments for certain expenditure categories. The majority of shire service delivery in the Northern Territory is to remote communities whose population is almost entirely Indigenous Australian.
Council amalgamation National PrincipleA sixth National Principle for the general purpose grant applies to councils that amalgamate. The amalgamation principle took effect on 1 July 2006 and states:
Where two or more local governing bodies are amalgamated into a single body, the general purpose grant provided to the new body for each of the four years following amalgamation should be the total of the amounts that would have been provided to the former bodies in each of those years if they had remained separate entities. (National Principle A6)
In addition to complying with the other National Principles for the general purpose grant, grants commissions are required to treat the general purpose grant allocated to councils formed as the result of amalgamation in a way that is consistent with this National Principle.
During 2014–15, the number of local governing bodies in Northern Territory increased with Victoria Daly Regional Council de-amalgamating into two councils; these being the Victoria Daly Regional Council and the West Daly Regional Council.
Factoring back and satisfying the minimum grant principleOnce the revenue capacity and expenditure needs have been determined for each council, the raw grant can be calculated by subtracting its revenue capacity from expenditure needs.
There are two situations that require commissions to apply a ‘factoring back’ process. The first situation is when the total raw grant does not equal the available grant for the jurisdiction. This can occur when the commission has not:
• assessed all revenue and expenditure categories for councils in the jurisdiction
• ensured that the total assessed revenue and expenditure across all councils in the jurisdiction equals the total actual revenue and expenditure for all councils in the jurisdiction
or
• used a budget result term for each council when applying the balanced budget approach.

170
Local Government National Report 2014–15
The use of a consistent approach for allocating grants would address this issue.
The second situation occurs when the raw grant allocation for a council does not comply with the minimum grant National Principle. This Principle requires:
The minimum general purpose grant allocation for a local governing body in a year will be not less than the amount to which the local governing body would be entitled if 30 per cent of the total amount of general purpose grants to which the state or territory is entitled under section 9 of the Act in respect of the year were allocated among local governing bodies in the state or territory on a per capita basis. (National Principle A3)
Grants to councils with raw grant allocations below the minimum grant (including negative grants) are increased to comply with the minimum grant National Principle. This requires grants to other councils in the jurisdiction to be reduced through a factoring back process.
Should the grant to one or more councils following the initial factoring back process reduce their grant below the minimum grant, the factoring back process would be repeated. This process would have to be repeated until both the minimum grant and available grant constraints are simultaneously met.
Two approaches are used by commissions for factoring back the raw grant:
• proportional method – each raw grant for a council is reduced by the same proportion so that the total of the grants equals the available grant
• equalisation ratio method – each grant for a council is reduced such that all councils can afford to fund the same proportion of their expenditure needs with their total income (assessed revenue capacity plus other grant support and general purpose grant).
Local road componentThe National Principles require the local road grant to be allocated so that, as far as practicable, the grant is allocated to councils:
… on the basis of the relative needs of each council for roads expenditure and to preserve its road assets. In assessing road needs, relevant considerations include length, type and usage of roads in each council area. (National Principle B1)
For the local road needs assessment, the models are either relatively simple constructs or more complex asset preservation models.
New South Wales, South Australia and the Northern Territory use relatively simple models to allocate the local road grant. New South Wales and South Australia firstly classify local roads as either metropolitan or non-metropolitan, and then allocate funding based mainly on the factors of population and road length. The Northern Territory allocates funding based on road length and road surface type.
Queensland, Victoria, Western Australia, and Tasmania use asset preservation models to allocate the local road grant. The asset preservation model attempts to measure the annual cost of maintaining a road network. It takes into account recurrent maintenance costs, and the cost of reconstruction at the end of the road’s useful life. It can also take other factors into account such as the:
• costs associated with different types of roads (sealed, gravel and formed roads)
• impact of weather, soil types and materials availability on-costs
• impact of traffic volume on the cost of maintaining these roads.

171
Appendix C • Comparison of local government grants commission distribution models
Prior to applying their grant allocation methodologies, Western Australia and South Australia quarantine seven per cent and 15 per cent respectively for funding priority local road projects. Expert committees advise on the projects to be funded.
Table C-4 summarises the main features of the models used by the commissions for allocating local road grants in 2014–15.
Table C-4 Allocating local road grants in 2014–15
State Features of the distribution model for allocating local road grants
NSW Based on a model developed by the New South Wales Roads and Maritime Services (former Roads and Traffic Authority). Councils in the Sydney, Newcastle and Wollongong metropolitan areas receive 27.54 per cent of the grant pool with 38 per cent of this portion allocated on the basis of population, 57 per cent on the basis of road length and five per cent on the basis of bridge length.
The remaining 72.46 per cent is allocated to councils outside the above metropolitan areas, with 19 per cent of the remaining portion allocated on the basis of population, 74 per cent on the basis of road length and seven per cent on the basis of bridge length.
Vic Allocation is based on an asset preservation model.
Qld Allocation is based on an asset preservation model that assesses road expenditure and estimates the cost to maintain a road network, including bridges and hydraulics.
WA Allocation of 93 per cent of the road grant pool is based on an asset preservation model.
The remaining seven per cent is set aside for special projects – with two-thirds of this portion for bridges and one-third for access roads serving remote Indigenous communities.
SA Allocation of 85 per cent of the road grant pool is split between metropolitan and non-metropolitan councils based on population and road length. Allocations for metropolitan councils are based on an equal weighting of population and road length while allocations for non-metropolitan councils are based on an equal weighting of population, road length and council area.
The remaining 15 per cent of the pool is set aside for special projects.
Tas Allocation of the road grant is based on an asset preservation model which uses the estimated cost of preservation of both roads and bridges per annum.
NT Allocation is based on weights applied to road length and surface type.
Source: Information provided by local government grants commissions.


173
DDistribution to local governing bodies in 2014–15
Table D-1 shows the distribution of funding under the Financial Assistance Grant programme and some basic information such as population, area in square kilometres and road length in kilometres for each local governing body in Australia.
For the Financial Assistance Grant programme, the table shows the actual total grant entitlement for 2014–15 and the estimated total grant entitlement for 2015–16. For each of these years, the components of the Financial Assistance Grant programme, including the general purpose grant and the local road grant, are also given.
The councils are listed alphabetically by state and the Northern Territory. The Australian Classification of Local Governments (ACLG) category for each council is listed in the second column. An explanation of the ACLG is at Appendix F.
To facilitate comparison, the general purpose grant per capita and the local road grant per kilometre are provided for 2014–15. Additional comparative information on grants received is provided in Chapter 2 as follows. Table 2-7 provides the average general purpose grant per capita for councils, grouped by state and by ACLG. Table 2-8 provides the average local road grant per kilometre for councils, grouped by state and by ACLG.
Councils receiving the minimum per capita grant in 2014–15 are indicated with a hash (#) beside their entry in the ‘General purpose grant per capita’ column. The per capita grant of these councils differs slightly between jurisdictions because of different data sources for population used by the Australian Government to calculate the state share of general purpose grants and those used by the local government grants commissions for allocations to individual councils. For further information on the minimum grant entitlement, see Chapter 2.
Indigenous local governing bodies are identified by an asterisk (*) against the name of the council.
The source of the data is the relevant state or territory local government grants commission.

174
Local Government National Report 2014–15
Tabl
e D
-1
Dis
trib
utio
n to
cou
ncils
for 2
014–
15 a
nd 2
015–
16
Cou
nci
l nam
eC
lass
i-
fica
tion
Pop
ula
tion
aC
oun
cil
area
Roa
d
len
gth
2014
–15
actu
al e
nti
tlem
ent
2015
–16
esti
mat
ed e
nti
tlem
ent
Gen
eral
p
urp
ose
Loca
l roa
dTo
tal
Gen
eral
p
urp
ose
Min
Loca
l ro
adG
ener
al
pu
rpos
eLo
cal
road
Tota
l
No.
sq k
mkm
$$
$$
per
cap
ita
#$
per
km
$$
$
New
Sou
th W
ales
Alb
ury
UR
M50
243
306
506
4 94
1 13
11
262
568
6 20
3 69
998
.34
2495
.19
4 83
4 45
81
272
184
6 10
6 64
2
Arm
idal
e D
umar
esq
UR
S25
343
4231
1020
2 66
1 99
11
395
094
4 05
7 08
510
5.04
1367
.74
2 61
5 45
41
392
708
4 00
8 16
2
Ash
field
UD
M44
175
891
936
188
295
828
1 23
2 01
6 2
1.19
3250
.86
901
032
293
566
1 19
4 59
8
Aub
urn
UD
L83
367
3219
92
897
554
597
477
3 49
5 03
1 3
4.76
3002
.40
2 7
52 6
7659
8 48
0 3
351
156
Bal
lina
UR
M41
335
485
605
2 44
1 14
21
259
423
3 70
0 56
559
.06
2081
.69
2 56
8 92
21
259
286
3 82
8 20
8
Bal
rana
ldR
AM
2371
21 6
9313
282
066
895
1 22
9 23
13
296
126
871.
7492
5.63
2 23
3 12
41
229
211
3 46
2 33
5
Ban
ksto
wn
UD
V19
6 97
477
541
5 40
1 04
31
510
517
6 91
1 56
027
.42
2792
.08
5 13
0 99
11
509
322
6 64
0 31
3
Bat
hurs
t R
egio
nal
UR
M41
051
3816
1195
4 42
6 40
51
857
392
6 28
3 79
710
7.83
1554
.30
4 32
9 78
61
862
733
6 1
92 5
19
Beg
a Va
lley
UR
M33
313
6279
1171
4 91
6 63
21
823
240
6 73
9 87
214
7.59
1556
.99
4 85
2 94
81
821
257
6 6
74 2
05
Bel
linge
nR
AV
12 8
5416
0053
22
493
826
851
509
3 34
5 33
519
4.01
1600
.58
2 48
7 10
385
1 78
5 3
338
888
Ber
rigan
RA
L83
6520
6612
613
026
149
1 27
6 32
34
302
472
361.
7610
12.1
53
018
620
1 27
6 66
24
295
282
Bla
ckto
wn
UD
V32
5 18
524
012
2315
528
674
3 05
4 39
418
583
068
47.7
524
97.4
614
752
240
3 07
5 81
317
828
053
Bla
ndR
AL
6010
8558
2925
3 83
7 10
72
745
244
6 58
2 35
163
8.45
938.
544
058
797
2 74
3 78
56
802
582
Bla
yney
RA
L73
3015
2568
11
609
712
787
135
2 3
96 8
4721
9.61
1155
.85
1 61
7 15
478
6 98
12
404
135
Blu
e M
ount
ains
UFL
79 2
2514
3171
96
867
886
1 32
7 04
48
194
930
86.6
918
45.6
86
807
575
1 31
9 21
48
126
789
Bog
anR
AM
303
7 1
4 60
0 1
352
2 0
12 4
86 1
315
922
3 3
28 4
08 6
62.6
6 9
73.3
2 2
144
818
1 3
15 7
45 3
460
563
Bom
bal
aR
AM
240
1 3
947
629
1 1
61 0
50 6
68 7
12 1
829
762
483
.57
1063
.14
1 1
80 2
10 6
68 3
80 1
848
590
Boo
row
aR
AM
255
8 2
578
608
924
966
608
739
1 5
33 7
05 3
61.6
010
01.2
2 9
51 3
68 6
08 9
11 1
560
279
Bot
any
Bay
UD
M 4
3 29
2 2
2 9
0 8
90 8
12 2
87 9
93 1
178
805
20.
58 #
3199
.92
905
972
290
063
1 1
96 0
35
Bou
rke
RA
M 2
996
41
604
188
3 2
983
826
1 7
72 7
44 4
756
570
995
.94
941
.45
3 2
57 0
15 1
771
651
5 0
28 6
66
Bre
war
rina
RA
S 1
940
19
165
127
2 1
949
927
1 2
14 3
07 3
164
234
1005
.12
954
.64
2 1
38 4
91 1
213
607
3 3
52 0
98
Bro
ken
Hill
UR
S 1
9 04
8 1
70 2
11 4
036
428
483
780
4 5
20 2
08 2
11.9
122
92.8
0 3
884
491
481
299
4 3
65 7
90
Bur
woo
dU
DM
35
298
7 8
2 7
26 3
21 2
48 2
94 9
74 6
15 2
0.58
#30
27.9
8 7
30 0
31 2
48 2
92 9
78 3
23
Byr
onU
RM
31
612
566
551
1 4
57 7
23 1
141
354
2 5
99 0
77 4
6.11
2071
.42
1 6
11 4
15 1
161
282
2 7
72 6
97
Cab
onne
RA
V 1
3 69
5 6
024
183
2 2
489
292
1 9
74 0
22 4
463
314
181
.77
1077
.52
2 4
86 5
73 1
972
802
4 4
59 3
75
Cam
den
UFM
63
248
201
463
2 0
73 3
27 1
017
931
3 0
91 2
58 3
2.78
2198
.56
2 1
21 7
89 1
048
117
3 1
69 9
06
Cam
pb
ellto
wn
UFV
154
538
312
657
8 5
99 9
83 1
621
677
10
221
660
55.
6524
68.3
1 8
311
948
1 6
16 7
85 9
928
733
Can
ada
Bay
UD
L 8
4 90
6 2
0 1
89 1
747
095
593
896
2 3
40 9
91 2
0.58
#31
42.3
1 1
771
365
596
667
2 3
68 0
32

175
Appendix D • Distribution to local governing bodies in 2014–15
Cou
nci
l nam
eC
lass
i-
fica
tion
Pop
ula
tion
aC
oun
cil
area
Roa
d
len
gth
2014
–15
actu
al e
nti
tlem
ent
2015
–16
esti
mat
ed e
nti
tlem
ent
Gen
eral
p
urp
ose
Loca
l roa
dTo
tal
Gen
eral
p
urp
ose
Min
Loca
l ro
adG
ener
al
pu
rpos
eLo
cal
road
Tota
l
No.
sq k
mkm
$$
$$
per
cap
ita
#$
per
km
$$
$
Can
terb
ury
UD
V 1
48 8
53 3
4 3
13 4
266
558
1 0
11 0
15 5
277
573
28.
6632
30.0
8 4
053
230
1 0
05 8
24 5
059
054
Car
rath
ool
RA
M 2
792
18
932
230
0 2
763
922
2 1
42 4
24 4
906
346
989
.94
931
.49
3 0
01 7
71 2
141
708
5 1
43 4
79
Cen
tral
Dar
ling
RTM
207
0 5
3 49
4 1
602
2 9
48 0
95 1
480
894
4 4
28 9
8914
24.2
0 9
24.4
0 3
193
569
1 4
80 3
24 4
673
893
Ces
snoc
kU
RM
54
313
196
5 9
04 5
390
767
1 6
01 7
22 6
992
489
99.
2517
71.8
2 5
293
003
1 5
94 0
00 6
887
003
Cla
renc
e Va
lley
UR
M 5
1 04
3 1
0 42
9 2
055
7 1
41 7
20 3
064
949
10
206
669
139
.92
1491
.46
7 0
80 2
28 3
056
823
10 1
37 0
51
Cob
arR
TL 5
024
45
571
169
3 3
242
636
1 6
05 9
86 4
848
622
645
.43
948
.60
3 4
48 8
51 1
606
427
5 0
55 2
78
Cof
fs H
arb
our
UR
L 7
1 79
8 1
174
764
4 9
88 3
18 1
965
747
6 9
54 0
65 6
9.48
257
2.97
4 8
90 0
76 1
965
764
6 8
55 8
40
Con
argo
RA
S 1
543
873
8 1
229
1 4
83 0
92 1
149
332
2 6
32 4
24 9
61.1
7 9
35.1
8 1
527
473
1 1
63 1
21 2
690
594
Coo
lam
onR
AM
427
6 2
431
127
5 1
964
541
1 2
12 5
89 3
177
130
459
.43
951
.05
2 0
32 1
72 1
212
369
3 2
44 5
41
Coo
ma-
Mon
aro
RA
V 1
0 07
3 5
184
934
2 5
20 7
51 1
058
610
3 5
79 3
61 2
50.2
511
33.4
2 2
529
119
1 0
59 1
11 3
588
230
Coo
nam
ble
RA
M 4
279
991
6 1
393
2 1
37 1
16 1
375
963
3 5
13 0
79 4
99.4
4 9
87.7
7 2
202
143
1 3
75 2
12 3
577
355
Coo
tam
und
raR
AL
762
5 1
524
571
2 0
08 1
49 6
87 9
40 2
696
089
263
.36
1204
.80
1 9
98 9
83 6
88 5
38 2
687
521
Cor
owa
RA
V 1
1 41
0 2
329
128
4 3
123
382
1 3
63 3
26 4
486
708
273
.74
1061
.78
3 1
45 1
19 1
364
043
4 5
09 1
62
Cow
raR
AV
12
551
280
9 1
203
2 8
76 2
53 1
355
104
4 2
31 3
57 2
29.1
711
26.4
4 2
862
822
1 3
53 3
72 4
216
194
Den
iliq
uin
UR
S 7
376
143
152
2 0
58 3
69 2
59 7
28 2
318
097
279
.06
1708
.74
2 0
16 2
38 2
59 6
43 2
275
881
Dub
bo
UR
M 4
0 97
5 3
426
117
1 5
035
146
1 7
28 8
74 6
764
020
122
.88
1476
.41
4 8
34 8
89 1
729
640
6 5
64 5
29
Dun
gog
RA
L 8
884
225
0 5
98 1
423
115
846
423
2 2
69 5
38 1
60.1
914
15.4
2 1
431
407
847
912
2 2
79 3
19
Eur
obod
alla
UR
M 3
7 23
4 3
428
958
4 9
81 2
65 1
563
330
6 5
44 5
95 1
33.7
816
31.8
7 4
938
495
1 5
46 0
68 6
484
563
Fairfi
eld
UD
V 2
01 4
27 1
02 6
08 8
717
743
1 6
49 4
49 1
0 36
7 19
2 4
3.28
2712
.91
8 2
81 8
56 1
640
633
9 9
22 4
89
Forb
esR
AL
966
4 4
718
174
4 3
013
108
1 7
98 6
49 4
811
757
311
.79
1031
.34
3 0
37 1
01 1
798
311
4 8
35 4
12
Gilg
and
raR
AM
448
8 4
832
129
3 1
919
158
1 2
99 2
17 3
218
375
427
.62
1004
.81
2 0
51 5
48 1
297
874
3 3
49 4
22
Gle
n In
nes
Sev
ern
RA
L 8
905
548
0 1
085
2 3
31 7
96 1
279
792
3 6
11 5
88 2
61.8
511
79.5
3 2
361
871
1 2
78 7
71 3
640
642
Glo
uces
ter
RA
M 4
974
295
0 6
49 1
356
525
852
213
2 2
08 7
38 2
72.7
213
13.1
2 1
390
584
852
475
2 2
43 0
59
Gos
ford
UFV
170
752
941
966
8 1
97 9
77 2
079
103
10
277
080
48.
0121
52.2
8 8
380
605
2 0
71 0
71 1
0 45
1 67
6
Gou
lbur
n M
ulw
aree
UR
S 2
9 23
0 3
220
114
8 3
229
744
1 6
04 3
18 4
834
062
110
.49
1397
.49
3 1
56 1
67 1
581
914
4 7
38 0
81
Gre
at L
akes
UR
M 3
6 31
2 3
373
962
5 1
36 0
19 1
586
161
6 7
22 1
80 1
41.4
416
48.8
2 5
045
017
1 5
78 7
94 6
623
811
Gre
ater
Hum
eR
AV
10
176
574
9 1
775
2 9
42 4
25 1
897
820
4 8
40 2
45 2
89.1
510
69.1
9 2
899
001
1 9
02 3
36 4
801
337
Gre
ater
Tar
eeU
RM
48
846
372
9 1
611
4 9
16 2
28 2
499
907
7 4
16 1
35 1
00.6
515
51.7
7 4
918
095
2 5
30 4
00 7
448
495
Grif
fith
UR
S 2
5 42
5 1
640
124
4 3
305
854
1 5
10 3
12 4
816
166
130
.02
1214
.08
3 3
41 5
85 1
512
731
4 8
54 3
16
Gun
dag
aiR
AM
374
7 2
457
694
1 2
18 6
63 7
71 2
20 1
989
883
325
.24
1111
.27
1 2
32 0
78 7
70 4
18 2
002
496
Dis
trib
utio
n to
cou
ncils
for 2
014–
15 a
nd 2
015–
16 (c
ontin
ued)
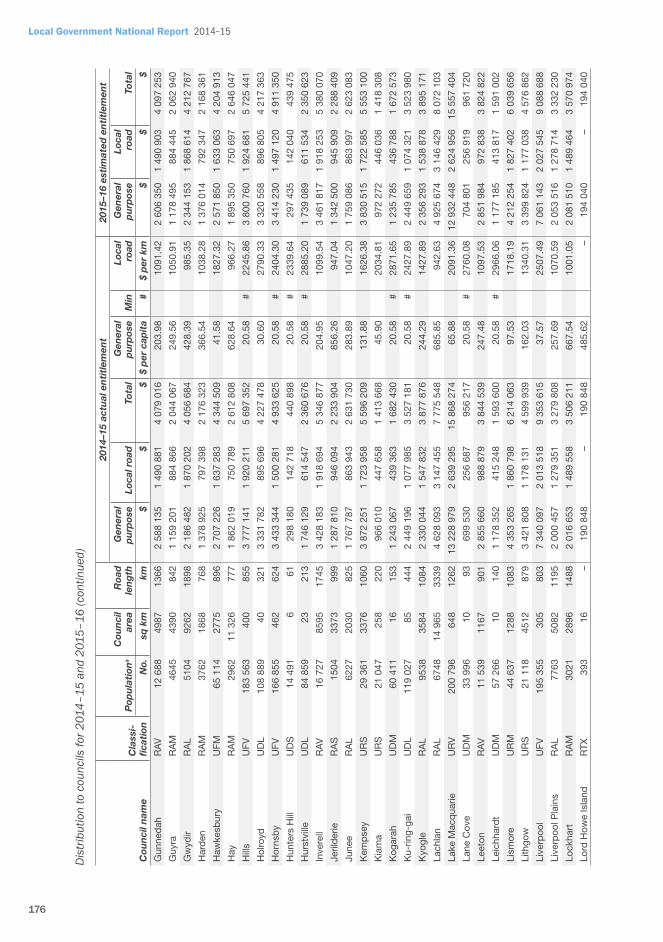
176
Local Government National Report 2014–15
Cou
nci
l nam
eC
lass
i-
fica
tion
Pop
ula
tion
aC
oun
cil
area
Roa
d
len
gth
2014
–15
actu
al e
nti
tlem
ent
2015
–16
esti
mat
ed e
nti
tlem
ent
Gen
eral
p
urp
ose
Loca
l roa
dTo
tal
Gen
eral
p
urp
ose
Min
Loca
l ro
adG
ener
al
pu
rpos
eLo
cal
road
Tota
l
No.
sq k
mkm
$$
$$
per
cap
ita
#$
per
km
$$
$
Gun
ned
ahR
AV
12
688
498
7 1
366
2 5
88 1
35 1
490
881
4 0
79 0
16 2
03.9
810
91.4
2 2
606
350
1 4
90 9
03 4
097
253
Guy
raR
AM
464
5 4
390
842
1 1
59 2
01 8
84 8
66 2
044
067
249
.56
1050
.91
1 1
78 4
95 8
84 4
45 2
062
940
Gw
ydir
RA
L 5
104
926
2 1
898
2 1
86 4
82 1
870
202
4 0
56 6
84 4
28.3
9 9
85.3
5 2
344
153
1 8
68 6
14 4
212
767
Har
den
RA
M 3
762
186
8 7
68 1
378
925
797
398
2 1
76 3
23 3
66.5
410
38.2
8 1
376
014
792
347
2 1
68 3
61
Haw
kesb
ury
UFM
65
114
277
5 8
96 2
707
226
1 6
37 2
83 4
344
509
41.
5818
27.3
2 2
571
850
1 6
33 0
63 4
204
913
Hay
RA
M 2
962
11
326
777
1 8
62 0
19 7
50 7
89 2
612
808
628
.64
966
.27
1 8
95 3
50 7
50 6
97 2
646
047
Hill
sU
FV 1
83 5
63 4
00 8
55 3
777
141
1 9
20 2
11 5
697
352
20.
58 #
2245
.86
3 8
00 7
60 1
924
681
5 7
25 4
41
Hol
royd
UD
L 1
08 8
89 4
0 3
21 3
331
782
895
696
4 2
27 4
78 3
0.60
2790
.33
3 3
20 5
58 8
96 8
05 4
217
363
Hor
nsb
yU
FV 1
66 8
55 4
62 6
24 3
433
344
1 5
00 2
81 4
933
625
20.
58 #
2404
.30
3 4
14 2
30 1
497
120
4 9
11 3
50
Hun
ters
Hill
UD
S 1
4 49
1 6
61
298
180
142
718
440
898
20.
58 #
2339
.64
297
435
142
040
439
475
Hur
stvi
lleU
DL
84
859
23
213
1 7
46 1
29 6
14 5
47 2
360
676
20.
58 #
2885
.20
1 7
39 0
89 6
11 5
34 2
350
623
Inve
rell
RA
V 1
6 72
7 8
595
174
5 3
428
183
1 9
18 6
94 5
346
877
204
.95
1099
.54
3 4
61 8
17 1
918
253
5 3
80 0
70
Jeril
der
ieR
AS
150
4 3
373
999
1 2
87 8
10 9
46 0
94 2
233
904
856
.26
947
.04
1 3
42 5
00 9
45 9
09 2
288
409
June
eR
AL
622
7 2
030
825
1 7
67 7
87 8
63 9
43 2
631
730
283
.89
1047
.20
1 7
59 0
86 8
63 9
97 2
623
083
Kem
pse
yU
RS
29
361
337
6 1
060
3 8
72 2
51 1
723
958
5 5
96 2
09 1
31.8
816
26.3
8 3
830
515
1 7
22 5
85 5
553
100
Kia
ma
UR
S 2
1 04
7 2
58 2
20 9
66 0
10 4
47 6
58 1
413
668
45.
9020
34.8
1 9
72 2
72 4
46 0
36 1
418
308
Kog
arah
UD
M 6
0 41
1 1
6 1
53 1
243
067
439
363
1 6
82 4
30 2
0.58
#28
71.6
5 1
235
785
436
788
1 6
72 5
73
Ku-
ring-
gai
UD
L 1
19 0
27 8
5 4
44 2
449
196
1 0
77 9
85 3
527
181
20.
58 #
2427
.89
2 4
49 6
59 1
074
321
3 5
23 9
80
Kyo
gle
RA
L 9
538
358
4 1
084
2 3
30 0
44 1
547
832
3 8
77 8
76 2
44.2
914
27.8
9 2
356
293
1 5
38 8
78 3
895
171
Lach
lan
RA
L 6
748
14
965
333
9 4
628
093
3 1
47 4
55 7
775
548
685
.85
942
.63
4 9
25 6
74 3
146
429
8 0
72 1
03
Lake
Mac
qua
rieU
RV
200
796
648
126
2 1
3 22
8 97
9 2
639
295
15
868
274
65.
8820
91.3
6 1
2 93
2 44
8 2
624
956
15
557
404
Lane
Cov
eU
DM
33
996
10
93
699
530
256
687
956
217
20.
58 #
2760
.08
704
801
256
919
961
720
Leet
onR
AV
11
539
116
7 9
01 2
855
660
988
879
3 8
44 5
39 2
47.4
810
97.5
3 2
851
984
972
838
3 8
24 8
22
Leic
hhar
dt
UD
M 5
7 26
6 1
0 1
40 1
178
352
415
248
1 5
93 6
00 2
0.58
#29
66.0
6 1
177
185
413
817
1 5
91 0
02
Lism
ore
UR
M 4
4 63
7 1
288
108
3 4
353
265
1 8
60 7
98 6
214
063
97.
5317
18.1
9 4
212
254
1 8
27 4
02 6
039
656
Lith
gow
UR
S 2
1 11
8 4
512
879
3 4
21 8
08 1
178
131
4 5
99 9
39 1
62.0
313
40.3
1 3
399
824
1 1
77 0
38 4
576
862
Live
rpoo
lU
FV 1
95 3
55 3
05 8
03 7
340
097
2 0
13 5
18 9
353
615
37.
5725
07.4
9 7
061
143
2 0
27 5
45 9
088
688
Live
rpoo
l Pla
ins
RA
L 7
763
508
2 1
195
2 0
00 4
57 1
279
351
3 2
79 8
08 2
57.6
910
70.5
9 2
053
516
1 2
78 7
14 3
332
230
Lock
hart
RA
M 3
021
289
6 1
488
2 0
16 6
53 1
489
558
3 5
06 2
11 6
67.5
410
01.0
5 2
081
510
1 4
89 4
64 3
570
974
Lord
How
e Is
land
RTX
393
16
– 1
90 8
48–
190
848
485
.62
– 1
94 0
40–
194
040
Dis
trib
utio
n to
cou
ncils
for 2
014–
15 a
nd 2
015–
16 (c
ontin
ued)

177
Appendix D • Distribution to local governing bodies in 2014–15
Dis
trib
utio
n to
cou
ncils
for 2
014–
15 a
nd 2
015–
16 (c
ontin
ued)
Cou
nci
l nam
eC
lass
i-
fica
tion
Pop
ula
tion
aC
oun
cil
area
Roa
d
len
gth
2014
–15
actu
al e
nti
tlem
ent
2015
–16
esti
mat
ed e
nti
tlem
ent
Gen
eral
p
urp
ose
Loca
l roa
dTo
tal
Gen
eral
p
urp
ose
Min
Loca
l ro
adG
ener
al
pu
rpos
eLo
cal
road
Tota
l
No.
sq k
mkm
$$
$$
per
cap
ita
#$
per
km
$$
$
Mai
tland
UR
L 7
3 44
7 3
92 6
40 5
290
247
1 2
49 8
57 6
540
104
72.
0319
52.9
0 5
265
505
1 2
54 4
07 6
519
912
Man
lyU
DM
44
232
14
105
910
154
312
088
1 2
22 2
42 2
0.58
#29
72.2
7 9
06 8
63 3
10 6
32 1
217
495
Mar
rickv
ille
UD
L 8
2 52
3 1
6 1
93 2
405
600
578
296
2 9
83 8
96 2
9.15
2996
.35
2 2
85 3
20 5
74 8
50 2
860
170
Mid
-Wes
tern
Reg
iona
lU
RS
23
843
875
3 1
907
3 7
36 5
24 2
226
656
5 9
63 1
80 1
56.7
111
67.6
2 3
685
093
2 2
27 6
38 5
912
731
Mor
ee P
lain
sR
AV
14
250
17
906
264
0 3
812
727
2 6
97 1
83 6
509
910
267
.56
1021
.66
3 9
93 4
37 2
691
607
6 6
85 0
44
Mos
man
UD
S 2
9 98
3 9
86
616
955
231
827
848
782
20.
58 #
2695
.66
613
053
230
421
843
474
Mur
ray
RA
L 7
418
434
4 1
333
2 5
20 4
30 1
408
844
3 9
29 2
74 3
39.7
710
56.9
0 2
594
040
1 4
09 8
63 4
003
903
Mur
rum
bid
gee
RA
M 2
503
350
7 5
90 1
122
352
570
845
1 6
93 1
97 4
48.4
0 9
67.5
3 1
137
388
570
823
1 7
08 2
11
Mus
wel
lbro
okR
AV
16
851
340
5 5
81 2
488
487
871
656
3 3
60 1
43 1
47.6
815
00.2
7 2
430
457
873
787
3 3
04 2
44
Nam
buc
caR
AV
19
529
149
1 6
66 2
494
226
1 1
32 6
82 3
626
908
127
.72
1700
.72
2 4
66 1
54 1
131
960
3 5
98 1
14
Nar
rab
riR
AV
13
685
13
014
217
8 4
077
328
2 2
24 1
39 6
301
467
297
.94
1021
.18
4 1
85 6
11 2
177
202
6 3
62 8
13
Nar
rand
era
RA
L 6
030
411
6 1
463
2 6
08 4
59 1
433
265
4 0
41 7
24 4
32.5
8 9
79.6
8 2
718
815
1 4
63 5
50 4
182
365
Nar
rom
ine
RA
L 6
872
526
0 1
337
2 5
62 1
40 1
318
547
3 8
80 6
87 3
72.8
4 9
86.2
0 2
582
038
1 3
17 1
89 3
899
227
New
cast
leU
RV
158
553
187
747
10
897
037
1 7
37 2
05 1
2 63
4 24
2 6
8.73
2325
.58
10
448
343
1 7
51 3
93 1
2 19
9 73
6
Nor
th S
ydne
yU
DM
69
248
10
143
1 4
24 9
04 4
59 3
47 1
884
251
20.
58 #
3212
.22
1 4
38 1
71 4
60 6
35 1
898
806
Ob
eron
RA
L 5
270
362
7 8
49 1
472
493
873
325
2 3
45 8
18 2
79.4
110
28.6
5 1
496
001
873
293
2 3
69 2
94
Ora
nge
UR
M 4
0 86
9 2
84 4
37 3
480
570
1 0
56 8
03 4
537
373
85.
1624
18.3
1 3
329
922
1 0
62 5
44 4
392
466
Pal
eran
gR
AV
15
306
514
7 1
064
1 6
47 1
19 1
309
077
2 9
56 1
96 1
07.6
112
30.3
4 1
642
425
1 3
10 4
95 2
952
920
Par
kes
RA
V 1
5 08
7 5
955
179
7 3
626
899
1 8
68 3
57 5
495
256
240
.40
1039
.71
3 6
31 2
84 1
868
086
5 4
99 3
70
Par
ram
atta
UD
V 1
84 6
22 6
1 5
17 7
853
492
1 5
19 6
76 9
373
168
42.
5429
39.4
1 7
718
268
1 5
22 5
38 9
240
806
Pen
rith
UFV
190
428
405
988
8 9
73 5
85 2
219
553
11
193
138
47.
1222
46.5
1 8
598
125
2 2
57 4
7810
855
603
Pitt
wat
erU
DM
62
070
90
249
1 2
77 2
04 6
05 3
42 1
882
546
20.
58 #
2431
.09
1 2
82 5
19 6
03 9
381
886
457
Por
t M
acq
uarie
-H
astin
gsU
RL
76
563
368
3 1
232
6 2
19 3
95 2
630
549
8 8
49 9
44 8
1.23
2135
.19
6 1
25 4
10 2
638
441
8 76
3 85
1
Por
t S
tep
hens
UR
M 6
8 93
5 8
58 6
39 4
958
350
1 1
67 4
29 6
125
779
71.
9318
26.9
6 5
185
589
1 1
63 6
026
349
191
Que
anb
eyan
UR
M 4
0 56
8 1
72 2
70 1
981
333
874
179
2 8
55 5
12 4
8.84
3237
.70
1 8
82 2
66 8
77 7
67 2
760
033
Ran
dw
ick
UD
V 1
42 3
10 3
6 2
76 2
928
286
923
734
3 8
52 0
20 2
0.58
#33
46.8
6 2
911
291
918
272
3 8
29 5
63
Ric
hmon
d V
alle
yU
RS
22
749
304
7 1
001
3 1
82 0
48 1
478
497
4 6
60 5
45 1
39.8
814
77.0
2 3
147
818
1 4
81 1
81 4
628
999
Roc
kdal
eU
DL
106
712
28
264
2 1
95 7
94 7
81 6
49 2
977
443
20.
58 #
2960
.79
2 1
88 3
28 7
77 9
24 2
966
252
Ryd
eU
DL
112
545
40
308
2 3
15 8
18 8
72 2
28 3
188
046
20.
58 #
2831
.91
2 3
20 4
72 8
70 2
83 3
190
755

178
Local Government National Report 2014–15
Dis
trib
utio
n to
cou
ncils
for 2
014–
15 a
nd 2
015–
16 (c
ontin
ued)
Cou
nci
l nam
eC
lass
i-
fica
tion
Pop
ula
tion
aC
oun
cil
area
Roa
d
len
gth
2014
–15
actu
al e
nti
tlem
ent
2015
–16
esti
mat
ed e
nti
tlem
ent
Gen
eral
p
urp
ose
Loca
l roa
dTo
tal
Gen
eral
p
urp
ose
Min
Loca
l ro
adG
ener
al
pu
rpos
eLo
cal
road
Tota
l
No.
sq k
mkm
$$
$$
per
cap
ita
#$
per
km
$$
$
She
llhar
bou
rU
RM
67
797
147
368
3 9
14 7
87 8
26 8
78 4
741
665
57.
7422
46.9
5 3
901
619
826
603
4 7
28 2
22
Sho
alha
ven
UR
L 9
7 69
4 4
567
159
7 8
212
038
3 1
13 5
87 1
1 32
5 62
5 8
4.06
1949
.65
8 2
37 5
56 3
093
249
11
330
805
Silv
erto
n V
illag
eR
TX 5
7 –
– 3
0 13
5–
30
135
528
.68
– 3
0 15
3–
30
153
Sin
glet
onU
RS
23
751
489
3 7
37 2
195
839
1 1
65 4
43 3
361
282
92.
4515
81.3
3 2
193
061
1 1
73 2
94 3
366
355
Sno
wy
Riv
erR
AL
8 0
87 6
030
761
2 3
24 7
68 8
61 3
22 3
186
090
287
.47
1131
.83
2 3
14 2
24 8
62 3
94 3
176
618
Str
athfi
eld
UD
M 3
8 35
8 1
4 8
6 7
89 2
86 2
68 9
49 1
058
235
20.
58 #
3127
.31
799
443
270
049
1 0
69 4
92
Sut
herla
ndU
DV
223
192
334
789
4 5
92 5
79 1
956
763
6 5
49 3
42 2
0.58
#24
80.0
5 4
557
396
1 9
51 7
87 6
509
183
Syd
ney
UC
C 1
91 9
18 2
7 3
01 4
092
507
1 1
91 5
14 5
284
021
21.
3239
58.5
2 4
015
964
1 2
00 6
06 5
216
570
Tam
wor
th R
egio
nal
UR
M 5
9 74
3 9
884
293
9 6
194
882
3 8
82 9
04 1
0 07
7 78
6 1
03.6
913
21.1
7 6
089
065
3 8
90 4
14 9
979
479
Tem
ora
RA
L 5
995
280
2 1
134
1 9
63 0
70 1
145
315
3 1
08 3
85 3
27.4
510
09.9
8 1
970
343
1 1
30 1
72 3
100
515
Tent
erfie
ldR
AL
697
3 7
322
146
0 2
610
190
1 5
60 5
83 4
170
773
374
.33
1068
.89
2 6
75 0
83 1
558
360
4 2
33 4
43
Tib
oob
urra
RTX
128
––
67
672
– 6
7 67
2 5
28.6
9 –
67
712
– 6
7 71
2
Tum
bar
umb
aR
AM
352
1 4
392
465
1 3
82 0
58 5
42 2
35 1
924
293
392
.52
1166
.10
1 3
82 1
55 5
42 3
10 1
924
465
Tum
utR
AV
11
316
456
7 5
80 2
509
931
776
440
3 2
86 3
71 2
21.8
013
38.6
9 2
539
648
777
906
3 3
17 5
54
Twee
dU
RL
90
114
130
7 1
087
6 7
27 4
76 2
637
918
9 3
65 3
94 7
4.66
2426
.79
6 8
40 2
45 2
643
800
9 4
84 0
45
Up
per
Hun
ter
RA
V 1
4 65
0 8
096
158
0 2
572
554
1 8
23 1
15 4
395
669
175
.60
1153
.87
2 6
24 4
88 1
821
997
4 4
46 4
85
Up
per
Lac
hlan
RA
L 7
586
712
8 1
732
2 3
49 8
94 1
770
625
4 1
20 5
19 3
09.7
710
22.3
0 2
405
286
1 7
82 2
00 4
187
486
Ura
llaR
AL
637
0 3
226
818
1 3
70 6
65 9
06 1
14 2
276
779
215
.18
1107
.72
1 3
96 5
54 9
05 4
80 2
302
034
Ura
naR
AS
115
7 3
356
767
1 0
83 4
14 7
31 0
93 1
814
507
936
.40
953
.19
1 0
92 4
01 7
30 6
06 1
823
007
Wag
ga W
agga
UR
M 6
2 14
9 4
826
211
4 7
032
104
3 0
28 6
03 1
0 06
0 70
7 1
13.1
514
32.6
4 6
925
984
3 0
38 4
58 9
964
442
Wak
ool
RA
M 3
979
752
0 1
281
2 2
11 5
15 1
360
274
3 5
71 7
89 5
55.8
010
61.8
8 2
244
718
1 3
59 1
87 3
603
905
Wal
cha
RA
M 3
087
626
1 8
07 9
84 8
56 8
58 5
45 1
843
401
319
.03
1063
.87
1 0
61 8
00 8
98 8
53 1
960
653
Wal
gett
RA
L 6
785
22
308
181
7 3
761
804
1 8
34 7
33 5
596
537
554
.43
1009
.76
3 8
74 1
70 1
832
326
5 7
06 4
96
War
ren
RA
M 2
910
10
754
964
1 4
54 3
04 9
69 5
84 2
423
888
499
.76
1005
.79
1 4
93 9
99 9
69 0
27 2
463
026
War
ringa
hU
DV
152
636
149
460
3 1
40 7
62 1
239
456
4 3
80 2
18 2
0.58
#26
94.4
7 3
144
415
1 2
36 0
32 4
380
447
War
rum
bun
gle
RA
L 9
778
12
371
227
6 3
949
406
2 2
91 3
13 6
240
719
403
.91
1006
.73
4 0
35 2
24 2
294
851
6 3
30 0
75
Wav
erle
yU
DL
70
706
9 1
13 1
454
905
423
869
1 8
78 7
74 2
0.58
#37
51.0
5 1
453
236
422
614
1 8
75 8
50
Wed
din
RA
M 3
711
340
9 9
68 1
484
770
944
092
2 4
28 8
62 4
00.1
0 9
75.3
0 1
472
786
943
402
2 4
16 1
88
Wel
lingt
onR
AL
895
5 4
110
123
4 2
456
770
1 2
80 4
25 3
737
195
274
.35
1037
.62
2 4
90 9
18 1
280
258
3 7
71 1
76
Wen
twor
thR
AL
683
2 2
6 25
7 1
944
3 4
00 0
34 1
884
025
5 2
84 0
59 4
97.6
6 9
69.1
5 3
607
272
1 8
83 5
76 5
490
848

179
Appendix D • Distribution to local governing bodies in 2014–15
Dis
trib
utio
n to
cou
ncils
for 2
014–
15 a
nd 2
015–
16 (c
ontin
ued)
Cou
nci
l nam
eC
lass
i-
fica
tion
Pop
ula
tion
aC
oun
cil
area
Roa
d
len
gth
2014
–15
actu
al e
nti
tlem
ent
2015
–16
esti
mat
ed e
nti
tlem
ent
Gen
eral
p
urp
ose
Loca
l roa
dTo
tal
Gen
eral
p
urp
ose
Min
Loca
l ro
adG
ener
al
pu
rpos
eLo
cal
road
Tota
l
No.
sq k
mkm
$$
$$
per
cap
ita
#$
per
km
$$
$
Will
ough
by
UD
L 7
3 15
5 2
2 1
99 1
505
297
569
021
2 0
74 3
18 2
0.58
#28
59.4
0 1
501
773
566
494
2 0
68 2
67
Win
geca
rrib
eeU
RM
47
054
268
8 1
044
2 7
83 9
31 1
717
756
4 5
01 6
87 5
9.16
1645
.36
2 9
40 0
65 1
722
141
4 6
62 2
06
Wol
lond
illy
UFM
46
295
255
6 7
03 2
144
857
1 2
70 4
56 3
415
313
46.
3318
07.1
9 2
143
039
1 2
70 5
95 3
413
634
Wol
long
ong
UR
V 2
05 2
31 6
84 9
50 1
5 08
4 46
0 2
328
238
17
412
698
73.
5024
50.7
8 1
5 16
1 06
8 2
318
685
17
479
753
Woo
llahr
aU
DM
57
677
12
140
1 1
86 8
10 4
22 3
16 1
609
126
20.
58 #
3016
.54
1 1
86 9
65 4
21 0
44 1
608
009
Wyo
ngU
FV 1
57 3
58 7
40 1
028
10
668
219
2 1
52 2
47 1
2 82
0 46
6 6
7.80
2093
.63
10
830
090
2 1
28 1
89 1
2 95
8 27
9
Yass
Val
ley
RA
V 1
6 27
0 3
998
105
3 1
633
199
1 2
51 7
08 2
884
907
100
.38
1188
.71
1 5
70 7
80 1
255
784
2 8
26 5
64
Youn
gR
AV
12
699
269
3 1
060
2 3
64 8
68 1
200
611
3 5
65 4
79 1
86.2
211
32.6
5 2
371
251
1 1
95 1
52 3
566
403
Vic
tori
a
Alp
ine
RA
V 1
2 34
8 4
788
790
2 4
27 6
44 1
078
965
3 5
06 6
09 1
96.6
013
65.7
8 2
381
311
1 0
57 4
02 3
438
713
Ara
rat
RA
V 1
1 20
7 4
211
226
2 3
157
713
2 1
45 9
17 5
303
630
281
.76
948
.68
3 2
42 8
81 2
210
329
5 4
53 2
10
Bal
lara
tU
RL
98
684
739
137
2 9
912
327
2 1
42 2
20 1
2 05
4 54
7 1
00.4
515
61.3
8 9
981
508
2 1
67 4
99 1
2 14
9 00
7
Ban
yule
UD
V 1
24 4
75 6
3 5
47 3
648
663
909
956
4 5
58 6
19 2
9.31
1663
.54
3 4
73 0
03 8
99 7
33 4
372
736
Bas
s C
oast
UR
M 3
1 01
0 8
65 9
30 4
185
674
1 3
53 7
39 5
539
413
134
.98
1455
.63
4 1
34 7
05 1
359
683
5 4
94 3
88
Baw
Baw
UR
M 4
5 32
6 4
031
195
2 5
689
991
2 5
59 0
98 8
249
089
125
.53
1311
.01
5 9
65 0
51 2
635
912
8 6
00 9
63
Bay
sid
eU
DL
98
368
37
356
2 0
22 2
44 5
14 7
04 2
536
948
20.
56 #
1445
.80
2 0
26 3
47 5
22 2
25 2
548
572
Ben
alla
RA
V 1
3 71
9 2
353
134
9 2
430
741
1 3
96 1
08 3
826
849
177
.18
1034
.92
2 3
98 1
71 1
429
583
3 8
27 7
54
Bor
oond
ara
UD
V 1
70 5
53 6
0 5
62 3
506
219
811
968
4 3
18 1
87 2
0.56
#14
44.7
8 3
499
573
836
340
4 3
35 9
13
Brim
ban
kU
DV
195
469
123
894
11
867
220
1 6
21 0
49 1
3 48
8 26
9 6
0.71
1813
.25
11
573
419
1 6
02 7
11 1
3 17
6 13
0
Bul
oke
RA
L 6
221
800
0 5
313
3 2
24 3
05 2
240
759
5 4
65 0
64 5
18.2
9 4
21.7
5 3
293
945
2 3
05 0
83 5
599
028
Cam
pas
pe
UR
M 3
6 91
9 4
519
399
8 7
107
503
4 1
69 2
20 1
1 27
6 72
3 1
92.5
210
42.8
3 7
082
718
4 0
85 8
99 1
1 16
8 61
7
Car
din
iaU
FL 8
4 06
5 1
282
145
5 7
332
208
2 3
84 7
11 9
716
919
87.
2216
38.9
8 7
523
601
2 3
79 7
76 9
903
377
Cas
eyU
DV
275
116
409
151
2 1
5 27
4 29
9 2
159
601
17
433
900
55.
5214
28.3
1 1
5 15
1 52
8 2
178
972
17
330
500
Cen
tral
Gol
dfie
lds
RA
V 1
2 60
2 1
533
126
7 2
480
196
1 1
05 0
59 3
585
255
196
.81
872
.19
2 4
44 2
00 1
094
298
3 5
38 4
98
Col
ac O
tway
UR
S 2
0 69
4 3
438
162
3 3
443
982
2 5
37 2
04 5
981
186
166
.42
1563
.28
3 4
75 1
81 2
507
666
5 9
82 8
47
Cor
anga
mite
RA
V 1
6 13
7 4
408
236
7 3
756
197
3 2
57 4
92 7
013
689
232
.77
1376
.21
3 7
83 3
56 3
279
613
7 0
62 9
69
Dar
ebin
UD
V 1
46 7
97 5
4 5
11 4
048
167
889
679
4 9
37 8
46 2
7.58
1741
.05
3 8
90 5
94 8
98 1
99 4
788
793
Eas
t G
ipp
slan
dU
RM
43
413
20
942
293
7 9
246
486
4 4
94 3
79 1
3 74
0 86
5 2
12.9
915
30.2
6 9
329
495
4 4
27 7
89 1
3 75
7 28
4
Fran
ksto
nU
DV
133
560
130
700
7 5
80 1
74 1
048
492
8 6
28 6
66 5
6.75
1497
.85
7 4
83 4
69 1
058
605
8 5
42 0
74
Gan
naw
arra
RA
V 1
0 32
6 3
735
225
2 3
149
185
1 9
44 7
57 5
093
942
304
.98
863
.57
3 1
17 7
64 1
905
891
5 0
23 6
55
Gle
n E
iraU
DV
141
519
39
433
2 9
09 3
40 5
86 6
72 3
496
012
20.
56 #
1354
.90
2 9
20 6
83 6
04 2
81 3
524
964

180
Local Government National Report 2014–15
Dis
trib
utio
n to
cou
ncils
for 2
014–
15 a
nd 2
015–
16 (c
ontin
ued)
Cou
nci
l nam
eC
lass
i-
fica
tion
Pop
ula
tion
aC
oun
cil
area
Roa
d
len
gth
2014
–15
actu
al e
nti
tlem
ent
2015
–16
esti
mat
ed e
nti
tlem
ent
Gen
eral
p
urp
ose
Loca
l roa
dTo
tal
Gen
eral
p
urp
ose
Min
Loca
l ro
adG
ener
al
pu
rpos
eLo
cal
road
Tota
l
No.
sq k
mkm
$$
$$
per
cap
ita
#$
per
km
$$
$
Gle
nelg
RA
V 1
9 52
1 6
218
264
1 3
919
022
3 1
95 9
59 7
114
981
200
.76
1210
.13
4 0
24 2
57 3
247
265
7 2
71 5
22
Gol
den
Pla
ins
UR
S 2
0 15
1 2
703
183
2 3
245
614
1 9
35 3
82 5
180
996
161
.06
1056
.43
3 2
26 8
46 1
905
182
5 1
32 0
28
Gre
ater
Ben
dig
oU
RL
105
332
300
0 3
074
11
707
124
3 2
33 0
95 1
4 94
0 21
9 1
11.1
410
51.7
6 1
1 76
4 29
1 3
218
754
14
983
045
Gre
ater
Dan
den
ong
UD
V 1
46 7
27 1
30 6
70 9
336
827
1 3
72 8
09 1
0 70
9 63
6 6
3.63
2048
.97
9 3
03 5
30 1
398
334
10
701
864
Gre
ater
Gee
long
UR
V 2
21 5
15 1
248
207
3 1
6 23
8 91
7 3
078
044
19
316
961
73.
3114
84.8
3 1
6 13
8 16
6 3
063
916
19
202
082
Gre
ater
She
pp
arto
nU
RM
62
784
242
2 2
582
8 4
47 1
11 3
012
801
11
459
912
134
.54
1166
.85
8 4
83 2
81 2
975
988
11
459
269
Hep
bur
nR
AV
14
843
147
3 1
425
2 8
27 8
62 1
423
797
4 2
51 6
59 1
90.5
2 9
99.1
6 2
881
817
1 4
08 0
32 4
289
849
Hin
dm
arsh
RA
L 5
695
752
4 3
177
2 5
17 0
01 1
546
791
4 0
63 7
92 4
41.9
7 4
86.8
7 2
501
631
1 5
31 6
46 4
033
277
Hob
sons
Bay
UD
L 8
9 11
1 6
4 4
25 1
831
939
679
618
2 5
11 5
57 2
0.56
#15
99.1
0 1
882
954
688
406
2 5
71 3
60
Hor
sham
RA
V 1
9 68
7 4
267
2 9
18 3
629
756
2 0
27 5
15 5
657
271
184
.37
694
.83
3 6
92 1
34 2
040
433
5 7
32 5
67
Hum
eU
FV 1
83 2
63 5
04 1
116
10
813
331
1 9
97 5
76 1
2 81
0 90
7 5
9.00
1 78
9.94
10
930
718
2 0
57 5
35 1
2 98
8 25
3
Ind
igo
RA
V 1
5 37
2 2
040
156
4 2
756
350
1 6
35 7
86 4
392
136
179
.31
1045
.90
2 7
01 7
64 1
603
095
4 3
04 8
59
Kin
gsto
nU
DV
151
686
91
598
3 1
18 3
53 1
193
929
4 3
12 2
82 2
0.56
#19
96.5
4 3
103
556
1 1
97 5
70 4
301
126
Kno
xU
DV
154
909
114
717
6 5
50 7
69 1
036
151
7 5
86 9
20 4
2.29
1445
.12
6 2
97 1
46 1
024
061
7 3
21 2
07
Latr
obe
UR
L 7
3 84
6 1
426
156
4 8
926
150
2 4
27 5
78 1
1 35
3 72
8 1
20.8
815
52.1
6 9
011
845
2 4
16 1
62 1
1 42
8 00
7
Lod
don
RA
L 7
443
669
6 4
723
4 3
01 8
26 3
414
226
7 7
16 0
52 5
77.9
7 7
22.8
9 4
427
498
3 4
69 3
08 7
896
806
Mac
edon
Ran
ges
UR
M 4
4 09
8 1
748
166
1 4
597
850
1 9
99 0
42 6
596
892
104
.26
1203
.52
4 6
98 2
39 2
035
805
6 7
34 0
44
Man
ning
ham
UD
L 1
17 5
37 1
13 5
92 2
416
319
755
957
3 1
72 2
76 2
0.56
#12
76.9
5 2
402
920
757
816
3 1
60 7
36
Man
sfiel
dR
AL
840
5 3
844
801
1 8
59 9
74 9
23 3
89 2
783
363
221
.29
1152
.80
1 8
86 3
06 9
04 9
35 2
791
241
Mar
ibyr
nong
UD
L 7
9 30
2 3
1 3
04 2
491
281
471
995
2 9
63 2
76 3
1.42
1552
.62
2 3
94 3
09 4
86 1
62 2
880
471
Mar
oond
ahU
DL
109
575
61
476
4 5
43 0
58 7
37 5
62 5
280
620
41.
4615
49.5
0 4
367
388
729
275
5 0
96 6
63
Mel
bou
rne
UC
C 1
16 4
47 3
7 2
06 2
393
911
665
891
3 0
59 8
02 2
0.56
#32
32.4
8 2
477
651
660
722
3 1
38 3
73
Mel
ton
UFV
122
909
528
976
10
975
014
1 5
68 2
78 1
2 54
3 29
2 8
9.29
1606
.84
11
316
927
1 6
15 3
51 1
2 93
2 27
8
Mild
ura
UR
M 5
2 68
5 2
2 08
3 5
091
9 4
99 9
37 3
687
004
13
186
941
180
.32
724
.22
9 7
31 4
10 3
731
664
13
463
074
Mitc
hell
UR
M 3
7 36
6 2
862
146
1 4
705
612
1 6
75 8
12 6
381
424
125
.93
1147
.03
4 8
52 2
09 1
724
267
6 5
76 4
76
Moi
raU
RS
28
675
404
7 3
611
6 0
38 5
04 3
647
714
9 6
86 2
18 2
10.5
810
10.1
7 6
131
179
3 6
37 2
65 9
768
444
Mon
ash
UD
V 1
82 4
85 8
273
4 3
751
517
1 1
31 9
14 4
883
431
20.
56 #
1542
.12
3 7
51 4
80 1
121
450
4 8
72 9
30
Moo
nee
Valle
yU
DL
115
097
43
413
2 3
66 1
59 6
57 6
07 3
023
766
20.
56 #
1592
.27
2 3
78 9
15 6
77 3
46 3
056
261
Moo
rab
ool
UR
M 3
0 32
0 2
111
149
5 3
934
648
1 7
89 4
19 5
724
067
129
.77
1196
.94
4 0
55 1
27 1
760
102
5 8
15 2
29
Mor
elan
dU
DV
160
029
51
518
5 0
58 2
56 9
04 8
63 5
963
119
31.
6117
46.8
4 4
861
365
894
697
5 7
56 0
62

181
Appendix D • Distribution to local governing bodies in 2014–15
Dis
trib
utio
n to
cou
ncils
for 2
014–
15 a
nd 2
015–
16 (c
ontin
ued)
Cou
nci
l nam
eC
lass
i-
fica
tion
Pop
ula
tion
aC
oun
cil
area
Roa
d
len
gth
2014
–15
actu
al e
nti
tlem
ent
2015
–16
esti
mat
ed e
nti
tlem
ent
Gen
eral
p
urp
ose
Loca
l roa
dTo
tal
Gen
eral
p
urp
ose
Min
Loca
l ro
adG
ener
al
pu
rpos
eLo
cal
road
Tota
l
No.
sq k
mkm
$$
$$
per
cap
ita
#$
per
km
$$
$
Mor
ning
ton
Pen
insu
laU
FV 1
52 2
60 7
24 1
705
4 1
81 0
63 2
335
745
6 5
16 8
08 2
7.46
1369
.94
4 1
40 4
99 2
297
238
6 4
37 7
37
Mou
nt A
lexa
nder
RA
V 1
7 99
4 1
530
143
1 2
842
730
1 4
99 1
21 4
341
851
157
.98
1047
.60
2 8
52 8
28 1
544
118
4 3
96 9
46
Moy
neR
AV
16
277
548
2 2
743
3 6
39 1
52 3
708
330
7 3
47 4
82 2
23.5
813
51.9
2 3
696
815
3 7
20 2
62 7
417
077
Mur
rind
ind
iR
AV
13
494
387
9 1
200
2 6
80 6
22 1
627
900
4 3
08 5
22 1
98.6
513
56.5
8 2
672
340
1 5
95 3
67 4
267
707
Nill
umb
ikU
FM 6
2 72
4 4
32 7
62 2
218
196
1 0
94 7
60 3
312
956
35.
3614
36.6
9 2
131
854
1 0
78 8
34 3
210
688
Nor
ther
n G
ram
pia
nsR
AV
11
799
572
8 3
374
3 8
93 5
35 2
627
512
6 5
21 0
47 3
29.9
9 7
78.7
5 3
995
411
2 6
49 0
23 6
644
434
Por
t P
hilli
pU
DL
102
501
21
214
2 1
07 2
11 3
96 3
41 2
503
552
20.
56 #
1852
.06
2 1
25 6
70 4
00 9
05 2
526
575
Pyr
enee
sR
AL
677
0 3
435
202
3 2
958
253
2 0
12 4
97 4
970
750
436
.96
994
.81
2 8
56 5
83 1
983
946
4 8
40 5
29
Que
ensc
liffe
UFS
305
8 9
43
202
852
51
444
254
296
66.
3311
96.3
7 1
99 0
17 5
2 98
8 2
52 0
05
Sou
th G
ipp
slan
dU
RS
27
930
329
7 2
089
5 1
26 1
45 3
405
332
8 5
31 4
77 1
83.5
416
30.1
3 5
376
150
3 5
07 5
47 8
883
697
Sou
ther
n G
ram
pia
nsR
AV
16
145
665
5 2
760
3 8
40 9
88 2
894
877
6 7
35 8
65 2
37.9
110
48.8
7 3
802
211
2 8
51 6
17 6
653
828
Sto
nnin
gton
UD
L 1
03 1
87 2
6 2
58 2
121
313
401
501
2 5
22 8
14 2
0.56
#15
56.2
1 2
148
681
409
148
2 5
57 8
29
Str
athb
ogie
RA
L 9
706
330
3 2
234
2 8
75 0
45 2
092
225
4 9
67 2
70 2
96.2
1 9
36.5
4 2
803
109
2 0
73 5
96 4
876
705
Sur
f Coa
stU
FS 2
8 28
2 1
553
109
0 2
230
000
1 4
14 4
36 3
644
436
78.
8512
97.6
5 2
209
027
1 4
10 2
68 3
619
295
Sw
an H
illU
RS
20
867
611
5 3
484
4 1
14 5
10 2
053
515
6 1
68 0
25 1
97.1
8 5
89.4
1 4
120
494
2 0
39 6
03 6
160
097
Tow
ong
RA
L 5
889
667
5 1
204
2 2
76 4
88 1
366
972
3 6
43 4
60 3
86.5
711
35.3
6 2
209
135
1 3
39 6
53 3
548
788
Wan
gara
tta
UR
S 2
7 19
7 3
645
197
4 4
229
367
2 3
05 1
57 6
534
524
155
.51
1167
.76
4 2
15 9
95 2
264
743
6 4
80 7
38
War
rnam
boo
lU
RM
33
300
121
326
2 8
80 1
72 6
59 3
26 3
539
498
86.
4920
22.4
7 2
863
199
649
816
3 5
13 0
15
Wel
lingt
onU
RM
42
319
10
817
303
1 7
593
179
4 5
27 1
19 1
2 12
0 29
8 1
79.4
314
93.6
1 7
596
834
4 4
36 6
46 1
2 03
3 48
0
Wes
t W
imm
era
RA
M 4
089
910
8 2
812
2 7
24 0
15 2
222
730
4 9
46 7
45 6
66.1
8 7
90.4
4 2
680
407
2 1
78 3
10 4
858
717
Whi
teho
rse
UD
V 1
61 7
24 6
4 6
07 3
324
714
851
026
4 1
75 7
40 2
0.56
#14
02.0
2 3
318
828
876
570
4 1
95 3
98
Whi
ttle
sea
UFV
179
261
490
118
5 1
0 65
0 72
5 1
861
000
12
511
725
59.
4115
70.4
6 1
0 98
2 53
5 1
916
860
12
899
395
Wod
onga
UR
M 3
7 34
5 4
33 4
97 3
819
053
878
074
4 6
97 1
27 1
02.2
617
66.7
5 3
938
031
845
408
4 7
83 4
39
Wyn
dha
mU
FV 1
89 6
18 5
42 1
247
12
258
937
1 8
43 7
04 1
4 10
2 64
1 6
4.65
1478
.51
12
640
849
1 8
99 0
45 1
4 53
9 89
4
Yarr
aU
DL
83
593
20
214
1 7
18 5
01 3
89 2
08 2
107
709
20.
56 #
1818
.73
1 7
53 8
41 3
95 6
66 2
149
507
Yarr
a R
ange
sU
FV 1
49 5
38 2
466
174
3 1
0 69
3 98
5 3
430
821
14
124
806
71.
5119
68.3
4 1
0 71
7 78
3 3
293
639
14
011
422
Yarr
iam
bia
ckR
AL
701
8 7
326
481
0 2
888
739
1 8
89 7
76 4
778
515
411
.62
392
.88
2 8
84 1
73 1
873
109
4 7
57 2
82
Qu
een
slan
d
Aur
ukun
*R
TM 1
401
734
7 8
5 1
828
008
60
473
1 8
88 4
81 1
304
.79
714
.91
1 7
55 1
32 6
1 44
6 1
816
578
Bal
onne
RA
M48
8631
106
2319
3 3
73 8
20 1
305
146
4 6
78 9
66 6
90.5
1 5
62.8
1 3
393
697
1 3
34 1
54 4
727
851

182
Local Government National Report 2014–15
Dis
trib
utio
n to
cou
ncils
for 2
014–
15 a
nd 2
015–
16 (c
ontin
ued)
Cou
nci
l nam
eC
lass
i-
fica
tion
Pop
ula
tion
aC
oun
cil
area
Roa
d
len
gth
2014
–15
actu
al e
nti
tlem
ent
2015
–16
esti
mat
ed e
nti
tlem
ent
Gen
eral
p
urp
ose
Loca
l roa
dTo
tal
Gen
eral
p
urp
ose
Min
Loca
l ro
adG
ener
al
pu
rpos
eLo
cal
road
Tota
l
No.
sq k
mkm
$$
$$
per
cap
ita
#$
per
km
$$
$
Ban
ana
RA
V15
200
28 5
4639
45 5
612
551
2 2
92 7
47 7
905
298
369
.25
581.
18 5
441
643
2 2
18 5
59 7
660
202
Bar
cald
ine
RTL
3361
53 5
2131
74 4
916
625
1 7
51 3
41 6
667
966
1462
.85
551.
78 5
061
770
1 6
85 7
76 6
747
546
Bar
coo
RTX
364
61 8
2516
66 2
834
510
904
528
3 7
39 0
3877
87.1
2 5
42.9
3 2
763
134
925
794
3 6
88 9
28
Bla
ckal
l-Ta
mb
oR
TM23
1930
389
1839
2 7
70 7
73 1
018
629
3 7
89 4
0211
94.8
155
3.90
2 8
34 4
50 1
043
924
3 8
78 3
74
Bou
liaR
TS49
660
956
1329
2 1
55 5
69 7
23 7
23 2
879
292
4345
.91
544
.56
2 2
19 2
04 7
40 6
83 2
959
887
Bris
ban
eU
CC
1 13
1 19
11
338
5666
23
271
684
14
966
339
38
238
023
20.
57 #
2641
.43
23
238
277
15 0
42 0
27 3
8 28
0 30
4
Bul
loo
RTS
408
73 7
6319
77 4
625
177
1 0
73 1
28 5
698
305
11 3
36.2
2 5
42.8
1 4
761
718
1 1
05 5
65 5
867
283
Bun
dab
erg
UR
L93
976
6 43
629
97 4
974
068
2 6
09 1
56 7
583
224
52.
9387
0.59
4 8
67 3
71 2
636
947
7 5
04 3
18
Bur
dek
inR
AV
17 8
885
043
1143
2 4
37 1
78 8
06 1
74 3
243
352
136
.25
705
.31
2 5
09 1
26 8
18 4
82 3
327
608
Bur
keR
TS55
640
039
713
2 4
37 4
19 3
91 3
23 2
828
742
4383
.85
548
.84
2 5
09 3
75 4
00 4
05 2
909
780
Cai
rns
UR
V15
7 11
61
688
1312
3 2
32 2
99 2
362
745
5 5
95 0
44 2
0.57
#18
00.4
6 3
221
642
2 3
77 9
54 5
599
596
Car
pen
taria
RTM
2225
64 1
2517
41 3
769
210
964
658
4 7
33 8
6816
94.0
3 5
54.0
8 3
765
215
986
839
4 7
52 0
54
Cas
sow
ary
Coa
stU
RS
28 6
9446
8511
63 2
186
507
930
694
3 1
17 2
01 7
6.20
800
.25
2 2
51 0
56 9
61 9
74 3
213
030
Cen
tral
Hig
hlan
ds
UR
M31
289
59 8
3546
88 6
018
243
2 8
63 7
37 8
881
980
192
.34
610
.87
5 8
34 9
83 2
854
852
8 6
89 8
35
Cha
rter
s To
wer
sR
AV
12 4
9168
374
4026
4 3
20 8
54 2
308
033
6 6
28 8
87 3
45.9
257
3.31
4 1
89 2
81 2
307
012
6 4
96 2
93
Che
rbou
rg *
RTM
1286
3270
498
736
51
376
550
112
387
.82
733.
94 5
13 4
59 5
2 14
7 5
65 6
06
Clo
ncur
ryR
AM
3413
47 9
8315
71 4
253
302
885
251
5 1
38 5
5312
46.2
1 5
63.5
0 4
378
865
904
728
5 2
83 5
93
Coo
kR
AM
4393
105
781
2676
6 9
99 4
10 1
492
964
8 4
92 3
7415
93.3
1 5
57.9
1 7
206
042
1 6
25 9
43 8
831
985
Cro
ydon
RTX
322
29 4
8710
88 2
705
257
591
599
3 2
96 8
5684
01.4
2 5
43.7
5 2
785
120
605
508
3 3
90 6
28
Dia
man
tina
RTX
292
94 6
6711
48 2
240
526
623
721
2 8
64 2
4776
73.0
3 5
43.3
1 2
306
670
638
383
2 9
45 0
53
Doo
mad
gee
*R
TM13
821
835
113
1 1
25 6
24 7
5 63
4 1
201
258
814
.49
669.
33 1
158
854
77
014
1 2
35 8
68
Dou
glas
RA
V11
502
2 42
737
3 1
010
838
322
473
1 3
33 3
11 8
7.88
865
.47
980
057
326
645
1 3
06 7
02
Eth
erid
geR
TS91
839
201
1754
3 5
28 4
49 9
57 9
33 4
486
382
3843
.63
546
.14
3 6
32 6
13 9
84 1
70 4
616
783
Flin
der
sR
TM18
2841
193
1992
4 6
10 8
14 1
096
180
5 7
06 9
9425
22.3
3 5
50.2
9 4
746
931
1 1
21 3
64 5
868
295
Fras
er C
oast
UR
L10
0 29
771
0337
32 4
314
356
3 0
73 0
36 7
387
392
43.
0282
3.43
4 1
82 9
80 2
486
630
6 6
69 6
10
Gla
dst
one
UR
M63
955
10 4
6625
86 5
580
939
2 0
71 0
56 7
651
995
87.
2680
0.87
5 4
10 9
95 2
119
239
7 5
30 2
34
Gol
d C
oast
UR
V53
7 84
413
3240
02 1
1 06
4 91
7 7
823
153
18
888
070
20.
57 #
1954
.81
11
065
399
7 3
70 5
78 1
8 43
5 97
7
Goo
ndiw
ind
iR
AV
11 0
3219
255
2475
4 3
10 1
60 1
454
156
5 7
64 3
16 3
90.7
058
7.54
4 3
66 9
44 1
484
157
5 8
51 1
01
Gym
pie
UR
M48
145
6885
2283
3 4
59 0
54 1
740
881
5 1
99 9
35 7
1.85
762.
54 3
353
723
1 7
63 0
52 5
116
775

183
Appendix D • Distribution to local governing bodies in 2014–15
Dis
trib
utio
n to
cou
ncils
for 2
014–
15 a
nd 2
015–
16 (c
ontin
ued)
Cou
nci
l nam
eC
lass
i-
fica
tion
Pop
ula
tion
aC
oun
cil
area
Roa
d
len
gth
2014
–15
actu
al e
nti
tlem
ent
2015
–16
esti
mat
ed e
nti
tlem
ent
Gen
eral
p
urp
ose
Loca
l roa
dTo
tal
Gen
eral
p
urp
ose
Min
Loca
l ro
adG
ener
al
pu
rpos
eLo
cal
road
Tota
l
No.
sq k
mkm
$$
$$
per
cap
ita
#$
per
km
$$
$
Hin
chin
bro
okR
AV
11 7
0028
0169
3 1
514
983
497
774
2 0
12 7
57 1
29.4
9 7
18.2
9 1
468
851
503
285
1 9
72 1
36
Hop
e Va
le *
RTM
1080
1105
115
879
508
73
538
953
046
814
.36
639.
46 9
05 4
72 7
5 00
8 9
80 4
80
Ipsw
ich
UR
V18
3 10
510
8816
38 3
766
969
2 8
12 3
05 6
579
274
20.
57 #
1716
.91
3 8
10 5
49 2
919
142
6 7
29 6
91
Isaa
cU
RS
24 2
7558
720
3249
3 0
38 1
23 2
011
959
5 0
50 0
82 1
25.1
561
9.25
2 9
45 6
10 2
054
649
5 0
00 2
59
Kow
anya
ma*
RTM
1115
2543
352
1 2
99 0
11 2
02 2
85 1
501
296
1165
.03
573.
92 1
337
359
206
740
1 5
44 0
99
Livi
ngst
one
UFM
35 3
9411
751
1419
2 6
23 7
99 1
139
596
3 7
63 3
95 7
4.13
803
.10
2 5
43 9
02 1
158
919
3 7
02 8
21
Lock
hart
Riv
er *
RTS
529
3578
333
1 3
89 3
47 1
85 5
98 1
574
945
2626
.36
557.
35 1
430
362
98
028
1 5
28 3
90
Lock
yer
Valle
yU
RM
37 6
5222
6914
28 2
931
840
1 1
68 2
24 4
100
064
77.
87 8
18.0
8 2
907
016
1 1
87 8
41 4
094
857
Loga
nU
RV
300
667
958
2264
6 1
85 5
40 4
387
804
10
573
344
20.
57 #
1938
.08
6 1
82 6
92 4
430
982
10
613
674
Long
reac
hR
TL42
4440
572
3032
6 0
80 6
91 1
683
862
7 7
64 5
5314
32.7
755
5.36
5 8
95 5
29 1
564
836
7 4
60 3
65
Mac
kay
UR
V12
1 90
976
0124
71 3
782
443
2 6
18 7
11 6
401
154
31.
0310
59.7
8 3
667
264
2 6
52 2
04 6
319
468
Map
oon
Ab
orig
inal
S
hire
Cou
ncil*
RTX
288
548
35 9
76 7
95 2
1 95
3 9
98 7
4833
91.6
562
7.23
1 0
05 6
31 2
2 41
1 1
028
042
Mar
anoa
RA
V13
800
58 7
1158
69 1
2 64
9 94
2 3
318
198
15
968
140
916
.66
565.
38 1
3 02
3 38
4 3
387
011
16
410
395
Mar
eeb
aU
RS
21 2
6853
504
2305
4 8
16 3
05 1
469
958
6 2
86 2
63 2
26.4
6 6
37.7
3 4
958
488
1 5
00 0
95 6
458
583
McK
inla
yR
TM10
8540
734
1978
4 2
69 2
61 1
080
792
5 3
50 0
5339
34.8
0 5
46.4
1 4
395
295
1 1
05 9
48 5
501
243
Mor
eton
Bay
UR
V40
8 91
420
3335
24 8
412
475
6 2
08 0
46 1
4 62
0 52
1 2
0.57
#17
61.6
5 8
452
786
6 2
31 4
91 1
4 68
4 27
7
Mor
ning
ton
*R
TM12
1412
4423
8 1
364
701
141
446
1 5
06 1
4711
24.1
4 5
94.3
1 1
404
989
100
134
1 5
05 1
23
Mou
nt Is
aU
RS
22 7
7943
188
2033
4 0
13 1
51 1
338
805
5 3
51 9
56 1
76.1
8 6
58.5
4 4
131
625
1 3
60 8
61 5
492
486
Mur
weh
RTL
4736
40 6
9827
59 5
022
984
1 5
41 2
24 6
564
208
1060
.60
558
.70
4 9
28 3
32 1
575
863
6 5
04 1
95
Nap
ranu
m*
RTS
926
1998
171
950
622
102
343
1 0
52 9
6510
26.5
959
7.52
978
685
104
423
1 0
83 1
08
Noo
saU
RM
52 6
8787
087
0 1
083
926
1 0
24 7
63 2
108
689
20.
57 #
1177
.89
1 0
75 0
36 1
031
962
2 1
06 9
98
Nor
th B
urne
ttR
AV
10 3
6019
667
4132
8 3
92 7
41 2
342
917
10
735
658
810
.11
567
.02
8 6
40 5
05 2
393
815
11
034
320
Nor
ther
n P
enin
sula
A
rea*
RTM
2560
1057
363
3 4
62 8
50 2
22 9
45 3
685
795
1352
.68
614.
94 3
565
077
228
282
3 7
93 3
59
Pal
m Is
land
*R
TM25
9071
38 1
064
400
47
809
1 1
12 2
09 4
10.9
712
57.4
4 1
095
822
48
196
1 1
44 0
18
Par
ooR
TM19
0347
616
2283
3 4
36 7
36 1
254
293
4 6
91 0
2918
05.9
6 5
49.4
1 3
538
193
1 2
83 1
01 4
821
294
Por
mp
uraa
w *
RTS
727
4429
566
1 1
99 2
46 3
13 7
30 1
512
976
1649
.58
554.
15 1
234
650
320
917
1 5
55 5
67
Qui
lpie
RTS
983
67 4
2320
41 3
593
749
1 1
13 7
79 4
707
528
3655
.90
545
.70
3 6
62 9
66 1
151
317
4 8
14 2
83
Red
land
UR
V14
7 43
753
610
55 3
033
181
2 1
21 7
94 5
154
975
20.
57 #
2011
.18
3 0
12 0
33 2
129
497
5 1
41 5
30

184
Local Government National Report 2014–15
Dis
trib
utio
n to
cou
ncils
for 2
014–
15 a
nd 2
015–
16 (c
ontin
ued)
Cou
nci
l nam
eC
lass
i-
fica
tion
Pop
ula
tion
aC
oun
cil
area
Roa
d
len
gth
2014
–15
actu
al e
nti
tlem
ent
2015
–16
esti
mat
ed e
nti
tlem
ent
Gen
eral
p
urp
ose
Loca
l roa
dTo
tal
Gen
eral
p
urp
ose
Min
Loca
l ro
adG
ener
al
pu
rpos
eLo
cal
road
Tota
l
No.
sq k
mkm
$$
$$
per
cap
ita
#$
per
km
$$
$
Ric
hmon
dR
TS84
526
580
1254
3 2
29 4
48 6
86 8
47 3
916
295
3821
.83
547
.72
3 1
31 1
09 7
26 1
67 3
857
276
Roc
kham
pto
nU
RL
82 6
4965
6019
92 4
977
340
1 9
46 4
37 6
923
777
60.
2297
7.30
5 1
24 2
77 1
968
220
7 0
92 4
97
Sce
nic
Rim
UFM
38 3
9942
4817
94 1
668
150
1 3
73 9
57 3
042
107
43.
4476
5.86
1 6
17 3
54 1
398
470
3 0
15 8
24
Som
erse
tU
FS23
287
5373
1899
2 1
77 0
94 1
271
705
3 4
48 7
99 9
3.49
669.
67 2
129
601
1 2
88 9
99 3
418
600
Sou
th B
urne
ttU
RM
32 6
4183
8232
77 4
952
659
2 1
15 1
29 7
067
788
151
.73
645.
45 4
801
846
2 1
55 4
29 6
957
275
Sou
ther
n D
owns
UR
M35
559
7112
3053
4 9
86 7
27 2
024
731
7 0
11 4
58 1
40.2
466
3.19
4 8
34 8
77 2
060
251
6 8
95 1
28
Sun
shin
e C
oast
UR
V27
7 81
122
5129
71 5
715
320
4 5
29 5
22 1
0 24
4 84
2 2
0.57
#15
24.5
8 5
731
052
4 5
78 8
32 1
0 30
9 88
4
Tab
lela
nds
UR
S24
907
11 2
8918
45 3
990
085
1 2
64 0
01 5
254
086
160
.20
685.
12 4
107
877
1 2
80 2
22 5
388
099
Toow
oom
ba
UR
V16
0 25
112
958
8035
10
176
986
6 0
30 2
62 1
6 20
7 24
8 6
3.51
750.
50 9
541
465
5 7
56 7
07 1
5 29
8 17
2
Torr
esR
TL36
0388
311
2 2
741
205
98
464
2 8
39 6
69 7
60.8
1 8
79.1
4 2
822
129
99
868
2 9
21 9
97
Torr
es S
trai
t Is
land
*R
TL45
6748
936
8 1
0 03
1 60
1 2
47 2
64 1
0 27
8 86
521
96.5
467
1.06
9 7
26 1
30 2
51 8
54 9
977
984
Tow
nsvi
lleU
RV
189
238
3727
1682
4 0
66 6
80 2
900
630
6 9
67 3
10 2
1.49
1724
.51
3 9
42 8
46 2
939
521
6 8
82 3
67
Wes
tern
Dow
nsU
RM
33 4
9437
939
7517
13
671
629
4 4
16 3
96 1
8 08
8 02
5 4
08.1
858
7.52
13
255
316
4 5
09 9
71 1
7 76
5 28
7
Whi
tsun
day
UR
M34
016
23 8
0418
54 3
306
058
1 3
60 2
75 4
666
333
97.
1973
3.70
3 3
64 4
98 1
373
862
4 7
38 3
60
Win
ton
RTM
1382
53 8
1425
02 4
041
591
1 3
67 2
10 5
408
801
2924
.45
546
.45
3 9
90 5
05 1
399
024
5 3
89 5
29
Woo
rab
ind
a*R
TS99
639
080
452
485
53
677
506
162
454
.30
671.
80 4
65 8
43 4
1 53
9 5
07 3
82
Wuj
al W
ujal
*R
TX28
511
22 4
14 7
65 1
4 89
3 4
29 6
5814
55.3
267
6.95
427
009
12
981
439
990
Yarr
abah
*R
TM26
8115
950
781
512
55
243
836
755
291
.50
1104
.86
804
583
59
035
863
618
Wes
tern
Au
stra
lia
Alb
any
UR
M 3
6 26
2 4
315
156
9 2
114
086
1 7
21 8
76 3
835
962
58.
3010
97.4
4 2
137
732
1 7
69 1
17 3
906
849
Arm
adal
eU
FM 7
3 72
5 5
60 6
81 1
804
837
1 3
37 0
60 3
141
897
24.
4819
63.3
8 1
689
593
1 7
36 0
98 3
425
691
Ash
bur
ton
RTL
10
959
105
647
216
0 3
379
897
1 3
05 3
18 4
685
215
308
.41
604
.31
3 4
04 6
14 1
300
978
4 7
05 5
92
Aug
usta
-Mar
gare
t R
iver
RA
V 1
3 16
8 2
370
893
270
008
1 0
80 7
91 1
350
799
20.
50 #
1210
.29
275
763
1 3
27 3
71 1
603
134
Bas
send
ean
UD
S 1
5 92
3 1
1 9
5 3
26 4
98 2
15 6
97 5
42 1
95 2
0.50
#22
70.4
9 3
30 0
73 2
14 5
96 5
44 6
69
Bay
swat
erU
DM
69
493
33
340
1 4
24 9
44 7
20 6
87 2
145
631
20.
50 #
2119
.67
1 4
31 8
30 7
17 0
63 2
148
893
Bel
mon
tU
DM
40
083
40
227
821
896
520
809
1 3
42 7
05 2
0.50
#22
94.3
1 8
30 2
08 5
22 1
45 1
352
353
Bev
erle
yR
AS
156
6 2
310
696
808
295
513
711
1 3
22 0
06 5
16.1
573
8.09
820
118
489
388
1 3
09 5
06
Bod
din
gton
RA
M 2
471
190
0 2
57 1
97 0
60 1
92 5
38 3
89 5
98 7
9.75
749
.18
168
707
203
056
371
763
Boy
up B
rook
RA
S 1
738
283
8 1
025
466
190
1 0
14 6
82 1
480
872
268
.23
989
.93
501
717
1 0
97 1
43 1
598
860

185
Appendix D • Distribution to local governing bodies in 2014–15
Dis
trib
utio
n to
cou
ncils
for 2
014–
15 a
nd 2
015–
16 (c
ontin
ued)
Cou
nci
l nam
eC
lass
i-
fica
tion
Pop
ula
tion
aC
oun
cil
area
Roa
d
len
gth
2014
–15
actu
al e
nti
tlem
ent
2015
–16
esti
mat
ed e
nti
tlem
ent
Gen
eral
p
urp
ose
Loca
l roa
dTo
tal
Gen
eral
p
urp
ose
Min
Loca
l ro
adG
ener
al
pu
rpos
eLo
cal
road
Tota
l
No.
sq k
mkm
$$
$$
per
cap
ita
#$
per
km
$$
$
Brid
geto
wn-
Gre
enb
ushe
sR
AM
451
3 1
691
713
1 1
84 4
53 6
81 8
52 1
866
305
262
.45
956
.31
1 2
05 0
43 6
88 8
51 1
893
894
Bro
okto
nR
AS
992
162
6 5
27 5
90 1
10 3
25 7
97 9
15 9
07 5
94.8
7 6
18.2
1 6
05 6
14 3
27 6
46 9
33 2
60
Bro
ome
RTL
17
251
56
000
562
2 0
43 8
87 9
26 5
89 2
970
476
118
.48
1648
.73
1 9
36 7
48 9
24 9
25 2
861
673
Bro
omeh
ill -
Tam
bel
lup
RA
S 1
167
281
0 9
71 1
133
576
917
853
2 0
51 4
29 9
71.3
6 9
45.2
7 1
160
677
610
198
1 7
70 8
75
Bru
ce R
ock
RA
S 9
96 2
772
117
5 1
470
729
951
305
2 4
22 0
3414
76.6
4 8
09.6
2 1
512
380
990
317
2 5
02 6
97
Bun
bur
yU
RM
33
623
61
321
689
434
846
228
1 5
35 6
62 2
0.50
#26
36.2
2 6
93 5
63 8
82 8
55 1
576
418
Bus
selto
nU
RM
34
290
145
4 1
091
703
111
1 4
01 6
15 2
104
726
20.
50 #
1284
.71
720
657
2 1
08 0
24 2
828
681
Cam
brid
geU
DS
27
997
22
173
574
074
376
000
950
074
20.
50 #
2173
.41
574
811
374
082
948
893
Can
ning
UD
L 9
6 35
6 6
5 5
76 1
975
766
1 3
72 9
07 3
348
673
20.
50 #
2383
.52
1 9
87 0
85 1
680
662
3 6
67 7
47
Cap
elR
SG
16
447
554
493
1 0
12 3
82 5
48 7
71 1
561
153
61.
5511
13.1
3 1
028
917
741
739
1 7
70 6
56
Car
nam
ahR
AS
550
283
5 6
43 8
40 7
74 3
86 1
04 1
226
878
1528
.68
600
.47
855
477
384
135
1 2
39 6
12
Car
narv
onR
AL
613
9 5
3 00
0 1
526
3 6
80 0
93 1
126
134
4 8
06 2
27 5
99.4
6 7
37.9
6 3
713
717
1 0
99 5
78 4
813
295
Cha
pm
an V
alle
yR
AS
121
4 4
007
863
322
577
494
620
817
197
265
.71
573
.14
338
448
491
805
830
253
Chi
tter
ing
RA
M 4
996
122
0 4
34 6
94 1
75 4
36 7
21 1
130
896
138
.95
1006
.27
725
808
474
582
1 2
00 3
90
Cla
rem
ont
UD
S 1
0 35
9 5
47
212
410
102
347
314
757
20.
50 #
2177
.60
215
030
101
830
316
860
Coc
kbur
nU
DL
103
351
148
796
2 1
19 1
97 1
469
512
3 5
88 7
09 2
0.50
#18
46.1
2 2
159
012
1 4
90 7
71 3
649
783
Col
lieR
AL
969
2 1
685
384
1 2
97 3
48 4
57 5
55 1
754
903
133
.86
1191
.55
1 1
97 5
14 4
57 7
98 1
655
312
Coo
lgar
die
RTL
432
4 3
0 40
0 8
47 5
25 3
52 4
98 8
13 1
024
165
121
.50
588
.92
535
944
494
283
1 0
30 2
27
Coo
row
RA
S 1
085
413
7 8
56 8
16 6
00 5
17 1
44 1
333
744
752
.63
604
.14
834
950
515
086
1 3
50 0
36
Cor
rigin
RA
S 1
099
309
5 1
075
1 0
41 5
97 6
48 9
68 1
690
565
947
.77
603
.69
1 0
63 8
00 6
45 6
59 1
709
459
Cot
tesl
oeU
DS
857
2 4
47
175
768
101
646
277
414
20.
50 #
2162
.68
176
365
101
263
277
628
Cra
nbro
okR
AS
110
1 3
390
101
4 6
35 7
10 9
51 5
67 1
587
277
577
.39
938
.43
669
680
875
817
1 5
45 4
97
Cub
allin
gR
AS
878
125
0 5
55 5
54 0
36 3
18 6
80 8
72 7
16 6
31.0
2 5
74.2
0 5
62 0
66 3
16 8
00 8
78 8
66
Cue
RTX
298
13
716
740
1 2
29 0
99 4
18 8
75 1
647
974
412
4.49
566
.05
1 2
84 1
46 4
16 4
42 1
700
588
Cun
der
din
RA
S 1
302
187
2 7
83 8
70 7
26 4
93 1
69 1
363
895
668
.76
629
.85
883
164
490
653
1 3
73 8
17
Dal
wal
linu
RA
S 1
295
718
7 1
918
1 3
88 2
84 1
106
917
2 4
95 2
01 1
072.
03 5
77.1
2 1
443
178
1 1
00 7
54 2
543
932
Dan
dar
agan
RA
M 3
325
693
4 1
195
738
990
844
776
1 5
83 7
66 2
22.2
5 7
06.9
3 7
51 1
08 8
40 4
67 1
591
575
Dar
dan
upR
AV
13
791
518
403
873
570
649
521
1 5
23 0
91 6
3.34
1611
.71
886
062
460
882
1 3
46 9
44
Den
mar
kR
SG
574
8 1
842
617
596
606
436
946
1 0
33 5
52 1
03.7
9 7
08.1
8 5
89 2
91 7
59 3
05 1
348
596

186
Local Government National Report 2014–15
Dis
trib
utio
n to
cou
ncils
for 2
014–
15 a
nd 2
015–
16 (c
ontin
ued)
Cou
nci
l nam
eC
lass
i-
fica
tion
Pop
ula
tion
aC
oun
cil
area
Roa
d
len
gth
2014
–15
actu
al e
nti
tlem
ent
2015
–16
esti
mat
ed e
nti
tlem
ent
Gen
eral
p
urp
ose
Loca
l roa
dTo
tal
Gen
eral
p
urp
ose
Min
Loca
l ro
adG
ener
al
pu
rpos
eLo
cal
road
Tota
l
No.
sq k
mkm
$$
$$
per
cap
ita
#$
per
km
$$
$
Der
by-
Wes
t K
imb
erle
yR
TL 1
0 04
7 1
02 7
06 1
779
4 2
59 4
62 1
076
291
5 3
35 7
53 4
23.9
5 6
05.0
0 4
300
393
1 0
67 9
34 5
368
327
Don
nyb
rook
-Bal
ingu
pR
AL
575
3 1
541
670
1 2
04 4
07 1
255
882
2 4
60 2
89 2
09.3
518
74.4
5 1
236
180
666
491
1 9
02 6
71
Dow
erin
RA
S 6
72 1
867
939
818
966
522
513
1 3
41 4
79 1
218.
70 5
56.4
6 8
38 6
23 5
19 5
17 1
358
140
Dum
ble
yung
RA
S 6
08 2
553
989
907
036
610
654
1 5
17 6
90 1
491.
84 6
17.4
5 9
38 1
21 5
61 5
32 1
499
653
Dun
das
RTM
118
2 9
2 72
5 6
27 1
140
344
373
379
1 5
13 7
23 9
64.7
6 5
95.5
0 1
115
975
360
398
1 4
76 3
73
Eas
t Fr
eman
tleU
DS
773
6 3
37
158
626
72
147
230
773
20.
50 #
1949
.92
158
694
71
779
230
473
Eas
t P
ilbar
aR
TL 1
2 96
0 3
71 6
96 3
049
3 0
54 7
00 2
264
092
5 3
18 7
92 2
35.7
0 7
42.5
7 2
909
802
2 2
74 9
32 5
184
734
Esp
eran
ceR
AV
14
242
44
500
425
0 2
053
750
2 7
55 8
34 4
809
584
144
.20
648
.43
2 1
00 5
70 2
753
310
4 8
53 8
80
Exm
outh
RTM
257
0 6
261
286
1 4
68 0
18 4
06 8
75 1
874
893
571
.21
1422
.64
1 4
82 3
69 4
04 8
01 1
887
170
Frem
antle
UD
S 3
0 32
1 1
9 1
77 6
21 7
28 3
92 6
23 1
014
351
20.
50 #
2218
.21
625
838
390
628
1 0
16 4
66
Gin
gin
RA
M 5
248
332
5 8
72 8
69 0
37 8
38 7
92 1
707
829
165
.59
961
.92
884
638
832
063
1 7
16 7
01
Gno
wan
geru
pR
AS
130
3 5
000
101
1 6
37 6
00 6
06 2
21 1
243
821
489
.33
599
.63
668
163
602
549
1 2
70 7
12
Goo
mal
ling
RA
S 9
76 1
845
583
356
159
348
427
704
586
364
.92
597
.64
362
469
346
451
708
920
Gos
nells
UFL
121
252
127
727
2 4
86 2
54 1
558
270
4 0
44 5
24 2
0.50
#21
43.4
3 2
512
694
1 7
92 5
27 4
305
221
Gre
ater
Ger
ald
ton
UR
M 4
0 44
8 9
929
208
8 3
797
599
1 9
37 9
30 5
735
529
93.
89 9
28.1
3 3
844
774
1 9
26 8
26 5
771
600
Hal
ls C
reek
RTL
394
0 1
43 0
25 1
420
3 4
24 3
62 1
063
715
4 4
88 0
77 8
69.1
3 7
49.1
0 3
463
542
974
396
4 4
37 9
38
Har
vey
UR
S 2
5 92
4 1
766
848
1 5
76 4
57 1
075
532
2 6
51 9
89 6
0.81
1268
.32
1 6
21 7
73 9
56 8
16 2
578
589
Irw
inR
AM
378
0 2
223
445
283
167
325
896
609
063
74.
91 7
32.3
5 2
42 4
25 3
25 3
24 5
67 7
49
Jerr
amun
gup
RA
S 1
085
654
0 1
081
579
841
590
923
1 1
70 7
64 5
34.4
2 5
46.6
4 6
10 8
56 5
90 1
64 1
201
020
Joon
dal
upU
DV
167
623
99
100
6 3
437
085
2 0
63 5
67 5
500
652
20.
50 #
2051
.26
3 4
17 4
16 2
117
506
5 5
34 9
22
Kal
amun
da
UFM
59
716
349
613
1 2
24 4
67 1
089
881
2 3
14 3
48 2
0.50
#17
77.9
5 1
230
945
1 2
95 5
20 2
526
465
Kal
goor
lie/B
ould
erU
RM
33
763
95
228
134
7 7
79 0
08 1
613
495
2 3
92 5
03 2
3.07
1197
.84
785
561
1 6
69 7
52 2
455
313
Kat
anni
ngR
AM
440
7 1
523
693
1 4
61 3
32 4
83 9
56 1
945
288
331
.59
698
.35
1 4
81 2
80 4
81 5
34 1
962
814
Kel
lerb
errin
RA
S 1
227
185
2 9
40 1
280
365
1 2
33 2
25 2
513
590
104
3.49
1311
.94
1 3
12 2
33 5
47 5
44 1
859
777
Ken
tR
AS
528
655
2 1
324
532
310
687
328
1 2
19 6
38 1
008.
16 5
19.1
3 5
78 4
99 6
86 5
70 1
265
069
Koj
onup
RA
M 2
022
293
7 1
135
723
053
659
817
1 3
82 8
70 3
57.5
9 5
81.3
4 7
56 1
73 6
49 0
46 1
405
219
Kon
din
inR
AS
104
2 7
340
133
6 8
83 4
19 7
21 9
53 1
605
372
847
.81
540
.38
944
706
716
679
1 6
61 3
85
Koo
rda
RA
S 4
31 2
662
106
5 1
179
887
605
135
1 7
85 0
22 2
737.
56 5
68.2
0 1
197
866
601
703
1 7
99 5
69
Kul
inR
AS
834
479
0 1
436
828
150
802
503
1 6
30 6
53 9
92.9
9 5
58.8
5 8
88 7
21 8
10 2
74 1
698
995
Kw
inan
aU
FM 3
4 41
3 1
18 3
74 7
05 6
34 6
74 1
13 1
379
747
20.
50 #
1802
.44
732
471
686
717
1 4
19 1
88

187
Appendix D • Distribution to local governing bodies in 2014–15
Dis
trib
utio
n to
cou
ncils
for 2
014–
15 a
nd 2
015–
16 (c
ontin
ued)
Cou
nci
l nam
eC
lass
i-
fica
tion
Pop
ula
tion
aC
oun
cil
area
Roa
d
len
gth
2014
–15
actu
al e
nti
tlem
ent
2015
–16
esti
mat
ed e
nti
tlem
ent
Gen
eral
p
urp
ose
Loca
l roa
dTo
tal
Gen
eral
p
urp
ose
Min
Loca
l ro
adG
ener
al
pu
rpos
eLo
cal
road
Tota
l
No.
sq k
mkm
$$
$$
per
cap
ita
#$
per
km
$$
$
Lake
Gra
ceR
AS
137
0 1
0 74
7 2
287
963
752
1 2
37 7
31 2
201
483
703
.47
541
.20
1 0
27 0
20 1
223
268
2 2
50 2
88
Lave
rton
RTM
135
7 1
83 1
98 4
209
1 5
40 4
86 9
07 0
55 2
447
541
113
5.21
215
.50
1 5
55 7
48 8
11 0
09 2
366
757
Leon
ora
RTM
276
4 3
1 74
3 1
226
593
550
594
789
1 1
88 3
39 2
14.7
4 4
85.1
5 6
08 3
38 5
92 8
17 1
201
155
Man
dur
ahU
FM 8
0 68
3 1
74 6
71 1
654
393
1 2
23 6
00 2
877
993
20.
50 #
1823
.55
1 6
75 9
19 1
217
900
2 8
93 8
19
Man
jimup
RA
L 9
427
702
8 1
304
2 6
08 9
79 1
582
323
4 1
91 3
02 2
76.7
612
13.4
4 2
687
515
1 3
31 1
82 4
018
697
Mee
kath
arra
RTM
152
1 1
00 7
33 2
491
2 3
62 1
51 1
103
963
3 4
66 1
14 1
553.
02 4
43.1
8 2
399
997
1 1
00 0
54 3
500
051
Mel
ville
UD
L 1
06 3
35 5
3 5
24 2
180
383
1 0
58 5
74 3
238
957
20.
50 #
2020
.18
2 1
73 1
77 1
053
176
3 2
26 3
53
Men
zies
RTS
422
128
353
207
5 1
702
030
754
535
2 4
56 5
65 4
033.
25 3
63.6
3 1
720
096
872
027
2 5
92 1
23
Mer
red
inR
AM
330
0 3
372
129
1 1
468
076
817
199
2 2
85 2
75 4
44.8
7 6
33.0
0 1
493
371
813
162
2 3
06 5
33
Min
gene
wR
AS
486
192
7 4
51 2
68 7
27 3
06 2
38 5
74 9
65 5
52.9
4 6
79.0
2 2
73 7
58 3
04 8
92 5
78 6
50
Moo
raR
AM
253
5 3
788
940
758
994
674
163
1 4
33 1
57 2
99.4
1 7
17.1
9 7
94 0
47 6
72 4
89 1
466
536
Mor
awa
RA
S 9
06 3
528
969
981
694
539
797
1 5
21 4
91 1
083.
55 5
57.0
7 1
003
037
541
135
1 5
44 1
72
Mos
man
Par
kU
DS
950
8 4
43
194
960
82
395
277
355
20.
50 #
1916
.16
194
806
81
085
275
891
Mou
nt M
agne
tR
TS 7
11 1
3 87
7 5
91 1
311
873
306
151
1 6
18 0
24 1
845.
11 5
18.0
2 1
335
637
305
070
1 6
40 7
07
Mou
nt M
arsh
all
RA
S 4
71 1
0 13
4 1
716
1 3
66 3
70 8
32 9
98 2
199
368
290
1.00
485
.43
1 3
96 7
25 8
28 7
50 2
225
475
Muk
inb
udin
RA
S 4
91 3
414
908
1 0
91 5
45 5
11 3
79 1
602
924
222
3.11
563
.19
1 1
22 2
93 5
06 6
40 1
628
933
Mun
dar
ing
UFM
39
796
644
659
1 8
01 3
47 1
034
185
2 8
35 5
32 4
5.26
1569
.32
1 5
42 1
69 1
014
078
2 5
56 2
47
Mur
chis
onR
TX 1
27 4
9 50
0 1
899
2 5
43 8
56 8
33 8
88 3
377
744
20
030.
36 4
39.1
2 2
606
200
830
996
3 4
37 1
96
Mur
ray
RA
V 1
6 30
4 1
821
687
1 0
64 8
25 1
049
958
2 1
14 7
83 6
5.31
1528
.32
911
618
994
966
1 9
06 5
84
Nan
nup
RA
S 1
316
295
3 4
86 8
27 9
47 8
61 7
12 1
689
659
629
.14
1773
.07
840
476
933
340
1 7
73 8
16
Nar
emb
een
RA
S 8
10 3
821
141
2 1
151
457
770
874
1 9
22 3
31 1
421.
55 5
45.9
4 1
178
051
765
828
1 9
43 8
79
Nar
rogi
nR
AS
884
161
8 7
33 5
73 5
23 4
12 9
59 9
86 4
82 6
48.7
8 5
63.3
8 5
84 9
87 4
10 6
03 9
95 5
90
Nar
rogi
n (T
own)
UR
S 4
,430
13
68
1,0
94,9
80 1
56,3
71 1
,251
,351
247
.17
2,29
9.57
1,1
03,8
48 1
54,6
49 1
,258
,497
Ned
land
sU
DS
22,
918
21
141
469
,930
290
,995
760
,925
20.
50 #
2,06
3.79
471
,319
289
,240
760
,559
Nga
anya
tjarr
aku*
RTM
1,5
84 1
59,9
48 1
,322
3,2
13,7
20 1
,194
,282
4,4
08,0
02 2
,028
.86
903
.39
3,2
45,6
63 1
,174
,976
4,4
20,6
39
Nor
tham
RA
V 1
1,73
0 1
,443
753
2,5
30,1
75 7
68,9
33 3
,299
,108
215
.70
1,02
1.16
2,5
72,2
55 8
03,6
85 3
,375
,940
Nor
tham
pto
nR
AM
3,3
79 1
2,49
9 1
,066
789
,447
683
,421
1,4
72,8
68 2
33.6
3 6
41.1
1 8
11,6
83 6
79,6
57 1
,491
,340
Nun
garin
RA
S 2
28 1
,145
510
901
,574
292
,208
1,1
93,7
82 3
,954
.27
572
.96
917
,802
290
,547
1,2
08,3
49
Pep
per
min
t G
rove
UD
S 1
,681
2 9
34,
469
20,
105
54,
574
20.
51 #
2,23
3.89
34,
146
19,
880
54,
026
Per
enjo
riR
AS
924
8,2
14 1
,439
1,0
09,0
14 8
15,8
44 1
,824
,858
1,0
92.0
1 5
66.9
5 1
,047
,260
811
,696
1,8
58,9
56
Per
thU
CC
20,
285
9 9
3 4
15,9
40 4
15,2
85 8
31,2
25 2
0.50
#4,
465.
43 4
20,7
38 4
08,5
54 8
29,2
92

188
Local Government National Report 2014–15
Dis
trib
utio
n to
cou
ncils
for 2
014–
15 a
nd 2
015–
16 (c
ontin
ued)
Cou
nci
l nam
eC
lass
i-
fica
tion
Pop
ula
tion
aC
oun
cil
area
Roa
d
len
gth
2014
–15
actu
al e
nti
tlem
ent
2015
–16
esti
mat
ed e
nti
tlem
ent
Gen
eral
p
urp
ose
Loca
l roa
dTo
tal
Gen
eral
p
urp
ose
Min
Loca
l ro
adG
ener
al
pu
rpos
eLo
cal
road
Tota
l
No.
sq k
mkm
$$
$$
per
cap
ita
#$
per
km
$$
$
Pin
gelly
RA
S 1
,195
1,2
23 5
65 8
01,3
24 3
43,1
87 1
,144
,511
670
.56
607
.41
823
,494
341
,068
1,1
64,5
62
Pla
ntag
enet
RA
M 5
,182
4,7
92 1
,310
687
,958
832
,447
1,5
20,4
05 1
32.7
6 6
35.4
6 7
25,1
05 8
39,8
67 1
,564
,972
Por
t H
edla
ndR
TL 1
6,47
2 1
1,84
4 5
05 1
,603
,343
671
,397
2,2
74,7
40 9
7.34
1,32
9.50
1,3
72,6
53 7
31,6
77 2
,104
,330
Qua
irad
ing
RA
S 1
,094
2,0
00 8
63 1
,090
,147
543
,330
1,6
33,4
77 9
96.4
8 6
29.5
8 1
,125
,056
540
,452
1,6
65,5
08
Rav
enst
horp
eR
AM
2,2
88 1
2,87
2 1
,236
958
,796
716
,913
1,6
75,7
09 4
19.0
5 5
80.0
3 1
,006
,792
711
,221
1,7
18,0
13
Roc
king
ham
UD
L 1
20,8
59 2
61 9
56 2
,478
,196
1,7
84,4
49 4
,262
,645
20.
50 #
1,86
6.58
2,5
51,1
16 1
,856
,392
4,4
07,5
08
Roe
bou
rne
UR
S 2
5,90
7 1
5,19
6 5
99 1
,985
,930
1,2
93,5
01 3
,279
,431
76.
662,
159.
43 1
,700
,193
844
,692
2,5
44,8
85
San
dst
one
RTX
116
28,
218
922
1,4
81,5
82 4
25,4
43 1
,907
,025
12,
772.
26 4
61.4
3 1
,501
,244
423
,862
1,9
25,1
06
Ser
pen
tine-
Jarr
ahd
ale
RS
G 2
1,16
2 9
05 6
61 1
,572
,164
805
,257
2,3
77,4
21 7
4.29
1,21
8.24
1,5
91,3
62 9
24,3
40 2
,515
,702
Sha
rk B
ayR
TS 9
28 2
5,00
0 5
71 1
,427
,657
419
,900
1,8
47,5
57 1
,538
.42
735
.38
1,4
54,4
33 4
18,4
76 1
,872
,909
Sou
th P
erth
UD
M 4
6,11
3 2
0 1
92 9
45,5
41 3
98,2
61 1
,343
,802
20.
50 #
2,07
4.28
941
,847
396
,230
1,3
38,0
77
Stir
ling
UD
V 2
23,3
17 1
00 1
,028
4,5
79,0
82 2
,144
,683
6,7
23,7
65 2
0.50
#2,
086.
27 4
,607
,547
2,2
82,4
21 6
,889
,968
Sub
iaco
UD
S 1
9,69
3 7
89
403
,802
211
,251
615
,053
20.
50 #
2,37
3.61
408
,680
205
,073
613
,753
Sw
anU
FL 1
24,7
82 1
,043
1,4
20 2
,558
,636
2,6
31,0
95 5
,189
,731
20.
50 #
1,85
2.88
2,6
34,6
88 2
,427
,058
5,0
61,7
46
Tam
min
RA
S 4
01 1
,087
495
751
,119
282
,383
1,0
33,5
02 1
,873
.11
570
.47
759
,910
280
,943
1,0
40,8
53
Thre
e S
prin
gsR
AS
632
262
9 6
75 4
93 1
34 4
31 5
18 9
24 6
52 7
80.2
8 6
39.2
9 5
17 1
94 4
28 9
05 9
46 0
99
Tood
yay
RA
M 4
686
168
3 6
26 9
30 6
28 5
34 6
75 1
465
303
198
.60
854
.11
945
579
532
612
1 4
78 1
91
Tray
ning
RA
S 3
42 1
632
751
1 0
04 9
92 4
44 4
42 1
449
434
293
8.57
591
.80
1 0
38 9
30 4
42 2
06 1
481
136
Up
per
Gas
coyn
eR
TX 2
62 4
6 60
2 1
829
2 6
28 0
82 8
42 0
04 3
470
086
10
030.
85 4
60.3
6 2
686
799
932
929
3 6
19 7
28
Vic
toria
Par
kU
DM
37
682
18
160
772
664
342
599
1 1
15 2
63 2
0.50
#21
41.2
4 7
72 7
98 3
44 2
72 1
117
070
Vic
toria
Pla
ins
RA
S 9
21 2
563
809
408
722
515
475
924
197
443
.78
637
.18
445
887
512
847
958
734
Vin
cent
UD
M 3
6 69
2 1
1 1
44 7
52 3
64 3
64 0
99 1
116
463
20.
50 #
2528
.47
755
452
360
261
1 1
15 7
13
Wag
inR
AS
197
5 1
950
783
892
469
470
525
1 3
62 9
94 4
51.8
8 6
00.9
3 9
04 4
52 4
67 0
42 1
371
494
Wan
der
ing
RA
S 4
38 1
955
356
251
285
257
903
509
188
573
.71
724
.45
262
501
216
785
479
286
Wan
nero
oU
FV 1
78 4
38 6
88 1
286
3 6
58 8
45 2
466
379
6 1
25 2
24 2
0.50
#19
17.8
7 3
765
545
2 4
81 8
60 6
247
405
War
oona
RA
M 3
843
835
343
905
843
382
260
1 2
88 1
03 2
35.7
111
14.4
6 9
14 8
05 3
81 0
38 1
295
843
Wes
t A
rthu
rR
AS
887
285
0 8
58 4
03 0
06 4
90 5
78 8
93 5
84 4
54.3
5 5
71.7
7 4
20 2
24 4
87 7
91 9
08 0
15
Wes
toni
aR
AS
272
326
8 8
82 6
98 6
73 4
89 9
89 1
188
662
256
8.65
555
.54
721
832
485
930
1 2
07 7
62
Wic
kep
inR
AS
750
198
9 8
73 9
42 8
78 4
95 6
38 1
438
516
125
7.17
567
.74
976
324
492
818
1 4
69 1
42
Will
iam
sR
AS
928
229
5 4
74 1
14 6
10 3
51 5
30 4
66 1
40 1
23.5
0 7
41.6
2 1
23 2
19 2
93 9
57 4
17 1
76

189
Appendix D • Distribution to local governing bodies in 2014–15
Dis
trib
utio
n to
cou
ncils
for 2
014–
15 a
nd 2
015–
16 (c
ontin
ued)
Cou
nci
l nam
eC
lass
i-
fica
tion
Pop
ula
tion
aC
oun
cil
area
Roa
d
len
gth
2014
–15
actu
al e
nti
tlem
ent
2015
–16
esti
mat
ed e
nti
tlem
ent
Gen
eral
p
urp
ose
Loca
l roa
dTo
tal
Gen
eral
p
urp
ose
Min
Loca
l ro
adG
ener
al
pu
rpos
eLo
cal
road
Tota
l
No.
sq k
mkm
$$
$$
per
cap
ita
#$
per
km
$$
$
Wilu
naR
TM 1
279
184
000
192
2 1
594
677
823
827
2 4
18 5
04 1
246.
82 4
28.6
3 1
662
809
839
078
2 5
01 8
87
Won
gan-
Bal
lidu
RA
S 1
586
336
8 1
322
1 1
28 7
82 7
69 2
20 1
898
002
711
.72
581
.86
1 1
60 6
03 7
64 8
51 1
925
454
Woo
dan
illin
gR
AS
429
112
6 5
23 5
07 9
32 2
96 0
90 8
04 0
22 1
183.
99 5
66.1
4 5
18 7
84 2
94 4
74 8
13 2
58
Wya
lkat
chem
RA
S 5
19 1
743
724
974
003
427
365
1 4
01 3
68 1
876.
69 5
90.2
8 1
003
477
424
924
1 4
28 4
01
Wyn
dha
m-E
ast
Kim
ber
ley
RTL
865
2 1
21 1
89 1
125
2 7
59 7
91 1
285
895
4 0
45 6
86 3
18.9
811
43.0
2 2
789
722
1 1
18 1
89 3
907
911
Yalg
ooR
TS 4
45 3
3 25
8 1
133
1 6
94 8
87 5
56 8
36 2
251
723
380
8.73
491
.47
1 7
35 9
57 5
53 9
96 2
289
953
Yilg
arn
RA
S 1
698
30
720
271
3 7
10 2
10 1
139
635
1 8
49 8
45 4
18.2
6 4
20.0
6 7
62 4
62 1
133
767
1 8
96 2
29
York
RA
M 3
581
201
0 6
66 8
34 0
56 5
94 9
50 1
429
006
232
.91
893
.32
847
180
592
546
1 4
39 7
26
Sou
th A
ust
ralia
Ad
elai
de
UC
C 2
2 20
0 1
5 1
23 4
56 6
1823
8 22
8 6
94 8
46 2
0.57
#19
36.8
1 4
57 8
84 5
37 4
17 9
95 3
01
Ad
elai
de
Hill
sU
FM 3
9 83
2 7
92 1
088
827
529
696
892
1 5
24 4
21 2
0.78
640
.53
819
254
693
117
1 5
12 3
71
Ale
xand
rina
UFS
24
824
182
6 1
341
651
700
558
518
1 2
10 2
18 2
6.25
416
.49
654
959
562
352
1 2
17 3
11
AP
Y*
RTM
273
4 –
318
5 1
136
826
145
295
1 2
82 1
21 4
15.8
1 4
5.62
1 1
36 8
26 1
45 2
93 1
282
119
Bar
ossa
UFS
22
808
891
970
541
163
447
327
988
490
23.
73 4
61.1
6 5
43 8
69 4
46 8
49 9
90 7
18
Bar
unga
Wes
tR
AM
245
2 1
581
930
354
323
187
787
542
110
144
.50
201
.92
350
780
186
857
537
637
Ber
ri B
arm
era
RA
V 1
0 61
1 5
07 4
70 2
446
747
209
237
2 6
55 9
84 2
30.5
9 4
45.1
9 2
422
280
206
875
2 6
29 1
55
Bur
nsid
eU
DM
44
500
27
235
915
291
466
386
1 3
81 6
77 2
0.57
#19
84.6
2 9
02 7
32 4
64 6
15 1
367
347
Cam
pb
ellto
wn
UD
M 5
0 89
3 2
4 2
55 1
046
785
521
446
1 5
68 2
31 2
0.57
#20
44.8
9 1
036
122
520
478
1 5
56 6
00
Ced
una
RA
M 3
670
543
3 1
715
2 0
84 3
63 4
31 2
70 2
515
633
567
.95
251
.47
2 0
63 5
19 4
29 9
33 2
493
452
Cha
rles
Stu
rtU
DL
111
236
56
574
2 2
87 9
40 1
154
223
3 4
42 1
63 2
0.57
#20
10.8
4 2
274
569
1 1
57 0
22 3
431
591
Cla
re a
nd G
ilber
t Va
lleys
RA
L 8
994
188
6 1
827
553
958
377
504
931
462
61.
59 2
06.6
3 5
56 7
28 3
76 2
92 9
33 0
20
Cle
veR
AS
180
7 4
488
139
6 9
66 1
96 9
03 5
56 1
869
752
534
.70
647
.25
956
534
367
233
1 3
23 7
67
Coo
ber
Ped
yU
RS
178
7 7
8 4
21 8
21 0
67 4
4 73
7 8
65 8
04 4
59.4
7 1
06.2
6 8
12 8
56 4
4 76
6 8
57 6
22
Coo
rong
RA
L 5
586
886
3 1
893
2 4
52 8
33 1
065
776
3 5
18 6
09 4
39.1
0 5
63.0
1 2
428
304
643
454
3 0
71 7
58
Cop
per
Coa
stR
AV
13
687
776
948
1 4
89 3
95 3
08 1
77 1
797
572
108
.82
325
.08
1 4
59 6
07 3
09 5
97 1
769
204
Elli
ston
RA
S 1
068
667
9 1
148
743
818
398
932
1 1
42 7
50 6
96.4
6 3
47.5
0 7
36 3
80 3
97 7
90 1
134
170
Flin
der
s R
ange
sR
AS
164
9 4
106
126
2 1
225
235
1 3
51 5
54 2
576
789
743
.02
1070
.96
1 2
12 9
82 8
55 3
52 2
068
334
Fran
klin
Har
bou
rR
AS
124
1 3
278
935
1 0
53 3
85 2
32 5
59 1
285
944
848
.82
248
.73
1 0
42 8
51 2
26 5
10 1
269
361
Gaw
ler
UFS
21
590
41
190
1 1
76 9
07 8
94 6
29 2
071
536
54.
5147
08.5
7 1
165
138
299
046
1 4
64 1
84

190
Local Government National Report 2014–15
Dis
trib
utio
n to
cou
ncils
for 2
014–
15 a
nd 2
015–
16 (c
ontin
ued)
Cou
nci
l nam
eC
lass
i-
fica
tion
Pop
ula
tion
aC
oun
cil
area
Roa
d
len
gth
2014
–15
actu
al e
nti
tlem
ent
2015
–16
esti
mat
ed e
nti
tlem
ent
Gen
eral
p
urp
ose
Loca
l roa
dTo
tal
Gen
eral
p
urp
ose
Min
Loca
l ro
adG
ener
al
pu
rpos
eLo
cal
road
Tota
l
No.
sq k
mkm
$$
$$
per
cap
ita
#$
per
km
$$
$
Ger
ard
*R
TX 2
30–
– 4
4 36
7 1
9 35
9 6
3 72
6 1
92.9
0–
44
367
19
358
63
725
Goy
der
RA
M 4
239
668
8 3
248
2 7
06 8
62 6
58 5
46 3
365
408
638
.56
202
.75
2 6
79 7
93 6
55 5
14 3
335
307
Gra
ntR
AL
801
2 1
917
156
7 9
74 0
43 5
24 6
61 1
498
704
121
.57
334
.82
978
913
530
226
1 5
09 1
39
Hol
dfa
st B
ayU
DM
36
763
14
172
756
154
365
173
1 1
21 3
27 2
0.57
#21
23.1
0 7
46 7
81 3
64 0
49 1
110
830
Kan
garo
o Is
land
RA
M 4
553
443
4 1
362
1 4
33 6
71 3
86 4
23 1
820
094
314
.88
283
.72
1 4
40 8
39 3
85 2
19 1
826
058
Kar
oond
a-E
ast
Mur
ray
RA
S 1
016
440
9 1
299
1 2
27 3
40 1
130
122
2 3
57 4
62 1
208.
01 8
69.9
9 1
215
066
329
011
1 5
44 0
77
Kim
ba
RA
S 1
103
396
6 1
716
1 0
21 5
52 2
94 7
47 1
316
299
926
.16
171
.76
1 0
11 3
36 2
93 6
05 1
304
941
Kin
gsto
nR
AM
240
7 3
351
744
549
531
244
857
794
388
228
.31
329
.11
544
036
303
445
847
481
Ligh
tR
AV
14
459
127
3 1
457
297
397
401
940
699
337
20.
57 #
275
.87
295
597
402
101
697
698
Low
er E
yre
Pen
insu
laR
AM
499
7 4
755
134
4 4
74 8
81 4
00 3
46 8
75 2
27 9
5.03
297
.88
470
132
399
886
870
018
Loxt
on W
aike
rieR
AV
11
454
796
4 2
303
3 6
53 1
19 7
12 1
95 4
365
314
318
.94
309
.25
3 6
16 5
88 7
09 6
03 4
326
191
Mal
lala
RA
L 8
611
932
958
1 0
40 5
19 2
45 1
31 1
285
650
120
.84
255
.88
1 0
45 7
22 2
45 4
04 1
291
126
Mar
alin
ga*
RTX
75
––
92
701
51
983
144
684
123
6.01
– 9
2 70
1 5
1 98
2 1
44 6
83
Mar
ion
UD
L 8
7 57
4 5
6 4
73 1
801
253
927
945
2 7
29 1
98 2
0.57
#19
61.8
3 1
781
733
926
177
2 7
07 9
10
Mid
Mur
ray
RA
L 8
281
625
2 3
376
3 1
48 0
08 6
29 6
30 3
777
638
380
.15
186
.50
3 1
16 5
27 6
27 9
73 3
744
500
Mitc
ham
UD
M 6
5 72
0 7
5 4
00 1
351
752
737
114
2 0
88 8
66 2
0.57
#18
42.7
9 1
335
553
1 1
37 4
44 2
472
997
Mou
nt B
arke
rU
RM
31
325
593
772
673
448
1 5
35 5
27 2
208
975
21.
5019
89.0
2 6
66 7
13 5
40 7
81 1
207
494
Mou
nt G
amb
ier
UR
S 2
6 09
2 3
4 2
19 2
206
086
384
060
2 5
90 1
46 8
4.55
1753
.70
2 1
84 0
25 5
59 1
82 2
743
207
Mou
nt R
emar
kab
leR
AM
278
5 3
412
206
7 1
684
311
354
486
2 0
38 7
97 6
04.7
8 1
71.5
0 1
667
467
354
601
2 0
22 0
68
Mur
ray
Brid
geU
RS
20
579
182
4 9
74 3
158
146
461
017
3 6
19 1
63 1
53.4
6 4
73.3
2 3
137
772
860
700
3 9
98 4
72
Nar
acoo
rte
Luci
ndal
eR
AL
844
1 4
531
161
5 2
242
732
472
070
2 7
14 8
02 2
65.7
0 2
92.3
0 2
253
946
650
012
2 9
03 9
58
Nip
apan
ha*
RTX
94
––
28
460
19
275
47
735
302
.77
– 2
8 46
0 1
9 27
4 4
7 73
4
Nor
ther
n A
reas
RA
M 4
508
297
4 2
199
1 4
22 8
54 3
91 1
65 1
814
019
315
.63
177
.88
1 4
08 6
25 3
89 6
24 1
798
249
NP
SP
UD
M 3
6 86
8 1
5 1
60 7
58 3
14 3
55 0
44 1
113
358
20.
57 #
2219
.03
748
153
353
749
1 1
01 9
02
Onk
apar
inga
UFV
166
435
519
146
4 5
556
657
2 2
77 8
53 7
834
510
33.
3915
55.9
1 5
334
391
2 8
68 5
70 8
202
961
Orr
oroo
/Car
rieto
nR
AS
860
330
6 1
628
985
654
248
194
1 2
33 8
48 1
146.
11 1
52.4
5 9
75 7
97 2
47 2
59 1
223
056
OC
AR
TL 3
843
––
1 4
43 3
08–
1 4
43 3
08 3
75.5
7–
1 4
37 1
09–
1 4
37 1
09
Pet
erb
orou
ghR
AS
178
5 3
006
123
1 1
350
512
239
327
1 5
89 8
39 7
56.5
9 1
94.4
2 1
337
007
237
229
1 5
74 2
36
Pla
yfor
dU
FL 8
5 06
9 3
44 8
17 8
695
679
1 2
23 3
12 9
918
991
102
.22
1497
.32
8 6
08 7
23 1
230
251
9 8
38 9
74
Por
t A
del
aid
e E
nfiel
dU
DL
120
427
94
679
2 4
76 9
84 1
303
035
3 7
80 0
19 2
0.57
#19
19.0
5 2
466
097
1 9
32 6
23 4
398
720

191
Appendix D • Distribution to local governing bodies in 2014–15
Dis
trib
utio
n to
cou
ncils
for 2
014–
15 a
nd 2
015–
16 (c
ontin
ued)
Cou
nci
l nam
eC
lass
i-
fica
tion
Pop
ula
tion
aC
oun
cil
area
Roa
d
len
gth
2014
–15
actu
al e
nti
tlem
ent
2015
–16
esti
mat
ed e
nti
tlem
ent
Gen
eral
p
urp
ose
Loca
l roa
dTo
tal
Gen
eral
p
urp
ose
Min
Loca
l ro
adG
ener
al
pu
rpos
eLo
cal
road
Tota
l
No.
sq k
mkm
$$
$$
per
cap
ita
#$
per
km
$$
$
Por
t A
ugus
taU
RS
14
605
118
9 4
08 2
706
762
284
103
2 9
90 8
65 1
85.3
3 6
96.3
3 2
679
695
282
097
2 9
61 7
92
Por
t Li
ncol
nU
RS
14
732
32
158
1 1
01 4
84 2
20 9
29 1
322
413
74.
7713
98.2
8 1
090
469
221
678
1 3
12 1
47
Por
t P
irie
RA
V 1
7 62
5 1
783
117
5 3
999
210
419
581
4 4
18 7
91 2
26.9
1 3
57.0
9 3
959
218
454
384
4 4
13 6
02
Pro
spec
tU
DS
21
133
8 8
7 4
34 6
91 1
99 2
87 6
33 9
78 2
0.57
#22
90.6
6 4
28 7
64 1
98 6
28 6
27 3
92
Ren
mar
k P
arin
gaR
AL
934
6 9
00 4
79 2
578
187
212
955
2 7
91 1
42 2
75.8
6 4
44.5
8 2
552
405
211
024
2 7
63 4
29
Rob
eR
AS
138
7 1
098
435
29
770
105
080
134
850
21.
46 2
41.5
6 2
9 47
2 1
05 2
16 1
34 6
88
Rox
by
Dow
nsU
RS
503
1 1
09 3
9 1
03 4
79 7
7 94
3 1
81 4
22 2
0.57
#19
98.5
4 1
01 5
46 7
7 48
9 1
79 0
35
Sal
isb
ury
UD
V 1
35 9
22 1
59 8
03 6
429
986
1 5
03 9
36 7
933
922
47.
3118
72.9
0 6
301
386
1 5
15 7
92 7
817
178
Sou
ther
n M
alle
eR
AM
207
6 5
702
133
2 1
143
131
391
367
1 5
34 4
98 5
50.6
4 2
93.8
2 1
131
700
812
026
1 9
43 7
26
Str
eaky
Bay
RA
M 2
245
624
1 1
733
1 4
91 4
48 1
027
919
2 5
19 3
67 6
64.3
4 5
93.1
4 1
476
534
449
359
1 9
25 8
93
Tatia
raR
AL
669
5 6
525
193
2 2
393
409
1 1
46 6
99 3
540
108
357
.49
593
.53
2 4
05 3
76 9
04 1
23 3
309
499
Tea
Tree
Gul
lyU
DL
98
378
95
594
2 0
23 5
42 1
094
511
3 1
18 0
53 2
0.57
#18
42.6
1 1
989
244
1 1
86 6
69 3
175
913
Tum
by
Bay
RA
M 2
706
267
0 1
109
542
852
256
798
799
650
200
.61
231
.56
537
423
254
765
792
188
Unl
eyU
DM
38
695
14
165
795
910
369
644
1 1
65 5
54 2
0.57
#22
40.2
7 7
87 3
03 3
68 8
70 1
156
173
Vic
tor
Har
bor
UR
S 1
4 63
9 3
86 3
84 3
01 1
00 2
58 5
12 5
59 6
12 2
0.57
# 6
73.2
1 3
01 4
49 1
241
583
1 5
43 0
32
Wak
efiel
dR
AL
682
6 3
479
268
5 1
801
913
516
332
2 3
18 2
45 2
63.9
8 1
92.3
0 1
810
922
514
296
2 3
25 2
18
Wal
kerv
ille
UD
S 7
368
4 3
5 1
51 5
48 7
3 89
3 2
25 4
41 2
0.57
#21
11.2
3 1
49 3
52 7
3 57
5 2
22 9
27
Wat
tle R
ange
RA
V 1
1 66
9 3
946
244
1 1
914
827
525
854
2 4
40 6
81 1
64.1
0 2
15.4
3 1
924
401
521
924
2 4
46 3
25
Wes
t To
rren
sU
DM
58
158
37
290
1 1
96 2
14 5
94 4
07 1
790
621
20.
57 #
2049
.68
1 1
83 0
53 7
67 9
60 1
951
013
Why
alla
UR
S 2
2 56
2 1
072
280
3 9
23 9
60 3
84 6
40 4
308
600
173
.92
1373
.71
3 8
84 7
21 3
85 2
81 4
270
002
Wud
inna
RA
S 1
283
536
9 1
712
1 2
48 2
37 3
85 2
09 1
633
446
972
.90
225
.01
1 2
35 7
54 6
38 8
19 1
874
573
Yala
ta*
RTX
297
– 6
4 1
59 6
94 4
1 85
2 2
01 5
46 5
37.6
9 6
53.9
4 1
59 6
94 4
1 85
2 2
01 5
46
Yank
alill
aR
AM
455
6 7
57 5
43 1
26 0
27 1
47 1
33 2
73 1
60 2
7.66
270
.96
126
657
147
374
274
031
York
e P
enin
sula
RA
V 1
1 11
9 5
946
389
1 1
442
490
790
521
2 2
33 0
11 1
29.7
3 2
03.1
7 1
449
703
785
662
2 2
35 3
65
Tasm
ania
Bre
ak O
’Day
RA
L 6
430
352
1 5
47 1
183
727
1 4
42 0
56 2
625
783
184
.09
2636
.30
1 1
88 3
72 1
447
557
2 6
35 9
29
Brig
hton
UR
S 1
5 81
3 1
71 1
78 1
103
542
521
170
1 6
24 7
12 6
9.79
2927
.92
1 0
15 3
97 5
22 7
29 1
538
126
Bur
nie
UR
S 1
9 98
6 6
10 3
46 1
358
703
1 1
45 8
10 2
504
513
67.
9833
11.5
9 1
222
833
1 1
18 0
71 2
340
904
Cen
tral
Coa
stU
RS
22
347
931
666
2 1
04 9
24 1
869
617
3 9
74 5
41 9
4.19
2807
.23
2 0
44 3
65 1
823
057
3 8
67 4
22
Cen
tral
Hig
hlan
ds
RA
M 2
355
797
6 7
28 9
74 2
29 1
299
654
2 2
73 8
83 4
13.6
917
85.2
4 9
26 4
20 1
397
510
2 3
23 9
30

192
Local Government National Report 2014–15
Dis
trib
utio
n to
cou
ncils
for 2
014–
15 a
nd 2
015–
16 (c
ontin
ued)
Cou
nci
l nam
eC
lass
i-
fica
tion
Pop
ula
tion
aC
oun
cil
area
Roa
d
len
gth
2014
–15
actu
al e
nti
tlem
ent
2015
–16
esti
mat
ed e
nti
tlem
ent
Gen
eral
p
urp
ose
Loca
l roa
dTo
tal
Gen
eral
p
urp
ose
Min
Loca
l ro
adG
ener
al
pu
rpos
eLo
cal
road
Tota
l
No.
sq k
mkm
$$
$$
per
cap
ita
#$
per
km
$$
$
Circ
ular
Hea
dR
AL
828
7 4
891
770
1 2
03 6
05 1
770
661
2 9
74 2
66 1
45.2
422
99.5
6 1
254
129
1 7
98 4
22 3
052
551
Cla
renc
eU
FM 5
3 58
2 3
77 4
72 1
102
674
1 5
57 5
51 2
660
225
20.
58 #
3299
.90
1 0
87 9
29 1
422
260
2 5
10 1
89
Der
wen
t Va
lley
RA
L 9
886
410
3 3
30 1
170
080
786
670
1 9
56 7
50 1
18.3
623
83.8
5 1
173
378
817
419
1 9
90 7
97
Dev
onp
ort
UR
S 2
5 62
8 1
11 2
76 7
56 6
92 1
224
341
1 9
81 0
33 2
9.53
4436
.02
773
586
1 1
82 4
60 1
956
046
Dor
set
RA
L 7
158
322
3 7
39 1
763
794
1 7
37 4
67 3
501
261
246
.41
2351
.11
1 7
22 6
42 1
804
239
3 5
26 8
81
Flin
der
sR
AS
784
199
4 3
50 6
79 1
43 6
44 3
84 1
323
527
866
.25
1841
.10
617
671
690
991
1 3
08 6
62
Geo
rge
Tow
nR
AL
682
8 6
53 2
73 9
85 3
80 8
16 9
30 1
802
310
144
.31
2992
.42
971
262
794
773
1 7
66 0
35
Gla
mor
gan
- S
prin
g B
ayR
AM
443
7 2
587
351
426
255
856
855
1 2
83 1
10 9
6.07
2441
.18
383
630
880
253
1 2
63 8
83
Gle
norc
hyU
FM 4
5 53
7 1
21 3
24 9
37 1
15 1
414
832
2 3
51 9
47 2
0.58
#43
66.7
7 9
18 4
58 1
367
317
2 2
85 7
75
Hob
art
UC
C 5
0 47
3 7
8 3
10 1
038
694
1 6
80 4
62 2
719
156
20.
58 #
5420
.85
1 0
19 7
82 1
614
159
2 6
33 9
41
Huo
n Va
lley
RA
V 1
6 15
9 5
497
708
1 7
72 0
82 1
418
152
3 1
90 2
34 1
09.6
720
03.0
4 1
943
415
1 4
84 3
66 3
427
781
Ken
tish
RA
L 6
495
115
5 4
72 1
483
895
1 1
08 5
87 2
592
482
228
.47
2348
.70
1 4
61 4
61 1
110
071
2 5
71 5
32
Kin
g Is
land
RA
S 1
605
109
4 4
33 7
52 6
55 8
51 3
49 1
604
004
468
.94
1966
.16
720
227
922
678
1 6
42 9
05
Kin
gbor
ough
UFM
35
201
719
537
724
408
1 3
04 3
96 2
028
804
20.
58 #
2429
.04
713
032
1 3
21 4
59 2
034
491
Latr
obe
RA
V 1
0 65
5 6
00 2
85 6
87 9
71 7
25 7
98 1
413
769
64.
5725
46.6
6 7
04 1
11 7
33 7
68 1
437
879
Laun
cest
onU
RM
67
035
141
1 7
67 1
379
526
2 8
43 2
90 4
222
816
20.
58 #
3707
.03
1 3
51 1
34 2
776
711
4 1
27 8
45
Mea
nder
Val
ley
RA
V 1
9 54
3 3
320
855
2 1
48 3
32 2
127
363
4 2
75 6
95 1
09.9
324
88.1
4 2
098
320
2 0
30 3
97 4
128
717
Nor
ther
n M
idla
nds
RA
V 1
2 75
4 5
126
972
1 4
11 7
30 2
192
049
3 6
03 7
79 1
10.6
922
55.1
9 1
270
557
2 1
94 9
15 3
465
472
Sor
ell
RA
V 1
3 53
7 5
83 3
75 1
372
616
933
671
2 3
06 2
87 1
01.4
024
89.7
9 1
235
354
928
209
2 1
63 5
63
Sou
ther
n M
idla
nds
RA
L 6
271
261
1 8
03 1
805
201
1 4
35 2
06 3
240
407
287
.86
1787
.31
1 7
44 3
27 1
520
429
3 2
64 7
56
Tasm
anR
AM
236
3 6
59 1
96 4
49 8
80 4
65 5
42 9
15 4
22 1
90.3
923
75.2
1 4
28 7
13 4
75 7
99 9
04 5
12
War
atah
- W
ynya
rdR
AV
14
291
352
6 5
40 1
591
274
1 2
79 7
28 2
871
002
111
.35
2369
.87
1 4
95 1
30 1
276
329
2 7
71 4
59
Wes
t C
oast
RA
M 4
707
957
4 1
95 1
234
642
630
793
1 8
65 4
35 2
62.3
032
34.8
4 1
219
839
633
237
1 8
53 0
76
Wes
t Ta
mar
UFS
23
012
690
462
1 5
98 5
63 1
191
888
2 7
90 4
51 6
9.47
2579
.84
1 8
38 3
47 1
185
211
3 0
23 5
58
Nor
ther
n T
erri
tory
Alic
e S
prin
gsU
RS
28
945
327
245
765
212
958
075
1 7
23 2
87 2
6.44
3910
.51
735
178
924
573
1 6
59 7
51
Bar
kly*
RTL
811
9 3
22 6
93 4
98 1
734
505
272
263
2 0
06 7
68 2
13.6
4 5
46.7
1 1
770
097
423
864
2 1
93 9
61
Bel
yuen
*R
TX 2
15 4
2 8
4 2
6 33
8 3
3 28
2 5
9 62
0 1
22.5
0 3
96.2
1 2
3 66
8 3
2 15
1 5
5 81
9
Cen
tral
Des
ert*
RTL
441
7 2
82 0
90 1
775
886
243
863
035
1 7
49 2
78 2
00.6
4 4
86.2
2 9
88 1
97 8
31 4
30 1
819
627

193
Appendix D • Distribution to local governing bodies in 2014–15
Dis
trib
utio
n to
cou
ncils
for 2
014–
15 a
nd 2
015–
16 (c
ontin
ued)
Cou
nci
l nam
eC
lass
i-
fica
tion
Pop
ula
tion
aC
oun
cil
area
Roa
d
len
gth
2014
–15
actu
al e
nti
tlem
ent
2015
–16
esti
mat
ed e
nti
tlem
ent
Gen
eral
p
urp
ose
Loca
l roa
dTo
tal
Gen
eral
p
urp
ose
Min
Loca
l ro
adG
ener
al
pu
rpos
eLo
cal
road
Tota
l
No.
sq k
mkm
$$
$$
per
cap
ita
#$
per
km
$$
$
Coo
mal
ieR
TM 1
320
151
2 1
66 2
8 11
9 4
07 3
65 4
35 4
84 2
1.30
#24
54.0
1 2
7 34
8 4
03 4
36 4
30 7
84
Dar
win
UC
C 8
2 31
0 1
42 5
13 1
753
414
1 8
36 4
01 3
589
815
21.
30 #
3579
.73
1 7
35 1
04 1
778
053
3 5
13 1
57
Eas
t A
rnhe
m*
RTL
10
856
33
302
107
0 3
414
290
1 1
74 3
33 4
588
623
314
.51
1097
.51
3 3
02 0
05 1
134
399
4 4
36 4
04
Kat
herin
eU
RS
11
014
742
1 1
85 3
72 4
63 6
32 8
55 1
005
318
33.
8234
20.8
4 3
73 3
48 6
11 4
02 9
84 7
50
Litc
hfiel
dR
AV
21
547
307
2 7
44 4
59 0
06 2
544
349
3 0
03 3
55 2
1.30
#34
19.8
2 4
62 3
71 2
492
033
2 9
54 4
04
Mac
Don
nell*
RTL
697
4 2
68 7
84 1
564
1 8
41 8
67 9
94 6
91 2
836
558
264
.10
635
.99
1 7
98 0
31 9
61 8
39 2
759
870
Pal
mer
ston
UFS
32
339
56
230
688
903
792
067
1 4
80 9
70 2
1.30
#34
43.7
7 7
11 4
99 7
95 7
41 1
507
240
Rop
er G
ulf*
RTL
727
3 1
85 1
76 7
02 1
891
499
804
262
2 6
95 7
61 2
60.0
711
45.6
7 1
920
098
1 0
41 7
02 2
961
800
Tiw
i Isl
and
s*R
TM 3
118
750
1 8
45 4
16 8
05 9
75 4
67 1
392
272
133
.68
1154
.40
411
439
942
296
1 3
53 7
35
Trus
t A
ccou
ntZ
ZZ
––
211
9 –
1 4
20 4
05 1
420
405
– 6
70.3
2–
1 3
95 3
19 1
395
319
Vic
toria
– D
aly*
RTL
340
5 1
53 0
00 4
62 4
25 3
99 8
55 9
36 1
281
335
124
.93
1852
.68
449
763
688
257
1 1
38 0
20
Wag
ait
RTX
437
6 1
7 9
309
55
712
65
021
21.
30 #
3277
.18
9 0
18 5
3 81
8 6
2 83
6
Wes
t A
rnhe
m*
RTL
747
2 4
9 69
8 1
222
1 3
64 8
46 1
184
580
2 5
49 4
26 1
82.6
6 9
69.3
8 1
244
216
1 1
57 1
90 2
401
406
Wes
t D
aly*
RTL
3638
14 0
0051
649
5 09
667
2 40
41
167
500
136.
0913
03.1
150
2 96
380
9 32
71
312
290
Not
es:
a Po
pula
tion
estim
ates
as
at 3
1 D
ecem
ber 2
013.
* In
dige
nous
loca
l gov
erni
ng b
ody
APY =
Ana
ngu
Pitja
ntja
tjara
Yan
kuny
tjatja
raN
PSP
= N
orw
ood
Payn
eham
and
St P
eter
sOC
A =
Outb
ack
Com
mun
ities
Aut
horit
y#
= M
inim
um g
rant
n/a
= no
t app
licab
le

195
ERanking of local governing bodies in 2014–15
In this appendix, the grant per capita is used as the basis for comparing relative need for the general purpose grants. For local road grants, allocation of grants for each council is divided by their length of local roads to obtain a relative expenditure needs measure. In Tables E-1 to E-7, councils within a state are sorted on the value of the general purpose grant per capita and the local road grants per kilometre. For each council, the table gives the ranking obtained for both grants. The Australian Classification of Local Government (ACLG) category for each council is also provided (see Appendix F). For each state and the Northern Territory, the position of the average general purpose grant per capita and the average local road grant per kilometre are also shown within the ranking of councils. These state averages are taken from Tables E-1 and E-2.
Key to symbols used in Tables E-1 to E-7. See Appendix F for a full explanation.
RAL Rural Agricultural LargeRAM Rural Agricultural MediumRAS Rural Agricultural SmallRAV Rural Agricultural Very LargeRSG Rural Significant GrowthRTL Rural Remote LargeRTM Rural Remote MediumRTS Rural Remote SmallRTX Rural Remote Extra SmallUCC Urban Capital CityUDL Urban Developed LargeUDM Urban Developed MediumUDS Urban Developed SmallUDV Urban Developed Very LargeUFL Urban Fringe LargeUFM Urban Fringe MediumUFS Urban Fringe SmallUFV Urban Fringe Very LargeURL Urban Regional LargeURM Urban Regional MediumURS Urban Regional SmallURV Urban Regional Very Large

196
Local Government National Report 2014–15
Table E-1 New South Wales councils ranked by grant funding 2014–15
New South Wales councils ranked by funding per capita
New South Wales councils ranked by funding per kilometre
General purpose grant Local road grant
Rank Council nameClassi- fication $ per capita Rank Council name
Classi- fication $ per km
1 Central Darling RTM 1424.20 1 Sydney UCC 3958.52
2 Brewarrina RAS 1005.12 2 Waverley UDL 3751.05
3 Bourke RAM 995.94 3 Randwick UDV 3346.86
4 Carrathool RAM 989.94 4 Ashfield UDM 3250.86
5 Conargo RAS 961.17 5 Queanbeyan URM 3237.70
6 Urana RAS 936.40 6 Canterbury UDV 3230.08
7 Balranald RAM 871.74 7 North Sydney UDM 3212.22
8 Jerilderie RAS 856.26 8 Botany Bay UDM 3199.92
9 Lachlan RAL 685.85 9 Canada Bay UDL 3142.31
10 Lockhart RAM 667.54 10 Strathfield UDM 3127.31
11 Bogan RAM 662.66 11 Burwood UDM 3027.98
12 Cobar RTL 645.43 12 Woollahra UDM 3016.54
13 Bland RAL 638.45 13 Auburn UDL 3002.40
14 Hay RAM 628.64 14 Marrickville UDL 2996.35
15 Wakool RAM 555.80 15 Manly UDM 2972.27
16 Walgett RAL 554.43 16 Leichhardt UDM 2966.06
17 Tibooburra RTX 528.69 17 Rockdale UDL 2960.79
18 Silverton Village RTX 528.68 18 Parramatta UDV 2939.41
19 Warren RAM 499.76 19 Hurstville UDL 2885.20
20 Coonamble RAM 499.44 20 Kogarah UDM 2871.65
21 Wentworth RAL 497.66 21 Willoughby UDL 2859.40
22 Lord Howe Island RTX 485.62 22 Ryde UDL 2831.91
23 Bombala RAM 483.57 23 Bankstown UDV 2792.08
24 Coolamon RAM 459.43 24 Holroyd UDL 2790.33
25 Murrumbidgee RAM 448.40 25 Lane Cove UDM 2760.08
26 Narrandera RAL 432.58 26 Fairfield UDV 2712.91
27 Gwydir RAL 428.39 27 Mosman UDS 2695.66
28 Gilgandra RAM 427.62 28 Warringah UDV 2694.47
29 Warrumbungle RAL 403.91 29 Coffs Harbour URL 2572.97
30 Weddin RAM 400.10 30 Liverpool UFV 2507.49
31 Tumbarumba RAM 392.52 31 Blacktown UDV 2497.46
32 Tenterfield RAL 374.33 32 Albury URM 2495.19
33 Narromine RAL 372.84 33 Sutherland UDV 2480.05
34 Harden RAM 366.54 34 Campbelltown UFV 2468.31
35 Berrigan RAL 361.76 35 Wollongong URV 2450.78
36 Boorowa RAM 361.60 36 Pittwater UDM 2431.09

197
Appendix E • Ranking of local governing bodies in 2014–15
New South Wales councils ranked by grant funding 2014–15 (continued)
New South Wales councils ranked by funding per capita
New South Wales councils ranked by funding per kilometre
General purpose grant Local road grant
Rank Council nameClassi- fication $ per capita Rank Council name
Classi- fication $ per km
37 Murray RAL 339.77 37 Ku-ring-gai UDL 2427.89
38 Temora RAL 327.45 38 Tweed URL 2426.79
39 Gundagai RAM 325.24 39 Orange URM 2418.31
40 Walcha RAM 319.03 40 Hornsby UFV 2404.30
41 Forbes RAL 311.79 41 Hunters Hill UDS 2339.64
42 Upper Lachlan RAL 309.77 42 Newcastle URV 2325.58
43 Narrabri RAV 297.94 43 Broken Hill URS 2292.80
44 Greater Hume RAV 289.15 44 Shellharbour URM 2246.95
45 Snowy River RAL 287.47 45 Penrith UFV 2246.51
46 Junee RAL 283.89 46 Hills UFV 2245.86
47 Oberon RAL 279.41 47 Camden UFM 2198.56
48 Deniliquin URS 279.06 48 Gosford UFV 2152.28
49 Wellington RAL 274.35 49 Port Macquarie-Hastings
URL 2135.19
50 Corowa RAV 273.74 50 Wyong UFV 2093.63
51 Gloucester RAM 272.72 51 Lake Macquarie URV 2091.36
52 Moree Plains RAV 267.56 52 Ballina URM 2081.69
53 Cootamundra RAL 263.36 53 Byron URM 2071.42
54 Glen Innes Severn RAL 261.85 54 Kiama URS 2034.81
55 Liverpool Plains RAL 257.69 55 Maitland URL 1952.90
56 Cooma-Monaro RAV 250.25 56 Shoalhaven URL 1949.65
57 Guyra RAM 249.56 57 Blue Mountains UFL 1845.68
58 Leeton RAV 247.48 58 Hawkesbury UFM 1827.32
59 Kyogle RAL 244.29 59 Port Stephens URM 1826.96
60 Parkes RAV 240.40 60 Wollondilly UFM 1807.19
61 Cowra RAV 229.17 61 Cessnock URM 1771.82
62 Tumut RAV 221.80 62 Lismore URM 1718.19
63 Blayney RAL 219.61 63 Deniliquin URS 1708.74
64 Uralla RAL 215.18 64 Nambucca RAV 1700.72
65 Broken Hill URS 211.91 65 Great Lakes URM 1648.82
66 Inverell RAV 204.95 66 Wingecarribee URM 1645.36
67 Gunnedah RAV 203.98 67 Eurobodalla URM 1631.87
68 Bellingen RAV 194.01 68 Kempsey URS 1626.38
69 Young RAV 186.22 69 Bellingen RAV 1600.58
70 Cabonne RAV 181.77 70 Singleton URS 1581.33
71 Upper Hunter RAV 175.60 71 Bega Valley URM 1556.99
72 Lithgow URS 162.03 72 Bathurst Regional URM 1554.30
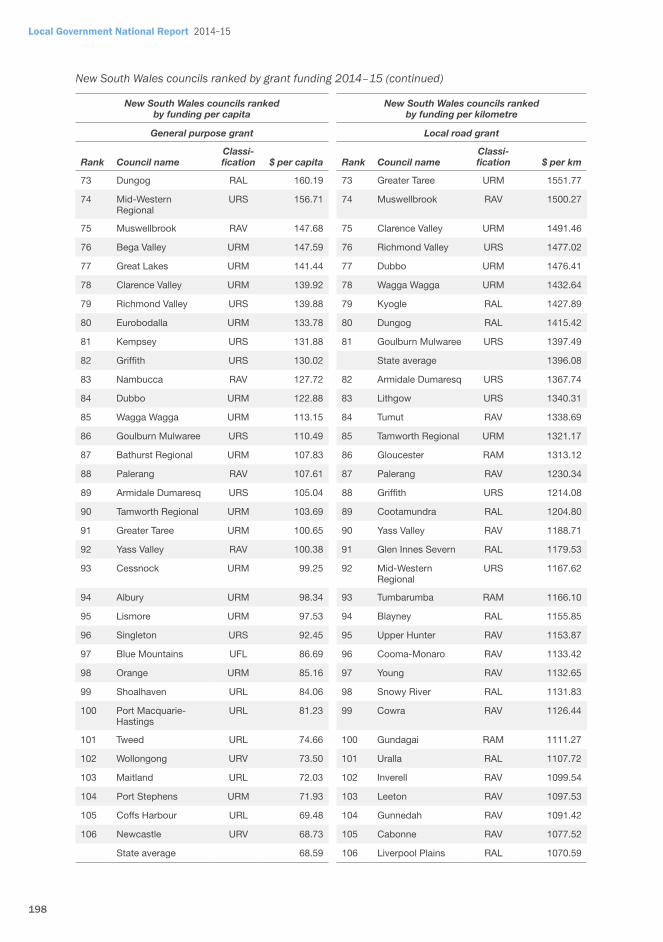
198
Local Government National Report 2014–15
New South Wales councils ranked by grant funding 2014–15 (continued)
New South Wales councils ranked by funding per capita
New South Wales councils ranked by funding per kilometre
General purpose grant Local road grant
Rank Council nameClassi- fication $ per capita Rank Council name
Classi- fication $ per km
73 Dungog RAL 160.19 73 Greater Taree URM 1551.77
74 Mid-Western Regional
URS 156.71 74 Muswellbrook RAV 1500.27
75 Muswellbrook RAV 147.68 75 Clarence Valley URM 1491.46
76 Bega Valley URM 147.59 76 Richmond Valley URS 1477.02
77 Great Lakes URM 141.44 77 Dubbo URM 1476.41
78 Clarence Valley URM 139.92 78 Wagga Wagga URM 1432.64
79 Richmond Valley URS 139.88 79 Kyogle RAL 1427.89
80 Eurobodalla URM 133.78 80 Dungog RAL 1415.42
81 Kempsey URS 131.88 81 Goulburn Mulwaree URS 1397.49
82 Griffith URS 130.02 State average 1396.08
83 Nambucca RAV 127.72 82 Armidale Dumaresq URS 1367.74
84 Dubbo URM 122.88 83 Lithgow URS 1340.31
85 Wagga Wagga URM 113.15 84 Tumut RAV 1338.69
86 Goulburn Mulwaree URS 110.49 85 Tamworth Regional URM 1321.17
87 Bathurst Regional URM 107.83 86 Gloucester RAM 1313.12
88 Palerang RAV 107.61 87 Palerang RAV 1230.34
89 Armidale Dumaresq URS 105.04 88 Griffith URS 1214.08
90 Tamworth Regional URM 103.69 89 Cootamundra RAL 1204.80
91 Greater Taree URM 100.65 90 Yass Valley RAV 1188.71
92 Yass Valley RAV 100.38 91 Glen Innes Severn RAL 1179.53
93 Cessnock URM 99.25 92 Mid-Western Regional
URS 1167.62
94 Albury URM 98.34 93 Tumbarumba RAM 1166.10
95 Lismore URM 97.53 94 Blayney RAL 1155.85
96 Singleton URS 92.45 95 Upper Hunter RAV 1153.87
97 Blue Mountains UFL 86.69 96 Cooma-Monaro RAV 1133.42
98 Orange URM 85.16 97 Young RAV 1132.65
99 Shoalhaven URL 84.06 98 Snowy River RAL 1131.83
100 Port Macquarie-Hastings
URL 81.23 99 Cowra RAV 1126.44
101 Tweed URL 74.66 100 Gundagai RAM 1111.27
102 Wollongong URV 73.50 101 Uralla RAL 1107.72
103 Maitland URL 72.03 102 Inverell RAV 1099.54
104 Port Stephens URM 71.93 103 Leeton RAV 1097.53
105 Coffs Harbour URL 69.48 104 Gunnedah RAV 1091.42
106 Newcastle URV 68.73 105 Cabonne RAV 1077.52
State average 68.59 106 Liverpool Plains RAL 1070.59

199
Appendix E • Ranking of local governing bodies in 2014–15
New South Wales councils ranked by grant funding 2014–15 (continued)
New South Wales councils ranked by funding per capita
New South Wales councils ranked by funding per kilometre
General purpose grant Local road grant
Rank Council nameClassi- fication $ per capita Rank Council name
Classi- fication $ per km
107 Wyong UFV 67.80 107 Greater Hume RAV 1069.19
108 Lake Macquarie URV 65.88 108 Tenterfield RAL 1068.89
109 Wingecarribee URM 59.16 109 Walcha RAM 1063.87
110 Ballina URM 59.06 110 Bombala RAM 1063.14
111 Shellharbour URM 57.74 111 Wakool RAM 1061.88
112 Campbelltown UFV 55.65 112 Corowa RAV 1061.78
113 Queanbeyan URM 48.84 113 Murray RAL 1056.90
114 Gosford UFV 48.01 114 Guyra RAM 1050.91
115 Blacktown UDV 47.75 115 Junee RAL 1047.20
116 Penrith UFV 47.12 116 Parkes RAV 1039.71
117 Wollondilly UFM 46.33 117 Harden RAM 1038.28
118 Byron URM 46.11 118 Wellington RAL 1037.62
119 Kiama URS 45.90 119 Forbes RAL 1031.34
120 Fairfield UDV 43.28 120 Oberon RAL 1028.65
121 Parramatta UDV 42.54 121 Upper Lachlan RAL 1022.30
122 Hawkesbury UFM 41.58 122 Moree Plains RAV 1021.66
123 Liverpool UFV 37.57 123 Narrabri RAV 1021.18
124 Auburn UDL 34.76 124 Berrigan RAL 1012.15
125 Camden UFM 32.78 125 Temora RAL 1009.98
126 Holroyd UDL 30.60 126 Walgett RAL 1009.76
127 Marrickville UDL 29.15 127 Warrumbungle RAL 1006.73
128 Canterbury UDV 28.66 128 Warren RAM 1005.79
129 Bankstown UDV 27.42 129 Gilgandra RAM 1004.81
130 Sydney UCC 21.32 130 Boorowa RAM 1001.22
131 Ashfield UDM 21.19 131 Lockhart RAM 1001.05
132 Hunters Hill UDS 20.58 132 Coonamble RAM 987.77
133 Woollahra UDM 20.58 133 Narromine RAL 986.20
134 Pittwater UDM 20.58 134 Gwydir RAL 985.35
135 Lane Cove UDM 20.58 135 Narrandera RAL 979.68
136 Kogarah UDM 20.58 136 Weddin RAM 975.30
137 Burwood UDM 20.58 137 Bogan RAM 973.32
138 Strathfield UDM 20.58 138 Wentworth RAL 969.15
139 Hurstville UDL 20.58 139 Murrumbidgee RAM 967.53
140 Botany Bay UDM 20.58 140 Hay RAM 966.27
141 Mosman UDS 20.58 141 Brewarrina RAS 954.64
142 North Sydney UDM 20.58 142 Urana RAS 953.19

200
Local Government National Report 2014–15
New South Wales councils ranked by grant funding 2014–15 (continued)
New South Wales councils ranked by funding per capita
New South Wales councils ranked by funding per kilometre
General purpose grant Local road grant
Rank Council nameClassi- fication $ per capita Rank Council name
Classi- fication $ per km
143 Waverley UDL 20.58 143 Coolamon RAM 951.05
144 Rockdale UDL 20.58 144 Cobar RTL 948.60
145 Manly UDM 20.58 145 Jerilderie RAS 947.04
146 Ryde UDL 20.58 146 Lachlan RAL 942.63
147 Leichhardt UDM 20.58 147 Bourke RAM 941.45
148 Willoughby UDL 20.58 148 Bland RAL 938.54
149 Canada Bay UDL 20.58 149 Conargo RAS 935.18
150 Hornsby UFV 20.58 150 Carrathool RAM 931.49
151 Randwick UDV 20.58 151 Balranald RAM 925.63
152 Ku-ring-gai UDL 20.58 152 Central Darling RTM 924.40
153 Warringah UDV 20.58 153 Tibooburra RTX –
154 Hills UFV 20.58 154 Silverton Village RTX –
155 Sutherland UFV 20.58 155 Lord Howe Island RTX –

201
Appendix E • Ranking of local governing bodies in 2014–15
Table E-2 Victorian councils ranked by grant funding 2014–15
Victorian councils ranked by funding per capita
Victorian councils ranked by funding per kilometre
General purpose grant Local road grant
Rank Council nameClassi- fication $ per capita Rank Council name
Classi- fication $ per km
1 West Wimmera RAM 666.18 1 Melbourne UCC 3232.48
2 Loddon RAL 577.97 2 Greater Dandenong UDV 2048.97
3 Buloke RAL 518.29 3 Warrnambool URM 2022.47
4 Hindmarsh RAL 441.97 4 Kingston UDV 1996.54
5 Pyrenees RAL 436.96 5 Yarra Ranges UFV 1968.34
6 Yarriambiack RAL 411.62 6 Port Phillip UDL 1852.06
7 Towong RAL 386.57 7 Yarra UDL 1818.73
8 Northern Grampians RAV 329.99 8 Brimbank UDV 1813.25
9 Gannawarra RAV 304.98 9 Hume UFV 1789.94
10 Strathbogie RAL 296.21 10 Wodonga URM 1766.75
11 Ararat RAV 281.76 11 Moreland UDV 1746.84
12 Southern Grampians RAV 237.91 12 Darebin UDV 1741.05
13 Corangamite RAV 232.77 13 Banyule UDV 1663.54
14 Moyne RAV 223.58 14 Cardinia UFL 1638.98
15 Mansfield RAL 221.29 15 South Gippsland URS 1630.13
16 East Gippsland URM 212.99 16 Melton UFV 1606.84
17 Moira URS 210.58 17 Hobsons Bay UDL 1599.10
18 Glenelg RAV 200.76 18 Moonee Valley UDL 1592.27
19 Murrindindi RAV 198.65 19 Whittlesea UFV 1570.46
20 Swan Hill URS 197.18 20 Colac Otway URS 1563.28
21 Central Goldfields RAV 196.81 21 Ballarat URL 1561.38
22 Alpine RAV 196.60 22 Stonnington UDL 1556.21
23 Campaspe URM 192.52 23 Maribyrnong UDL 1552.62
24 Hepburn RAV 190.52 24 Latrobe URL 1552.16
25 Horsham RAV 184.37 25 Maroondah UDL 1549.50
26 South Gippsland URS 183.54 26 Monash UDV 1542.12
27 Mildura URM 180.32 27 East Gippsland URM 1530.26
28 Wellington URM 179.43 28 Frankston UDV 1497.85
29 Indigo RAV 179.31 29 Wellington URM 1493.61
30 Benalla RAV 177.18 30 Greater Geelong URV 1484.83
31 Colac Otway URS 166.42 31 Wyndham UFV 1478.51
32 Golden Plains URS 161.06 32 Bass Coast URM 1455.63
33 Mount Alexander RAV 157.98 33 Bayside UDL 1445.80
34 Wangaratta URS 155.51 34 Knox UDV 1445.12
35 Bass Coast URM 134.98 35 Boroondara UDV 1444.78
36 Greater Shepparton URM 134.54 36 Nillumbik UFM 1436.69

202
Local Government National Report 2014–15
Victorian councils ranked by grant funding 2014–15 (continued)
Victorian councils ranked by funding per capita
Victorian councils ranked by funding per kilometre
General purpose grant Local road grant
Rank Council nameClassi- fication $ per capita Rank Council name
Classi- fication $ per km
37 Moorabool URM 129.77 37 Casey UDV 1428.31
38 Mitchell URM 125.93 38 Whitehorse UDV 1402.02
39 Baw Baw URM 125.53 39 Corangamite RAV 1376.21
40 Latrobe URL 120.88 40 Mornington Peninsula
UFV 1369.94
41 Greater Bendigo URL 111.14 41 Alpine RAV 1365.78
42 Macedon Ranges URM 104.26 42 Murrindindi RAV 1356.58
43 Wodonga URM 102.26 43 Glen Eira UDV 1354.90
44 Ballarat URL 100.45 44 Moyne RAV 1351.92
45 Melton UFV 89.29 45 Baw Baw URM 1311.01
46 Cardinia UFL 87.22 46 Surf Coast UFS 1297.65
47 Warrnambool URM 86.49 47 Manningham UDL 1276.95
48 Surf Coast UFS 78.85 48 Glenelg RAV 1210.13
49 Greater Geelong URV 73.31 49 Macedon Ranges URM 1203.52
50 Yarra Ranges UFV 71.51 50 Moorabool URM 1196.94
State average 68.53 51 Queenscliffe UFS 1196.37
51 Queenscliffe UFS 66.33 52 Wangaratta URS 1167.76
52 Wyndham UFV 64.65 53 Greater Shepparton URM 1166.85
53 Greater Dandenong UDV 63.63 54 Mansfield RAL 1152.80
54 Brimbank UDV 60.71 55 Mitchell URM 1147.03
55 Whittlesea UFV 59.41 56 Towong RAL 1135.36
56 Hume UFV 59.00 57 Golden Plains URS 1056.43
57 Frankston UDV 56.75 58 Greater Bendigo URL 1051.76
58 Casey UDV 55.52 59 Southern Grampians
RAV 1048.87
59 Knox UDV 42.29 60 Mount Alexander RAV 1047.60
60 Maroondah UDL 41.46 61 Indigo RAV 1045.90
61 Nillumbik UFM 35.36 62 Campaspe URM 1042.83
62 Moreland UDV 31.61 63 Benalla RAV 1034.92
63 Maribyrnong UDL 31.42 State average 1116.57
64 Banyule UDV 29.31 64 Moira URS 1010.17
65 Darebin UDV 27.58 65 Hepburn RAV 999.16
66 Mornington Peninsula
UFV 27.46 66 Pyrenees RAL 994.81
67 Port Phillip UDL 20.56 67 Ararat RAV 948.68
68 Moonee Valley UDL 20.56 68 Strathbogie RAL 936.54
69 Yarra UDL 20.56 69 Central Goldfields RAV 872.19
70 Whitehorse UDV 20.56 70 Gannawarra RAV 863.57

203
Appendix E • Ranking of local governing bodies in 2014–15
Victorian councils ranked by grant funding 2014–15 (continued)
Victorian councils ranked by funding per capita
Victorian councils ranked by funding per kilometre
General purpose grant Local road grant
Rank Council nameClassi- fication $ per capita Rank Council name
Classi- fication $ per km
71 Kingston UDV 20.56 71 West Wimmera RAM 790.44
72 Stonnington UDL 20.56 72 Northern Grampians
RAV 778.75
73 Monash UDV 20.56 73 Mildura URM 724.22
74 Glen Eira UDV 20.56 74 Loddon RAL 722.89
75 Bayside UDL 20.56 75 Horsham RAV 694.83
76 Melbourne UCC 20.56 76 Swan Hill URS 589.41
77 Hobsons Bay UDL 20.56 77 Hindmarsh RAL 486.87
78 Boroondara UDV 20.56 78 Buloke RAL 421.75
79 Manningham UDL 20.56 79 Yarriambiack RAL 392.88
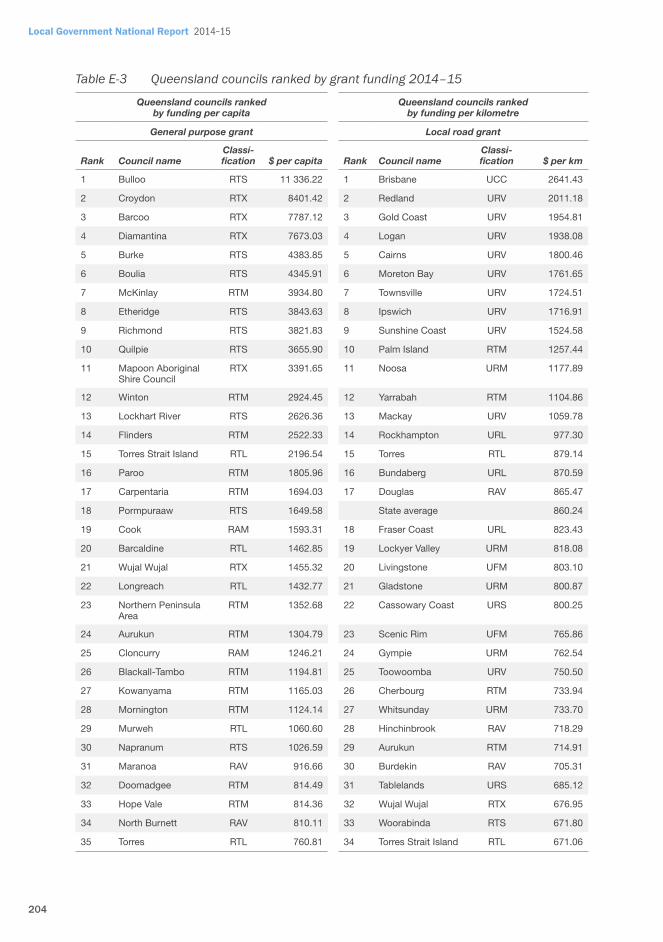
204
Local Government National Report 2014–15
Table E-3 Queensland councils ranked by grant funding 2014–15
Queensland councils ranked by funding per capita
Queensland councils ranked by funding per kilometre
General purpose grant Local road grant
Rank Council nameClassi- fication $ per capita Rank Council name
Classi- fication $ per km
1 Bulloo RTS 11 336.22 1 Brisbane UCC 2641.43
2 Croydon RTX 8401.42 2 Redland URV 2011.18
3 Barcoo RTX 7787.12 3 Gold Coast URV 1954.81
4 Diamantina RTX 7673.03 4 Logan URV 1938.08
5 Burke RTS 4383.85 5 Cairns URV 1800.46
6 Boulia RTS 4345.91 6 Moreton Bay URV 1761.65
7 McKinlay RTM 3934.80 7 Townsville URV 1724.51
8 Etheridge RTS 3843.63 8 Ipswich URV 1716.91
9 Richmond RTS 3821.83 9 Sunshine Coast URV 1524.58
10 Quilpie RTS 3655.90 10 Palm Island RTM 1257.44
11 Mapoon Aboriginal Shire Council
RTX 3391.65 11 Noosa URM 1177.89
12 Winton RTM 2924.45 12 Yarrabah RTM 1104.86
13 Lockhart River RTS 2626.36 13 Mackay URV 1059.78
14 Flinders RTM 2522.33 14 Rockhampton URL 977.30
15 Torres Strait Island RTL 2196.54 15 Torres RTL 879.14
16 Paroo RTM 1805.96 16 Bundaberg URL 870.59
17 Carpentaria RTM 1694.03 17 Douglas RAV 865.47
18 Pormpuraaw RTS 1649.58 State average 860.24
19 Cook RAM 1593.31 18 Fraser Coast URL 823.43
20 Barcaldine RTL 1462.85 19 Lockyer Valley URM 818.08
21 Wujal Wujal RTX 1455.32 20 Livingstone UFM 803.10
22 Longreach RTL 1432.77 21 Gladstone URM 800.87
23 Northern Peninsula Area
RTM 1352.68 22 Cassowary Coast URS 800.25
24 Aurukun RTM 1304.79 23 Scenic Rim UFM 765.86
25 Cloncurry RAM 1246.21 24 Gympie URM 762.54
26 Blackall-Tambo RTM 1194.81 25 Toowoomba URV 750.50
27 Kowanyama RTM 1165.03 26 Cherbourg RTM 733.94
28 Mornington RTM 1124.14 27 Whitsunday URM 733.70
29 Murweh RTL 1060.60 28 Hinchinbrook RAV 718.29
30 Napranum RTS 1026.59 29 Aurukun RTM 714.91
31 Maranoa RAV 916.66 30 Burdekin RAV 705.31
32 Doomadgee RTM 814.49 31 Tablelands URS 685.12
33 Hope Vale RTM 814.36 32 Wujal Wujal RTX 676.95
34 North Burnett RAV 810.11 33 Woorabinda RTS 671.80
35 Torres RTL 760.81 34 Torres Strait Island RTL 671.06

205
Appendix E • Ranking of local governing bodies in 2014–15
Queensland councils ranked by grant funding 2014–15 (continued)
Queensland councils ranked by funding per capita
Queensland councils ranked by funding per kilometre
General purpose grant Local road grant
Rank Council nameClassi- fication $ per capita Rank Council name
Classi- fication $ per km
36 Balonne RAM 690.51 35 Somerset UFS 669.67
37 Woorabinda RTS 454.30 36 Doomadgee RTM 669.33
38 Palm Island RTM 410.97 37 Southern Downs URM 663.19
39 Western Downs URM 408.18 38 Mount Isa URS 658.54
40 Goondiwindi RAV 390.70 39 South Burnett URM 645.45
41 Cherbourg RTM 387.82 40 Hope Vale RTM 639.46
42 Banana RAV 369.25 41 Mareeba URS 637.73
43 Charters Towers RAV 345.92 42 Mapoon Aboriginal Shire Council
RTX 627.23
44 Yarrabah RTM 291.50 43 Isaac URS 619.25
45 Mareeba URS 226.46 44 Northern Peninsula Area
RTM 614.94
46 Central Highlands URM 192.34 45 Central Highlands URM 610.87
47 Mount Isa URS 176.18 46 Napranum RTS 597.52
48 Tablelands URS 160.20 47 Mornington RTM 594.31
49 South Burnett URM 151.73 48 Goondiwindi RAV 587.54
50 Southern Downs URM 140.24 49 Western Downs URM 587.52
51 Burdekin RAV 136.25 50 Banana RAV 581.18
52 Hinchinbrook RAV 129.49 51 Kowanyama RTM 573.92
53 Isaac URS 125.15 52 Charters Towers RAV 573.31
54 Whitsunday URM 97.19 53 North Burnett RAV 567.02
55 Somerset UFS 93.49 54 Maranoa RAV 565.38
56 Douglas RAV 87.88 55 Cloncurry RAM 563.50
57 Gladstone URM 87.26 56 Balonne RAM 562.81
58 Lockyer Valley URM 77.87 57 Murweh RTL 558.70
59 Cassowary Coast URS 76.20 58 Cook RAM 557.91
60 Livingstone UFM 74.13 59 Lockhart River RTS 557.35
61 Gympie URM 71.85 60 Longreach RTL 555.36
State average 68.58 61 Pormpuraaw RTS 554.15
62 Toowoomba URV 63.51 62 Carpentaria RTM 554.08
63 Rockhampton URL 60.22 63 Blackall-Tambo RTM 553.90
64 Bundaberg URL 52.93 64 Barcaldine RTL 551.78
65 Scenic Rim UFM 43.44 65 Flinders RTM 550.29
66 Fraser Coast URL 43.02 66 Paroo RTM 549.41
67 Mackay URV 31.03 67 Burke RTS 548.84
68 Townsville URV 21.49 68 Richmond RTS 547.72
69 Noosa URM 20.57 69 Winton RTM 546.45
70 Brisbane UCC 20.57 70 McKinlay RTM 546.41

206
Local Government National Report 2014–15
Queensland councils ranked by funding per capita
Queensland councils ranked by funding per kilometre
General purpose grant Local road grant
Rank Council nameClassi- fication $ per capita Rank Council name
Classi- fication $ per km
71 Logan URV 20.57 71 Etheridge RTS 546.14
72 Ipswich URV 20.57 72 Quilpie RTS 545.70
73 Redland URV 20.57 73 Boulia RTS 544.56
74 Gold Coast URV 20.57 74 Croydon RTX 543.75
75 Moreton Bay URV 20.57 75 Diamantina RTX 543.31
76 Cairns URV 20.57 76 Barcoo RTX 542.93
77 Sunshine Coast URV 20.57 77 Bulloo RTS 542.81
Queensland councils ranked by grant funding 2014–15 (continued)

207
Appendix E • Ranking of local governing bodies in 2014–15
Table E-4 Western Australian councils ranked by grant funding 2014–15
Western Australian councils ranked by funding per capita
Western Australian councils ranked by funding per kilometre
General purpose grant Local road grant
Rank Council nameClassi- fication $ per capita Rank Council name
Classi- fication $ per km
1 Murchison RTX 20 030.36 1 Perth UCC 4465.43
2 Sandstone RTX 12 772.26 2 Bunbury URM 2636.22
3 Upper Gascoyne RTX 10 030.85 3 Vincent UDM 2528.47
4 Cue RTX 4124.49 4 Canning UDL 2383.52
5 Menzies RTS 4033.25 5 Subiaco UDS 2373.61
6 Nungarin RAS 3954.27 6 Narrogin (Town) URS 2299.57
7 Yalgoo RTS 3808.73 7 Belmont UDM 2294.31
8 Trayning RAS 2938.57 8 Bassendean UDS 2270.49
9 Mount Marshall RAS 2901.00 9 Peppermint Grove UDS 2233.89
10 Koorda RAS 2737.56 10 Fremantle UDS 2218.21
11 Westonia RAS 2568.65 11 Claremont UDS 2177.60
12 Mukinbudin RAS 2223.11 12 Cambridge UDS 2173.41
13 Ngaanyatjarraku RTM 2028.86 13 Cottesloe UDS 2162.68
14 Wyalkatchem RAS 1876.69 14 Roebourne URS 2159.43
15 Tammin RAS 1873.11 15 Gosnells UFL 2143.43
16 Mount Magnet RTS 1845.11 16 Victoria Park UDM 2141.24
17 Meekatharra RTM 1553.02 17 Bayswater UDM 2119.67
18 Shark Bay RTS 1538.42 18 Stirling UDV 2086.27
19 Carnamah RAS 1528.68 19 South Perth UDM 2074.28
20 Dumbleyung RAS 1491.84 20 Nedlands UDS 2063.79
21 Bruce Rock RAS 1476.64 21 Joondalup UDV 2051.26
22 Narembeen RAS 1421.55 22 Melville UDL 2020.18
23 Wickepin RAS 1257.17 23 Armadale UFM 1963.38
24 Wiluna RTM 1246.82 24 East Fremantle UDS 1949.92
25 Dowerin RAS 1218.70 25 Wanneroo UFV 1917.87
26 Woodanilling RAS 1183.99 26 Mosman Park UDS 1916.16
27 Laverton RTM 1135.21 27 Donnybrook-Balingup
RAL 1874.45
28 Perenjori RAS 1092.01 28 Rockingham UDL 1866.58
29 Morawa RAS 1083.55 29 Swan UFL 1852.88
30 Dalwallinu RAS 1072.03 30 Cockburn UDL 1846.12
31 Kellerberrin RAS 1043.49 31 Mandurah UFM 1823.55
32 Kent RAS 1008.16 32 Kwinana UFM 1802.44
33 Quairading RAS 996.48 33 Kalamunda UFM 1777.95
34 Kulin RAS 992.99 34 Nannup RAS 1773.07
35 Broomehill - Tambellup
RAS 971.36 35 Broome RTL 1648.73

208
Local Government National Report 2014–15
Western Australian councils ranked by funding per capita
Western Australian councils ranked by funding per kilometre
General purpose grant Local road grant
Rank Council nameClassi- fication $ per capita Rank Council name
Classi- fication $ per km
36 Dundas RTM 964.76 36 Dardanup RAV 1611.71
37 Corrigin RAS 947.77 37 Mundaring UFM 1569.32
38 Halls Creek RTL 869.13 38 Murray RAV 1528.32
39 Kondinin RAS 847.81 39 Exmouth RTM 1422.64
40 Three Springs RAS 780.28 40 Port Hedland RTL 1329.50
41 Coorow RAS 752.63 41 Kellerberrin RAS 1311.94
42 Wongan-Ballidu RAS 711.72 42 Busselton URM 1284.71
43 Lake Grace RAS 703.47 43 Harvey URS 1268.32
44 Pingelly RAS 670.56 44 Serpentine-Jarrahdale
RSG 1218.24
45 Cunderdin RAS 668.76 45 Manjimup RAL 1213.44
46 Narrogin RAS 648.78 46 Augusta-Margaret River
RAV 1210.29
47 Cuballing RAS 631.02 47 Kalgoorlie/Boulder URM 1197.84
48 Nannup RAS 629.14 48 Collie RAL 1191.55
49 Carnarvon RAL 599.46 49 Wyndham-East Kimberley
RTL 1143.02
50 Brookton RAS 594.87 50 Waroona RAM 1114.46
51 Cranbrook RAS 577.39 51 Capel RSG 1113.13
52 Wandering RAS 573.71 52 Albany URM 1097.44
53 Exmouth RTM 571.21 53 Northam RAV 1021.16
54 Mingenew RAS 552.94 54 Chittering RAM 1006.27
55 Jerramungup RAS 534.42 55 Boyup Brook RAS 989.93
56 Beverley RAS 516.15 56 Gingin RAM 961.92
57 Gnowangerup RAS 489.33 57 Bridgetown-Greenbushes
RAM 956.31
58 West Arthur RAS 454.35 58 Broomehill - Tambellup
RAS 945.27
59 Wagin RAS 451.88 59 Cranbrook RAS 938.43
60 Merredin RAM 444.87 60 Greater Geraldton URM 928.13
61 Victoria Plains RAS 443.78 61 Ngaanyatjarraku RTM 903.39
62 Derby-West Kimberley
RTL 423.95 62 York RAM 893.32
63 Ravensthorpe RAM 419.05 63 Toodyay RAM 854.11
64 Yilgarn RAS 418.26 State average 841.60
65 Goomalling RAS 364.92 64 Bruce Rock RAS 809.62
66 Kojonup RAM 357.59 65 Boddington RAM 749.18
67 Katanning RAM 331.59 66 Halls Creek RTL 749.10
68 Wyndham-East Kimberley
RTL 318.98 67 East Pilbara RTL 742.57
Western Australian councils ranked by grant funding 2014–15 (continued)

209
Appendix E • Ranking of local governing bodies in 2014–15
Western Australian councils ranked by grant funding 2014–15 (continued)
Western Australian councils ranked by funding per capita
Western Australian councils ranked by funding per kilometre
General purpose grant Local road grant
Rank Council nameClassi- fication $ per capita Rank Council name
Classi- fication $ per km
69 Ashburton RTL 308.41 68 Williams RAS 741.62
70 Moora RAM 299.41 69 Beverley RAS 738.09
71 Manjimup RAL 276.76 70 Carnarvon RAL 737.96
72 Boyup Brook RAS 268.23 71 Shark Bay RTS 735.38
73 Chapman Valley RAS 265.71 72 Irwin RAM 732.35
74 Bridgetown-Greenbushes
RAM 262.45 73 Wandering RAS 724.45
75 Narrogin (Town) URS 247.17 74 Moora RAM 717.19
76 Waroona RAM 235.71 75 Denmark RSG 708.18
77 East Pilbara RTL 235.70 76 Dandaragan RAM 706.93
78 Northampton RAM 233.63 77 Katanning RAM 698.35
79 York RAM 232.91 78 Mingenew RAS 679.02
80 Dandaragan RAM 222.25 79 Esperance RAV 648.43
81 Northam RAV 215.70 80 Northampton RAM 641.11
82 Leonora RTM 214.74 81 Three Springs RAS 639.29
83 Donnybrook-Balingup
RAL 209.35 82 Victoria Plains RAS 637.18
84 Toodyay RAM 198.60 83 Plantagenet RAM 635.46
85 Gingin RAM 165.59 84 Merredin RAM 633.00
86 Esperance RAV 144.20 85 Cunderdin RAS 629.85
87 Chittering RAM 138.95 86 Quairading RAS 629.58
88 Collie RAL 133.86 87 Brookton RAS 618.21
89 Plantagenet RAM 132.76 88 Dumbleyung RAS 617.45
90 Williams RAS 123.50 89 Pingelly RAS 607.41
91 Coolgardie RTL 121.50 90 Derby-West Kimberley
RTL 605.00
92 Broome RTL 118.48 91 Ashburton RTL 604.31
93 Denmark RSG 103.79 92 Coorow RAS 604.14
94 Port Hedland RTL 97.34 93 Corrigin RAS 603.69
95 Greater Geraldton URM 93.89 94 Wagin RAS 600.93
96 Boddington RAM 79.75 95 Carnamah RAS 600.47
97 Roebourne URS 76.66 96 Gnowangerup RAS 599.63
98 Irwin RAM 74.91 97 Goomalling RAS 597.64
99 Serpentine-Jarrahdale
RSG 74.29 98 Dundas RTM 595.50
State average 68.35 99 Trayning RAS 591.80
100 Murray RAV 65.31 100 Wyalkatchem RAS 590.28
101 Dardanup RAV 63.34 101 Coolgardie RTL 588.92

210
Local Government National Report 2014–15
Western Australian councils ranked by funding per capita
Western Australian councils ranked by funding per kilometre
General purpose grant Local road grant
Rank Council nameClassi- fication $ per capita Rank Council name
Classi- fication $ per km
102 Capel RSG 61.55 102 Wongan-Ballidu RAS 581.86
103 Harvey URS 60.81 103 Kojonup RAM 581.34
104 Albany URM 58.30 104 Ravensthorpe RAM 580.03
105 Mundaring UFM 45.26 105 Dalwallinu RAS 577.12
106 Armadale UFM 24.48 106 Cuballing RAS 574.20
107 Kalgoorlie/Boulder URM 23.07 107 Chapman Valley RAS 573.14
108 Peppermint Grove UDS 20.51 108 Nungarin RAS 572.96
109 East Fremantle UDS 20.50 109 West Arthur RAS 571.77
110 Cottesloe UDS 20.50 110 Tammin RAS 570.47
111 Claremont UDS 20.50 111 Koorda RAS 568.20
112 South Perth UDM 20.50 112 Wickepin RAS 567.74
113 Kwinana UFM 20.50 113 Perenjori RAS 566.95
114 Fremantle UDS 20.50 114 Woodanilling RAS 566.14
115 Augusta-Margaret River
RAV 20.50 115 Cue RTX 566.05
116 Canning UDL 20.50 116 Narrogin RAS 563.38
117 Bayswater UDM 20.50 117 Mukinbudin RAS 563.19
118 Victoria Park UDM 20.50 118 Kulin RAS 558.85
119 Wanneroo UFV 20.50 119 Morawa RAS 557.07
120 Joondalup UDV 20.50 120 Dowerin RAS 556.46
121 Rockingham UDL 20.50 121 Westonia RAS 555.54
122 Belmont UDM 20.50 122 Jerramungup RAS 546.64
123 Cockburn UDL 20.50 123 Narembeen RAS 545.94
124 Mandurah UFM 20.50 124 Lake Grace RAS 541.20
125 Stirling UDV 20.50 125 Kondinin RAS 540.38
126 Vincent UDM 20.50 126 Kent RAS 519.13
127 Subiaco UDS 20.50 127 Mount Magnet RTS 518.02
128 Gosnells UFL 20.50 128 Yalgoo RTS 491.47
129 Swan UFL 20.50 129 Mount Marshall RAS 485.43
130 Melville UDL 20.50 130 Leonora RTM 485.15
131 Nedlands UDS 20.50 131 Sandstone RTX 461.43
132 Busselton URM 20.50 132 Upper Gascoyne RTX 460.36
133 Cambridge UDS 20.50 133 Meekatharra RTM 443.18
134 Kalamunda UFM 20.50 134 Murchison RTX 439.12
135 Mosman Park UDS 20.50 135 Wiluna RTM 428.63
136 Bunbury URM 20.50 136 Yilgarn RAS 420.06
137 Perth UCC 20.50 137 Menzies RTS 363.63
138 Bassendean UDS 20.50 138 Laverton RTM 215.50
Western Australian councils ranked by grant funding 2014–15 (continued)

211
Appendix E • Ranking of local governing bodies in 2014–15
Table E-5 South Australian councils ranked by grant funding 2014–15
South Australian councils ranked by funding per capita
South Australian councils ranked by funding per kilometre
General purpose grant Local road grant
Rank Council nameClassi- fication $ per capita Rank Council name
Classi- fication $ per km
1 Maralinga RTX 1236.01 1 Gawler UFS 4708.57
2 Karoonda-East Murray
RAS 1208.01 2 Prospect UDS 2290.66
3 Orroroo/Carrieton RAS 1146.11 3 Unley UDM 2240.27
4 Wudinna RAS 972.90 4 Norwood Payneham and St Peters
UDM 2219.03
5 Kimba RAS 926.16 5 Holdfast Bay UDM 2123.10
6 Franklin Harbour RAS 848.82 6 Walkerville UDS 2111.23
7 Peterborough RAS 756.59 7 West Torrens UDM 2049.68
8 Flinders Ranges RAS 743.02 8 Campbelltown UDM 2044.89
9 Elliston RAS 696.46 9 Charles Sturt UDL 2010.84
10 Streaky Bay RAM 664.34 10 Roxby Downs URS 1998.54
11 Goyder RAM 638.56 11 Mount Barker URM 1989.02
12 Mount Remarkable RAM 604.78 12 Burnside UDM 1984.62
13 Ceduna RAM 567.95 13 Marion UDL 1961.83
14 Southern Mallee RAM 550.64 14 Adelaide UCC 1936.81
15 Yalata RTX 537.69 15 Port Adelaide Enfield
UDL 1919.05
16 Cleve RAS 534.70 16 Salisbury UDV 1872.90
17 Coober Pedy URS 459.47 17 Mitcham UDM 1842.79
18 Coorong RAL 439.10 18 Tea Tree Gully UDL 1842.61
19 Anangu Pitjantjatjara RTM 415.81 19 Mount Gambier URS 1753.70
20 Mid Murray RAL 380.15 20 Onkaparinga UFV 1555.91
21 Outback Communities Authority
RTL 375.57 21 Playford UFL 1497.32
22 Tatiara RAL 357.49 22 Port Lincoln URS 1398.28
23 Loxton Waikerie RAV 318.94 23 Whyalla URS 1373.71
24 Northern Areas RAM 315.63 24 Flinders Ranges RAS 1070.96
25 Kangaroo Island RAM 314.88 25 Karoonda-East Murray
RAS 869.99
26 Nipapanha RTX 302.77 26 Port Augusta URS 696.33
27 Renmark Paringa RAL 275.86 27 Victor Harbor URS 673.21
28 Naracoorte Lucindale
RAL 265.70 28 Yalata RTX 653.94
29 Wakefield RAL 263.98 29 Cleve RAS 647.25
30 Berri Barmera RAV 230.59 30 Adelaide Hills UFM 640.53
31 Kingston RAM 228.31 31 Tatiara RAL 593.53
32 Port Pirie RAV 226.91 32 Streaky Bay RAM 593.14

212
Local Government National Report 2014–15
South Australian councils ranked by funding per capita
South Australian councils ranked by funding per kilometre
General purpose grant Local road grant
Rank Council nameClassi- fication $ per capita Rank Council name
Classi- fication $ per km
33 Tumby Bay RAM 200.61 33 Coorong RAL 563.01
34 Gerard RTX 192.90 State average 496.09
35 Port Augusta URS 185.33 34 Murray Bridge URS 473.32
36 Whyalla URS 173.92 35 Barossa UFS 461.16
37 Wattle Range RAV 164.10 36 Berri Barmera RAV 445.19
38 Murray Bridge URS 153.46 37 Renmark Paringa RAL 444.58
39 Barunga West RAM 144.50 38 Alexandrina UFS 416.49
40 Yorke Peninsula RAV 129.73 39 Port Pirie RAV 357.09
41 Grant RAL 121.57 40 Elliston RAS 347.50
42 Mallala RAL 120.84 41 Grant RAL 334.82
43 Copper Coast RAV 108.82 42 Kingston RAM 329.11
44 Playford UFL 102.22 43 Copper Coast RAV 325.08
45 Lower Eyre Peninsula
RAM 95.03 44 Loxton Waikerie RAV 309.25
46 Mount Gambier URS 84.55 45 Lower Eyre Peninsula
RAM 297.88
47 Port Lincoln URS 74.77 46 Southern Mallee RAM 293.82
State average 68.55 47 Southern Mallee RAM 294.58
48 Clare and Gilbert Valleys
RAL 61.59 48 Naracoorte Lucindale
RAL 292.30
49 Gawler UFS 54.51 49 Kangaroo Island RAM 283.72
50 Salisbury UDV 47.31 50 Light RAV 275.87
51 Onkaparinga UFV 33.39 51 Yankalilla RAM 270.96
52 Yankalilla RAM 27.66 52 Mallala RAL 255.88
53 Alexandrina UFS 26.25 53 Ceduna RAM 251.47
54 Barossa UFS 23.73 54 Franklin Harbour RAS 248.73
55 Mount Barker URM 21.50 55 Robe RAS 241.56
56 Robe RAS 21.46 56 Tumby Bay RAM 231.56
57 Adelaide Hills UFM 20.78 57 Wudinna RAS 225.01
58 Prospect UDS 20.57 58 Wattle Range RAV 215.43
59 Tea Tree Gully UDL 20.57 59 Clare and Gilbert Valleys
RAL 206.63
60 Unley UDM 20.57 60 Yorke Peninsula RAV 203.17
61 Walkerville UDS 20.57 61 Goyder RAM 202.75
62 Adelaide UCC 20.57 62 Barunga West RAM 201.92
63 Marion UDL 20.57 63 Peterborough RAS 194.42
64 Norwood Payneham and St Peters
UDM 20.57 64 Wakefield RAL 192.30
65 Mitcham UDM 20.57 65 Mid Murray RAL 186.50
South Australian councils ranked by grant funding 2014–15 (continued)

213
Appendix E • Ranking of local governing bodies in 2014–15
South Australian councils ranked by funding per capita
South Australian councils ranked by funding per kilometre
General purpose grant Local road grant
Rank Council nameClassi- fication $ per capita Rank Council name
Classi- fication $ per km
66 Campbelltown UDM 20.57 66 Northern Areas RAM 177.88
67 West Torrens UDM 20.57 67 Kimba RAS 171.76
68 Victor Harbor URS 20.57 68 Mount Remarkable RAM 171.50
69 Port Adelaide Enfield UDL 20.57 69 Orroroo/Carrieton RAS 152.45
70 Holdfast Bay UDM 20.57 70 Coober Pedy URS 106.26
71 Charles Sturt UDL 20.57 71 Maralinga RTX –
72 Burnside UDM 20.57 72 Outback Communities Authority
RTL –
73 Light RAV 20.57 73 Nipapanha RTX –
74 Roxby Downs URS 20.57 74 Gerard RTX –
South Australian councils ranked by grant funding 2014–15 (continued)

214
Local Government National Report 2014–15
Table E-6 Tasmanian councils ranked by grant funding 2014–15
Tasmanian councils ranked by funding per capita
Tasmanian councils ranked by funding per kilometre
General purpose grant Local road grant
Rank Council nameClassi- fication $ per capita Rank Council name
Classi- fication $ per km
1 Flinders RAS 866.25 1 Hobart UCC 5420.85
2 King Island RAS 468.94 2 Devonport URS 4436.02
3 Central Highlands RAM 413.69 3 Glenorchy UFM 4366.77
4 Southern Midlands RAL 287.86 4 Launceston URM 3707.03
5 West Coast RAM 262.30 5 Burnie URS 3311.59
6 Dorset RAL 246.41 6 Clarence UFM 3299.90
7 Kentish RAL 228.47 7 West Coast RAM 3234.84
8 Tasman RAM 190.39 8 George Town RAL 2992.42
9 Break O’Day RAL 184.09 9 Brighton URS 2927.92
10 Circular Head RAL 145.24 10 Central Coast URS 2807.23
11 George Town RAL 144.31 11 Break O’Day RAL 2636.30
12 Derwent Valley RAL 118.36 State average 2614.04
13 Waratah - Wynyard RAV 111.35 12 West Tamar UFS 2579.84
14 Northern Midlands RAV 110.69 13 Latrobe RAV 2546.66
15 Meander Valley RAV 109.93 14 Sorell RAV 2489.79
16 Huon Valley RAV 109.67 15 Meander Valley RAV 2488.14
17 Sorell RAV 101.40 16 Glamorgan - Spring Bay
RAM 2441.18
18 Glamorgan - Spring Bay
RAM 96.07 17 Kingborough UFM 2429.04
19 Central Coast URS 94.19 18 Derwent Valley RAL 2383.85
20 Brighton URS 69.79 19 Tasman RAM 2375.21
21 West Tamar UFS 69.47 20 Waratah - Wynyard RAV 2369.87
State average 68.60 21 Dorset RAL 2351.11
22 Burnie URS 67.98 22 Kentish RAL 2348.70
23 Latrobe RAV 64.57 23 Circular Head RAL 2299.56
24 Devonport URS 29.53 24 Northern Midlands RAV 2255.19
25 Hobart UCC 20.58 25 Huon Valley RAV 2003.04
26 Glenorchy UFM 20.58 26 King Island RAS 1966.16
27 Launceston URM 20.58 27 Flinders RAS 1841.10
28 Kingborough UFM 20.58 28 Southern Midlands RAL 1787.31
29 Clarence UFM 20.58 29 Central Highlands RAM 1785.24

215
Appendix E • Ranking of local governing bodies in 2014–15
Table E-7 Northern Territory councils ranked by grant funding 2014–15
Northern Territory councils ranked by funding per capita
Northern Territory councils ranked by funding per kilometre
General purpose grant Local road grant
Rank Council nameClassi- fication $ per capita Rank Council name
Classi- fication $ per km
1 East Arnhem RTL 314.51 1 Alice Springs URS 3910.51
2 MacDonnell RTL 264.10 2 Darwin UCC 3579.73
3 Roper Gulf RTL 260.07 3 Palmerston UFS 3443.77
4 Barkly RTL 213.64 4 Katherine URS 3420.84
5 Central Desert RTL 200.64 5 Litchfield RAV 3419.82
6 West Arnhem RTL 182.66 6 Wagait RTX 3277.18
7 West Daly RTL 136.09 7 Coomalie RTM 2454.01
8 Tiwi Islands RTM 133.68 8 Victoria – Daly RTL 1852.68
9 Victoria - Daly RTL 124.93 9 West Daly RTL 1303.11
10 Belyuen RTX 122.50 State average 1271.71
State average 71.01 10 Tiwi Islands RTM 1154.40
11 Katherine URS 33.82 11 Roper Gulf RTL 1145.67
12 Alice Springs URS 26.44 12 East Arnhem RTL 1097.51
13 Darwin UCC 21.30 13 West Arnhem RTL 969.38
14 Litchfield RAV 21.30 14 Trust Account ZZZ 670.32
15 Palmerston UFS 21.30 15 MacDonnell RTL 635.99
16 Coomalie RTM 21.30 16 Barkly RTL 546.71
17 Wagait RTX 21.30 17 Central Desert RTL 486.22
18 Trust Account ZZZ – 18 Belyuen RTX 396.21


217
FAustralian Classification of Local Governments
The Australian Classification of Local Governments (ACLG) was first published in September 1994. The ACLG categorises local governing bodies across Australia using the population, the population density and the proportion of the population that is classified as urban for the council.
The local governing bodies included in the classification system are those that receive funding under the Financial Assistance Grant programme as defined under the Local Government (Financial Assistance) Act 1995 (Cth) (the Act). Therefore, bodies declared by the Australian Government Minister on the advice of the state minister to be local governing bodies for the purposes of the Act, are included in the ACLG. These include community councils. However, county councils, voluntary regional organisations of councils and the Australian Capital Territory are excluded.
The classification system generally involves three steps. Each step allocates a prefix formed from letters of the alphabet to develop a three-letter identifier for each class of local government. There are a total of 22 categories. For example, a medium-sized council in a rural agricultural area would be classified as RAM—rural, agricultural, medium. If it were remote, however, it would be classified as RTM—rural, remote, medium. Table F-1 provides information on the structure of the classification system.
Notwithstanding the capacity of the ACLG system to group like councils, it should be noted that there remains considerable scope for divergence within these categories, and for this reason the figures in Appendix D should be taken as a starting point for enquiring into grant outcomes. This divergence can occur because of factors including isolation, population distribution, local economic performance, daily or seasonal population changes, the age profile of the population and geographic differences. The allocation of the general purpose grant between states on an equal per capita basis and the local road grant on a fixed shares basis can also cause divergence.
To ensure the ACLG is kept up to date, at the end of each financial year local government grants commissions advise of any changes in the classification of councils in their state.
Table F-2 provides details of the number of local governing bodies at July 2014, by ACLG category and by state. There were no changes to the ACLG reported for local governing bodies in 2014–15.

218
Local Government National Report 2014–15
Table F-1 Structure of the classification system
Step 1 Step 2 Step 3 Identifiers Category
URBAN (U)
Population more than 20 000
OR
If population less than 20 000,
EITHER
Population density more than 30 persons per square kilometre
OR
90 per cent or more of the local governing body population is urban
CAPITAL CITY (CC) Not applicable UCC
METROPOLITAN DEVELOPED (D) Part of an urban centre of more than 1 000 000 or population density more than 600 per square kilometre
SMALL MEDIUM LARGE (L) VERY LARGE (V)
up to 30 000 30 001–70 000
70 001–120 000 more than 120 000
UDS UDM UDL UDV
REGIONAL TOWNS/CITY (R) Part of an urban centre with population less than 1 000 000 and predominantly urban in nature
SMALL MEDIUM LARGE (L) VERY LARGE (V)
up to 30 000 30 001–70 000
70 001–120 000 more than 120 000
URS URM URL URV
FRINGE (F) A developing LGA on the margin of a developed or regional urban centre
SMALL MEDIUM LARGE (L) VERY LARGE (V)
up to 30 000 30 001–70 000
70 001–120 000 more than 120 000
UFS UFM UFL UFV
RURAL (R)
A local governing body with population less than 20,000
AND
Population density less than 30 persons per square kilometre
AND
Less than 90 per cent of local governing body population is urban
SIGNIFICANT GROWTH (SG) Average annual population growth more than three per cent, population more than 5000 and not remote
Not applicable RSG
AGRICULTURAL (A) SMALL MEDIUM LARGE (L) VERY LARGE (V)
up to 2000 2001–5000
5001–10 000 10 001–20 000
RAS RAM RAL RAV
REMOTE EXTRA SMALL (X) SMALL MEDIUM LARGE (L)
up to 400 401–1000
1001–3000 3001–20 000
RTX RTS RTM RTL

219
Appendix F • Australian Classification of Local Governments
Table F-2 Categories of local governments by state at July 2014
StateACLG categories NSW VIC QLD WA SA TAS NT* Australia
Urban Capital City (UCC) 1 1 1 1 1 1 1 7
Urban Development Small (UDS) 2 0 0 10 2 0 0 14
Urban Development Medium (UDM) 11 0 0 5 7 0 0 23
Urban Development Large (UDL) 10 9 0 4 4 0 0 27
Urban Development Very Large (UDV) 8 13 0 2 1 0 0 24
Urban Regional Small (URS) 11 6 5 3 8 4 2 39
Urban Regional Medium (URM) 19 12 9 5 1 1 0 47
Urban Regional Large (URL) 5 3 3 0 0 0 0 11
Urban Regional Very Large (URV) 3 1 10 0 0 0 0 14
Urban Fringe Small (UFS) 0 2 1 0 3 1 1 8
Urban Fringe Medium (UFM) 3 1 2 5 1 3 0 15
Urban Fringe Large (UFL) 1 1 0 2 1 0 0 5
Urban Fringe Very Large (UFV) 7 6 0 1 1 0 0 15
Rural Significant Growth (RSG) 0 0 0 3 0 0 0 3
Rural Agricultural Small (RAS) 4 0 0 49 10 2 0 65
Rural Agricultural Medium (RAM) 21 1 3 16 12 4 0 57
Rural Agricultural Large (RAL) 25 8 0 4 9 7 0 53
Rural Agricultural Very Large (RAV) 19 15 8 5 7 6 1 61
Rural Remote Extra Small (RTX) 3 0 5 4 4 0 2 18
Rural Remote Small (RTS) 0 0 10 4 0 0 0 14
Rural Remote Medium (RTM) 1 0 15 7 1 0 2 26
Rural Remote Large (RTL) 1 0 5 8 1 0 8 23
Total 155 79 77 138 74 29 17 569
Note: * NT total excludes Road Trust Account

221
Index of local governments
A Adelaide 189, 211, 212Adelaide Hills 189, 211, 212Albany 184, 208, 210Albury 174, 196, 198Alexandrina 189, 212Alice Springs 146, 149, 192, 215Alpine 71, 179, 201, 202Anangu Pitjantjatjara Yankunytjatjara 43, 123, 131, 189,
193, 211Ararat 179, 201, 202Armadale 184, 207, 210Armidale Dumaresq 174, 198Ashburton 184, 209Ashfield 59, 174, 196, 199Auburn 174, 196, 199Augusta-Margaret River 184, 208, 210Aurukun 181, 204
B Ballarat 71, 179, 201, 202Ballina 174, 197, 199Balonne 181, 205Balranald 59, 174, 196, 200Banana 182, 205Bankstown 59, 174, 196, 199Banyule 32, 71, 179, 201, 202Barcaldine 182, 204, 205Barcoo 182, 204, 206Barkly 146, 149, 192, 215Barossa 189, 212Barunga West 189, 212Bass Coast 71, 179, 201Bassendean 184, 207, 2010Bathurst Regional 174, 197, 198Baw Baw 179, 202Bayside 70, 179, 201, 203Bayswater 184, 207, 210Bega Valley 174, 197, 198Bellingen 174, 197Belmont 184, 207, 210Belyuen 149, 192, 215Benalla 71, 179, 201, 202Berri Barmera 189, 211, 212 Berrigan 174, 196, 199Beverley 184, 208, 209Blackall Tambo 182, 204, 205Blacktown 59, 174, 196, 199Bland 174, 196, 200Blayney 174, 197, 198Blue Mountains 174, 197, 198Boddington 184, 208, 209Bogan 174, 196, 199Bombala 174, 196, 199
Boorowa 174, 196, 199Boroondara 70, 83, 84, 179, 201, 203Botany Bay 174, 196, 199Boulia 182, 204, 206Bourke 59, 174, 196, 200Boyup Brook 184, 208, 209Break O'Day 191, 214Brewarrina 59, 174, 196, 199Bridgetown-Greenbushes 185, 208, 209Brighton 191, 214Brimbank 83, 179, 201, 202Brisbane 90, 182, 204, 205Broken Hill 174, 197Brookton 185, 208, 209Broome 185, 207, 209Broomehill-Tambellup 185, 207, 208Bruce Rock 185, 207, 208Bulloo 182, 204, 206Buloke 179, 201, 203Bunbury 185, 207, 210Bundaberg 182, 204, 205Burdekin 182, 204, 205Burke 182, 204, 205Burnie 191, 214Burnside 189, 211, 213Burwood 174, 196, 199Busselton 185, 208, 210Byron 174, 197, 199
C Cabonne 174, 197, 198Cairns 90, 182, 204, 206Cambridge 185, 207, 210Camden 174, 197, 199Campaspe 71, 179, 201, 202Campbelltown (NSW) 174, 196, 199Campbelltown (SA) 189, 211, 213Canada Bay 174, 196, 200Canning 111, 185, 207, 210Canterbury 59, 175, 196, 199Capel 185, 208, 210Cardinia 71, 179, 201, 202Carnamah 185, 207, 209Carnarvon 185, 208, 209Carpentaria 182, 204, 205Carrathool 59, 175, 196, 200Casey 179, 202Cassowary Coast 182, 204, 205Ceduna 189, 211, 212Central Coast 191, 214Central Darling 59, 175, 196, 200Central Desert 149, 150, 192, 215Central Goldfields 71, 179, 201, 202Central Highlands (QLD) 182, 205

222
Local Government National Report 2014–15
Central Highlands (Tas) 191, 213, 214Cessnock 175, 197, 198Chapman Valley 185, 209, 210Charles Sturt 189, 211, 213Charters Towers 182, 205Cherbourg 100, 182, 204, 205Chittering 185, 208, 209Circular Head 192, 214Clare and Gilbert Valleys 189, 212Claremont 185, 207, 210Clarence 39, 138, 192, 214Clarence Valley 175, 198Cleve 189, 211Cloncurry 182, 204, 205Cobar 175, 196, 200Cockburn 185, 207, 210Coffs Harbour 175, 196, 198Colac Otway 179, 201Collie 185, 208, 209Conargo 175, 196, 200Coober Pedy 189, 211, 213Cook 182, 204, 205Coolamon 175, 196, 200Coolgardie 185, 209Coomalie 193, 215Cooma-Monaro 175, 197, 198Coonamble 175, 196, 199Coorong 189, 211, 212Coorow 185, 207, 209Cootamundra 175, 197, 198Copper Coast 189, 212Corangamite 179, 201, 202Corowa 175, 197, 199Corrigin 185, 208, 209Cottesloe 185, 207, 210Cowra 175, 197, 198Cranbrook 185, 208Croydon 182, 204, 206Cuballing 185, 208, 210Cue 185, 207, 210Cunderdin 185, 208, 209
D Dalwallinu 185, 207, 210Dandaragan 185, 209Dardanup 185, 208, 209Darebin 179, 201, 202Darwin 148, 149, 151, 193, 215Deniliquin 175, 197Denmark 185, 209Derby-West Kimberley 186, 208, 209Derwent Valley 192, 214Devonport 192, 214Diamantina 182, 204, 206Donnybrook-Balingup 186, 207, 209Doomadgee 182, 204, 205Dorset 192, 214Douglas 182, 204, 205Dowerin 186, 207, 210Dubbo 175, 198Dumbleyung 186, 207, 209Dundas 186, 208, 209Dungog 175, 198
EEast Arnhem 148, 193, 215East Fremantle 186, 207, 210
East Gippsland 179, 201East Pilbara 186, 208, 209Elliston 189, 211, 212Esperance 186, 209Etheridge 182, 204, 206Eurobodalla 175, 197, 198Exmouth 186, 208
FFairfield 59, 175, 196, 199Flinders (QLD) 182, 204, 205Flinders (Tas) 192, 214Flinders Ranges 189, 211Forbes 175, 197, 199Franklin Harbour 189, 211, 212Frankston 32, 179, 201, 202Fraser Coast 182, 204, 205Fremantle 186, 207, 210
GGannawarra 179, 201, 202Gawler 189, 211, 212George Town 192, 214Gerard 123, 190, 212, 213Gilgandra 175, 196, 199Gingin 186, 208, 209Gladstone 182, 204, 205Glamorgan-Spring Bay 39, 138, 192, 214Glen Eira 70, 179, 202, 203Glen Innes Severn 175, 197, 198Glenelg 180, 201, 202Glenorchy 39, 138, 192, 214Gloucester 175, 197, 198Gnowangerup 186, 208, 209,Gold Coast 90, 182, 204, 206Golden Plains 71, 180, 201, 202Goomalling 186, 208, 209Goondiwindi 182, 205Gosford 175, 197, 199Gosnells 186, 207, 210Goulburn Mulwaree 175, 198Goyder 190, 211, 212Grant 190, 212Great Lakes 175, 197, 198Greater Bendigo 180, 198, 202Greater Dandenong 180, 201, 202Greater Geelong 71, 180, 201, 202Greater Geraldton 108, 186, 208, 209Greater Hume 175, 197, 199Greater Shepparton 71, 180, 201, 202Greater Taree 175, 198Griffith 175, 198Gundagai 175, 197, 198Gunnedah 176, 197, 198Guyra 176, 197, 199Gwydir 176, 196, 199Gympie 182, 204, 205
HHalls Creek 186, 208Harden 176, 196, 199Harvey 186, 196, 199Hawkesbury 59, 176, 197, 199Hay 176, 196, 199Hepburn 180, 201, 202Hills 176, 197, 200Hinchinbrook 183, 204, 205Hindmarsh 180, 201, 203

223
Index of Local Governments
Hobart 39, 138, 192, 214Hobsons Bay 70, 180, 201, 203Holdfast Bay 125, 190, 211, 213Holroyd 176, 196, 199Hope Vale 183, 204, 205Hornsby 176, 197, 200Horsham 180, 201, 203Hume 78, 180, 201, 202Hunters Hill 176, 197, 199Huon Valley 192, 214Hurstville 176, 196, 199
IIndigo 71, 180, 201, 202Inverell 176, 197, 198Ipswich 90, 93, 183, 204, 206Irwin 186, 209Isaac 183, 205
JJerilderie 176, 196, 200Jerramungup 186, 208, 210Joondalup 186, 207, 210Junee 176, 197, 199
KKalamunda 186, 207, 210Kalgoorlie/Boulder 186, 208, 210Kangaroo Island 125, 190, 211, 212Karoonda East Murray 190, 211Katanning 186, 208, 209Katherine 149, 193, 215Kellerberrin 186, 207, 208Kempsey 176, 197, 198Kent 186, 207, 210Kentish 192, 214Kiama 176, 197, 199Kimba 190, 211, 213King Island 192, 214Kingborough 39, 138, 192, 214,Kingston (SA) 190, 211, 212Kingston (Vic) 70, 180, 201, 203Knox 180, 201, 202Kogarah 176, 196, 199Kojonup 186, 208, 210Kondinin 186, 208, 210Koorda 186, 207, 210Kowanyama 183, 204, 205Kulin 186, 207, 210Ku-ring-gai 176, 197, 200Kwinana 186, 207, 210Kyogle 176, 197, 198
LLachlan 176, 196, 200Lake Grace 187, 208, 210Lake Macquarie 176, 197, 199Lane Cove 176, 196, 199Latrobe (Tas) 192, 214Latrobe (Vic) 180, 201, 202Launceston 140, 192, 214Laverton 187, 207, 210Leeton 176, 197, 198Leichhardt 176, 196, 200Leonora 187, 209, 210Light 190, 212, 213Lismore 176, 197, 198Litchfield 149, 151, 193, 215
Lithgow 176, 197, 198Liverpool 59, 176, 196, 199Liverpool Plains 176, 197, 198Livingstone 183, 204, 205Lockhart 176, 196, 199Lockhart River 183, 204, 205Lockyer Valley 183, 204, 205Loddon 180, 201, 203Logan 90, 183, 204, 206Longreach 183, 204, 205Lord Howe Island 1, 176, 196, 200Lower Eyre Peninsula 190, 212Loxton Waikerie 190, 211, 212
MMacDonnell 149, 193, 215Macedon Ranges 180, 202Mackay 100, 183, 204, 205Maitland 177, 197, 198Mallala 125, 190, 212Mandurah 111, 187, 207, 210Manjimup 187, 208, 209Manly 177, 196, 200Manningham 70, 180, 202, 203Mansfield 180, 201, 202Mapoon 183, 204, 205Maralinga Tjarutja 123, 190, 211, 213Maranoa 183, 204, 205Mareeba 183, 205Maribyrnong 180, 201, 202Marion 125, 190, 211, 212Maroondah 180, 201, 202Marrickville 59, 177, 196, 199McKinlay 183, 204, 205Meander Valley 192, 214Meekatharra 187, 207, 210Melbourne 64, 70, 78, 180, 201, 203Melton 180, 201, 202Melville 187, 207, 210Menzies 187, 207, 210Merredin 187, 208, 209Mid Murray 190, 211, 212Mid-Western Regional 177, 198Mildura 71, 180, 201, 203Mingenew 187, 208, 209Mitcham 125, 190, 211, 212Mitchell 180, 202Moira 180, 201, 202Monash 70, 180, 201, 203Moonee Valley 70, 180, 201, 202Moora 187, 209Moorabool 180, 202Morawa 187, 207, 210Moree Plains 177, 197, 199Moreland 180, 201, 202Moreton Bay 90, 183Mornington 183, 204, 205Mornington Peninsula 181, 202Mosman 177, 196, 199Mosman Park 187, 207, 210Mount Alexander 71, 181, 201, 202Mount Barker 190, 211, 212Mount Gambier 190, 211, 212Mount Isa 183, 205Mount Magnet 187, 207, 210Mount Marshall 187, 207, 210Mount Remarkable 190, 211, 213

224
Local Government National Report 2014–15
Moyne 181, 201, 202Mukinbudin 187, 207, 210Mundaring 187, 208, 210Murchison 187, 207, 210Murray (NSW) 177, 197, 199Murray (WA) 187, 208, 209Murray Bridge 190, 212Murrindindi 181, 201, 202Murrumbidgee 177, 196, 199Murweh 183, 204, 205Muswellbrook 177, 198
NNambucca 177, 197, 198Nannup 187, 207, 208Napranum 183, 204, 205Naracoorte Lucindale 190, 211, 212Narembeen 187, 207, 210Narrabri 177, 197, 199Narrandera 177, 196, 199Narrogin 187, 208, 210Narrogin Town 187, 207, 209Narromine 177, 196, 199Nedlands 187, 207, 210Newcastle 177, 197, 198Ngaanyatjarraku 187, 207, 208Nillumbik 181, 201, 202Nipapanha 123, 190, 211, 213Noosa 90, 183, 204, 205North Burnett 183, 204, 205North Sydney 177, 196, 199Northam 187, 208, 209 Northampton 187, 209Northern Areas 190, 211, 213Northern Grampians 181, 201, 203Northern Midlands 192, 214Northern Peninsula Area 42. 91, 183, 204, 205Norwood Payneham and St Peters 190, 211, 212Nungarin 187, 207, 210
OOberon 177, 197, 199Onkaparinga 125, 190, 211, 212Orange 177, 197, 198Orroroo Carrieton 190, 211, 213Outback Communities Authority 1, 23, 116, 122, 162,
190, 211, 213
PPalerang 177, 198Palm Island 42, 91, 183, 204, 205Palmerston 149, 193, 215Parkes 177, 197, 199Paroo 183, 204, 205Parramatta 177, 196, 199Penrith 59, 177, 197, 199Peppermint Grove 187, 207, 210Perenjori 187, 207, 210Perth 108, 187, 207, 210Peterborough 190, 211, 212Pingelly 188, 208, 209Pittwater 177, 196, 199Plantagenet 188, 209Playford 190, 211, 212Pormpuraaw 183, 204, 205Port Adelaide Enfield 190, 211, 213Port Augusta 191, 211, 212Port Hedland 188, 208, 209
Port Lincoln 191, 211, 212Port Macquarie-Hastings 177, 197, 198Port Phillip 70, 181, 201, 202Port Pirie 191, 211, 212Port Stephens 177, 197, 198Prospect 191, 211, 212Pyrenees 71, 181, 201, 202
QQuairading 188, 207, 209Queanbeyan 59, 177, 196, 199Queenscliffe 181, 202Quilpie 183, 204, 206
RRandwick 177, 196, 200Ravensthorpe 188, 208, 210Redland 90, 183, 204, 206Renmark Paringa 191, 211, 221Richmond 184, 204, 205Richmond Valley 177, 198Robe 191, 212Rockdale 177, 196, 200Rockhampton 184, 204, 205Rockingham 188, 207, 210Roebourne 188, 207, 209Roper Gulf 149, 193, 215Roxby 166, 191, 211, 213Ryde 177, 196, 200
SSalisbury 191, 211, 212Sandstone 188, 207, 210Scenic Rim 184, 204, 205Serpentine-Jarrahdale 188, 208, 209Shark Bay 188, 207, 209Shellharbour 178, 197, 199Shoalhaven 178, 197, 198Silverton Village 1, 178, 196, 200Singleton 178, 197, 198Snowy River 178, 197, 198Somerset 184, 205Sorell 39, 138, 192, 214South Burnett 184, 205South Gippsland 181, 201South Perth 188, 207, 210Southern Downs 184, 205Southern Grampians 181, 201, 202Southern Mallee 191, 211, 212Southern Midlands 192, 214Stirling 188, 207, 210Stonnington 70, 181, 201, 203Strathbogie 71, 181, 201, 202Strathfield 178, 196, 199Streaky Bay 191, 211Subiaco 188, 207, 210Sunshine Coast 90, 184, 204, 206Surf Coast 181, 202Sutherland 178, 196, 200Swan 188, 207, 210Swan Hill 181, 201, 203Sydney 59, 64, 178, 196, 199
TTablelands 184, 204, 205Tammin 188, 207, 210Tamworth Regional Council 178, 198Tasman 39, 138, 192, 214

225
Index of Local Governments
Tatiara 191, 211Tea Tree Gully 191, 211, 212Temora 178, 197, 199Tenterfield 178, 196, 199Three Springs 188, 208, 209Tibooburra 1, 178, 196, 200Tiwi Islands 149, 193, 215Toodyay 188, 208, 209Toowoomba 184, 204, 205Torres 98, 184, 204Torres Strait Island 184, 204Townsville 92, 93, 184, 204, 205Towong 71, 181, 201, 202Trayning 188, 207, 209Trust Account 1, 23, 193, 215, 219Tumbarumba 178, 196, 198Tumby Bay 191, 212Tumut 178, 197, 198Tweed 178, 197, 198
UUnley 191, 211, 212Upper Gascoyne 188, 207, 210Upper Hunter 178, 197, 198Upper Lachlan 178, 197, 199Uralla 178, 197, 198Urana 178, 196, 199
VVictor Harbor 191,211, 213Victoria Daly 32, 145, 149, 169, 193, 215Victoria Park 188, 207, 210Victoria Plains 188, 208, 209Vincent 188, 207, 210
WWagait 149, 193, 215Wagga Wagga 178, 198 Wagin 188, 208, 209Wakefield 191, 211 ,212Wakool 178, 196, 199Walcha 178, 197, 199Walgett 178, 196, 199Walkerville 191, 211, 212Wandering 188, 208, 209Wangaratta 181, 201, 202Wanneroo 188, 207, 210Waratah-Wynyard 192, 214Waroona 188, 208, 209Warren 178, 196, 199Warringah 178, 196, 200Warrnambool 181, 201, 202Warrumbungle 178, 196, 199
Wattle Range 191, 212Waverley 59, 178, 196, 200Weddin 178, 196, 199Wellington (NSW) 178, 197, 199Wellington (Vic) 181, 201Wentworth 178, 196, 199West Arnhem 149, 193, 215West Arthur 188, 208, 210West Coast 192, 214West Daly 32, 145, 169, 193, 215West Tamar Council 192, 214West Torrens 191, 211, 213West Wimmera 181, 201, 203Western Downs 184, 205Westonia 188, 207, 210Whitehorse 70, 181, 202Whitsunday 184, 204, 205Whittlesea 181, 201, 202Whyalla 191, 211, 212Wickepin 188, 207, 210Williams 188, 209Willoughby 179, 196, 200Wiluna 189, 207, 210Wingecarribee 179, 197, 199Winton 96, 184, 204, 205Wodonga 181, 201, 202Wollondilly 179, 197, 199Wollongong 179, 196, 198Wongan-Ballidu 189, 208, 210Woodanilling 189, 207, 210Woollahra 179, 196, 199Woorabinda 184, 204, 205Wudinna 191, 211, 212Wujal Wujal 184, 204Wyalkatchem 189, 207, 209Wyndham 181, 201, 202Wyndham-East Kimberley 189, 208Wyong 179, 197, 199
YYalata 123, 191, 211Yalgoo 189, 207, 210Yankalilla 191, 212Yarra 70, 181, 201, 202Yarra Ranges Council 181, 201, 202Yarrabah 42, 91, 184, 204, 205Yarriambiack 181, 201, 203Yass Valley 179, 198Yilgarn 189, 208, 210York 189, 208, 209Yorke Peninsula 125, 191, 212Young 179, 197, 198


227
Alphabetical index
AAboriginal and Torres Strait Islander communities, iii, vi,
11, 41, 43, 45, 49, 63, 76,82, 91, 98, 107, 110, 130, 139, 147, 150, 154, 159
Aboriginal communities, 42–43, 58, 76, 82, 107, 110–111, 116, 123, 131, 150, 162, 169
see also Indigenous communitiesAboriginal Lands Rights (Northern Territory) Act 1976
(Cth), 143, 166Aboriginal Local Government Action Plan (VIC), 42, 76actual grant entitlement, 10, 16adjustments, vii, 5, 13, 66, 109–110, 114, 116, 127amalgamation, 39, 46, 55, 92, 107, 109–110, 132, 138,
169annual report, 35–37, 75, 79, 132, 148assets and liabilities, 6Australian Bureau of Statistics, 2, 4–7, 11, 17–19, 58, 60,
70, 85–86, 104, 116, 119, 135, 138, 143, 158, 169Australian Capital Territory, iii, vi, 1, 3, 10, 20–21, 23, 36,
38,40, 43, 49, 152–156, 217Australian Classification of Local Governments (ACLG), vi,
24, 173, 217, 219Australian Local Government Association, vi, 2–3, 49, 124,
157–159
Bbalanced budget model, 162–163, 167Building Queensland Act 2015 (Qld), 92bushfire, 71, 76, 81, 136
Ccapping, v, 33, 59, 69, 73, 77, 79, 82, 85, 90children, 41, 51, 85, 107, 119, 121, 150City of Sydney Act 1988 (NSW), 61City of Sydney Amendment (Elections) Act 2015 (NSW), 64climate change, 125–126, 152Closing the Gap, vi, 41, 159Commonwealth Grants Commission, 9, 33community planning, 35, 60consumer price index, 9–12, 15–16, 38, 77Council of Australian Governments, 2–3, 41, 152 Courts Legislation Amendment Act 2015 (ACT), 155Crimes (Sentencing) Act 2005 (ACT), 155Crimes (Sentencing) Amendment Act 2014 (ACT), 155current arrangements, Overview, v, 10
Ddeclared local governing bodies, 1, 23Determining entitlements, v, 11 direct assessment, 51, 116, 162–163, 167disability factor, 50–52, 59, 116, 167distribution of grants, v, 21diversity, v, 2, 43, 50, 150
EEfficiency and effectiveness, vi, 9, 11, 38–39, 45, 61, 75,
80, 91–92, 95, 106, 109–110, 124, 138, 146, 149, 153, 158–159
employees, 98, 147, 149–150, 154escalation factor, 10–11, 50, 142estimated grant, 120
Ffactoring back, 161, 169–170final factor, ix, 11–13, 15–16, 120financial and asset management planning, 35–36, 60,
105, 136–137
Ggeneral purpose and local road, vii, 10, 18, 65general purpose grants pool, 65, 70
Hhorizontal equalisation, iii, ix, 9, 11, 27, 45–47, 49–50,
65, 85, 101, 103, 113–115, 132, 134, 142, 161–163, 166
Iidentified local road, 11–12, 20, 23, 47, 58, 67, 122indexation, iii, v, 9, 11–12, 15–16, 69, 73, 85, 113–114,
122, 142, 157Indigenous communities, 76, 85, 101–102, 159, 168, 171Institute of Public Works Engineering Australia, 126Integrated Planning and Reporting Framework (NSW), 35,
60, 64, 168Integrated Planning and Reporting Framework (WA), 105,
109Intergovernmental Agreement on Federal Financial
Relations, 3Internet, v, 24, 60, 78, 93, 156
JJervis Bay Territory, 18–19
KKilometre, vii, 18–19, 26, 32, 55, 71, 97, 117–119, 121,
134, 173, 195–215, 218
Llandfill, 149–150legislation, iii, 1–2, 20, 22–23, 38, 61, 62, 64–65, 75,
77, 92, 95, 98–99, 108, 122, 139–140, 142–142, 147, 154–155, 157,

228
Local Government National Report 2014–15
library services, 50–52, 78, 117Local Government Act 1989 (VIC), 75, 77Local Government Act 1993 (NSW), 22, 61Local Government Act 1993 (TAS), 136, 139–140Local Government Act 2009 (Qld), 22, 92Local Government Act 1999 (SA), 123, 130–131Local Government Act 1995 (WA), 105, 107Local Government and Shires Associations (NSW), 54Local Government and Other Legislation Amendment Act
2015 (Qld), 92Local Government Association of Queensland (LGAQ), vi,
94–99Local Government Association of South Australia (LGASA),
36, 113, 119, 123–130Local Government Association of Tasmania (LGAT), 132,
136–139, 141Local Government Association of the Northern Territory
(LGANT), vi, 36, 38, 145–146, 149–151Local Government Amendment (Elections) Act 2015
(NSW), 64Local Government (Financial Assistance) Act 1986 (Cwth),
9 Local Government (Financial Assistance) Act 1995 (Cwth),
i, iii, 1, 9, 15–16, 22–23, 35, 41, 45–47, 49, 51, 57, 65, 101, 123, 132, 134, 142, 161, 217
Local Government Grants Act 1978 (WA), 22Local Government Grants Commission Act 1986 (NT), 22Local Government Legislation Amendment Act 2014 (Qld),
92Local Government Legislation Amendment Act 2015 (NT),
147local government grants commissions, iii, v, ix, 9–11,
21–24, 27, 32-33, 36, 49, 115, 119, 123, 161–162, 164, 166, 171, 173, 217
Local Government Managers Australia, 109–110Local Government Reform Fund, 157Local Government Research and Development Scheme
(SA), 127–127, 130Local Government Victoria, 35, 42, 74–77, 79
MMaggolee website (VIC), 42, 76minimum grant, v, viii, 9, 11, 27–31, 33, 46, 50, 59, 65,
69–70, 73, 85–87, 90, 101, 113–114, 132–133, 142–143, 161, 166, 169–170, 173, 193
ministerial councils, 3Municipal Association of Victoria (MAV), iii, vi, 42, 75–76,
78–82
NNational Principles, v–vi, ix, 9, 21–23, 45–47, 51, 53, 55,
57, 65, 86, 107, 113, 115, 132, 134, 142–143, 161, 165, 169–170
national representation, v, 2Native Title, 130Native Title (South Australia) Act 1994 (SA), 130 Natural Resources Management Act 2004 (SA), 129negative adjustment, 12net worth, 6–7New South Wales, iii, vi, viii, 1, 5, 22, 24, 27, 35, 37–38,
42, 49–55, 58–64, 94, 152, 163–164, 167–168, 170–171, 174, 196–200
New South Wales Office of Local Government, 60–63New South Wales Local Government Act 1993, 22, 61
New South Wales Local Government Grants Commission, 50–54, 58–59
Northern Territory, iii, vi, viii, 1–3, 5, 10, 12, 20–26, 31–32, 36, 38–39, 43, 49, 142–151, 161, 163, 165–170, 192, 215
Northern Territory Grants Commission, 142–143, 145, 165, 166
OOffice of Aboriginal Affairs (Victoria), 42, 76
Pper capita grants, 123, 169performance measures, vi, 36–38, 60, 74, 79, 90, 94–95,
105–106, 109, 124, 137, 146, 149, 153, 158population, v, 2–4, 9–19, 24, 27–33, 43, 50–52, 54–56,
58–60, 66–70, 85, 87–90, 101, 104–105, 113–122, 132–133, 135, 143–145, 150, 165, 167–171, 173–193, 217–218
Productivity Commission, 158
QQueensland, iii, vi–viii, 5, 12, 22, 24, 36–37, 39, 42, 49,
83, 85–92, 94–99, 163–165, 167–168, 170, 181, 204–206
Queensland Local Government Act 2009, 22, 92Queensland Local Government Comparative Information
Report, 37, 90Queensland Local Government Grants Commission, 85,
88, 90
Rrates, vii, 5, 23, 37–38, 41, 47, 50, 53, 56–57, 60–61,
66–68, 77, 79–80, 82, 85–87, 90–91, 93, 103–104, 117, 120–121, 134, 143–144, 158, 164–166
Regional and Local Community Infrastructure Program, 157
relative need, 9, 32–33, 47, 69, 71, 86, 88, 116, 132–133, 142, 170, 195
reporting, vi, 35, 37–39, 41–42, 51, 60, 63–64, 74–75, 77, 81, 91, 99, 105–107, 109, 126, 138, 146, 149, 153, 168
road grants, vii–viii, 17–18, 33, 122, 134, 171, 195Roads to Recovery Programme, 67, 135, 143–144,
157–158, 166
Ssales of goods and services, 5scope of equalisation, viii, 163–164South Australia, vi–viii, 1, 5–6, 12, 22, 24, 36–37, 39, 43,
49, 113–131, 163, 165, 167–171, 189, 211–213South Australian Local Government Grants Commission,
22, 37, 113–120, 122–124, 126South Australian Local Government Grants Commission
Act 1992, 22South Australian Public Health Act 2011 (SA), 124–125Special Premiers' Conference, 9, 17specific purpose payments, 3, 56State Grants Commission Act 1976 (Tas.), 22, 136State Grants Commission Amendment Act 2015 (Tas), 136structural reform, 105–107

TTasmania, iv, vi, viii, 2, 5, 12, 20, 22, 24, 36, 38–39, 43,
49, 132–141, 163, 165, 167–170, 191, 214Tasmanian State Grants Commission, viii, 132–136, 138Tasmania State Grants Commission Act 1976, 22, 136taxation revenue, vii, 4
UUnadjusted, 15–16Unsealed road, 119, 121, 124
VVictoria, iii, vi–viii, 2, 5, 22, 24, 32, 35, 37–38, 42, 49,
65–83, 145, 149, 163, 165, 167–170, 179, 201–203Victoria Grants Commission, 22, 24, 32, 65–73Victoria Grants Commission Act 1976, 22
Wwaste management, 43, 66–67, 69, 115, 119, 121, 129,
149water and sewerage, 54, 91, 94, 136, 166Western Australia, 12, 22, 24, 27, 36, .37, 39, 43, 49,
101–111, 163, 165, 167–171, 184, 207–210Western Australian Local Government Association,
102–103, 109–111Western Australian Local Government Grants Commission,
101–104workers compensation, 98,
Yyoung people, 41youth, 43, 85, 150
Alphabetical index


www.infrastructure.gov.au