local government better practice guide€¦ · web view120. local government. better practice...
TRANSCRIPT

delwp.vic.gov.au
Local Government Victoria, February 2019
Local GovernmentBetter Practice Guide
Performance Reporting Framework Indicator Workbook

AuthorLocal Government Victoria in the Department of Environment, Land Water and Planning2 Lonsdale Street Melbourne 3000
Photo creditTitle: “Crimson Rosella”Author: “Lachlan Clarke”“Crimson Rosella” is licenced under CC by the Department of Environment, Land, Water and Planning.© The State of Victoria Department of Environment, Land, Water and Planning 2019
This work is licensed under a Creative Commons Attribution 4.0 International licence. You are free to re-use the work under that licence, on the condition that you credit the State of Victoria as author. The licence does not apply to any images, photographs or branding, including the Victorian Coat of Arms, the Victorian Government logo and the
Department of Environment, Land, Water and Planning (DELWP) logo. To view a copy of this licence, visit http://creativecommons.org/licenses/by/4.0/ISBN 978-1-74146-563-1 (pdf/online)
DisclaimerThis publication may be of assistance to you but the State of Victoria and its employees do not guarantee that the publication is without flaw of any kind or is wholly appropriate for your particular purposes and therefore disclaims all liability for any error, loss or other consequence which may arise from you relying on any information in this publication.
AccessibilityIf you would like to receive this publication in an alternative format, please telephone the DELWP Customer Service Centre on 136186, email [email protected], or via the National Relay Service on 133 677 www.relayservice.com.au. This document is also available on the internet at www.delwp.vic.gov.au.

Acronyms and Abbreviations...........................................................................................5
1. Approach to performance reporting............................................................................61.1 Aims of the Local Government Performance Reporting Framework (LGPRF)...................................6
1.2 Reasons for measuring comparative performance..............................................................................6
1.3 Scope of the LGPRF................................................................................................................................ 7
1.4 Objectives................................................................................................................................................. 7
1.5 Distinguishing outcomes and outputs...................................................................................................7
1.6 Indicator frameworks............................................................................................................................... 7
1.7 Guiding principles................................................................................................................................. 11
1.8 Legislative framework........................................................................................................................... 12
1.9 Preparing the organisation for reporting.............................................................................................15
1.10 LGPRF governance.............................................................................................................................. 16
2. About this workbook...................................................................................................162.1 Structure of the workbook.................................................................................................................... 16
2.2 How to read the indicator descriptions................................................................................................17
3. Service performance indicators.................................................................................18Aquatic facilities (AF).................................................................................................................................. 18
AF1 User satisfaction with aquatic facilities (optional)..................................................................18AF2 Health inspections of aquatic facilities....................................................................................19AF3 Reportable safety incidents at aquatic facilities.....................................................................19AF4 Cost of indoor aquatic facilities................................................................................................20AF5 Cost of outdoor aquatic facilities.............................................................................................20AF6 Utilisation of aquatic facilities (audited)..................................................................................21
Animal management (AM)........................................................................................................................... 24AM1 Time taken to action animal management requests...............................................................24AM2 Animals reclaimed.....................................................................................................................25AM3 Cost of animal management service........................................................................................25AM4 Animal management prosecutions (audited)..........................................................................26
Food safety (FS)........................................................................................................................................... 29FS1 Time taken to action food complaints......................................................................................29FS2 Food safety assessments.........................................................................................................30FS3 Cost of food safety service.......................................................................................................30FS4 Critical and major non-compliance outcome notifications (audited)....................................31
Governance (G)............................................................................................................................................ 35G1 Council decisions made at meetings closed to the public.....................................................35G2 Satisfaction with community consultation and engagement.................................................36G3 Councillor attendance at council meetings.............................................................................36G4 Cost of governance...................................................................................................................37
Contents
Local GovernmentBetter Practice GuidePerformance Reporting Framework Indicator Workbook
1

G5 Satisfaction with council decisions (audited).........................................................................38
Libraries (LB)............................................................................................................................................... 41LB1 Library collection usage............................................................................................................41LB2 Standard of library collection...................................................................................................42LB3 Cost of library service...............................................................................................................42LB4 Active library members (audited).............................................................................................43
Maternal and Child Health-MCH (MC).........................................................................................................47MC1 Participation in first MCH home visit.......................................................................................47MC2 Infant enrolments in MCH service............................................................................................48MC3 Cost of MCH service..................................................................................................................48MC4 Participation in the MCH service (audited)..............................................................................49MC5 Participation in MCH service by Aboriginal children (audited)..............................................49
Roads (R)...................................................................................................................................................... 52R1 Sealed local road requests........................................................................................................52R2 Sealed local roads maintained to condition standards..........................................................53R3 Cost of sealed local road reconstruction.................................................................................53R4 Cost of sealed local road resealing..........................................................................................54R5 Satisfaction with sealed local roads (audited)........................................................................54
Statutory Planning (SP)............................................................................................................................... 58SP1 Time taken to decide planning applications............................................................................58SP2 Planning applications decided within required time frames..................................................59SP3 Cost of statutory planning service...........................................................................................59SP4 Council planning decisions upheld at VCAT (audited)...........................................................60
Waste Collection (WC)................................................................................................................................. 63WC1 Kerbside bin collection requests..............................................................................................63WC2 Kerbside collection bins missed..............................................................................................64WC3 Cost of kerbside garbage bin collection service.....................................................................64WC4 Cost of kerbside recyclables bin collection service...............................................................65WC5 Kerbside collection waste diverted from landfill (audited).....................................................65
4. Financial performance indicators..............................................................................69Efficiency (E)................................................................................................................................................ 69
E1 Average residential rate per residential property assessment (audited)..............................69E2 Expenses per property assessment (audited).........................................................................70E3 Resignations and terminations compared to average staff (audited)...................................71
Liquidity (L).................................................................................................................................................. 73L1 Current assets compared to current liabilities (audited)........................................................73L2 Unrestricted cash compared to current liabilities (audited)...................................................74
Obligations (O)............................................................................................................................................. 76O1 Asset renewal compared to depreciation (audited)................................................................76O2 Loans and borrowings compared to rates (audited)..............................................................77O3 Loans and borrowings repayments compared to rates (audited).........................................78O4 Non-current liabilities compared to own source revenue (audited)......................................78
2Local GovernmentBetter Practice GuidePerformance Reporting Framework Indicator Workbook

Operating position (OP).............................................................................................................................. 80OP1 Adjusted underlying surplus (or deficit) (audited)..................................................................80
Stability (S)................................................................................................................................................... 82S1 Rates compared to adjusted underlying revenue (audited)...................................................82S2 Rates compared to property values (audited).........................................................................83
5. Sustainable capacity indicators.................................................................................85Capacity (C).................................................................................................................................................. 85
C1 Expenses per head of municipal population (audited)...........................................................85C2 Infrastructure per head of municipal population (audited)....................................................86C3 Population density per length of road (audited).....................................................................86C4 Own source revenue per head of municipal population (audited)........................................87C5 Recurrent grants per head of municipal population (audited)...............................................88C6 Relative Socio-Economic Disadvantage (audited)..................................................................88
6. Governance and management checklist...................................................................901. Community engagement policy................................................................................................902. Community engagement guidelines........................................................................................913. Strategic Resource Plan............................................................................................................914. Annual budget............................................................................................................................ 915. Asset management plans..........................................................................................................916. Rating strategy........................................................................................................................... 927. Risk policy.................................................................................................................................. 928. Fraud policy................................................................................................................................ 929. Municipal emergency management plan.................................................................................9210. Procurement policy...................................................................................................................9311. Business continuity plan...........................................................................................................9312. Disaster recovery plan..............................................................................................................9313. Risk management framework...................................................................................................9414. Audit committee.........................................................................................................................9415. Internal audit.............................................................................................................................. 9416. Performance reporting framework...........................................................................................9417. Council plan reporting...............................................................................................................9518. Financial reporting..................................................................................................................... 9519. Risk reporting............................................................................................................................. 9520. Performance reporting..............................................................................................................9521. Annual report............................................................................................................................. 9622. Councillor Code of Conduct.....................................................................................................9623. Delegations................................................................................................................................. 9624. Meeting procedures................................................................................................................... 97
7. Optional service performance indicators..................................................................98Economic Development (ED)......................................................................................................................98
ED1 Participation in business development activities...................................................................98ED2 Delivery of planned business development activities............................................................99
Local GovernmentBetter Practice GuidePerformance Reporting Framework Indicator Workbook
3

ED3 Cost of economic development service...................................................................................99ED4 Change in number of businesses...........................................................................................100
Immunisation (I)......................................................................................................................................... 103I1 User satisfaction with immunisation service........................................................................103I2 Vaccination of children by council.........................................................................................104I3 Return of consent cards by secondary school children......................................................104I4 Cost of immunisation service.................................................................................................105I5 Vaccination of children............................................................................................................105I6 Vaccination of secondary school children............................................................................105
Sports grounds (SG).................................................................................................................................. 108SG1 Structured activities on sports fields.....................................................................................108SG2 Condition of sports fields........................................................................................................109SG3 Cost of sports grounds...........................................................................................................109SG4 Population per sports field......................................................................................................110
Street sweeping (SS)................................................................................................................................. 112SS1 Street sweeping requests........................................................................................................112SS2 Frequency of sealed local road sweeping.............................................................................113SS3 Cost of street sweeping service.............................................................................................113SS4 Routine cleaning of sealed local road pits............................................................................114
8. Performance reporting template..............................................................................1168.1 The template......................................................................................................................................... 116
8.2 Opening and saving............................................................................................................................. 116
8.3 Input sheets.......................................................................................................................................... 117
8.4 Previous years’ data............................................................................................................................ 119
8.5 Output sheets....................................................................................................................................... 119
8.6 Upload sheets...................................................................................................................................... 120
8.7 Interim reporting.................................................................................................................................. 120
8.8 Excel FAQs........................................................................................................................................... 121
Version Changes Publication date
V1.1 Original document 22 February 2019
V1.2 Amendment to Maternal and Child Health-MCH (MC) Other information - Key Terms - Cost
25 June 2019
4Local GovernmentBetter Practice GuidePerformance Reporting Framework Indicator Workbook

Acronyms and Abbreviations
AAS Australian Accounting Standards
ABN Australian Business Number
ABR Australian Business Register
ABS Australian Bureau of Statistics
ATO Australian Taxation Office
CDIS Child Development Information System
DELWP Department of Environment, Land, Water and Planning
DET Department of Education and Training
DHHS Department of Health and Human Services
FTE Full time equivalent
GIS Geographic information system
Kms Kilometres
LGPRF Local Government Performance Reporting Framework
LGV Local Government Victoria
LGA Local Government Act 1989
MCH Maternal and Child Health
MaCHS Maternal and Child Health System
PPARS Planning Permit Activity Reporting System
Sqm Square metres
VAGO Victorian Auditor-General’s Office
VCAT Victorian Civil and Administrative Tribunal
Local GovernmentBetter Practice GuidePerformance Reporting Framework Indicator Workbook
5

1. Approach to performance reporting
1.1 Aims of the Local Government Performance Reporting Framework (LGPRF)The Victorian Government established the LGPRF in 2014 to ensure that all councils are measuring and reporting on their performance in a consistent way. The need for a new performance reporting framework for Victorian councils arose in part out of the Victorian Auditor-General’s observation that performance reporting in local government had limited relevance to ratepayers because it lacked information about the quality of council services, the outcomes being achieved and how these related to councils’ strategic objectives1.
The primary objective of the LGPRF is to provide comprehensive performance information that meets the needs of a number of audiences. In meeting this objective:
• councils will have information to support strategic decision-making and continuous improvement
• communities will have information about council performance and productivity
• regulators will have information to monitor compliance with relevant reporting requirements
• state and federal governments will be better informed to make decisions that ensure an effective, efficient and sustainable system of local government.
The data generated by the LGPRF can also provide an incentive to improve the performance of local government services by:
• enhancing measurement approaches and techniques
• helping councils identify where there is scope for improvement
• promoting greater transparency and informed debate about comparative performance.
1.2 Reasons for measuring comparative performancePerformance measurement can be more meaningful when appropriate comparisons are developed and provided on a longitudinal basis. The services of local councils are rarely subject to competitive pressures, which make the use of comparative performance indicators more important. Comparisons across councils offer a level of accountability to the community, who have little opportunity to express their preferences by accessing services elsewhere. Comparative information on performance can also enhance the incentives to achieve continuous improvement by:
• providing information on attainable levels of performance and identification of councils and service areas that are successful
• enabling councils to learn from peers that are delivering higher quality and/or more cost effective services
• generating additional incentives for councils and services to improve performance.
Meaningful conclusions about a council’s performance can only be drawn through comparison of ‘like’ councils and observing the performance of an individual council over time. As such, the LGPRF has been designed to facilitate reporting of individual trend data. Over time, as the sector matures, the Victorian Government and councils will be able to compare any councils based on a number of characteristics.
No two councils are the same, and as such it is important that performance results are contextualised to the local municipality, for example population size and demographics; geographic information; environmental conditions and socio-economic trends.
Although the LGPRF does not extend to recommendations on how best to provide local government services, the information generated by the LGPRF can assists councils to make such assessments. Reliable comparative performance information can help councils better understand the strengths and weaknesses of each approach, and the circumstances in which each can work best.1 See Victorian Auditor-General’s Office (2008) and (2012) Performance Reporting by Local Government, http://www.audit.vic.gov.au/6
Local GovernmentBetter Practice GuidePerformance Reporting Framework Indicator Workbook

1.3 Scope of the LGPRFTo provide a comprehensive picture of council performance, four indicator sets: service performance, financial performance, sustainable capacity, and governance & management have been developed across three thematic areas: service performance, financial performance and sustainability (figure 1). An objective for assessing performance against each thematic area has been established to inform the development of performance indicators.
Figure 1: LGPRF indicator areas and sets
1.4 ObjectivesIn each indicator set, the objectives for the performance areas are outlined, and performance indicators that measure the achievement of those objectives are reported.
A common objective (or desired outcome) for each indicator set is determined for all councils, although the priority that each council gives to each objective may differ. The LGPRF approach to performance reporting is to focus on the extent to which each shared objective for an indicator set has been met.
1.5 Distinguishing outcomes and outputsOutcome indicators provide information on the impact of an indicator set. In contrast, outputs are the services or activities delivered.
While the aim of the LGPRF is to focus on outcomes, they are often difficult to measure. The LGPRF therefore includes measures of outputs (which are often easier to measure), with an understanding that there is a relationship between those outputs and desired outcomes and that the measures of outputs are, in part, proxies for measures of outcomes. Output information is also critical for efficient and effective management of council activities and is often the level of performance information that is of most interest to individuals who access services.
It is acknowledged that outcomes may be influenced by factors outside the control of councils. The approach in the LGPRF is to provide councils with an opportunity to support their results with a narrative to explain instances where council activities are only one contributing factor.
1.6 Indicator frameworksService performanceThis LGPRF contains 41 service performance indicators across nine broad service areas (box 1). These services have the following important features:
• their key objectives are common or similar across councils (lending themselves to comparative performance reporting)
• councils have primary control and/or statutory responsibility for delivery of selected services
Service performance41 quantitative measures
Local GovernmentBetter Practice GuidePerformance Reporting Framework Indicator Workbook
7

• services are viewed as important to the community
• they make an important contribution to the community and/or economy (meaning there are potentially significant gains from improved effectiveness or efficiency).
Box 1 Services included in the LGPRF
• Aquatic facilities
• Animal management
• Food safety
• Governance
• Libraries
• Maternal and Child Health (MCH)
• Roads
• Statutory planning
• Waste collection
Optional indicators and measures have been developed for four additional service areas (i.e. economic development, immunisation, street sweeping and sports grounds) and councils are encouraged to report against these indicators and measures where possible. In the future, a formal set of criteria will be developed to consider the inclusion of other services into the mandatory LGPRF.
Figure 2 shows the framework adopted for measurement of service performance and reflects the process through which local governments transform inputs into outputs and outcomes in order to achieve desired service objectives. The dimensions of the framework are described in table 1.
Figure 2. Service performance framework
The LGPRF takes a comprehensive view of performance reporting and the service performance framework gives equal prominence to effectiveness and efficiency as the two overarching dimensions of performance. There are inherent trade-offs in allocating resources and dangers in analysing only some aspects of a service. A unit of service may have a high cost but be more effective than a lower cost service and therefore be more cost effective. As an example, improving outcomes for a group with special needs may lead to an increase in the average cost per unit of providing a service. As such, it is important that results are looked at holistically when making as assessment of performance.
8Local GovernmentBetter Practice GuidePerformance Reporting Framework Indicator Workbook

Table 1: Dimensions of the service performance indicator framework
Dimension Definition Indicators/Measures
Appropriateness Output indicators that measure the extent to which services meet users’ needs
Participation rateResponse time
Quality Output indicators that measure the extent to which a service is delivered in accordance with defined standards
Resource standardService standard
Cost Output indicators that measure how efficiently services use their resources (inputs) to produce outputs
Average cost per unit (unit cost)
Service outcome Outcome indicators that measure how well the outcomes of the service have achieved the stated objective
Community satisfactionHealth and safety
Ideally, comparisons of the unit cost of a service should reflect the full cost to council. Problems can occur when some costs are not included or are treated inconsistently across councils (for example, corporate overheads and management costs). As full cost information is not available in the short term, the LGPRF approach is to use direct cost to improve the comparability of unit costs. The exception to this is the cost measures for aquatic facilities which also takes into account income received (i.e. net direct cost). Specific guidance for calculation of the cost measures is provided in the key terms for each service indicator (see section 3).
Financial performance frameworkFigure 3 shows the framework adopted for measuring financial management effectiveness in local government.
Figure 3. Financial performance framework
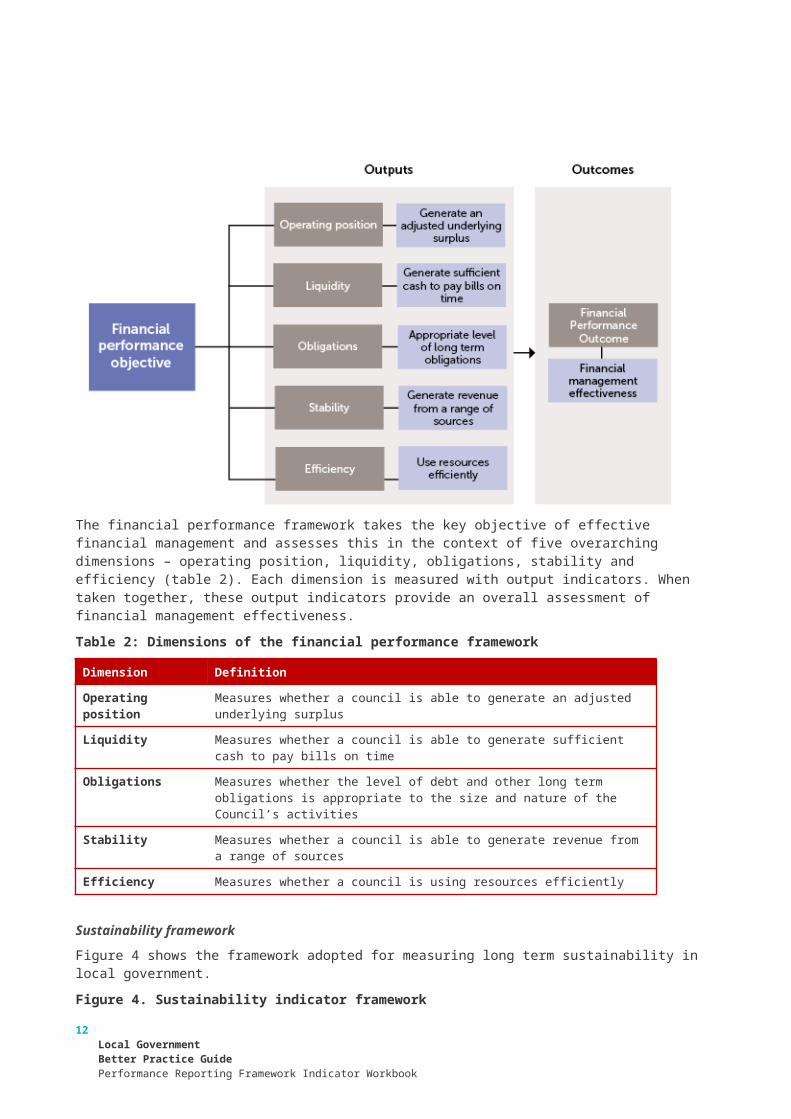
The financial performance framework takes the key objective of effective financial management and assesses this in the context of five overarching dimensions – operating position, liquidity, obligations, stability and efficiency (table 2). Each dimension is measured with output indicators. When taken together, these output indicators provide an overall assessment of financial management effectiveness.
Table 2: Dimensions of the financial performance framework
Local GovernmentBetter Practice GuidePerformance Reporting Framework Indicator Workbook
9

Dimension Definition
Operating position Measures whether a council is able to generate an adjusted underlying surplus
Liquidity Measures whether a council is able to generate sufficient cash to pay bills on time
Obligations Measures whether the level of debt and other long term obligations is appropriate to the size and nature of the Council’s activities
Stability Measures whether a council is able to generate revenue from a range of sources
Efficiency Measures whether a council is using resources efficiently
Sustainability frameworkFigure 4 shows the framework adopted for measuring long term sustainability in local government.
Figure 4. Sustainability indicator framework
The sustainability indicator framework assesses councils in the context of three dimensions – financial performance, capacity and governance and management (table 3), and takes the objective of sustainability. Each of these dimensions is measured in terms of output indicators. These output indicators provide an overall assessment of the long term sustainability of a council, and should be considered when assessing the service and financial performance of a council.
Table 3. Dimensions of the Sustainability Framework
Dimension Definition
Financial performance
Measures whether a council is able to absorb foreseeable changes and unexpected shocks without having to make disruptive revenue or expenditure adjustments
Capacity Measures whether a council is able to meet the agreed service needs of the community
Governance and management
Measures whether a council has strong governance and management frameworks in place covering community engagement, planning, monitoring, reporting and decision-making
1.7 Guiding principlesGuiding principles have been established to assist in the development and selection of indicators to measure local government performance (box 2).
10Local GovernmentBetter Practice GuidePerformance Reporting Framework Indicator Workbook

Box 2 Guiding principles of LGPRF
1. Indicators should be ‘SMART’
The construction of specific indicators should seek to adhere to the SMART principles, that is, indicators should be:
• specific to the service, activity and/or dimension of performance being measured;
• based on measurable factors that can be observed, documented and verified (either by audits or other mechanisms);
• aligned with objectives;
• relevant to the service, activity and/or dimension of performance being measured; and
• time-bound with an appropriate and clear timeframe specified for measuring performance.
2. Indicators should build a balanced picture of performance
A range of performance indicators should be developed to cover different aspects of performance. A single indicator is typically not able to provide a balanced picture of performance; therefore a suite of indicators, measuring different aspects of performance should be pursued.
3. Indicators should be understandable to a broad audience
Performance indicators must be understandable to a broad audience. They should be clear and unambiguous so that stakeholders can draw meaningful conclusions about the performance of councils. A balance should be struck between performance indicators being understandable to the community, useful to councils to support continuous improvement and instructive to other levels of government. Performance indicators must also measure what they claim to measure. Proxy indicators should be clearly identified as such.
4. Indicators should align with other reporting requirements
Use of performance indicators that are already in use in other reporting arrangements should be pursued where possible. Adopting existing indicators can ensure consistency with other reporting frameworks, lowers the cost of data collection and avoids delays in reporting. Performance indicators should also be developed with national standards and reporting regimes in mind to allow for inter-jurisdictional analysis.
5. Indicators should be comparable across councils and consistent over time
Each indicator must be clearly defined with counting rules and measurement standards established to facilitate a valid measure of performance and aid reasonable comparisons. Indicators should also allow for consistent comparisons of performance over time. This requires that performance indicators be well designed and robust from the outset and remain broadly stable over time.
6. The benefit of collecting information should outweigh the collection costs
The costs associated with collecting information needs to be balanced against the benefits of collecting that information.
1.8 Legislative frameworkLegislation was introduced in early 2014 which set up the requirement for councils to report on their performance through their annual report to their community.2 The reporting format for the indicators and
2 This has been achieved through the passage of the Local Government Amendment (Performance Reporting and Accountability) Act 2014 and the making of the Local Government (Planning and Reporting) Regulations 2014 (the regulations). Both of these pieces of legislation came into operation on 18 April 2014.
Local GovernmentBetter Practice GuidePerformance Reporting Framework Indicator Workbook
11
measures in the annual report is prescribed by the Local Government Act 1989 (the Act) and the Local Government (Planning and Reporting) Regulations 2014.
Planning and accountability frameworkThe planning and accountability framework is found in part 6 of the Act and in the regulations. The legislation requires councils to prepare the following documents:
• a council plan within the period of six months after each general election or by 30 June, whichever is later
• a strategic resource plan for a period of at least four years and include this in the council plan
• a budget for each financial year
• an annual report in respect of each financial year.
Figure 5 shows the relationships between the key planning and reporting documents that make up the planning and accountability framework for local government. It also shows that there are opportunities for community and stakeholder input and feedback at each stage of the planning and reporting cycle. This is important to ensure accountability to residents and ratepayers.
Figure 5. Planning and accountability framework
12Local GovernmentBetter Practice GuidePerformance Reporting Framework Indicator Workbook

For further information on how reporting through the annual report works refer to:
• Department of Environment, Land, Water and Planning, Local Government Performance Statement Better Practice Guide, State of Victoria
• Department of Environment, Land, Water and Planning, Local Government Report of Operations Better Practice Guide, State of Victoria
• Department of Environment, Land, Water and Planning, Local Government Model Financial Report, State of Victoria
The LGPRF has been operationalised within the planning and accountability framework as follows:
• service performance indicators – service outcome indicators and measures be included in the budget and reported against in the performance statement in the annual report. All service performance indicators and measures should be reported in the report of operations in the annual report
• financial performance indicators – all financial performance indicators and measures be reported in the performance statement in the annual report
• sustainable capacity indicators – all sustainable capacity indicators be reported in the performance statement in the annual report
• governance and management indicators – the checklist be reported in the report of operations in the annual report.
The performance statement will be subject to audit by the Victorian Auditor-General’s Office (VAGO). Sufficient audit evidence will need to be provided to support the results and explanation of material variations.
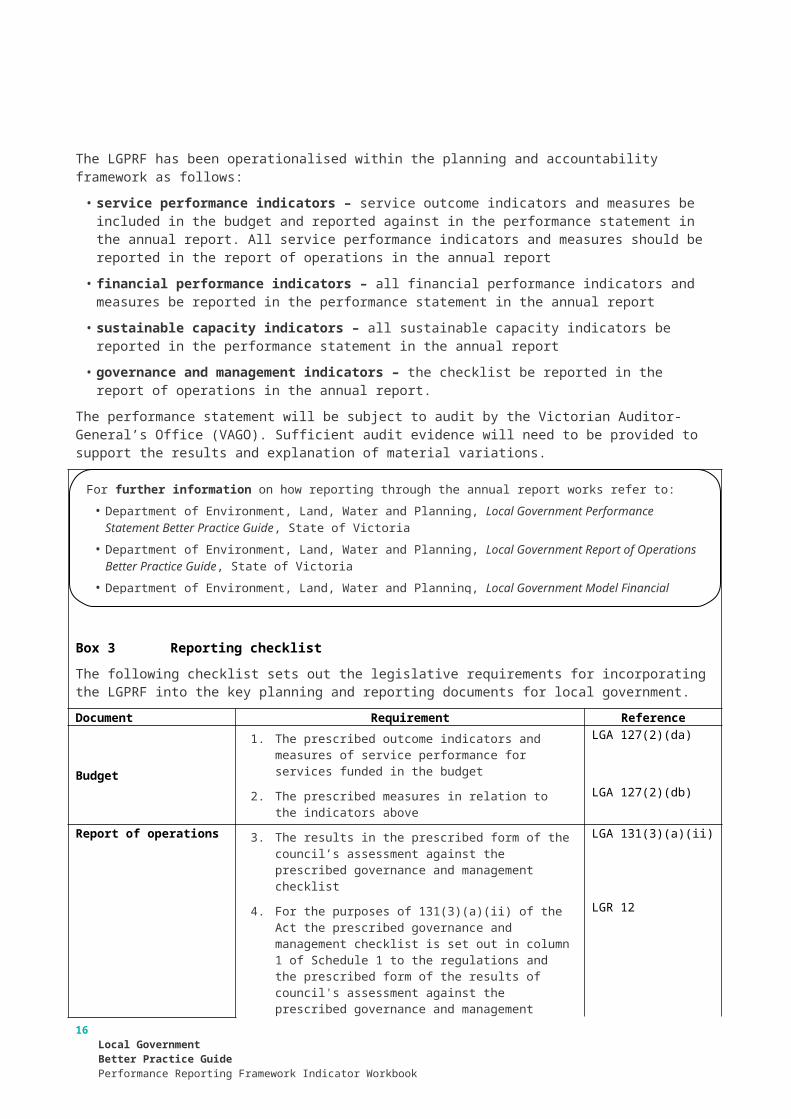
Box 3 Reporting checklist
The following checklist sets out the legislative requirements for incorporating the LGPRF into the key planning and reporting documents for local government.
Document Requirement Reference
Budget
1. The prescribed outcome indicators and measures of service performance for services funded in the budget
LGA 127(2)(da)
2. The prescribed measures in relation to the indicators above
LGA 127(2)(db)
Report of operations 3. The results in the prescribed form of the council’s assessment against the prescribed governance and management checklist
LGA 131(3)(a)(ii)
4. For the purposes of 131(3)(a)(ii) of the Act the prescribed governance and management checklist is set out in column 1 of Schedule 1 to the regulations and the prescribed form of the results of council's assessment against the prescribed governance and management checklist is set out in column 2 of Schedule 1 to the regulations
LGR 12
5. All prescribed indicators of service performance for the services provided by the council during that financial year and the prescribed measures relating to those indicators
LGA 131(3)(a)(iii)
6. Results achieved for that financial year in relation to the performance indicators and measures referred to above
LGA 131(3)(a)(iv)
LGR 13(1)
Local GovernmentBetter Practice GuidePerformance Reporting Framework Indicator Workbook
13

7. For the purposes of section 131(3)(a)(iii) and (iv) of the Act, the prescribed indicators of service performance and the prescribed measures relating to those indicators are set out in Schedule 2.
8. For the purposes of section 131(3)(a)(v) of the Act, the report of operations must contain the results achieved in relation to the performance indicators and measures under section 131(3)(a)(iv) of the Act and the corresponding results for the preceding 3 financial years and an explanation of any material variations between results referred to above
LGR 13(2)
Performance statement
9. For the services funded in the budget for the financial year reported on, the prescribed indicators of service performance required by the regulations to be reported against in the performance statement and the prescribed measures relating to those indicators
LGA 131(4)(a)(i)
10. For the purposes of section 131(4)(a)(i) of the Act, the prescribed indicators of service performance and the prescribed measures relating to those indicators are set out in Part 2 of Schedule 3 to the regulations
LGR 15(1)
11. The prescribed indicators of financial performance and the prescribed measures relating to those indicators
LGA 131(4)(a)(ii)
12. For the purposes of section 131(4)(a)(ii) of the Act, the prescribed indicators of financial performance and the prescribed measures relating to those indicators are set out in Part 3 of Schedule 3 to the regulations
LGR 15(2)
13. The prescribed indicators of sustainable capacity performance and the prescribed measures relating to those indicators
LGA 131(4)(a)(iii)
14. For the purposes of section 131(4)(a)(iii) of the Act, the prescribed indicators of sustainable capacity performance and the prescribed measures relating to those indicators are set out in Part 4 of Schedule 3 to the regulations
LGR 15(3)
15. Results achieved for that financial year in relation to those performance indicators and measures referred to above
LGA 131(4)(a)(iv)
16. For the purposes of section 131(4)(a) of the Act, the performance statement must contain the results achieved in the preceding 3 financial years that correspond to the results referred to in section 131(4)(a)(iv) of the Act.
LGR 16(1)
17. For the purposes of section 131(4)(a) of the Act, the performance statement must contain the results forecast by the council's strategic resource plan to be achieved in relation to the financial performance indicators and measures referred to in section 131(4)(a)(ii) of the Act.
LGR 16(2)
18. For the purposes of section 131(4)(a) of the Act, the performance statement must contain a description of the municipal district, including its size, location and population.
LGR 17(1)
19. For the purposes of section 131(4)(a) of the Act, the LGR 17(2)
14Local GovernmentBetter Practice GuidePerformance Reporting Framework Indicator Workbook

performance statement must contain an explanation of any material variations in the results contained in the performance statement under section 131(4)(a)(iv) of the Act and the corresponding results referred to in regulation 16(1).
20. For the purposes of section 131(4)(a) of the Act, the performance statement must contain an explanation of any material variations in the results contained in the performance statement under section 131(4)(a)(ii) of the Act and the forecast results referred to in regulation 16(2).
LGR 17(3)
LGA = Local Government Act 1989
LGR = Local Government (Planning and Reporting) Regulations 2014
Services funded in the budgetSection 127(2) of the Act requires the budget to contain the prescribed outcome indicators and measures of service performance for services funded in the budget. Where a council does not fund a service then it will not be required to disclose the applicable service performance outcome indicator in their budget. While this sounds straightforward, there are a number examples where councils make a contribution to a service (such as maternal child health) but the service is provided by a not-for-profit organisation directly funded through a service agreement with the relevant agency. The test in this case comes down to what is termed 'operational control'.
Operational control
To assist councils to determine whether they have operational control the following guidance is provided:
• if the service is asset dependent (for example, a pool) then the first test will be whether all the risks and rewards associated with owning the asset have been transferred away from the council. For example, this could be done through a lease agreement
• the second test relates to whether the council has significant influence over the service outcomes. That is, does the council have the capacity (ability or power) to substantially affect the service being provided. For example, this might be the case if despite the council making a financial contribution, decisions over the service outcomes rest with the funding agency.
There will be very limited situations where a council does not have operational control over the service and councils will need to review the service and other agreements in place to ensure that it is able to convince its auditors they do not have operational control.
1.9 Preparing the organisation for reportingCouncils are required to collect data from 1 July of the reporting period and report the results of the performance indicators and measures in their annual reports for that financial year. To facilitate this process, it is recommended that councils undertake the following steps:
• appoint a senior officer to coordinate the collection and reporting of performance data
• prepare a project plan, covering the period from 1 July to 30 September, which identifies key milestones, dates and responsibilities
Local GovernmentBetter Practice GuidePerformance Reporting Framework Indicator Workbook
15
• form a working group consisting of representatives from each of the nine service areas and a representative from the finance team to be responsible for collecting data for each of the measures including supporting evidence for those that are subject to audit
• brief the executive team, senior management team and the audit committee on the LGRPF, their roles and responsibilities and key milestones between commencement of data collection and reporting in the annual report
• collect data and report performance indicator results to the key groups above on a quarterly basis including the identification of issues for resolution.
Refer to the Local Government Performance Statement Better Practice Guide for more information.
1.10 LGPRF governanceLGV has established a steering committee for the LGPRF that oversees an annual program of review and continuous improvement to the LGPRF. The key responsibilities of the steering committee include:
• providing recommendations to LGV on the overarching framework, the set of indicators and content of reporting by councils and state
• resolving issues brought to it from working groups and sector consultation
• working to improve the comparability, quality and integrity of reported data
• recommending opportunities to streamline LGPRF data collections and reporting between the state and local governments
• seeking to maximise the accessibility to key stakeholders of the performance data.
The steering committee is chaired by the Executive Director of LGV and meets twice a year.
2. About this workbook
2.1 Structure of the workbook This workbook has been developed to support users in their understanding and use of the indicators and measures which make up the LGPRF. It contains:
• an overview of the aims, scope, methodology and legislative framework that enables the LGPRF and guidance notes to support councils to prepare for reporting (section 1)
• descriptions, counting rules and definitions of key terms for each indicator and measure that make up the LGPRF (sections 3, 4 and 5)
• descriptions, counting rules and definitions of key terms for each item that make up the governance and management checklist in the LGPRF (section 6)
• descriptions, counting rules and definitions of key terms for each optional indicator and measure (section 7)
• guidance on using the Performance Reporting Template which is used for uploading and reporting LGPRF data to the ‘Know Your Council’ website (section 8).
This information is provided for council’s use, to ensure the consistency, quality and accuracy of data provided as part of reporting against the LGPRF.
16Local GovernmentBetter Practice GuidePerformance Reporting Framework Indicator Workbook

2.2 How to read the indicator descriptions
GovernanceDefinition Provision of good governance to the community including
processes for making and implementing decisions with reference to community engagement, policy frameworks and practice and in compliance with relevant legislation
Objective To make and implement decisions in the best interests of the community
Dimension AppropriatenessIndicator TransparencyRationale Indicator of the broad objective that councils should make and
implement decisions in an open and transparent manner. High or increasing levels of transparency suggest an improvement in the appropriateness of decision-making
Measure 1. Council decisions made at meetings closed to the publicDefinition Defined as the percentage of council resolutions made at an
ordinary or special meeting of council, or at a meeting of a special committee consisting only of councillors, closed to the public under section 89(2) of the Act
Computation NumeratorNumber of council resolutions made at ordinary or special meetings of council, or at meetings of a special committee consisting only of councillors closed to the public
DenominatorNumber of council resolutions made at ordinary or special meetings of council or at meetings of a special committee consisting only of councillors
Value Data typeNumericFormatNNN.NPermissible values0.0 to 100.0 expressed as a percentageExpected range
0.0 to 25.0 percentData source Numerator
Council meeting minutes or council agenda system (e.g. InfoCouncil)DenominatorCouncil meeting minutes or council agenda system (e.g. InfoCouncil)
Audit Evidence
Other informationKey terms Administrators
Administrators appointed by the Minister for Local Government should be treated as councillors for the purposes of the governance measures
Notes Special committeeis a committee consisting only of councillors formed as per section 86(1)(a) of the Act
This is where KEY TERMS are defined. It is supported by NOTES which cover anything else that is relevant to reporting the indicator and measure
This is the DEFINITION of the serviceThis is the OBJECTIVE of the service
This is the DIMENSION of the service in accordance with the service performance framework
This is the INDICATOR of the service which is “what” is being measured. It is supported by a RATIONALE
This is the MEASURE and is “how” the indicator is to be measured. It is supported by a DEFINITION
This is the COMPUTATION or how the measure is calculated in terms of the numerator and denominator. It is supported by the VALUE which includes the type of data, format, permissible values and the expected result (or the normal range for results). It is also supported by the DATA SOURCE which indicates where the data can be found and the AUDIT EVIDENCE required for those indicators that form part of the performance statement
Local GovernmentBetter Practice GuidePerformance Reporting Framework Indicator Workbook
17

3. Service performance indicators
Aquatic facilities (AF)
Definition Provision of indoor and outdoor aquatic facilities to the community and visitors for wellbeing, water safety, sport and recreation
Objective To provide safe, accessible and well utilised facilities
Effectiveness
Efficiency
Outputs Outcomes
Appropriateness
Quality
Cost
Satisfaction
Service standard
Service cost
AF1 User satisfaction with aquatic facility
(optional)
AF4 Cost of indoor aquatic facilities
Utilisation
AF6 Utilisation of aquatic facilities
Service outcome
AF5 Cost of outdoor aquatic
facilities
AF2 Health inspections of
aquatic facilities
AF3 Reportable safety incidents at aquatic facilities
MeasureIndicatorDimensionKey:
Objective: To provide safe, accessible and well utilised facilities
Dimension Appropriateness
Indicator Satisfaction
Rationale Indicator of the broad objective that users should be satisfied with the aquatic facilities. High or increasing satisfaction suggests an improvement in the appropriateness of the aquatic facilities
Measure AF1 User satisfaction with aquatic facilities (optional)
Definition Defined as the satisfaction of users with the aquatic facilityThis is an optional measure as there is currently no standard survey instrument for measuring user satisfaction that allows for accurate comparisons
Computation NumeratorUser satisfaction with how council has performed on provision of aquatic facilitiesDenominatorNot applicable
Value Data typeNumericFormatNNNPermissible values0 to 100 expressed as a number
18Local GovernmentBetter Practice GuidePerformance Reporting Framework Indicator Workbook

Expected rangeNot applicable
Data source NumeratorNo data availableDenominatorNot applicable
Dimension Quality
Indicator Service standard
Rationale Indicator of the broad objective that aquatic facilities should be inspected by a qualified officer and safety incidents reported. High or increasing numbers of inspections suggests an improvement in the quality of the pool facilities
Measure AF2 Health inspections of aquatic facilities
Definition Defined as the number of inspections by an authorised officer within the meaning of the Public Health and Wellbeing Act 2008 carried out per Council aquatic facility
Computation NumeratorNumber of authorised officer inspections of Council aquatic facilitiesDenominatorNumber of Council aquatic facilities
Value Data typeNumericFormatNNN.NNPermissible valuesGreater than or equal to 0 expressed as a numberExpected range1.00 to 4.00 inspections
Data source NumeratorManual record (e.g. pool register), Health Management System (e.g. Health Manager)DenominatorAsset register
Measure AF3 Reportable safety incidents at aquatic facilities
Definition Defined as the number of WorkSafe reportable aquatic facility safety incidents
Computation NumeratorTotal number of WorkSafe reportable aquatic facility safety incidentsDenominatorNot applicable
Value Data typeNumericFormatNNN.NNPermissible valuesGreater than or equal to 0 expressed as a number
Local GovernmentBetter Practice GuidePerformance Reporting Framework Indicator Workbook
19

Expected range0 to 20.00 incidents
Data source NumeratorManual record (e.g. incident report, risk register)DenominatorNot applicable
Dimension Cost
Indicator Service cost
Rationale Indicator of the broad objective that the provision of aquatic facilities should be undertaken in a cost-efficient manner. Low or decreasing cost suggests an improvement in the cost-efficiency of the aquatic facility
Measure AF4 Cost of indoor aquatic facilities
Definition Defined as the direct cost less any income received of providing indoor aquatic facilities per visit
Computation NumeratorDirect cost of indoor aquatic facilities less income receivedDenominatorNumber of visits to indoor aquatic facilities
Value Data typeNumericFormatNNN.NNPermissible valuesLess than or greater than 0 expressed in dollarsExpected range-3.00 to 10.00 dollars
Data source NumeratorFinance system (e.g. TechnologyOne)DenominatorManual record (e.g. entrance counter), Pool management system (e.g. point of sale)
Measure AF5 Cost of outdoor aquatic facilities
Definition Defined as the direct cost of less any income received of providing outdoor aquatic facilities per visit
Computation NumeratorDirect cost of outdoor aquatic facilities less income receivedDenominatorNumber of visits to outdoor aquatic facilities
Value Data typeNumericFormatNNN.NNPermissible values
20Local GovernmentBetter Practice GuidePerformance Reporting Framework Indicator Workbook

Less than or greater than 0 expressed in dollarsExpected range3.00 to 20.00 dollars
Data source NumeratorFinance system (e.g. TechnologyOne)DenominatorManual record (e.g. entrance counter), Pool management system (e.g. point of sale)
Dimension Service outcome
Indicator Utilisation
Rationale Indicator of the broad objective that pools should be safe, accessible and well utilised. High or increasing utilisation of pool facilities suggests an improvement in the effectiveness of the aquatic facilities
Measure AF6 Utilisation of aquatic facilities (audited)
Definition Defined as the number of visits to aquatic facilities per head of municipal population
Computation NumeratorNumber of visits to aquatic facilitiesDenominatorMunicipal population
Value Data typeNumericFormatNNN.NNPermissible valuesGreater than 0 expressed as a numberExpected range1.00 to 10.00 visits
Data source NumeratorManual record (e.g. entrance counter), Pool management system (e.g. point of sale)DenominatorAustralian Bureau of Statistics – Catalogue 3218.0 Population Estimates by Local Government Area
Audit EvidenceCopy of supporting report from the pool receipting system. This could include: swim membership visits gym memberships visits point of sale for casual swimmers door counter reports.Documented source of municipal population estimate, such as Australian Bureau of Statistics census data (e.g. Catalogue 3218.0 Population Estimates by Local Government Area) plus the basis for any growth assumptions adopted by Council.Other advice
Local GovernmentBetter Practice GuidePerformance Reporting Framework Indicator Workbook
21

Councils will often have to seek information from aquatic facility operators. Where the operator is a third party, the supporting evidence should be in the form of the source data, not merely an advisory email.
Other information
Key terms Corporate overheadsIs costs associated with supporting the delivery of the service. Examples include: payroll human resources finance (including financial and management accounting, purchasing,
accounts payable and accounts receivable) information technologyDirect cost ( less income received) – In-house facility Is operating expenses net of operating income directly related to the delivery of the aquatic facility. Operating expenses includes salaries and oncosts, agency and contract staff, training and development, contractors, materials, maintenance, utilities, travel and vehicle/plant hire costs, phones, computer costs (where they are specific to the service) and other incidental expenses. It does not include capital purchases such as vehicles or equipment or capital renewal of facilities. Indirect costs such as depreciation and management/corporate overheads are specifically excluded. Management overheads may be included where an employee is involved in the direct delivery of the service. In the case of an employee covering for leave, this should be included only if the leave is being covered by a temporary employee (i.e. casual, agency). Operating income includes fees and charges from users of the facility. For aquatic facilities that run at a surplus, the net direct cost will be net direct income.Direct cost ( less income received) – Outsourced facility Where the aquatic facility has been outsourced to an external provider the net direct cost is the contract payment less any income received by the council. In cases where the provider receives the income, the net direct cost will be the contract payment. For aquatic facilities that run at a surplus, the net direct cost will be net direct income.Health inspectionsIs an inspection of a council aquatic facility undertaken by an authorised officer as defined under section 3(1) of the Public Health and Wellbeing Act 2008. This should be counted per facility, not per individual pool.Indoor aquatic facilityIs a council operated facility that includes at least one covered wet area for swimming and/or water play and is available for use all year round. The facility may also include an outdoor pool and dry areas (e.g. gymnasiums). An outdoor facility that is available all year round would also meet the definition of an indoor facility. It excludes facilities where council does not have operational control (see page 17) or is operated on a seasonal basis.Management overheadsIs employee costs associated with overseeing or managing the service. Examples might include a proportion of: chief executive officer general manager/director supervisor team leader administration staff
22Local GovernmentBetter Practice GuidePerformance Reporting Framework Indicator Workbook

Outdoor aquatic facilityIs a council operated facility that includes at least one uncovered wet area for swimming and/or water-play, is operated on a seasonal basis and not part of an indoor aquatic facility. An indoor facility that is operated on a seasonal basis would also meet the definition of an outdoor facility. It excludes facilities where council does not have operational control (see page 17) or is available for use all year round.VisitIs a visit to an indoor or outdoor aquatic facility in person. It also includes attendees at carnivals.WorkSafe reportable incidentsThis includes both employees and visitors and should only count those incidents which occur in relation to those using aquatic facilities in multipurpose centres. Employers, occupiers and persons in charge must report the following incidents to WorkSafe Victoria under Part 5 of the Occupational Health and Safety Act 2004: deaths and life-threatening injuries; a person requires medical treatment after exposure to a substance as an inpatient in hospital for a serious injury such as an amputation, a head or eye injury, electric shock, spinal injuries or serious laceration; and incidents such as registered or licensed plant that has collapsed, overturned, failed or malfunctioned, the collapse of an excavation supporting an excavation, the collapse of a building or structure an implosion, explosion or fire, incidents involving Dangerous Goods or if plant or an object falls from high places.
Notes Closures of aquatic facilitiesWhere an aquatic facility is closed for part of the year other than for seasonal purposes (e.g. redevelopment) the indicators and measures should be reported for the period the facility is open and an explanation provided in the Report of Operations and/or Performance StatementHealth inspections of aquatic facilitiesOther than the requirement for health inspections to be undertaken by an authorised officer, it is up to each council to determine the content, conduct and frequency of inspections. The Department of Health and Human Services has developed an ‘Aquatic Facility Inspection Checklist’ to assist councils to determine what constitutes a health inspection of an aquatic facility. The checklist is available online via the following link: https://www2.health.vic.gov.au/about/publications/researchandreports/Aquatic%20facility%20inspection%20checklist
Local GovernmentBetter Practice GuidePerformance Reporting Framework Indicator Workbook
23

Animal management (AM)
Definition Provision of animal management and responsible pet ownership services to the community including monitoring, registration, enforcement and education
Objective To protect the health and safety of animals, humans and the environment
Effectiveness
Efficiency
Outputs Outcomes
Appropriateness
Quality
Cost
Timeliness
Service standard
Service cost
AM1 Time taken to action animal
management requests
Health and safety
AM4 Animal prosecutions
Service outcome
AM3 Cost of animal
management service
AM2 Animals reclaimed
MeasureIndicatorDimensionKey:
Objective: To protect the health and safety of animals, humans and the environment
Dimension Appropriateness
Indicator Timeliness
Rationale Indicator of the broad objective that councils should act in response to animal management related requests in a timely manner. Low or decreasing time suggests an improvement in the appropriateness animal management
Measure AM1 Time taken to action animal management requests
Definition Defined as the average number of days it has taken for Council to action animal management related requests
Computation NumeratorNumber of days between receipt and first response action for all animal management requestsDenominatorNumber of animal management requests
Value Data typeNumericFormatNNN.NNPermissible valuesGreater than 0 expressed as a numberExpected range1.00 to 10.00 days
Data source NumeratorCustomer request system (e.g. Pathway)
24Local GovernmentBetter Practice GuidePerformance Reporting Framework Indicator Workbook

DenominatorCustomer request system (e.g. Pathway)
Dimension Quality
Indicator Service standard
Rationale Indicator of the broad objective that councils should register all animals in the municipality in accordance with the Domestic Animals Act 1994. High or increasing number of animals registered suggests an improvement in the quality of the animal management service
Measure AM2 Animals reclaimed
Definition Defined as the percentage of collected registrable animals under the Domestic Animals Act 1994 reclaimed
Computation NumeratorNumber of animals reclaimedDenominatorNumber of animals collected
Value Data typeNumericFormatNNN.NNPermissible values0 to 100.00 expressed as a percentageExpected range30.00 to 90.00 percent
Data source NumeratorManual record (e.g. pound records)DenominatorRates system (e.g. Pathway)
Dimension Cost
Indicator Service cost
Rationale Indicator of the broad objective that the animal management service should be delivered in a cost-efficient manner. Low or decreasing cost suggests an improvement in the cost-efficiency of the animal management service
Measure AM3 Cost of animal management service
Definition Defined as the direct cost of the animal management service per registrable animal under the Domestic Animals Act 1994
Computation NumeratorDirect cost of the animal management serviceDenominatorNumber of registered animals
Value Data typeNumericFormatNNN.NN
Local GovernmentBetter Practice GuidePerformance Reporting Framework Indicator Workbook
25

Permissible valuesGreater than 0 expressed in dollarsExpected range10.00 to 70.00 dollars
Data source NumeratorFinance system (e.g. TechnologyOne)DenominatorAnimal management system (e.g. Pathway)
Dimension Service outcome
Indicator Health and safety
Rationale Indicator of the broad objective that the animal management service should protect the health and safety of animals, humans and the environment. Low or decreasing number of successful animal prosecutions suggests an improvement in the effectiveness of the animal management service
Measure AM4 Animal management prosecutions (audited)
Definition Defined as the number of successful animal management prosecutions
Computation NumeratorNumber of successful animal management prosecutionsDenominatorNot applicable
Value Data typeNumericFormatNNN.NNPermissible valuesGreater than or equal to 0 expressed as a numberExpected range0 to 50.00 prosecutions
Data source NumeratorManual record (e.g. advice from Magistrate Court)DenominatorNot applicable
Audit EvidenceCouncil record of: prosecutions outcomes of prosecutionsOther adviceThe record should be supported by copies of prosecutor’s file correspondence (whether the prosecutor is internal or external to Council) to support the success of the outcome
Other information
Key terms AnimalIs a cat or dog and excludes livestock. This is also referred to as a registrable animal as defined under the Domestic Animals Act 1994.
26Local GovernmentBetter Practice GuidePerformance Reporting Framework Indicator Workbook

Animal management requestIs any request received from a member of the public (written or verbal) in regard to Council’s animal management service.CollectedIs all animals (registered and unregistered, including feral animals) impounded by an authorised officer (or a person/organisation authorised to collect animals on Council’s behalf). This includes animals presented to authorised officers by members of the public.Corporate overheadsIs costs associated with supporting the delivery of the service. Examples include: payroll human resources finance (including financial and management accounting, purchasing,
accounts payable and accounts receivable) information technologyDaysIs the cumulative gross number of 24 hour days, including weekends and public holidays, from the date the animal management request is received until the date of the first response action. If the request is responded to in less than 24 hours, the time taken is counted as one day; if the request is responded to in more than 24 hours, it should be counted as two days, etc. For example, if 25 of the animal management requests were actioned in the first 24 hour period and the other 25 were actioned in second 24 hour period then the numerator would be 75 (25x1) plus (25x2).Direct costIs operating expenses directly related to the delivery of the animal management service. This includes expenses such as salaries and oncosts, agency and contract staff, training and development, contractors, materials, maintenance, travel and vehicle/plant hire costs, phones, computers costs (where they are specific to the service) and other incidental expenses. It does not include capital purchases such as vehicles or equipment. Indirect costs such as depreciation and management/corporate overheads and income from fees and charges are specifically excluded. Management overheads may be included where an employee is involved in the direct delivery of the service. In the case of an employee covering for leave, this should be included only if the leave is being covered by a temporary employee (i.e. casual, agency).First response actionIs the first action taken in responding to the request and would include contacting the caller or actioning the request where sufficient information has been collected.Management overheadsIs employee costs associated with overseeing or managing the service. Examples might include a proportion of: chief executive officer general manager/director supervisor team leader administration staffReceipt of animal management requestIs the point in time when the request is first received by the council.ReclaimedIs an animal that has been collected or collected and impounded by an authorised
Local GovernmentBetter Practice GuidePerformance Reporting Framework Indicator Workbook
27

officer (or a person/organisation authorised to collect animals on Council’s behalf) and is deemed registered upon return to its owner.Registered animalIs an animal which has been recorded on the Council’s animal register.Successful animal management prosecutionsIs any charge (excluding unpaid fines) brought by Council under the Domestic Animals Act 1994 against a defendant and found in favour of Council in a court of law, or where successfully appealed, in the appeal court. Where a group of charges is brought against a defendant, the group should be counted as one prosecution.
Notes Calculation of number of days between receipt and first response action for all animal management requestsThis is calculated by adding together the number of days to action each individual animal request for the year. For example, if there were 4 requests taking 3 days, 7 days, 1 day and 25 days respectively, the number of days would be 36 days.Separation of other service activitiesIn some councils, the animal management service may be part of a larger budget program which includes complementary activities such as local laws and parking enforcement. In these cases, it will be necessary to separate the costs of the various activities in order to calculate the service cost indicator. The following approach is suggested for allocating costs to activities: specific costs – Identify costs which are specific to each activity such as staff,
consultants, vehicles and the like and allocate across activities shared costs – For the remaining costs which are shared between activities,
these need to be allocated on the basis of an appropriate driver. For example, EFTs can be used as a driver for most shared costs where there is a connection between the cost and the work of the staff. Where staff work across activities, an estimate of the time spent on each activity (expressed as a percentage) will need to be made. This can be done through timesheets either on an ongoing basis or for a temporary time period provided it is representative of actual activity and workload
28Local GovernmentBetter Practice GuidePerformance Reporting Framework Indicator Workbook

Food safety (FS)
Definition Provision of food safety services to the community including registrations, education, monitoring, inspections and compliance
Objective To protect public health by preventing the sale of unsafe food
Effectiveness
Efficiency
Outputs Outcomes
Appropriateness
Quality
Cost
Timeliness
Service standard
Service Cost
FS1 Time taken to action food complaints
FS2 Food safety assessments
FS3 Cost of food safety service
Health and safety
FS4 Critical and major non-compliance notifications
Service outcome
MeasureIndicatorDimensionKey:
Objective: To protect public health by preventing the sale of unsafe food
Dimension Appropriateness
Indicator Timeliness
Rationale Indicator of the broad objective that councils should take action in response to food complaints in a timely manner. Low or decreasing time suggests an improvement in the appropriateness of actioning food complaints
Measure FS1 Time taken to action food complaints
Definition Defined as the average number of days it has taken for Council to action food complaints received from members of the public about the safety or handling of food for sale
Computation NumeratorNumber of days between receipt and first response action for all food complaintsDenominatorNumber of food complaints
Value Data typeNumericFormatNNN.NNPermissible valuesGreater than 0 expressed as a numberExpected range1.00 to 10.00 days
Data source NumeratorCustomer request system (e.g. Pathway)
Local GovernmentBetter Practice GuidePerformance Reporting Framework Indicator Workbook
29

DenominatorCustomer request system (e.g. Pathway)
Dimension Quality
Indicator Service standard
Rationale Indicator of the broad objective that the food safety service should be provided in accordance with legislative requirements. High or increasing compliance suggests an improvement in the quality of the food safety service
Measure FS2 Food safety assessments
Definition Defined as the percentage of registered class 1 food premises and class 2 food premises that receive an annual food safety assessment
Computation NumeratorNumber of registered class 1 food premises and class 2 food premises that receive an annual food safety assessment in accordance with the Food Act 1984DenominatorNumber of registered class 1 food premises and class 2 food premises that require an annual food safety assessment in accordance with the Food Act 1984
Value Data typeNumericFormatNNN.NNPermissible values0 to 100.00 expressed as a percentageExpected range50.00 to 100.00
Data source NumeratorHealth management system (e.g. Health Manager, Streatrader)DenominatorHealth management system (e.g. Health Manager, Streatrader)
Dimension Cost
Indicator Service cost
Rationale Indicator of the broad objective that the food safety service should be delivered in a cost-efficient manner. Low or decreasing cost suggests an improvement in the cost-efficiency of the food safety service
Measure FS3 Cost of food safety service
Definition Defined as the direct cost of the food safety service per food premises registered by Council, or for which Council has received notification, during the year
Computation NumeratorDirect cost of the food safety serviceDenominatorNumber of food premises registered or notified in accordance with the Food Act 1984
Value Data typeNumeric
30Local GovernmentBetter Practice GuidePerformance Reporting Framework Indicator Workbook

FormatNNN.NNPermissible valuesGreater than 0 expressed in dollarsExpected range300.00 to 1,200.00 dollars
Data source NumeratorFinance system (e.g. TechnologyOne)DenominatorHealth management system (e.g. Health Manager, Streetrader)
Dimension Service outcome
Indicator Health and safety
Rationale Indicator of the broad objective that the food safety service should protect public health by preventing the sale of unsafe food. Low or decreasing number of public health notifications, or a high follow up by council, suggests an improvement in the effectiveness of the food safety service
Measure FS4 Critical and major non-compliance outcome notifications (audited)
Definition Defined as the percentage of critical and major non-compliance outcome notifications that are followed up by Council
Computation NumeratorNumber of critical non-compliance outcome notifications and major non-compliance outcome notifications about a food premises followed upDenominatorNumber of critical non-compliance outcome notifications and major non-compliance outcome notifications about food premises
Value Data typeNumericFormatNNN.NNPermissible values0 to 100.00 expressed as a percentageExpected range60.00 to 100.00 percent
Data source NumeratorHealth management system (e.g. Health Manager, Streatrader)DenominatorHealth management system (e.g. Health Manager, Streatrader)
Audit EvidenceCouncil log of food safety assessments, inspections and follow up visitsCopies of notices from auditors or Environmental Health Officers under section 19N(3) and (4) of the Food Act 1984, and certificates confirming non-compliance notified under section 19N(3) has been remediedCopies of inspection documentation for follow up visitsData reported to the Department of Health
Local GovernmentBetter Practice GuidePerformance Reporting Framework Indicator Workbook
31
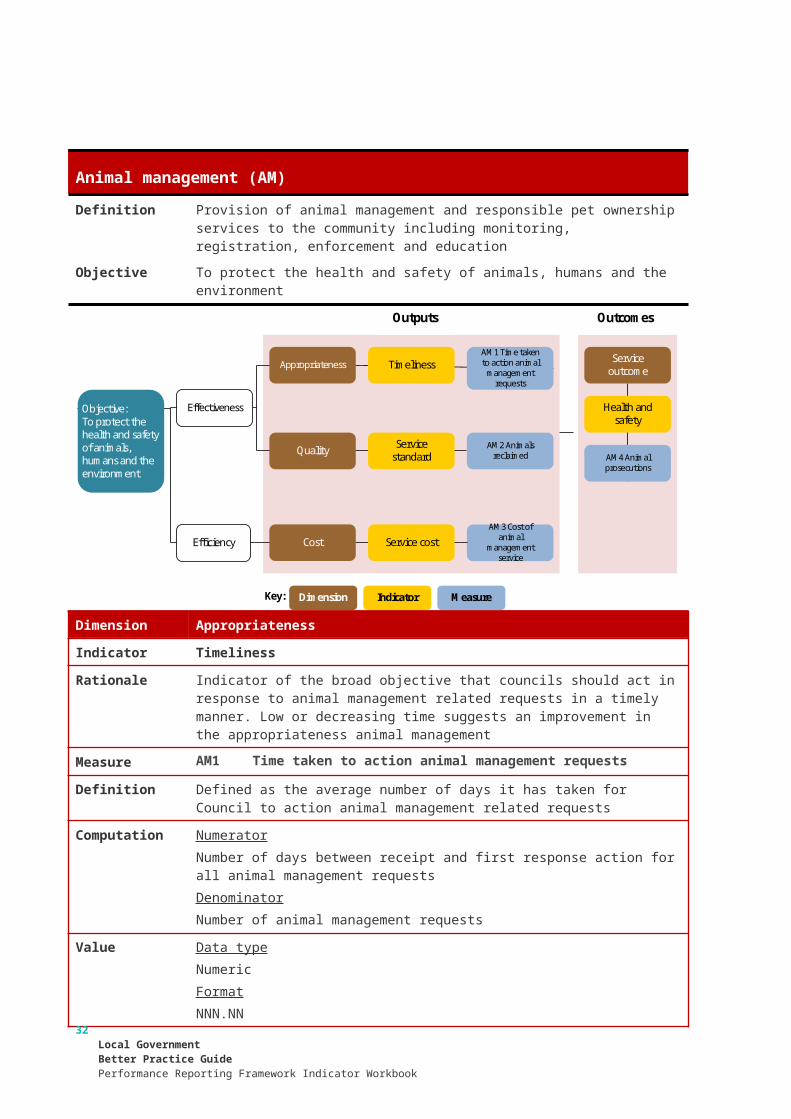
Coding of inspections as against the Department of Health Guide to recording and reporting Food Act activities, especially codes 1212 and 1220Other adviceCouncil should ensure that where a non-compliance outcome notification requires multiple follow-up visits, the follow-up visits are not double-counted in the reporting of follow up of an individual non-compliance notificationIf there is doubt as to the correct follow up action to take, refer to Department of Health guidance about the Food Act 1984.
Other information
Key terms Corporate overheadsIs costs associated with supporting the delivery of the service. Examples include: payroll human resources finance (including financial and management accounting, purchasing,
accounts payable and accounts receivable) information technologyCritical non-compliance outcome notificationIs a notification received by Council under section 19N(3) or (4) of the Food Act 1984, or advice given to Council by an authorised officer under that Act, of a deficiency that poses an immediate serious threat to public health and must be followed up by the Council. This includes situations where there is a serious risk of food being sold that is unsafe to eat. Each case must be examined on its merits, in deciding what outcome to assign to a compliance check.DaysIs the cumulative gross number of 24 hour days, including weekends and public holidays, from the date the food safety request is received until the date of the first response action. If the request is responded to in less than 24 hours, the time taken is counted as one day; if the request is responded to in more than 24 hours, it should be counted as two days, etc. For example, if 25 of the food safety requests were actioned in the first 24 hour period and the other 25 were actioned in second 24 hour period then the numerator would be 75 (25x1) plus (25x2).Direct costIs operating expenses directly related to the delivery of the food safety service. This includes expenses such as salaries and oncosts, agency and contract staff, training and development, contractors, materials, maintenance, travel and vehicle/plant hire costs, phones, computers costs (where they are specific to the service) and other incidental expenses. It does not include capital purchases such as vehicles or equipment. Indirect costs such as depreciation and management/corporate overheads and income from fees and charges are specifically excluded. Management overheads may be included where an employee is involved in the direct delivery of the service. In the case of an employee covering for leave, this should be included only if the leave is being covered by a temporary employee (i.e. casual, agency). Direct cost is calculated by financial year.First response actionIs the first action taken in responding to the request and should include as a minimum contacting the caller or actioning the request where sufficient information has been collectedFollow upFollow up of a critical non-compliance outcome notification or a major non-compliance outcome notification will normally involve council inspecting the premises. It can include council verifying that a non compliance, which was
32Local GovernmentBetter Practice GuidePerformance Reporting Framework Indicator Workbook
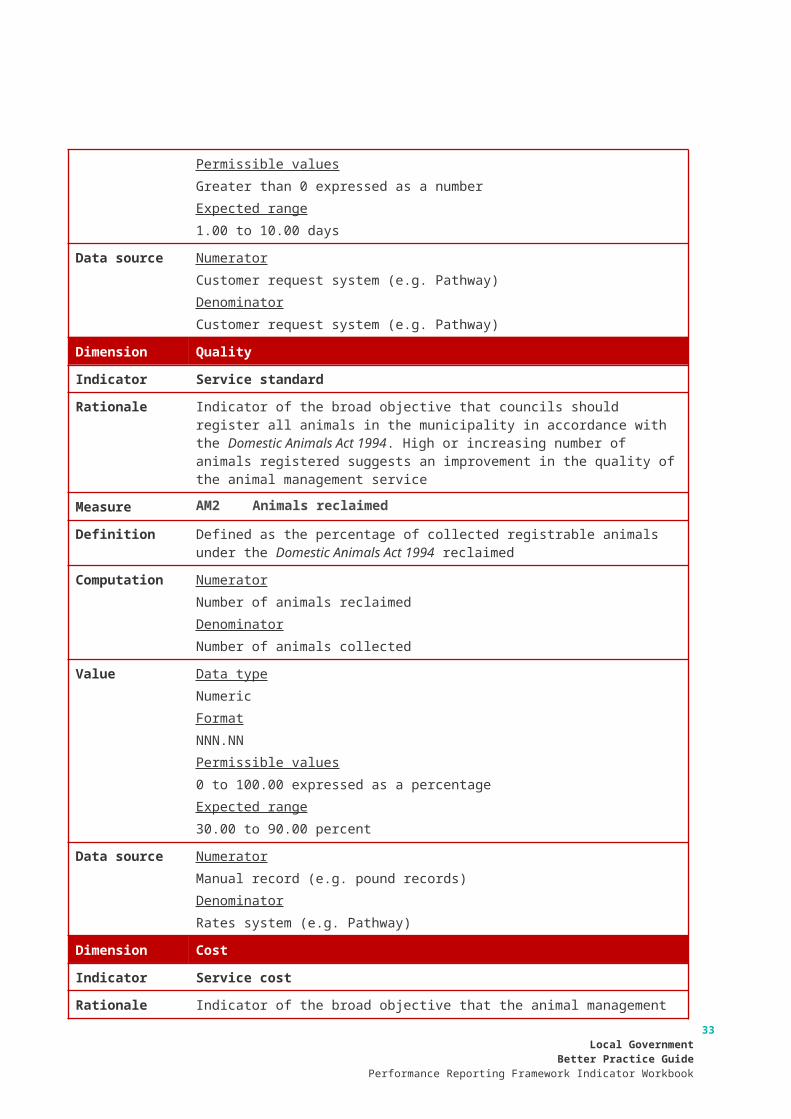
originally detected at the initial audit phase by an auditor or authorised officer (and notified to council under section 19N(3) of the Food Act) has been remedied by the business. In this case, council must receive written confirmation of this fact from the auditor or authorised officer. Where a non-compliance outcome notification requires multiple follow up visits, only the first follow up visit is to be counted. The subsequent follow up visits should not be counted.Food complaintIs a complaint received from a member of the public (written or verbal) about the safety or handling of food sold at a food premises. This can include complaints about the state of equipment or the premises at which the food is sold or handled that may be a contravention of the Food Act 1984. Examples include a health risk such as suspected food poisoning, foreign object in a food, food that cannot be eaten because it is unfit for human use, damaged food containers, packaged foods without proper labelling, unclean food businesses, uncontained rubbish, or poor or questionable food handling procedures. It does not include complaints about food that do not relate to a potential breach of the Food Act 1984.Food premisesIs any food premises (i.e. fixed, mobile, temporary) at, on or from which food is sold, or handled with the intention that it be sold and includes the following classes: Class 1: hospitals, child care centres and listed facilities for the aged, at which ready-to-eat potentially hazardous food is served; Class 2: other premises that handle potentially hazardous unpackaged foods; Class 3: premises handling unpackaged low risk foods, selling potentially hazardous pre-packaged foods, or the warehousing or distribution of pre-packaged foods; and Class 4: premises that only retail pre-packaged low risk foods, and certain other low risk or occasional activities. It also includes premises registered in the municipality and on the state wide ‘Streatrader’ system (e.g. food vans).Food safety assessmentIs an assessment under section 19HA(1) of the Food Act 1984 of all class 1 food premises and class 2 food premises with a standard food safety program to determine whether the food safety requirements applying to the premises have been complied with and in the case of a class 2 premises using a standard food safety program, whether the food safety program complies with section 19DC(2) of the Food Act 1984. The class of food premises is published by the Secretary in the Government Gazette under section 19C of the Food Act 1984. Only premises that require a food safety assessment should be assessed (i.e. the numerator and denominator need to match), and as such temporary food premises should be excluded from the calculation of FS2 – Food Safety Assessments.Major non-compliance outcomeIs a notification received by a Council under section 19N(3) or (4) of the Food Act 1984, or advice given to Council by an authorised officer under that Act, if it relates to a deficiency that does not pose an immediate serious threat to public health but which may do so if no remedial action is taken and must be followed up by the council.Typically, auditor or authorised officer notifications that fall into this category will be received under section 19N(4) at the conclusion of the audit process.A number of major non-compliances may result in the outcome of the compliance check being categorised as critical, if when taken together they pose an immediate serious threat to public health. Judgement must be exercised about whether non-compliances detected amount to a critical or major non-compliance.Management overheadsIs employee costs associated with overseeing or managing the service. Examples might include a proportion of: chief executive officer
Local GovernmentBetter Practice GuidePerformance Reporting Framework Indicator Workbook
33

general manager/director supervisor team leader administration staff
Notes Calculation of number of days between receipt and first response action for all food complaintsThis is calculated by adding together the number of days to action each individual food safety notification for the year. For example, if there were 4 requests taking 3 days, 7 days, 1 day and 25 days respectively, the numerator would be 36 daysReporting period for Food Safety indicatorsThe reporting period for FS1 – Time taken to action food complaints, FS2 - Food safety assessments and FS4 – Critical and major non-compliance outcome notifications should be aligned to the last full calendar year (i.e. For the 2016-17 annual report the 2016 calendar year should be reported). This will ensure greater consistency across council registration periods for food premises, and that FS2 lines up with the DHHS Annual Report, which is based on a calendar year (Section 7 of the Food Act 1984). FS3 – Cost of food safety service, should be reported by financial year, due to budgetary reporting requirements.Separation of other service activitiesWhere the food safety service is part of a larger budget program including complementary activities such as environmental health and immunisation, it will be necessary to separate the costs of the various activities in order to calculate the service cost indicator. The following approach is suggested for allocating costs to activities: specific costs – Identify costs which are specific to each activity such as staff,
consultants, vehicles and the like and allocate across activities shared costs – For the remaining costs which are shared between activities,
these need to be allocated on the basis of an appropriate driver. For example, EFTs can be used as a driver for most shared costs where there is a connection between the cost and the work of the staff. Where staff work across activities, an estimate of the time spent on each activity (expressed as a percentage) will need to be made. This can be done through timesheets either on an ongoing basis or for a temporary time period provided it is representative of actual activity and workload
Treatment of temporary food premisesIn the case of a temporary food premises not requiring an annual food safety assessment (i.e. sausage sizzles), the premises should only be included in indicators FS1, FS3 and FS4. They are excluded from FS2 as they do not require an annual assessment. The calculation for FS3 Cost of Food Safety Service if a registration/notification is received in that year. In years where council does not receive a registration/notification from a temporary premises, it should be excluded from this calculation as it would not incur a cost to councils.Timing of non-compliance outcome notificationsIt is likely that some non-compliance outcome notifications will be received in one calendar year and followed up in another. For example, a notification might be received in December but not followed up until January. Therefore, to ensure that there is proper matching between the numerator and denominator for this measure, notifications received in December should not be counted in the denominator if they are followed up after 1 January. They should be counted (matched) in the following calendar year.
34Local GovernmentBetter Practice GuidePerformance Reporting Framework Indicator Workbook

Governance (G)
Definition Provision of good governance to the community including making and implementing decisions with reference to community engagement, policy frameworks and agreed practice and in compliance with relevant legislation
Objective To make and implement decisions in the best interests of the community
Effectiveness
Efficiency
Outputs Outcomes
Appropriateness
Quality
Cost
Transparency
Engagement
Attendance
Service Cost
G1 Council decisions made at meetings closed to
the public
G2 Satisfaction with community consultation and
engagement
G3 Councillor attendance at
meetings
G4 Cost of governance
Satisfaction
G5 Satisfaction with council
decisions
Service outcome
MeasureIndicatorDimensionKey:
Objective: To make and implement decisions in the best interests of the community
Dimension Appropriateness
Indicator Transparency
Rationale Indicator of the broad objective that councils should make decisions at an ordinary or special meeting of council, or at a meeting of a special committee consisting only of councillors, in an open and transparent manner. High or increasing levels of transparency suggest an improvement in the appropriateness of decision-making
Measure G1 Council decisions made at meetings closed to the public
Definition Defined as the percentage of council resolutions made at an ordinary or special meeting of council, or at a meeting of a special committee consisting only of councillors, closed to the public under section 89(2) of the Act
Computation NumeratorNumber of council resolutions made at ordinary or special meetings of council, or at meetings of a special committee consisting only of councillors closed to the publicDenominatorNumber of council resolutions made at ordinary or special meetings of council or at meetings of a special committee consisting only of councillors
Value Data typeNumeric
Local GovernmentBetter Practice GuidePerformance Reporting Framework Indicator Workbook
35

FormatNNN.NNPermissible values0 to 100.00 expressed as a percentageExpected range0 to 30.00 percent
Data source NumeratorCouncil meeting minutes or council agenda system (e.g. InfoCouncil)DenominatorCouncil meeting minutes or council agenda system (e.g. InfoCouncil)
Indicator Consultation and engagement
Rationale Indicator of the broad objective that councils should make and implement decisions with community input. High or increasing levels of consultation and engagement suggests an improvement in the appropriateness of decisions
Measure G2 Satisfaction with community consultation and engagement
Definition Defined as the community satisfaction rating out of 100 with the consultation and engagement efforts of the council. This includes consulting and engaging directly with the community on key local issues requiring decisions by council
Computation NumeratorCommunity satisfaction rating out of 100 with how council has performed on community consultation and engagementDenominatorNot applicable
Value Data typeNumericFormatNNNPermissible values0 to 100 expressed as a numberExpected range40 to 70
Data source NumeratorCommunity Satisfaction Survey – Local Government VictoriaDenominatorNot applicable
Dimension Quality
Indicator Attendance
Rationale Indicator of the broad objective that councillors should represent the views of their constituents and allow decisions to take place by attending meetings. High or increasing levels of attendance suggest an improvement in the quality of decisions
Measure G3 Councillor attendance at council meetings
Definition Defined as the percentage of attendance at ordinary and special council meetings by councillors
36Local GovernmentBetter Practice GuidePerformance Reporting Framework Indicator Workbook

Computation NumeratorThe sum of the number of councillors who attended each ordinary and special council meetingDenominator *(Number of ordinary and special council meetings) x (Number of councillors elected at the last council general election)
* Note: these figures should be entered separately in the Performance Reporting Template
Value Data typeNumericFormatNNN.NNPermissible values0 to 100.00 expressed as a percentageExpected range80.00 to 100.00 percent
Data source NumeratorCouncil meeting minutes or council agenda system (e.g. InfoCouncil)DenominatorCouncil meeting minutes or council agenda system (e.g. InfoCouncil)
Dimension Cost
Indicator Service cost
Rationale Indicator of the broad objective that councils should deliver their governance service in a cost-efficient manner. Low or decreasing costs of governance suggests an improvement in the cost-efficiency of the governance function
Measure G4 Cost of governance
Definition Defined as the direct cost of delivering council’s governance service per councillor
Computation NumeratorDirect cost of the governance serviceDenominatorNumber of councillors elected at the last council general election
Value Data typeNumericFormatNNN.NNPermissible valuesGreater than 0 expressed in dollarsExpected range30,000.00 to 80,000.00 dollars
Data source NumeratorFinance system (e.g. TechnologyOne)DenominatorCouncil minutes
Local GovernmentBetter Practice GuidePerformance Reporting Framework Indicator Workbook
37

Dimension Service outcome
Indicator Satisfaction
Rationale Indicator of the broad objective that councils should make and implement decisions in the best interest of the community. High or increasing satisfaction suggests an improvement in the effectiveness of decisions
Measure G5 Satisfaction with council decisions (audited)
Definition Defined as the community satisfaction rating out 100 with how council has performed in making decisions in the interest of the community
Computation NumeratorCommunity satisfaction rating out of 100 with the performance of council in making decisions in the interest of the communityDenominatorNot applicable
Value Data typeNumericFormatNNNPermissible values0 to 100 expressed as a numberExpected range40 to 70
Data source NumeratorCommunity Satisfaction Survey – Local Government VictoriaDenominatorNot applicable
Audit EvidenceCopy of Community Satisfaction Survey resultsOther adviceIf council subscribes to the Local Government Victoria conducted Community Satisfaction Survey, council should ensure the questions asked in the survey include this indicatorIf council conducts its own community satisfaction survey, either directly or through council-appointed consultants, the survey sampling and methodology used should be consistent with the methodology adopted by Local Government Victoria (outlined in Practice Note 2 - Conduct of Community Satisfaction Survey) to ensure consistency between councils. Evidence collated to support the data should include: the instructions provided for the conduct of the survey the sampling methodology and results, demonstrating that the sample of
residents surveyed was statistically valid and representative of council’s residents
the survey methodology and results
Other information
Key terms Corporate overheadsIs costs associated with supporting the delivery of the service. Examples include:
38Local GovernmentBetter Practice GuidePerformance Reporting Framework Indicator Workbook

payroll human resources finance (including financial and management accounting, purchasing,
accounts payable and accounts receivable) information technologyCouncil meeting agenda itemIs a matter considered by council at an ordinary or special meeting of council, or at a meeting of a special committee consisting only of councillors requiring a resolution.Council resolutionIs the final majority decision of council or of a special committee consisting only of councillors in regard to an agenda item and excludes procedural motions.Direct costIs operating expenses directly related to the activities of the elected councillors. This includes expenses such as Councillor allowances, training and professional development, conferences and seminars, travel and vehicle/plant hire costs, phones, computer costs (where they are specific to the service), meals, child care, individual memberships and other incidental expenses. It also includes costs associated with Council’s role in the Chief Executive Officer employment relationship including recruitment, dismissal (excluding separation payments) and performance management where they are undertaken and approved by the Council. It does not include staff support costs, council election costs, civic events and functions or capital purchases such as vehicles or equipment. Indirect costs such as depreciation, management/corporate overheads are specifically excluded.Management overheadsIs employee costs associated with overseeing or managing the service. Examples might include a proportion of: chief executive officer general manager/director supervisor team leader administration staffNumber of councillors elected at the last council general electionPositions that become vacant due to resignations, death, failure to take the oath of office or going out of office under section 28(3) of the Act are to be counted in the total number of councillors elected at the last council general election. For example, if 9 councillors were elected at the last council general election and a vacancy is created due to resignation, this figure should remain as 9.Ordinary meetingIs a council meeting at which general business is transacted as per section 83(a) of the Act or a call of the council meeting under section 85 of the Act.Procedural motionIs a motion passed by council or of a special committee consisting only of Councillors other than the final majority decision. Examples include: a motion to amend an existing motion; or a motion to close the meeting to the public; or a motion to admit a notice of motion or general business itemSpecial committeeIs a committee consisting only of councillors or councillors and staff formed under section 86(1) of the Act.Special meeting
Local GovernmentBetter Practice GuidePerformance Reporting Framework Indicator Workbook
39

Is a council meeting at which the business specified in the notice calling the meeting is transacted as per section 83(b) and 85 of the Act.
Notes AdministratorsAdministrators appointed by the Minister for Local Government should be treated as councillors for the purposes of the governance measuresAttendance at council meetingsA councillor should be counted as having attended an ordinary or special council meeting where a councillor is late to a meeting, is on an approved leave of absence (ie. in the case of maternity leave) or a vacancy has been created due to resignations, death, failure to take the oath of office or going out of office under section 28(3) of the Act.Calculation of councillor attendance at meetingsThe following example is provided to assist officers calculate the measure ‘councillor attendance at meetings’.A council had the following attendance at its monthly council meetings by its nine elected councillors: July (nine); August (nine); September (eight); October (nine); November (seven); December (six); January (seven); February (nine); March (nine); April (eight plus 1 vacancy due to resignation); May (nine); and June (nine).Numerator: The sum of the number of councillors who attended each ordinary and special council meeting (100 being 99 plus one vacancy).Denominator (Number of ordinary and special council meetings) x (the number of councillors elected at the last council general election) (108)Result: 92.6%
40Local GovernmentBetter Practice GuidePerformance Reporting Framework Indicator Workbook

Libraries (LB)
Definition Provision of print and digital based resources to the community in a variety of formats including collection services, e-services, research tools and interactive learning programs
Objective To provide free, accessible and well utilised print and digital based resources
Effectiveness
Efficiency
Outputs Outcomes
Appropriateness
Quality
Cost
Utilisation
Resource standard
Service Cost
L1 Library collection usage
L2 Standard of library collection
L3 Cost of library service
Participation
L4 Active library members
Service outcome
MeasureIndicatorDimensionKey:
Objective: To provide free, accessible and well utilised print and digital based resources
Dimension Appropriateness
Indicator Utilisation
Rationale Indicator of the broad objective that library services should be well utilised. High or increasing utilisation suggests an improvement in the appropriateness of library services
Measure LB1 Library collection usage
Definition Defined as the number of library collection item loans per library collection item
Computation NumeratorNumber of library collection item loansDenominatorNumber of library collection items
Value Data typeNumericFormatNNN.NNPermissible valuesGreater than 0 expressed as a numberExpected range1.00 to 9.00 items
Data source NumeratorLibrary management system (e.g. Spydus)
Local GovernmentBetter Practice GuidePerformance Reporting Framework Indicator Workbook
41

DenominatorLibrary management system (e.g. Spydus)
Dimension Quality
Indicator Resource standard
Rationale Indicator of the broad objective that libraries should have a high standard of resources. High or increasing standard of resources suggests an improvement in the quality of resources
Measure LB2 Standard of library collection
Definition Defined as the percentage of the library collection that has been purchased in the last 5 years
Computation NumeratorNumber of library collection items purchased in the last 5 yearsDenominatorNumber of library collection items
Value Data typeNumericFormatNNN.NNPermissible values0 to 100.00 expressed as a percentageExpected range40.00 to 90.00 percent
Data source NumeratorLibrary management system (e.g. Spydus)DenominatorLibrary management system (e.g. Spydus)
Dimension Cost
Indicator Service cost
Rationale Indicator of the broad objective that the delivery of library services should be undertaken in a cost-efficient manner. Low or decreasing cost suggests an improvement in the cost-efficiency of library services
Measure LB3 Cost of library service
Definition Defined as the direct cost of the library service per visit
Computation NumeratorDirect cost of the library serviceDenominatorNumber of visits
Value Data typeNumericFormatNNN.NNPermissible values
42Local GovernmentBetter Practice GuidePerformance Reporting Framework Indicator Workbook

Greater than 0 expressed in dollarsExpected range3.00 to 15.00 dollars
Data source NumeratorFinance system (e.g. TechnologyOne)DenominatorLibrary management system (e.g. Spydus)
Dimension Service outcome
Indicator Participation
Rationale Indicator of the broad objective that library resources should be free, accessible and well utilised. High or increasing participation suggests an improvement in the effectiveness of library services
Measure LB4 Active library members (audited)
Definition Defined as the percentage of the municipal population that are active library members
Computation NumeratorNumber of active library membersDenominatorMunicipal population
Value Data typeNumericFormatNNN.NNPermissible values0 to 100.00 expressed as a percentageExpected range10.00 to 40.00 percent
Data source NumeratorLibrary management system (e.g. Spydus)DenominatorAustralian Bureau of Statistics – Catalogue 3218.0 Population Estimates by Local Government Area
Audit EvidenceLibrary management systems that can report “active users”Documented source of municipal population estimate, such as Australian Bureau of Statistics (e.g. Catalogue 3218.0 Population Estimates by Local Government Area) and the basis for any growth assumptions adopted by CouncilOther adviceDocument the activities that trigger an update to the last active use date fieldRegional library corporations – document the method of allocating members to participating Councils (residential address, nomination of Council at point of joining)
Other information
Key terms Active library member
Local GovernmentBetter Practice GuidePerformance Reporting Framework Indicator Workbook
43

Means a member of a library (including residents and non-residents) who has borrowed a library collection item from the library within the reporting period.Corporate overheadsIs costs associated with supporting the delivery of the service. Examples include: payroll human resources finance (including financial and management accounting, purchasing,
accounts payable and accounts receivable) information technologyDirect cost – In-house serviceIs operating expenses directly related to the delivery of the library service (including library programs). This includes expenses such as salaries and oncosts, agency and contract staff, training and development, conferences and seminars, materials, maintenance, utilities, travel and vehicle/plant hire costs, phones, accommodation (rent, lease), computer costs (where they are specific to the service), library collection item processing costs and other incidental expenses. It also includes e-books as they do not meet the definition of a depreciable asset and therefore are expensed. It does not include capital purchases such as library collection items, vehicles or equipment. Indirect costs such as depreciation and management/corporate overheads, and income from fees and charges are specifically excluded. Management overheads may be included where an employee is involved in the direct delivery of the service. In the case of an employee covering for leave, this should be included only if the leave is being covered by a temporary employee (i.e. casual, agency).Direct cost – Library corporationsIs operating expenses of the library corporation directly related to the delivery of the library service (including library programs) that is recovered through financial contributions from the member councils. This includes expenses such as salaries and oncosts, agency and contract staff, training and development, conferences and seminars, materials, maintenance, utilities, travel and vehicle/plant hire costs, phones, library collection item processing costs and other incidental expenses. It also includes e-books as they do not meet the definition of a depreciable asset and therefore are expensed. It does not include capital purchases such as library collection items, vehicles or equipment. Indirect costs such as depreciation and management/corporate overheads and income from fees and charges are specifically excluded. Management overheads may be included where an employee is involved in the direct delivery of the service. In the case of an employee covering for leave, this should be included only if the leave is being covered by a temporary employee (i.e. casual, agency). Where councils also incur costs in their own right, such as building accommodation (rent, lease, utilities, maintenance), these will need to be included in the direct operating cost.e-BooksRefer to electronic books which are loaned out from the library’s licence arrangements to active library members.Library collection itemIs print material (such as books, magazines, serials, maps, plans, manuscripts), audio visual and digital materials (such as audio books, CDs, CD-ROMs, videos, computer games, e-books) and toys and games on hand (that can be reserved or borrowed) at the end of the reporting period. This should exclude music streaming services and other such digital services where the use of the service by active library members cannot be quantified.Library collection items purchased in the last 5 years
44Local GovernmentBetter Practice GuidePerformance Reporting Framework Indicator Workbook

Where the library collection includes e-books purchased under a licence arrangement, the date of the licence (or renewal) should be used for the purposes of determining the five-year period.Library collection item loanIs a loan of a collection item owned by the council including loans (and renewals) to other libraries or collections (e.g. SWIFT). It does not include loans sourced from other libraries or collections.Library visitsIs visits in person to the council library or in the case of a regional library corporation, visits to the relevant council library.Management overheadsIs employee costs associated with overseeing or managing the service. Examples might include a proportion of: chief executive officer general manager/director supervisor team leader administration staff
Notes Active library members for regional library corporations and SWIFTThe following methodology is provided for calculating the number of active members for each council in a regional library corporation.An active library member for an individual council is a person who: is a member of the regional library corporation or council library; and is a resident in that individual council’s area; and borrows a library collection item from the static library in that council area or
from the mobile library (or other non-static option)It also includes regional library corporation members who live outside the corporation area that borrow a library collection item from the static library in that council area or from the mobile library.It will be necessary to filter member activity by postcode in order to comply with the above guidance.Calculation of direct cost for regional library corporationsThe direct cost for a council which is part of a regional library is the annual financial contribution. The financial contribution will need to be broken down between the contribution to the operations of the regional library and the contribution to the purchase of library collection items. The following example is provided as the preferred method for calculating the cost of the library service where it is provided through a regional library corporation.Example:Formula: Council contribution - Capital portion = Direct operating costAssumptions:1. Regional library corporation with 3 participating councils2. Council contributions to library costs are: Council 1 - $3.5M; Council 2 - $2.5M; and Council 3 - $3.0M (Total $9.0M)3. Regional library costs: Operating costs - $10.0M; and Capital cost - $2.0M (Total $12.0M)4. Councils contribute $9.0M out of $12.0M of library costs or 75% ($7.5M operating and $1.5M capital)Calculation of direct operating cost for each council:
Local GovernmentBetter Practice GuidePerformance Reporting Framework Indicator Workbook
45

Council 1: $3.5M - (3.5/9.0 x $1.5M) = $2.92MCouncil 2: $2.5M - (2.5/9.0 x $1.5M) = $2.08MCouncil 3: $3.0M - (3.0/9.0 x $1.5M) = $2.50M TOTAL = $7.50MWhere councils also incur costs in their own right such as building accommodation (rent, lease, utilities, maintenance) these will need to be included in the direct operating costMobile librariesThe following methodology is provided for calculating the indicators and measures where mobile libraries are an integral part of the service:Library collection usageNumerator: Number of mobile library loans to council library membersDenominator: Number of mobile library collection items apportioned to the council based on hours of usageStandard of library collectionNumerator: Number of mobile library collection items purchased in the last 5 years apportioned to the council based on hours of usageDenominator: Number of mobile library collection items apportioned to the council based on hours of usageCost of library serviceNumerator: Contribution paid by council to the library corporation less capital component (books, etc.)Denominator: Number of mobile library visits while in the council municipalityActive library membersNumerator: Number of active library members using the mobile serviceDenominator: Municipal populationSeparation of other service activitiesIn some councils, the library service may also provide customer service for the council. In these cases, it will be necessary to separate the costs of the various activities in order to calculate the service cost indicator. The following approach is suggested for allocating costs to activities: specific costs – identify costs which are specific to each activity such as staff,
consultants, vehicles and the like and allocate across activities shared costs – for the remaining costs which are shared between activities,
these need to be allocated on the basis of an appropriate driver. For example, EFTs can be used as a driver for most shared costs where there is a connection between the cost and the work of the staff. Where staff work across activities, an estimate of the time spent on each activity (expressed as a percentage) will need to be made. This can be done through timesheets either on an ongoing basis or for a temporary time period provided it is representative of actual activity and workload
46Local GovernmentBetter Practice GuidePerformance Reporting Framework Indicator Workbook

Maternal and Child Health-MCH (MC)
Definition Provision of universal access to health services for children from birth to school age and their families including early detection, referral, monitoring and recording child health and development, and providing information and advice
Objective To promote healthy outcomes for children and their families
Effectiveness
Efficiency
Outputs Outcomes
Appropriateness
Quality
Cost
Satisfaction
Service standard
Service Cost
MC1 Participation in first MCH home
visit
MC2 Infant enrolments in MCH service
MC3 Cost of MCH service
Participation
MC4 Participation in MCH service
Service outcome
MC5 Participation in MCH service by
Aboriginal children
MeasureIndicatorDimensionKey:
Objective: To promote healthy outcomes for children and their families
Dimension Appropriateness
Indicator Satisfaction
Rationale Indicator of the broad objective that clients should be satisfied with the MCH service. High or increasing satisfaction suggests an improvement in the appropriateness of the MCH service
Measure MC1 Participation in first MCH home visit
Definition Defined as the percentage of infants enrolled in the MCH service who receive the first MCH home visit
Computation NumeratorNumber of first MCH home visitsDenominatorNumber of birth notifications received
Value Data typeNumericFormatNNN.NNPermissible values0 to 100.00 expressed as a percentageExpected range90.00 to 110.00 percent
Data source NumeratorDET MCH Health Report
Local GovernmentBetter Practice GuidePerformance Reporting Framework Indicator Workbook
47

"4/1a home consultation (non ATSI)” plus "4/2a home consultation (ATSI)”DenominatorDET MCH Health Report “1a total number of birth notifications received during this financial year” minus “3g total analysis of non-enrolled birth notifications”
Dimension Quality
Indicator Service standard
Rationale Indicator of the broad objective that MCH service is provided in accordance with agreed standards. High or increasing enrolments suggests an improvement in the quality of the MCH service
Measure MC2 Infant enrolments in MCH service
Definition Defined as the percentage of infants enrolled in the MCH service
Computation NumeratorNumber of infants enrolled in the MCH service (from birth notifications received)DenominatorNumber of birth notifications received
Value Data typeNumericFormatNNN.NNPermissible values0 to 100.00 expressed as a percentageExpected range90.00 to 110.00 percent
Data source NumeratorDET MCH Health Report “2a number of infants enrolled from birth notifications received this report period”DenominatorDET MCH Health Report “1a total number of birth notifications received during this financial year” minus “3g total analysis of non-enrolled birth notifications”
Dimension Cost
Indicator Service cost
Rationale Indicator of the broad objective that the MCH service should be delivered in a cost-efficient way. Low or decreasing cost suggests an improvement in the cost-efficiency of the Maternal and Child Health service
Measure MC3 Cost of MCH service
Definition Defined as the cost of the MCH service per hour of service delivered
Computation NumeratorCost of the MCH serviceDenominatorHours worked by MCH nurses
Value Data typeNumericFormat
48Local GovernmentBetter Practice GuidePerformance Reporting Framework Indicator Workbook

NNN.NNPermissible valuesGreater than 0 expressed in dollarsExpected range50.00 to 200.00 dollars
Data source NumeratorFinance system (e.g. TechnologyOne)DenominatorPayroll or finance system (e.g. TechnologyOne)
Dimension Service outcome
Indicator Participation
Rationale Indicator of the broad objective that councils should promote healthy outcomes for children and their families. High or increasing participation suggests an improvement in the effectiveness of the Maternal and Child Health service
Measure MC4 Participation in the MCH service (audited)
Definition Defined as the percentage of children enrolled who participate in the MCH service
Computation NumeratorNumber of children who attend the MCH service at least once (in the year)DenominatorNumber of children enrolled in the MCH service
Value Data typeNumericFormatNNN.NNPermissible values0 to 100.00 expressed as a percentageExpected range70.00 to 100.00 percent
Data source NumeratorDET MCH Health Report “2d number of active infant records” calculated as:The SUM of Drawers 1,2 and 3 PLUS Drawers 4 and 5 DIVIDED by 2(i.e. Drawers 1+2+3+(4+5)/2)DenominatorDET MCH Health Report “2e total number of infant records” calculated as:The SUM of Drawers 1,2 and 3 PLUS Drawers 4 and 5 DIVIDED by 2(i.e. Drawers 1+2+3+(4+5)/2)
Audit EvidenceReporting to Department of Education and Early Childhood from MCH system (e.g. MaCHS, CDIS)
Measure MC5 Participation in MCH service by Aboriginal children (audited)
Definition Defined as the percentage of Aboriginal children enrolled who participate in the MCH service
Local GovernmentBetter Practice GuidePerformance Reporting Framework Indicator Workbook
49

Computation NumeratorNumber of Aboriginal children who attend the MCH service at least once (in the year)DenominatorNumber of Aboriginal children enrolled in the MCH service
Value Data typeNumericFormatNNN.NNPermissible values0 to 100.00 expressed as a percentageExpected range60.00 to 100.00 percent
Data source NumeratorMCH system (e.g. MaCHS), DET MCH Health Report “11b number of active Aboriginal and/or Torres Strait Islander origin children” calculated as:The SUM of Drawers 1,2 and 3 PLUS Drawers 4 and 5 DIVIDED by 2(i.e. Drawers 1+2+3+(4+5)/2)DenominatorMCH system (e.g. MaCHS), DET MCH Health Report “11a total number of Aboriginal and/or Torres Strait Islander origin children identified” calculated as:The SUM of Drawers 1,2 and 3 PLUS Drawers 4 and 5 DIVIDED by 2(i.e. Drawers 1+2+3+(4+5)/2)
Audit EvidenceReporting to Department of Education and Early Childhood from MCH system (e.g. MaCHS, CDIS)
Other information
Key terms AboriginalIs Aboriginal and Torres Strait Islander peopleChildrenIs children aged 0 to 3.5 yearsCorporate overheadsIs costs associated with supporting the delivery of the service. Examples include: payroll human resources finance (including financial and management accounting, purchasing,
accounts payable and accounts receivable) information technologyCostIs operating expenses directly related to the delivery of the MCH service. This includes expenses such as nurses’ salaries and oncosts (including agency and contract staff), training and development, contractors, materials, maintenance, travel and vehicle/plant hire costs, phones, computer costs (where they are specific to the service) and other incidental expenses. It does not include capital purchases such as vehicles or equipment. Indirect costs such as depreciation and management/corporate overheads and income from fees, charges are specifically excluded. Management overheads may be included where an
50Local GovernmentBetter Practice GuidePerformance Reporting Framework Indicator Workbook

employee is involved in the direct delivery of the service. In the case of an employee covering for leave, this should be included only if the leave is being covered by a temporary employee (i.e. casual, agency).Enhanced Maternal and Child Health MCH serviceThe enhanced MCH is provided in addition to the suite of services offered through the universal service. It provides a more intensive level of support, including short term case management in some circumstances.Hours worked by MCH nursesIs the hours paid to MCH nurses in providing the MCH service. For example, if a council has 4.5FTE of nurses delivering the MCH service for the reporting period, then the number of hours will be 38hrs x 52weeks x 4.5FTE = 8892hrs. This information can be extracted from a Council’s payroll system.InfantsIs children aged 0 to 1 year.Management overheadsIs employee costs associated with overseeing or managing the service. Examples might include a proportion of: chief executive officer general manager/director supervisor team leader administration staff
Notes Cost of enhanced MCH serviceWhere a council provides an enhanced service to its clients and is an integral part of the overall MCH service, cost should include both the universal and enhanced service.Separation of other service activitiesIn some councils, the MCH service may be part of a larger budget program which includes complementary activities such as immunisation. In these cases, it will be necessary to separate the costs of the various activities in order to calculate the service cost indicator. The following approach is suggested for allocating costs to activities: specific costs – Identify costs which are specific to each activity such as staff,
consultants, vehicles and the like and allocate across activities shared costs – For the remaining costs which are shared between activities,
these need to be allocated on the basis of an appropriate driver. For example EFTs can be used as a driver for most shared costs where there is a connection between the cost and the work of the staff. Where staff work across activities, an estimate of the time spent on each activity (expressed as a percentage) will need to be made. This can be done through timesheets either on an ongoing basis or for a temporary time period provided it is representative of actual activity and workload.
Universal MCH serviceThe universal MCH service supports families in the areas of parenting, health and development, promotion of health, wellbeing and safety, social supports, referrals and linking with local com munities. The universal service offers ten free key ages and stages consultations including an initial home visit and the following age visits: 2 weeks; 4 weeks; 8 weeks; 4 months; 8 months; 12 months; 18 months; 2 years; and 3.5 years.
Local GovernmentBetter Practice GuidePerformance Reporting Framework Indicator Workbook
51

Roads (R)
Definition Provision of a network of sealed local roads under the control of the municipal council to all road users
Objective To provide a sealed local road network that is safe and efficient
Effectiveness
Efficiency
Outputs Outcomes
Appropriateness
Quality
Cost
Satisfaction
Condition
Service Cost
R1 Sealed local road requests
R2 Sealed local roads below the
intervention level
R3 Cost of sealed local road
reconstruction
Satisfaction
R5 Satisfaction with sealed local
roads
Service outcome
R4 Cost of sealed local road resealing
MeasureIndicatorDimensionKey:
Objective: To provide a local road network that is safe and efficient
Dimension Appropriateness
Indicator Satisfaction
Rationale Indicator of the broad objective that road users should be satisfied with the sealed local road network. High or increasing satisfaction suggests an improvement in the appropriateness of the sealed local road network
Measure R1 Sealed local road requests
Definition Defined as the number of sealed local road requests per 100 kilometres of sealed local road
Computation NumeratorNumber of sealed local road requestsDenominatorKilometres of sealed local roads
Value Data typeNumericFormatNNN.NNPermissible valuesGreater than or equal to 0 expressed as a numberExpected range10.00 to 120.00 requests
x 100
52Local GovernmentBetter Practice GuidePerformance Reporting Framework Indicator Workbook

Data source NumeratorCustomer request system (e.g. Pathway)DenominatorAsset management system (e.g. Moloney, SMEC)
Dimension Quality
Indicator Condition
Rationale Indicator of the broad objective that sealed local roads should be maintained at the adopted condition standard. High or increasing proportion of sealed local roads at the adopted condition suggests an improvement in the quality of the sealed local road network
Measure R2 Sealed local roads maintained to condition standards
Definition Defined as the percentage of sealed local roads that are below the renewal intervention level set by Council and not requiring renewal
Computation NumeratorNumber of kilometres of sealed local roads below the renewal intervention level set by CouncilDenominatorKilometres of sealed local roads
Value Data typeNumericFormatNNN.NNPermissible values0 to 100.00 expressed as a percentageExpected range80.00 to 100.00 percent
Data source NumeratorAsset management system (e.g. Moloney, SMEC)DenominatorAsset management system (e.g. Moloney, SMEC)
Dimension Cost
Indicator Service cost
Rationale Indicator of the broad objective that the renewal and maintenance of sealed local roads should be undertaken in a cost-efficient manner. Low or decreasing cost of road renewal and maintenance suggests an improvement in the cost-efficiency of road renewal and maintenance activities
Measure R3 Cost of sealed local road reconstruction
Definition Defined as the direct reconstruction cost per square metre of sealed local roads reconstructed
Computation NumeratorDirect cost of sealed local road reconstructionDenominatorSquare metres of sealed local roads reconstructed
Local GovernmentBetter Practice GuidePerformance Reporting Framework Indicator Workbook
53

Value Data typeNumericFormatNNN.NNPermissible valuesGreater than 0 expressed in dollarsExpected range20.00 to 200.00 dollars
Data source NumeratorFinance system (e.g. TechnologyOne)DenominatorAsset management system (e.g. Moloney, SMEC)
Measure R4 Cost of sealed local road resealing
Definition Defined as the direct resealing cost per square metre of sealed local roads resealed
Computation NumeratorDirect cost of sealed local road resealingDenominatorSquare metres of sealed local roads resealed
Value Data typeNumericFormatNNN.NNPermissible valuesGreater than 0 expressed in dollarsExpected range4.00 to 30.00 dollars
Data source NumeratorFinance system (e.g. TechnologyOne)DenominatorAsset management system (e.g. Moloney, SMEC)
Dimension Service outcome
Indicator Satisfaction
Rationale Indicator of the broad objective that the local road network should be maintained and renewed to ensure that it is safe and efficient. High or increasing satisfaction suggests an improvement in the effectiveness of the local road network
Measure R5 Satisfaction with sealed local roads (audited)
Definition Defined as the community satisfaction rating out of 100 with how Council has performed on the condition of sealed local roads
Computation NumeratorCommunity satisfaction rating out of 100 with how Council has performed on the condition of sealed local roadsDenominator
54Local GovernmentBetter Practice GuidePerformance Reporting Framework Indicator Workbook

Not applicable
Value Data typeNumericFormatNNNPermissible values0 to 100 expressed as a numberExpected range50 to 100
Data source NumeratorCommunity Satisfaction Survey – Local Government VictoriaDenominatorNot applicable
Audit EvidenceCopy of community satisfaction survey resultsOther adviceIf Council subscribes to the Local Government Victoria conducted community satisfaction survey, Council should ensure the questions asked in the survey include this indicatorIf Council conducts its own community satisfaction survey, either directly or through Council appointed consultants, the survey sampling and methodology used should be consistent with the methodology adopted by Local Government Victoria (outlined in Practice Note 2 - Conduct of Community Satisfaction Survey) to ensure consistency between councils. Evidence collated to support the data should include: the instructions provided for the conduct of the survey the sampling methodology and results, demonstrating that the sample of
residents surveyed was statistically valid and representative of Council’s residents
the survey methodology and results
Other information
Key terms Corporate overheadsIs costs associated with supporting the delivery of the service. Examples include: payroll human resources finance (including financial and management accounting, purchasing,
accounts payable and accounts receivable) information technologyDirect reconstruction costIs capital expenses directly related to reconstructing the road pavement and seal. This includes expenses such as salaries and oncosts, agency and contract staff, training and development, contractors, materials, travel and vehicle/plant hire costs, phones, computer costs (where they are specific to the service) and other incidental expenses. It also includes costs such as street sweeping which are integral to the road reconstruction. It does not include capital purchases such as vehicles or equipment. Indirect costs such as depreciation and management/corporate overheads are specifically excluded. Management overheads may be included where an employee is involved in the direct delivery of
Local GovernmentBetter Practice GuidePerformance Reporting Framework Indicator Workbook
55

the service. In the case of an employee covering for leave, this should be included only if the leave is being covered by a temporary employee (i.e. casual, agency). Where Council incurs reconstruction costs but the works are not completed at the end of the reporting period, the costs should be carried forward and reported in the following reporting period on completion.Direct resealing costIs capital expenses directly related to the road seal. This includes expenses such as salaries and oncosts, agency and contract staff, training and development, contractors, materials, travel and vehicle/plant hire costs, phones, computer costs (where they are specific to the service) and other incidental expenses. It also includes costs such as street sweeping which are integral to the road resealing. It does not include capital purchases such as vehicles or equipment. Indirect costs such as depreciation and management/corporate overheads are specifically excluded. Management overheads may be included where an employee is involved in the direct delivery of the service. In the case of an employee covering for leave, this should be included only if the leave is being covered by a temporary employee (i.e. casual, agency). Where Council incurs resealing costs but the works are not completed at the end of the reporting period, the costs should be carried forward and reported in the following reporting period on completion.Local roadIs a sealed or unsealed road for which the Council is the responsible road authority under the Road Management Act 2004 and includes right-of-ways and laneways.Management overheadsIs employee costs associated with overseeing or managing the service. Examples might include a proportion of: chief executive officer general manager/director supervisor team leader administration staffRenewalIs returning the service potential or the life of an asset to that which it had originally and includes road reconstruction and resealing.Renewal intervention levelIs the condition standard which is set to determine whether a sealed local road requires renewal. That is, local roads above the intervention level require intervention , and those below do not . For the purposes of the measure ‘Sealed Local Roads Below the Intervention Level’, the numerator is the number of kilometres of sealed local roads that do not need to be renewed.The condition standard is generally based on a Pavement Condition Index (PCI) which is a pavement management system rating scheme. Common schemes include SMEC and Moloney. Where different intervention levels exist for categories or components of roads, the condition standard should be set at the category or component level and an average taken for reporting purposes. This standard is then agreed with the community and approved by the Council.Road pavementIs the portion of the road that supports the running surface (seal) for vehicular traffic.Road reconstructionIs all actions directed at returning the service potential or the useful life of the road pavement and road seal up to that which it had originally and includes: removal
56Local GovernmentBetter Practice GuidePerformance Reporting Framework Indicator Workbook

and replacement of existing road seal, pavement and substructure and other associated road components (e.g. kerb and channel).Road resealingIs all actions directed at returning the service potential or useful life of the road seal up to that which it had originally and includes: laying a new surface on top of the old by spraying bitumen and rolling stone chips into it, or laying a new thin layer of asphalt; removing the old surface and replacing it with a new layer of asphalt; or recycling the old surface by remixing and stabilising the asphalt.Road sealIs the initial treatment to a new or reconstructed road pavement with the application of bituminous surfacing or other surfacing materials such as pavers or concrete.Sealed local roadsIs sealed roads under the control of the municipality and includes the road pavement and road seal (and kerb and channel where applicable).Sealed local road requestsIs any request received from a member of the public (written or verbal) in regard to council’s sealed local road network. It does not include requests relating to matters that fall outside the definition of ‘sealed local roads’ (e.g. tree removal).
Notes Kilometres of sealed local roads for the purposes of determining the renewal intervention levelThe decision to include kerb and channel in the calculation of sealed local roads below the intervention level will depend on whether kerb and channel is treated as a separate asset category and/or as part of the road as follows: if kerb and channel is included in the road asset category, then it is assumed
that the road condition assessment will have taken its condition into account if kerb and channel is a separate asset category and is not considered part of
the road, then it does not need to be taken into account if kerb and channel is treated as a separate asset category and is considered
to be part of the road, then for the purposes of reporting the denominator ‘kilometres of sealed local roads’, add the total kilometres of kerb and channel to the total kilometres of sealed local roads. The same should be done for the numerator ‘kilometres of sealed local roads below the renewal intervention level’, add the total kilometres of kerb and channel that is below the renewal intervention level to the total kilometres of sealed local roads that are below the renewal intervention level.
This does not apply to the kilometres of sealed local roads in the measure R1: Sealed Local Road Requests.
Local GovernmentBetter Practice GuidePerformance Reporting Framework Indicator Workbook
57
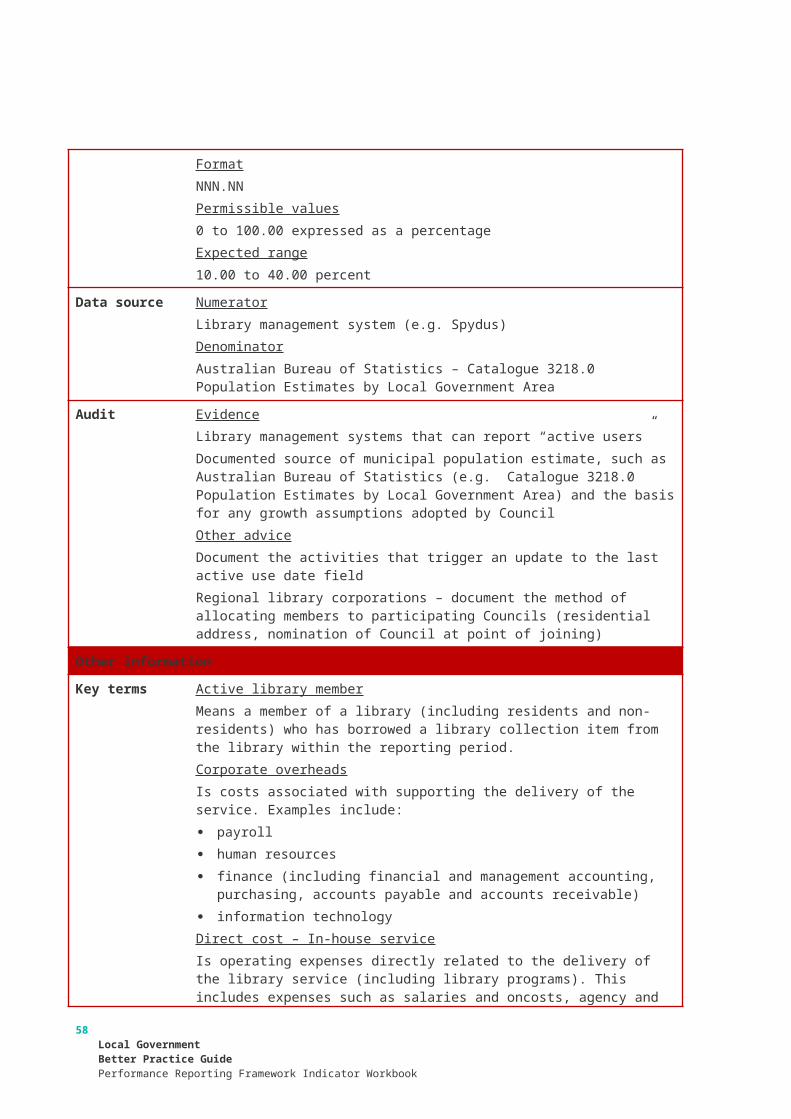
Statutory Planning (SP)
Definition Provision of land use and development assessment services to applicants and the community including advice and determination of applications
Objective To make planning application decisions which are consistent with the local planning scheme
Effectiveness
Efficiency
Outputs Outcomes
Appropriateness
Quality
Cost
Timeliness
Service standard
Service Cost
SP1 Time taken to decide planning
applications
SP2 Planning applications
decided in 60 days
SP3 Cost of statutory planning
service
Decision making
SP4 Planning decisions upheld
at VCAT
Service outcome
MeasureIndicatorDimensionKey:
Objective: To make planning application decisions which are consistent with the local planning scheme
Dimension AppropriatenessIndicator TimelinessRationale Indicator of the broad objective that council planning application processing and
decisions should be carried out in a timely manner. Low or decreasing time suggests an improvement in the appropriateness of application processing and decisions
Measure SP1 Time taken to decide planning applicationsDefinition Defined as the median number of days taken between receipt of a planning
application and a decision on the applicationComputation Numerator
The median number of days between receipt of a planning application and a decision on the applicationDenominatorNot applicable
Value Data typeNumericFormatNNNPermissible valuesGreater than 0 expressed as a numberExpected range30 to 110 days
Data source Numerator
58Local GovernmentBetter Practice GuidePerformance Reporting Framework Indicator Workbook

Planning Permit Activity Reporting System (PPARS) ‘Median processing days to responsible authority determination’DenominatorNot applicable
Dimension QualityIndicator Service standardRationale Indicator of the broad objective that planning application processing and decisions
should be carried out in accordance with legislative requirements. High or increasing compliance with standards suggests an improvement in the quality of application processing and decisions
Measure SP2 Planning applications decided within required time framesDefinition Defined as the percentage of regular and VicSmart planning application decisions
made within legislated time framesComputation Numerator
Number of planning application decisions made within 60 days for regular permits and 10 days for VicSmart permitsDenominatorNumber of planning application decisions made
Value Data typeNumericFormatNNN.NNPermissible values0 to 100.00 expressed as a percentageExpected range40.00 to 100.00 percent
Data source NumeratorPlanning Permit Activity Reporting System (PPARS)DenominatorPlanning Permit Activity Reporting System (PPARS)
Dimension CostIndicator Service costRationale Indicator of the broad objective that planning application processing and decisions
should be carried out in a cost-efficient manner. Low or decreasing cost suggests an improvement in the cost-efficiency of application processing and decisions
Measure SP3 Cost of statutory planning serviceDefinition Defined as the direct cost of the statutory planning service per planning
application receivedComputation Numerator
Direct cost of the statutory planning serviceDenominatorNumber of planning applications received
Value Data typeNumericFormatNNN.NNPermissible valuesGreater than 0 expressed in dollars
Local GovernmentBetter Practice GuidePerformance Reporting Framework Indicator Workbook
59

Expected range500.00 to 4,000.00 dollars
Data source NumeratorFinance system (e.g. TechnologyOne)DenominatorPlanning Permit Activity Reporting System (PPARS) ‘New permit applications’
Dimension Service outcomeIndicator Decision makingRationale Indicator of the broad objective that planning application processing and decisions
should be consistent with the local planning scheme. High or increasing number of planning applications unsuccessfully challenged suggests an improvement in the effectiveness of decisions
Measure SP4 Council planning decisions upheld at VCAT (audited)Definition Defined as the percentage of planning application decisions subject to review by
VCAT that were not set asideComputation Numerator
Number of VCAT decisions that did not set aside council’s decision in relation to a planning applicationDenominatorNumber of VCAT decisions in relation to planning applications
Value Data typeNumericFormatNNN.NNPermissible values0 to 100.00 expressed as a percentageExpected range30.00 to 100.00 percent
Data source NumeratorManual record (e.g. advice from VCAT)DenominatorManual record (e.g. advice from VCAT)
Audit EvidenceCouncil record of: all VCAT planning application matters in which council has been named as a
party the outcome of the planning application mattersCopies of correspondence from VCATCouncil officer reports to council throughout the year
Other informationKey terms Corporate overheads
Is costs associated with supporting the delivery of the service. Examples include: payroll human resources finance (including financial and management accounting, purchasing,
accounts payable and accounts receivable) information technology
60Local GovernmentBetter Practice GuidePerformance Reporting Framework Indicator Workbook

Direct costIs operating expenses directly related to the delivery of the statutory planning service excluding enforcement. This includes expenses such as salaries and oncosts for staff directly delivering the service, agency and contract staff, training and development, conferences and seminars, materials, maintenance, legal fees, travel and vehicle/plant hire costs, phones, computer costs (where they are specific to the service), panel fees and other incidental expenses. It does not include capital purchases such as vehicles or equipment. Indirect costs such as depreciation and management/corporate overheads and income from fees and charges are specifically excluded. Management overheads may be included where an employee is involved in the direct delivery of the service. In the case of an employee covering for leave, this should be included only if the leave is being covered by a temporary employee (i.e. casual, agency).Management overheadsIs employee costs associated with overseeing or managing the service. Examples might include a proportion of: chief executive officer general manager/director supervisor team leader administration staffMedianIs the numerical value separating the higher half of a data sample, a population, or a probability distribution, from the lower half. It is calculated by arranging all the planning application decisions for the year from the lowest value to highest value in terms of gross processing days and pick the middle one. If there is an even number of planning application decisions, the median is the mean of the two middle values.Median number of days between receipt of a planning application and a decision on the applicationIs the gross number of days which includes weekends and public holidays from the date the planning application is received until the date that a decision on the planning application is made by council or by an officer under delegation. It includes applications with outcomes ‘withdrawn’, ‘lapsed’ and ‘permit not required’.Planning applicationIs a completed regular or VicSmart planning permit application on the prescribed form lodged with a council (the responsible authority) accompanied by a complete description of the proposal and the prescribed fee.Planning decisionIs the issue of a permit, a notice of decision to grant a permit or a notice of refusal to grant a permit. It also includes an amended permit, a notice of decision to grant an amendment to a permit or a notice of decision to refuse to grant an amendment to a permit.VCAT decisionsIs all decisions on applications for review by VCAT as per Part 4, Division 2 of the Planning and Environment Act 1987. It does not include consent orders approved by VCAT or applications withdrawn. If the Minister for Planning sets aside the council's decision, it should not be included in the numerator. The decision ‘Not Set Aside’ includes upheld, varied, affirmed, not appealed and remitted. In this context, 'not appealed' refers to VCAT's decision not being appealed by the parties involved. The measure is concerned with decisions that are made by VCAT in support of council's decision.
Notes Separation of other service activities
Local GovernmentBetter Practice GuidePerformance Reporting Framework Indicator Workbook
61

Where the statutory planning service forms part of a larger budget program including complementary activities such as strategic land use planning and planning enforcement, it will be necessary to separate the costs of the various activities in order to calculate the service cost indicator for statutory planning. The following approach is suggested for allocating costs to activities: specific costs – identify costs which are specific to each activity such as staff,
consultants, vehicles and the like and allocate across activities shared costs – for the remaining costs which are shared between activities,
these need to be allocated on the basis of an appropriate driver. For example, EFTs can be used as a driver for most shared costs where there is a connection between the cost and the work of the staff. Where staff work across activities, an estimate of the time spent on each activity (expressed as a percentage) will need to be made. This can be done through timesheets either on an ongoing basis or for a temporary time period provided it is representative of actual activity and workload
VicSmart Planning AssessmentThe Planning and Environment Amendment (VicSmart Planning Assessment) Act 2012 amends the Planning and Environment Act 1987 to enable a streamlined assessment process for straightforward planning permit applications to be set up in planning schemes. It is designed to speed up the assessment of straightforward, low impact applications such as fences, decks, pergolas and business signs from an average 62 business days to 10 business days. In March 2017, an extension to VicSmart through Amendment VC135 was implemented. Extensions include: building and works up to $1 million in industrial areas building and works up to $500,000 in commercial and some special purpose
areas a range of low impact developments in rural areas (up to $500,000 in
agricultural settings and $250,000 in more sensitive rural settings) small scale types of buildings and works in selected overlays subdivision, advertising signs and car parking.A further VicSmart extension into the residential zones is also due to occur, including: a single storey extension to a single dwelling where specific design criteria are
met buildings and works up to $100,000 in residential zones, where not associated
with a dwelling.VicSmart applications should be included in the calculation of ‘SP2 - Planning applications decided within required time frames’.
62Local GovernmentBetter Practice GuidePerformance Reporting Framework Indicator Workbook

Waste Collection (WC)
Definition Provision of kerbside waste collection services to the community including garbage and recyclables
Objective To maximise the amount of kerbside waste diverted from landfill
Effectiveness
Efficiency
Outputs Outcomes
Appropriateness
Quality
Cost
Satisfaction
Service standard
Service cost
WC1 Kerbside bin collection requests
WC2 Kerbside collection bins
missed
WC3 Cost of kerbside garbage
bin collection service
Waste diversion
WC5 Kerbside collection waste
diverted from landfill
Service outcome
WC4 Cost of kerbside
recyclables bin collection service
MeasureIndicatorDimensionKey:
Objective: To minimise the amount of waste diverted to landfill
Dimension Appropriateness
Indicator Satisfaction
Rationale Indicator of the broad objective that users should be satisfied with the waste collection system. High or increasing satisfaction suggests an improvement in the appropriateness of the kerbside collection system
Measure WC1 Kerbside bin collection requests
Definition Defined as the number of kerbside bin collection requests per 1,000 kerbside bin collection households
Computation NumeratorNumber of kerbside garbage and recycling bin collection requestsDenominatorNumber of kerbside bin collection households
Value Data typeNumericFormatNNN.NNPermissible valuesGreater than or equal to 0 expressed as a numberExpected range10.00 to 300.00 requests
x 1000
Local GovernmentBetter Practice GuidePerformance Reporting Framework Indicator Workbook
63

Data source NumeratorCustomer request system (e.g. Pathway)DenominatorRates system (e.g. Pathway)
Dimension Quality
Indicator Service standard
Rationale Indicator of the broad objective that kerbside collection bins should be collected as planned. Low or decreasing number of missed kerbside collection bins suggests an improvement in the quality of the kerbside collection system
Measure WC2 Kerbside collection bins missed
Definition Defined as the number of kerbside collection bins missed per 10,000 scheduled kerbside collection bin lifts
Computation NumeratorNumber of kerbside garbage and recycling collection bins missedDenominatorNumber of scheduled kerbside garbage and recycling collectionbin lifts
Value Data typeNumericFormatNNN.NNPermissible valuesGreater than or equal to 0 expressed as a numberExpected range1.00 to 20.00 bins
Data source NumeratorCustomer request system (e.g. Pathway)DenominatorRates system (e.g. Pathway)
Dimension Cost
Indicator Service cost
Rationale Indicator of the broad objective that the kerbside collection service should be delivered in a cost-efficient manner. Low or decreasing cost suggests an improvement in the cost-efficiency of the kerbside collection system
Measure WC3 Cost of kerbside garbage bin collection service
Definition Defined as the direct cost of the kerbside garbage bin collection service per kerbside garbage collection bin
Computation NumeratorDirect cost of the kerbside garbage bin collection serviceDenominatorNumber of kerbside garbage collection bins
Value Data typeNumeric
x 10,000
64Local GovernmentBetter Practice GuidePerformance Reporting Framework Indicator Workbook

FormatNNN.NNPermissible valuesGreater than 0 expressed in dollarsExpected range40.00 to 150.00 dollars
Data source NumeratorFinance system (e.g. TechnologyOne)DenominatorRates system (e.g. Pathway)
Measure WC4 Cost of kerbside recyclables bin collection service
Definition Defined as the direct cost of the kerbside recyclables collection service per kerbside recyclables collection bin
Computation NumeratorDirect cost of the kerbside recyclables bin collection serviceDenominatorNumber of kerbside recyclables collection bins
Value Data typeNumericFormatNNN.NNPermissible valuesGreater than 0 expressed in dollarsExpected range10.00 to 80.00 dollars
Data source NumeratorFinance system (e.g. TechnologyOne)DenominatorRates system (e.g. Pathway)
Dimension Service outcome
Indicator Waste diversion
Rationale Indicator of the broad objective that the amount of waste diverted from landfill should be maximised. High or increasing volume of waste diverted away from landfill suggests an improvement in the effectiveness of the waste collection system
Measure WC5 Kerbside collection waste diverted from landfill (audited)
Definition Defined as the percentage of garbage, recyclables and green organics collected from kerbside bins that is diverted from landfill
Computation NumeratorWeight of recyclables and green organics collected from kerbside binsDenominatorWeight of garbage, recyclables and green organics collected from kerbside bins
Value Data type
Local GovernmentBetter Practice GuidePerformance Reporting Framework Indicator Workbook
65
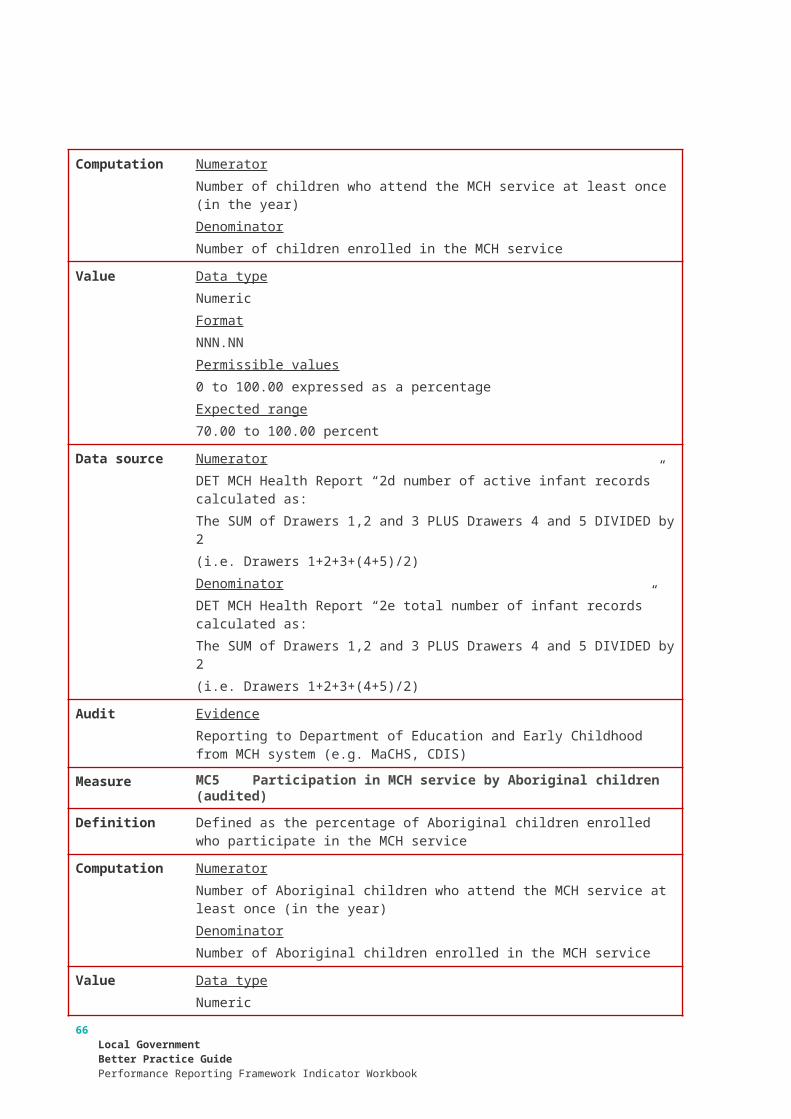
NumericFormatNNN.NNPermissible values0 to 100.00 expressed as a percentageExpected range20.00 to 60.00 percent
Data source NumeratorTonnage records (e.g. landfill, Municipal Recycling Facility)DenominatorTonnage records (e.g. landfill, Municipal Recycling Facility)
Audit EvidenceRegular weighbridge tonnage reports and/or invoices for: recyclables garbage green wasteOther adviceThese reports should be received and monitored throughout the year by the Council officer managing the contract. If tonnage is reviewed and tracked, provide a copy of the monitoring records / spreadsheetsEnsure any contaminated waste collected initially as recycled but processed as landfill is not omitted or double counted in the calculation of the measureWhere a weighbridge is not in operation, an alternative methodology such as the Sustainability Victoria approved volume to mass calculation methodology should be used. The calculation and source of the methodology should be provided as audit evidence
Other information
Key terms Collection householdIs a household or business that is required to use Council’s formal kerbside bin collection systemCorporate overheadsIs costs associated with supporting the delivery of the service. Examples include: payroll human resources finance (including financial and management accounting, purchasing,
accounts payable and accounts receivable) information technologyDirect costIs operating expenses directly related to the delivery of the relevant waste collection service. This includes expenses such as salaries and oncosts, agency and contract staff, training and development, contractors, materials, maintenance, travel and vehicle/plant hire costs, disposal costs (including gates fees and levies), depreciation of bins, phones, computer costs (where they are specific to the service) and other incidental expenses. It does not include capital purchases such as bins for new tenements (including leased), vehicles or equipment and it does not include costs related to the operation of transfer stations. Indirect costs such as management/corporate overheads and income from fees and charges are specifically excluded. Management overheads may be included where an employee is involved in the direct delivery of the service. In
66Local GovernmentBetter Practice GuidePerformance Reporting Framework Indicator Workbook
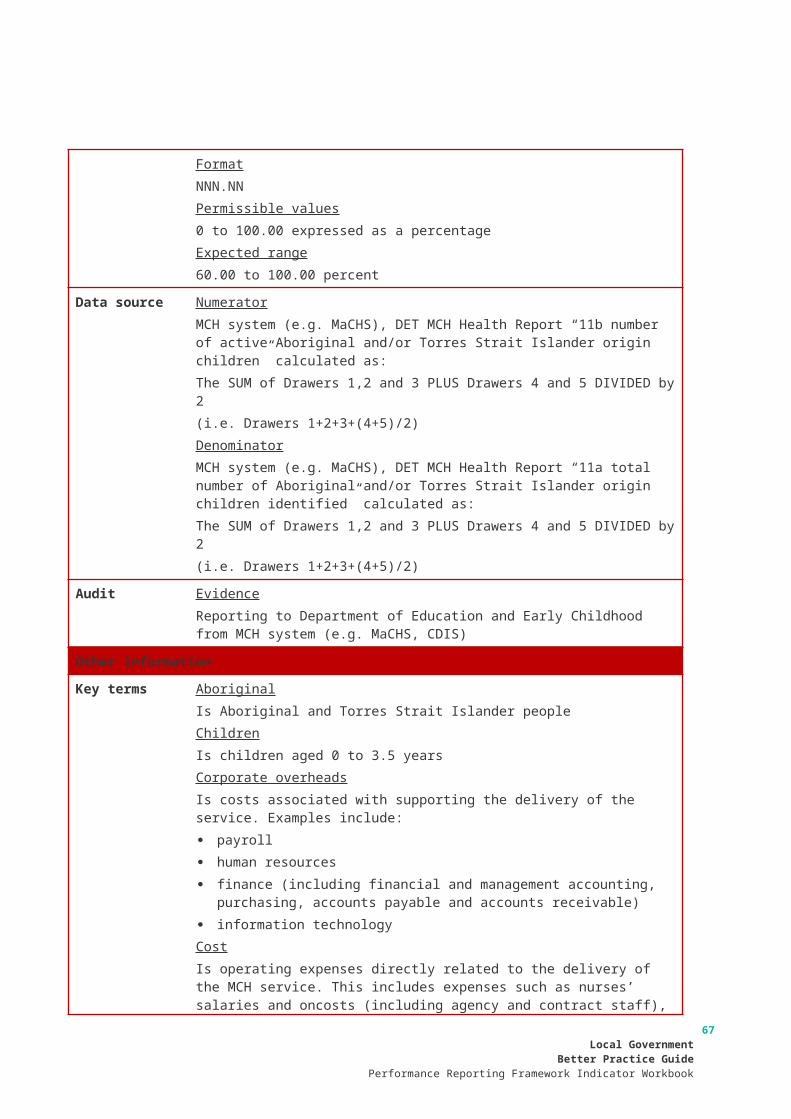
the case of an employee covering for leave, this should be included only if the leave is being covered by a temporary employee (i.e. casual, agency). Where the council receives income from the sale of recyclables collected from the kerbside recyclables bin collection service, this should be netted off against the direct cost of the service.Kerbside bin collection requestIs any request received from a member of the public (written or verbal) in regard to Council’s formal kerbside garbage and recycling collection service (e.g. requests for additional bins, uncollected bins, damaged bins, stolen bins) excluding bins for new tenements and requests in relation to green organics.Kerbside collectionIs a compulsory service provided to households or businesses, typically in urban, suburban or some rural areas involving the removal of household waste that is emptied by trucks with a lifting arm.Kerbside collection binIs a container used as part of the Council’s formal kerbside collection systems.Kerbside collection bins missedIs a kerbside bin collection request relating to a bin that has been made available for collection and was subsequently missed by council (ie. not emptied or collected by council) on the scheduled collection day. Bins missed by council, that are collected later on the same day (after being alerted by a resident, for example), should also be considered missed.Kerbside collection wasteIs garbage, recyclables and green organics subject to a formal Council kerbside bin collection system.Management overheadsIs employee costs associated with overseeing or managing the service. Examples might include a proportion of: chief executive officer general manager/director supervisor team leader administration staffScheduled bin liftsIs the number of kerbside collection household bins for each waste type multiplied by the number of collections for each waste type.
Notes Conversion of waste volume to tonnageThe following is a methodology provided by Sustainability Victoria for converting the volume (cubic metres) of uncompacted material to weight (tonnes). There may be different, more appropriate conversion factors at individual sites.
Material / Density (1 cubic metre = ... Tonne)Aluminium cans - whole 0.026Aluminium cans - flattened 0.087Aluminium cans - baled 0.154Asphalt / Bitumen 0.800Bricks 1.200Car Batteries 1.125Carpets 0.300
Local GovernmentBetter Practice GuidePerformance Reporting Framework Indicator Workbook
67

Cement Sheet 0.500Ceramics 1.000Clean Soil 1.600Cobbles / Boulders 1.400Commingled containers (plastic, glass, steeland aluminium cans) 0.063Concrete 1.500Garbage 0.150Garden / Vegetation 0.150Glass bottles - whole 0.174Glass bottles - semi-crushed 0.347Hazardous Wastes 0.200Insulation 0.050Litter trap 0.750Metals 0.900Oil 0.800Other Textiles 0.150Others 0.300Paint 0.800Paper / Cardboard 0.100Plasterboard 0.200Plastic containers - whole 0.010Plastic containers - whole, some flattened 0.013Plastic containers - baled 0.139Rubber 0.300Soil / Rubble<150mm 1.400Steel cans - whole 0.052Steel cans - flattened 0.130Steel cans - baled 0.226Wood / Timber 0.300
m3 x density = tonnestherefore m3=tonnes/density
68Local GovernmentBetter Practice GuidePerformance Reporting Framework Indicator Workbook

4. Financial performance indicators
Efficiency (E)
Definition Measures whether a council is using resources efficiently
Objective Use resources efficiently
OutcomesOutputs
Operating position
ObligationsResources
used efficiently
Financial Performance
Outcome
IndicatorDimensionKey:
Efficiency
Liquidity
Stability
Measure
E2 Average residential
rate per residential property
assessment
Revenue level
E3 Resignations/ terminations v average staff
Workforce turnover
E1 Expenses per property assessment
Expenditure level
Objective: Use resources efficiently
Dimension Efficiency
Indicator Revenue level
Rationale Indicator of the broad objective that resources should be used efficiently in the delivery of services. Low or decreasing level of rates suggests an improvement in organisational efficiency
Measure E1 Average residential rate per residential property assessment (audited)
Definition Defined as residential rate revenue per residential property assessment
Computation NumeratorResidential rate revenueDenominatorNumber of residential property assessments
Value Data typeNumeric
Local GovernmentBetter Practice GuidePerformance Reporting Framework Indicator Workbook
69

FormatNNN.NNPermissible valuesGreater than 0 expressed in dollarsExpected range700.00 to 2,000.00 dollars
Data source NumeratorFinancial statementsForecast residential rate revenue based on the amount raised in the annual budget and underlying the financial statements (Strategic Resource Plan)DenominatorAnnual budgetForecast number of residential property assessments based on the number in the annual budget and underlying the financial statements (Strategic Resource Plan)
Audit EvidenceResidential rate revenue per the general ledger, which should be reconciled to the rates ledgerNumber of residential property assessments from the rates ledger
Indicator Expenditure level
Rationale Indicator of the broad objective that resources should be used efficiently in the delivery of services. Low or decreasing level of expenditure suggests an improvement in organisational efficiency
Measure E2 Expenses per property assessment (audited)
Definition Defined as total expenses per property assessment
Computation NumeratorTotal expensesDenominatorNumber of property assessments
Value Data typeNumericFormatNNN.NNPermissible valuesGreater than 0 expressed in dollarsExpected range2,000.00 to 5,000.00 dollars
Data source NumeratorFinancial statements (audited)Financial statements (Strategic Resource Plan)DenominatorAnnual budgetForecast number of property assessments based on the number in the annual budget and underlying the financial statements (Strategic Resource Plan)
Audit Evidence
70Local GovernmentBetter Practice GuidePerformance Reporting Framework Indicator Workbook

Expenditure from the financial statementsNumber of property assessments from the rates ledger
Indicator Workforce turnover
Rationale Indicator of the broad objective that resources should be used efficiently in the delivery of services. Low or decreasing level of workforce turnover suggests an improvement in organisational efficiency
Measure E3 Resignations and terminations compared to average staff (audited)
Definition Defined as the number of permanent staff resignations and terminations as a percentage of the average number of permanent staff
Computation NumeratorNumber of permanent staff resignations and terminationsDenominatorAverage number of permanent staff for the financial year
Value Data typeNumericFormatNNN.NNPermissible values0 to 100.00 expressed as a percentageExpected range5.00 to 20.00 percent
Data source NumeratorPayroll systemForecast number of permanent staff resignations and terminations based on the number in the annual budget and underlying the financial statementsDenominatorPayroll systemForecast average number of permanent staff based on the annual budget and underlying the financial statements
Audit EvidencePayroll records and HR personnel recordsSupporting records for both the beginning and end of the period to substantiate the calculation of average staff
Other information
Key terms Property assessmentsIs the number of rateable property assessments at the end of the year and includes all property adjustments (e.g. new or deleted assessments).Residential property assessmentsIs the number of rateable residential property assessments at the end of the year and includes all property adjustments (e.g. new or deleted assessments).Residential rate revenueIs revenue from general rates, municipal charges, service rates and service charges (e.g. garbage, recycling and organics charges) levied on residential properties.Resignations and terminations
Local GovernmentBetter Practice GuidePerformance Reporting Framework Indicator Workbook
71
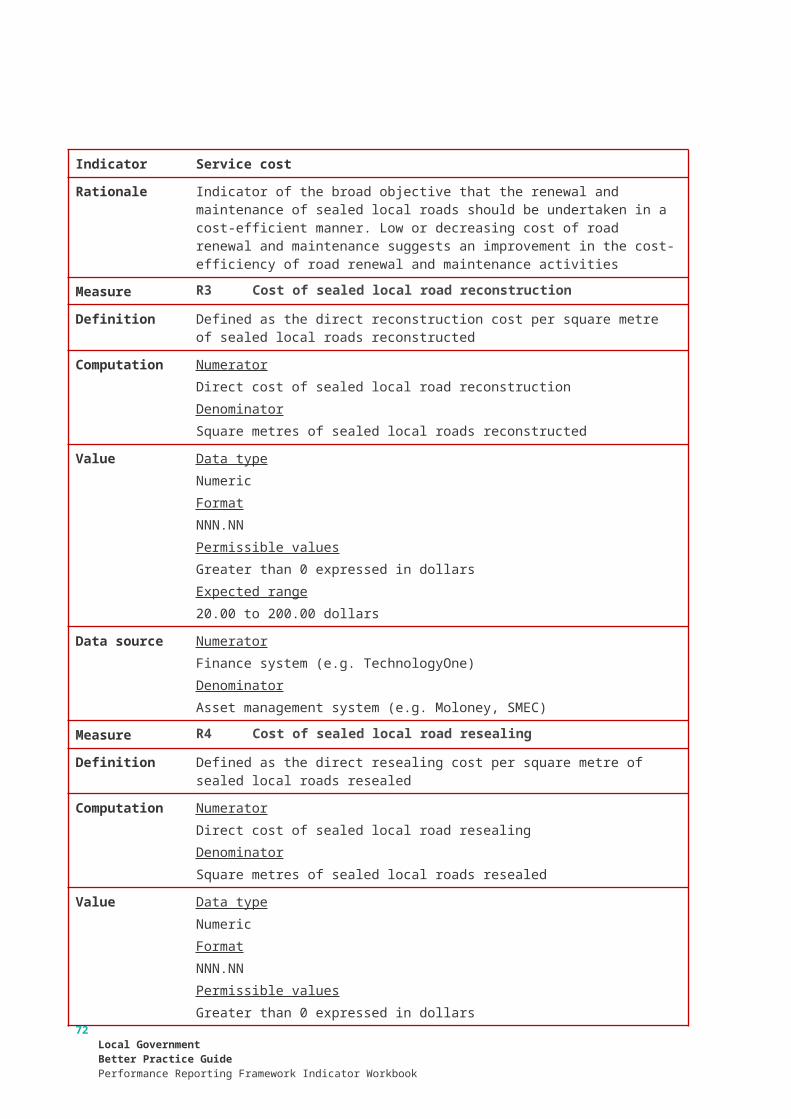
Is all permanent employees (including senior officers on contract) that leave the council and includes resignations, terminations, retirements and redundancies. This should exclude short term contingent workers i.e. contracts of less than six months.
72Local GovernmentBetter Practice GuidePerformance Reporting Framework Indicator Workbook

Liquidity (L)
Definition Measures whether a council is able to generate sufficient cash to pay bills on time
Objective Generate sufficient cash to pay bills on time
Outputs Outcomes
Operating position
Obligations
Bills paid on time
Financial Performance
Outcome
IndicatorDimensionKey:
Efficiency
Liquidity
Stability
Measure
L1 Current assets v current
liabilities
Working capital
L2 Unrestricted
cash v current liabilities
Objective: Generate sufficient cash to pay bills on time
Dimension Liquidity
Indicator Working capital
Rationale Indicator of the broad objective that sufficient working capital is available to pay bills as and when they fall due. High or increasing level of working capital suggests an improvement in liquidity
Measure L1 Current assets compared to current liabilities (audited)
Definition Defined as current assets as a percentage of current liabilities
Computation NumeratorCurrent assetsDenominatorCurrent liabilities
Value Data typeNumericFormatNNN.NNPermissible values
Local GovernmentBetter Practice GuidePerformance Reporting Framework Indicator Workbook
73

0 to 500.00 expressed as a percentageExpected range100.00 to 400.00 percent
Data source NumeratorFinancial statements (audited)Financial statements (Strategic Resource Plan)DenominatorFinancial statements (audited)Financial statements (Strategic Resource Plan)
Audit EvidenceFinancial statements
Indicator Unrestricted cash
Rationale Indicator of the broad objective that sufficient cash which is free of restrictions is available to pay bills as and when they fall due. High or increasing level of unrestricted cash suggests an improvement in liquidity
Measure L2 Unrestricted cash compared to current liabilities (audited)
Definition Defined as unrestricted cash as a percentage of current liabilities
Computation NumeratorUnrestricted cashDenominatorCurrent liabilities
Value Data typeNumericFormatNNN.NNPermissible values0 to 500.00 expressed as a percentageExpected range10.00 to 300.00 percent
Data source NumeratorFinancial statements (audited)Forecast unrestricted cash balance based on the balance sheet in the annual budget and underlying the financial statements (Strategic Resource Plan)DenominatorFinancial statements (audited)Financial statements (Strategic Resource Plan)
Audit EvidenceCalculation of restricted cash at 30 June, including cash committed to funding carry forward capital works (this information should also be required for disclosure of commitments in the audited financial report)
Other information
Key terms Restricted cashIs cash and cash equivalents and financial assets within the meaning of the AAS that are not available for use other than for the purpose for which it is restricted
74Local GovernmentBetter Practice GuidePerformance Reporting Framework Indicator Workbook

and includes cash that will be used to fund carry forward capital works from the previous financial year.Items which are considered to be restricted under the definition are: trust funds and deposits statutory or non-discretionary reserves cash held to fund carry forward capital works conditional grants unspent
Term deposits with an original maturity of greater than 90 days (i.e. other financial assets) are also considered to be restricted under this definition.
Unrestricted cashIs all cash and cash equivalents other than restricted cash.
Local GovernmentBetter Practice GuidePerformance Reporting Framework Indicator Workbook
75

Obligations (O)
Definition Measures whether the level of debt and other long term obligations is appropriate to the size and nature of the Council’s activities
Objective Appropriate level of long term obligations
Outputs Outcomes
Operating position
ObligationsAppropriate level of long
term obligations
Financial Performance
Outcome
IndicatorDimensionKey:
Efficiency
Liquidity
Stability
Measure
O2 Loans and borrowings
repayments v rates
Long term liabilities
O1 Loans and borrowings v
rates
O3 Non-current
liabilities v own source
revenueO4 Asset renewal v
depreciationAsset renewal
Loans and borrowings
Objective: Appropriate level of long term obligations
Dimension Obligations
Indicator Asset renewal
Rationale Indicator of the broad objective that assets should be renewed as planned. High or increasing level of planned asset renewal being met suggests an improvement in the capacity to meet long term obligations
Measure O1 Asset renewal compared to depreciation (audited)
Definition Defined as asset renewal expense as a percentage of depreciation
Computation NumeratorAsset renewal expenseDenominatorAsset depreciation
Value Data typeNumericFormatNNN.NNPermissible values
76Local GovernmentBetter Practice GuidePerformance Reporting Framework Indicator Workbook

0 to 100.00 expressed as a percentageExpected range40.00 to 130.00 percent
Data source NumeratorFinancial statements (audited)Financial statements (Strategic Resource Plan)DenominatorFinancial statements (audited)Financial statements (Strategic Resource Plan)
Audit EvidenceFinancial statements (including the Statement of Capital Works)Other adviceDepreciation refers to total depreciation, not just the deprecation on renewed assets
Indicator Loans and borrowings
Rationale Indicator of the broad objective that the level of interest bearing loans and borrowings should be appropriate to the size and nature of a council’s activities. Low or decreasing level of loans and borrowings suggests an improvement in the capacity to meet long term obligations
Measure O2 Loans and borrowings compared to rates (audited)
Definition Defined as interest bearing loans and borrowings as a percentage of rate revenue
Computation NumeratorInterest bearing loans and borrowingsDenominatorRate revenue
Value Data typeNumericFormatNNN.NNPermissible values0 to 100.00 expressed as a percentageExpected range0 to 70.00 percent
Data source NumeratorFinancial statements (audited)Financial statements (Strategic Resource Plan)DenominatorFinancial statements (audited)Financial statements (Strategic Resource Plan)
Audit EvidenceFinancial statements
Local GovernmentBetter Practice GuidePerformance Reporting Framework Indicator Workbook
77

Measure O3 Loans and borrowings repayments compared to rates (audited)
Definition Defined as interest and principal repayments on interest bearing loans and borrowings as a percentage of rate revenue
Computation NumeratorInterest and principal repayments on interest bearing loans and borrowingsDenominatorRate revenue
Value Data typeNumericFormatNNN.NNPermissible values0 to 100.00 expressed as a percentageExpected range0 to 20.00 percent
Data source NumeratorFinancial statements (audited)Financial statements (Strategic Resource Plan)DenominatorFinancial statements (audited)Financial statements (Strategic Resource Plan)
Audit EvidenceFinancial statements
Indicator Indebtedness
Rationale Indicator of the broad objective that the level of long term liabilities should be appropriate to the size and nature of a Council’s activities. Low or decreasing level of long term liabilities suggests an improvement in the capacity to meet long term obligations
Measure O4 Non-current liabilities compared to own source revenue (audited)
Definition Defined as non-current liabilities as a percentage of own source revenue
Computation NumeratorNon-current liabilitiesDenominatorOwn source revenue
Value Data typeNumericFormatNNN.NNPermissible values0 to 100.00 expressed as a percentageExpected range2.00 to 70.00 percent
78Local GovernmentBetter Practice GuidePerformance Reporting Framework Indicator Workbook

Data source NumeratorFinancial statements (audited)Financial statements (Strategic Resource Plan)DenominatorFinancial statements (audited)Financial statements (Strategic Resource Plan)
Audit EvidenceFinancial statementsOther adviceDocumented calculation of own-source revenue, with explanation of excluded revenue items
Other information
Key terms Asset renewal expenditureIs expenditure on an existing asset or on replacing an existing asset that returns the service capability of the asset to its original capabilityDepreciationRefers to total depreciation, not just the deprecation on renewed assetsOwn-source revenueIs adjusted underlying revenue excluding revenue which is not under the control of council (including government grants)Rate revenueIs revenue from general rates, municipal charges service rates and service charges (e.g. garbage, recycling and organic charges) levied on rateable properties
Local GovernmentBetter Practice GuidePerformance Reporting Framework Indicator Workbook
79

Operating position (OP)
Definition Measures whether a council is able to generate an adjusted underlying surplus
Objective Generate an adjusted underlying surplus
Outputs Outcomes
Operating position
Obligations
Adjusted underlying
result
Adjusted underling
surplus
Financial Performance
Outcome
IndicatorDimensionKey:
Efficiency
Liquidity
Stability
Measure
OP1 Adjusted underlying surplus (or
deficit)
Objective: Generate an adjusted underlying surplus
Dimension Operating position
Indicator Adjusted underlying result
Rationale Indicator of the broad objective that an adjusted underlying surplus should be generated in the ordinary course of business. A surplus or increasing surplus suggests an improvement in the operating position
Measure OP1 Adjusted underlying surplus (or deficit) (audited)
Definition Defined as the underlying surplus (or deficit) as a percentage of adjusted underlying revenue
Computation NumeratorAdjusted underlying surplus (or deficit)DenominatorAdjusted underlying revenue
Value Data typeNumericFormatNNN.NNPermissible values
80Local GovernmentBetter Practice GuidePerformance Reporting Framework Indicator Workbook

-100.00 to 100.00 expressed as a percentageExpected range-20.00 to 20.00 percent
Data source NumeratorFinancial statements (audited)Financial statements (Strategic Resource Plan)DenominatorFinancial statements (audited)Financial statements (Strategic Resource Plan)
Audit EvidenceFinancial statementsOther adviceDocumented assessment of why excluded grants to fund capital expenditure are non-recurrentDemonstrable link from other excluded contributions to fund capital expenditure, to the relevant capital expenditure
Other information
Key terms Adjusted underlying revenueIs total income other than: non-recurrent capital grants used to fund capital expenditure non-monetary asset contributions contributions to fund capital expenditure from sources other than those
referred to aboveAdjusted underlying surplus (or deficit)Is adjusted underlying revenue less total expenditure.Non-recurrent grantIs operating or capital grants obtained on the condition that they be expended in a specified manner and not expected to be received again during the period covered by the Strategic Resource Plan.Recurrent grantsIs operating or capital grants other than non-recurrent grants.
Local GovernmentBetter Practice GuidePerformance Reporting Framework Indicator Workbook
81

Stability (S)
Definition Measures whether a council is able to generate revenue from a range of sources
Objective Generate revenue from a range of sources
OutcomesOutputs
Operating position
ObligationsRange of revenue sources
Financial Performance
Outcome
IndicatorDimensionKey:
Efficiency
Liquidity
Stability
Measure
S1 Rates v adjusted
underlying revenue
Rates concentration
S2 Rates v property
values Rates effort
Objective: Generate revenue from a range of sources
Dimension Stability
Indicator Rates concentration
Rationale Indicator of the broad objective that revenue should be generated from a range of sources. High or increasing range of revenue sources suggests an improvement in stability
Measure S1 Rates compared to adjusted underlying revenue (audited)
Definition Defined as rate revenue as a percentage of adjusted underlying revenue
Computation NumeratorRate revenueDenominatorAdjusted underlying revenue
Value Data typeNumericFormatNNN.NNPermissible values0 to 100.00 expressed as a percentage
82Local GovernmentBetter Practice GuidePerformance Reporting Framework Indicator Workbook

Expected range30.00 to 80.00 percent
Data source NumeratorFinancial statements (audited)Financial statements (Strategic Resource Plan)DenominatorFinancial statements (audited)Financial statements (Strategic Resource Plan)
Audit EvidenceFinancial statements
Indicator Rates effort
Rationale Indicator of the broad objective that the rating level should be set based on the community’s capacity to pay. Low or decreasing level of rates suggests an improvement in the rating burden
Measure S2 Rates compared to property values (audited)
Definition Defined as rate revenue as a percentage of the capital improved value of rateable properties in the municipality
Computation NumeratorRate revenueDenominatorCapital improved value of rateable properties in the municipality
Value Data typeNumericFormatNNN.NNPermissible values0 to 100.00 expressed as a percentageExpected range0.15 to 0.75 percent
Data source NumeratorFinancial statements (audited)Financial statements (Strategic Resource Plan)DenominatorAnnual budgetForecast capital improved value of rateable properties in the municipality based on the value in the annual budget and underlying the financial statements (Strategic Resource Plan)
Audit EvidenceFinancial statementsCapital Improved Value from rates ledger (e.g. Pathways).Other adviceThe source of the property values should be the same as used to determine the rates budget and/or strike the rate for the following financial year
Local GovernmentBetter Practice GuidePerformance Reporting Framework Indicator Workbook
83

Other information
Key terms Capital Improved ValueIs the market value of a property and is measured at the end of the year and includes all valuation adjustments (e.g. supplementary valuations).Rate revenueIs revenue from general rates, municipal charges, service rates and service charges (e.g. garbage, recycling and organic charges) levied on rateable properties.Adjusted underlying revenueIs total income other than: non-recurrent capital grants to fund capital expenditure non-monetary asset contributions contributions to fund capital expenditure from other sources other than those
referred to above
84Local GovernmentBetter Practice GuidePerformance Reporting Framework Indicator Workbook

5. Sustainable capacity indicators
Capacity (C)
Definition Measures whether the council is able to meet the agreed service needs of the community
Objective Meet the agreed service needs of the community
Outputs Outcomes
Financial performance
Capacity
Agreed service needs met
Sustainability Outcome
IndicatorDimensionKey:
Governance & management
Measure
Population
Disadvantage
C6 Relative socio-
economic disadvantage
Own source revenue
C1 Own source
revenue per capita
Recurrent grants
C2 Recurrent grants per
capita
C3 Expenses per capita
C4 Infrastructure
per capita
C5 Population density per road length
Objective: Meet the agreed service needs of the community
Dimension Capacity
Indicator Population
Rationale Indicator of the broad objective that population is a key driver of a Council’s ability to fund the delivery of services to the community. High or increasing level of population (size, density) suggests an improvement in capacity
Measure C1 Expenses per head of municipal population (audited)
Definition Defined as total expenses per head of municipal population
Computation NumeratorTotal expensesDenominatorMunicipal population
Value Data type
Local GovernmentBetter Practice GuidePerformance Reporting Framework Indicator Workbook
85

NumericFormatNNN.NNPermissible valuesGreater than 0 expressed in dollarsExpected range800.00 to 4,000.00 dollars
Data source NumeratorFinancial statementsDenominatorAustralian Bureau of Statistics – Catalogue 3218.0 Population Estimates by Local Government Area
Audit EvidenceFinancial statementsDocumented source of municipal population estimate, such as ABS census data plus the basis for any growth assumptions adopted by Council
Measure C2 Infrastructure per head of municipal population (audited)
Definition Defined as the value of infrastructure per head of municipal population
Computation NumeratorValue of infrastructureDenominatorMunicipal population
Value Data typeNumericFormatNNN.NNPermissible valuesGreater than 0 expressed in dollarsExpected range3,000.00 to 40,000.00 dollars
Data source NumeratorFinancial statementsDenominatorAustralian Bureau of Statistics – Catalogue 3218.0 Population Estimates by Local Government Area –3218.0
Audit EvidenceWritten down value of infrastructure assets per the financial statements. Infrastructure assets are defined as all property, plant, equipment and infrastructure assets, excluding landDocumented source of municipal population estimate, such as ABS census data plus the basis for any growth assumptions adopted by Council
Measure C3 Population density per length of road (audited)
Definition Defined as municipal population per kilometre of local road
Computation Numerator86
Local GovernmentBetter Practice GuidePerformance Reporting Framework Indicator Workbook

Municipal populationDenominatorKilometres of local roads
Value Data typeNumericFormatNNN.NNPermissible valuesGreater than 0 expressed as a numberExpected range1.00 to 300.00 people
Data source NumeratorAustralian Bureau of Statistics – Catalogue 3218.0 Population Estimates by Local Government AreaDenominatorAsset register or road management system
Audit EvidenceDocumented source of municipal population estimate, such as ABS census data plus the basis for any growth assumptions adopted by Council.Kilometre length of road per Council’s asset register. The measure should be based on road pavement, not surface. It should include all roads (sealed and unsealed)
Indicator Own source revenue
Rationale Indicator of the broad objective that revenue should be generated from a range of sources in order to fund the delivery of services to the community. High or increasing level of own source revenue suggests an improvement in capacity
Measure C4 Own source revenue per head of municipal population (audited)
Definition Defined as own source revenue per head of municipal population
Computation NumeratorOwn source revenueDenominatorMunicipal population
Value Data typeNumericFormatNNN.NNPermissible valuesGreater than 0 expressed in dollarsExpected range700.00 to 2,000.00 dollars
Data source NumeratorFinancial statementsDenominatorAustralian Bureau of Statistics – Catalogue 3218.0 Population Estimates by Local
Local GovernmentBetter Practice GuidePerformance Reporting Framework Indicator Workbook
87

Government Area
Audit EvidenceFinancial statementsDocumented calculation of own-source revenue, with explanation of excluded revenue itemsDocumented source of municipal population estimate, such as Australian Bureau of Statistics (ABS) census data (e.g. Australian Bureau of Statistics – Catalogue 3218.0 Population Estimates by Local Government Area) plus the basis for any growth assumptions adopted by Council
Indicator Recurrent grants
Rationale Indicator of the broad objective that revenue should be generated from a range of sources in order to fund the delivery of services to the community. High or increasing level of recurrent grant revenue suggests an improvement in capacity
Measure C5 Recurrent grants per head of municipal population (audited)
Definition Defined as recurrent grants per head of municipal population
Computation NumeratorRecurrent grantsDenominatorMunicipal population
Value Data typeNumericFormatNNN.NNPermissible valuesGreater than 0 expressed in dollarsExpected range100.00 to 2,000.00 dollars
Data source NumeratorFinancial statementsDenominatorAustralian Bureau of Statistics – Catalogue 3218.0 Population Estimates by Local Government Area
Audit EvidenceFinancial statementsDocumented source of municipal population estimate, such as ABS census data plus the basis for any growth assumptions adopted by CouncilOther advice“Recurrent grants” includes both operating and capital recurrent grants
Indicator Disadvantage
Rationale Indicator of the broad objective that disadvantage is a key driver of a Council’s ability to fund the delivery of services to the community. Low or decreasing level of disadvantage suggests an improvement in capacity
Measure C6 Relative Socio-Economic Disadvantage (audited)
Definition Defined as the relative Socio-Economic Disadvantage of the municipality
88Local GovernmentBetter Practice GuidePerformance Reporting Framework Indicator Workbook

Local GovernmentBetter Practice GuidePerformance Reporting Framework Indicator Workbook
89
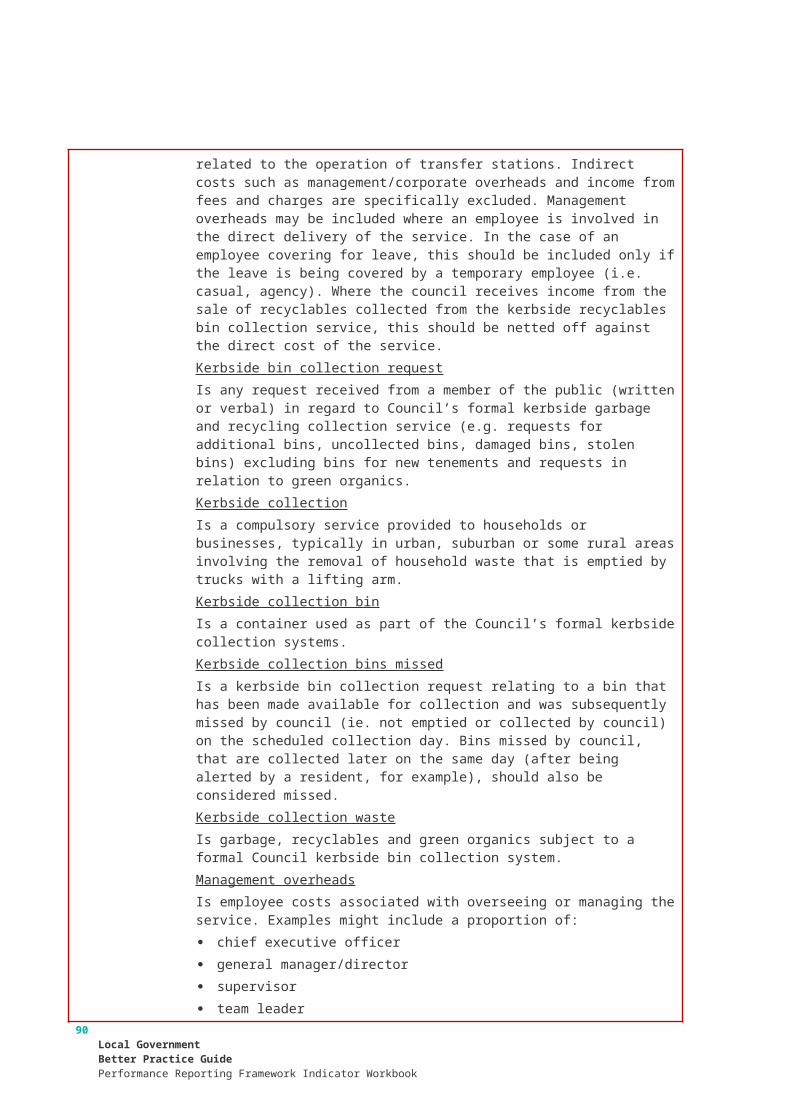
Computation NumeratorIndex of Relative Socio-Economic Disadvantage by decileDenominatorNot applicable
Value Data typeNumericFormatNNNPermissible values1st decile (most disadvantaged) to 10th decile (least disadvantaged) for Victoria expressed as a numberExpected range1 to 10 deciles
Data source NumeratorAustralian Bureau of statistics – 2033.0.55.001 Index of Relative Socio-Economic Disadvantage by Local Government Area and decile within VictoriaDenominatorNot applicable
Audit EvidenceAustralian Bureau of Statistics report 2033.0.55.001 Index of Relative Socio-Economic Disadvantage by Local Government Area and percentile within Victoria
Other information
Key terms InfrastructureIs non-current property, plant and equipment excluding land.Local roadsIs sealed and unsealed roads for which council is the responsible road authority under the Road Management Act 2004. It includes right-of-ways and laneways.Own-source revenueIs adjusted underlying revenue excluding revenue which is not under the control of council (including government grants).Non-recurrent grantsIs operating or capital grants obtained on the condition that they be expended in a specified manner and not expected to be received again during the period covered by the Strategic Resource Plan.Recurrent grantsIs operating or capital grants other than non-recurrent grants.Relative Socio-Economic DisadvantageIs a general socio-economic index that summarises a range of information about the economic and social conditions of people and households within an area. The index includes only measures of relative disadvantage and is expressed as a decile for the relevant financial year of the area in which the municipality is located according to the Victorian Index of Relative Socio-Economic Disadvantage (Catalogue Number 2033.0.55.001).
Notes The road network is used as the denominator for population per length of road to recognise remote councils which may have large tracts of uninhabited or un-serviced land.
90Local GovernmentBetter Practice GuidePerformance Reporting Framework Indicator Workbook
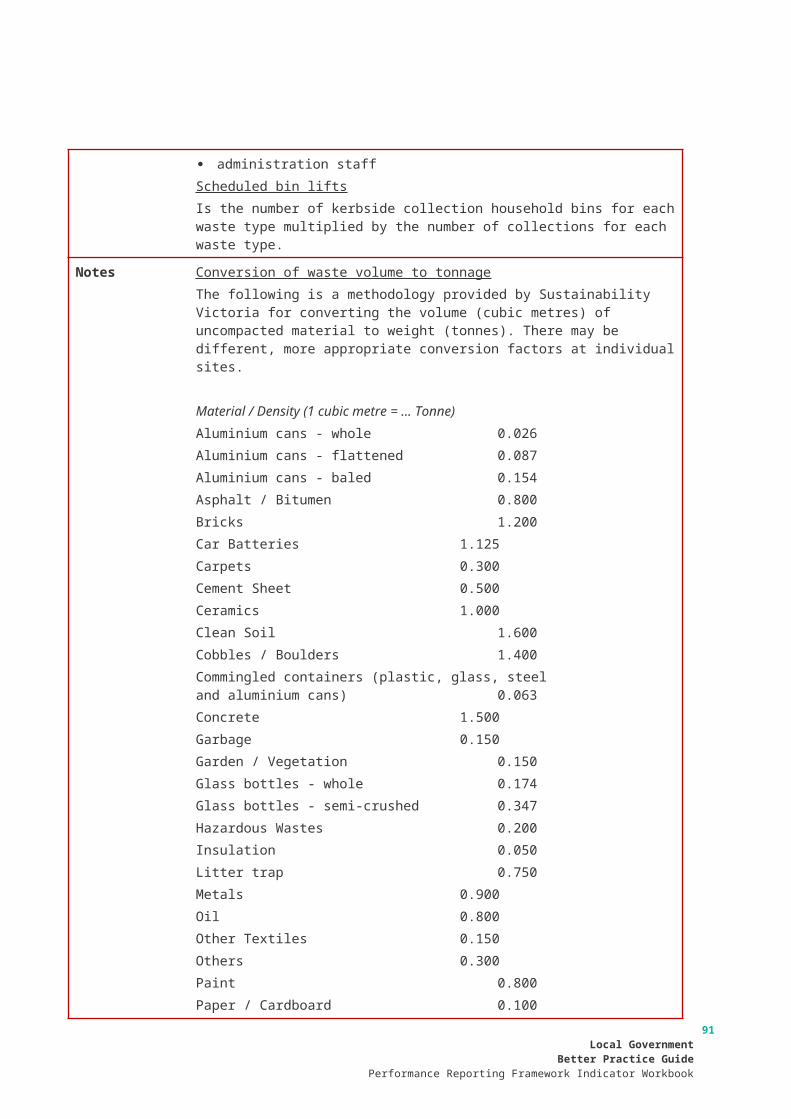
6. Governance and management checklist
ChecklistDefinition Measures whether a council has strong governance and management
frameworks in place covering community engagement, planning, monitoring, reporting and decision-making
Objective Strong governance and management frameworks
Outputs Outcomes
Financial performance
CapacityStrong
governance and
management frameworks
Sustainability Outcome
IndicatorDimensionKey:
Governance & management
Measure
24 x Qualitative measures
Community engagement
Planning
Monitoring
Reporting
Decision making
Objective: Strong governance and management frameworks
Dimension Governance and management
Indicator Community engagement
Rationale Indicator of the broad objective that community engagement is important for good decision-making. Having appropriate engagement policies and procedures suggests an improvement in decision-making
Measure 1. Community engagement policy
Definition Policy outlining Council’s commitment to engaging with the community on matters of public interest
Computation AssessmentPolicyNo policyOtherWhere Council has a policy, it must also provide details of the date of operation of the current policy. Where Council has no policy, it must provide a reason.
Data source Council records
Local GovernmentBetter Practice GuidePerformance Reporting Framework Indicator Workbook
91

92Local GovernmentBetter Practice GuidePerformance Reporting Framework Indicator Workbook

Measure 2. Community engagement guidelines
Definition Guidelines to assist staff to determine when and how to engage with the community
Computation AssessmentGuidelinesNo guidelinesOtherWhere Council has guidelines, it must also provide details of the date of operation of the current guidelines. Where Council has no guidelines, it must provide a reason
Data source Council records
Indicator Planning
Rationale Indicator of the broad objective that planning is important for good decision-making. Having appropriate plans in place suggests an improvement in decision-making
Measure 3. Strategic Resource Plan
Definition Plan under section 126 of the Act outlining the financial and non-financial resources required for at least the next 4 financial years
Computation AssessmentAdopted in accordance with section 126 of the ActNot adopted in accordance with section 126 of the ActOtherWhere Council has adopted a Strategic Resource Plan in accordance with section 126 of the Act it must also provide details of the date of adoption of the current Strategic Resource Plan. Where Council has not adopted a Strategic Resource Plan in accordance with section 126 of the Act it must provide a reason
Data source Council records
Measure 4. Annual budget
Definition Plan under section 130 of the Act setting out the services to be provided and initiatives to be undertaken over the next 12 months and the funding and other resources required
Computation AssessmentAdopted in accordance with section 130 of the ActNot adopted in accordance with section 130 of the ActOtherWhere Council has adopted a budget in accordance with section 130 of the Act it must also provide details of the date of adoption of the budget. Where Council has not adopted a budget in accordance with section 130 of the Act it must provide a reason
Data source Council records
Measure 5. Asset management plans
Definition Plans that set out the asset maintenance and renewal needs for key infrastructure asset classes for at least the next 10 years
Local GovernmentBetter Practice GuidePerformance Reporting Framework Indicator Workbook
93
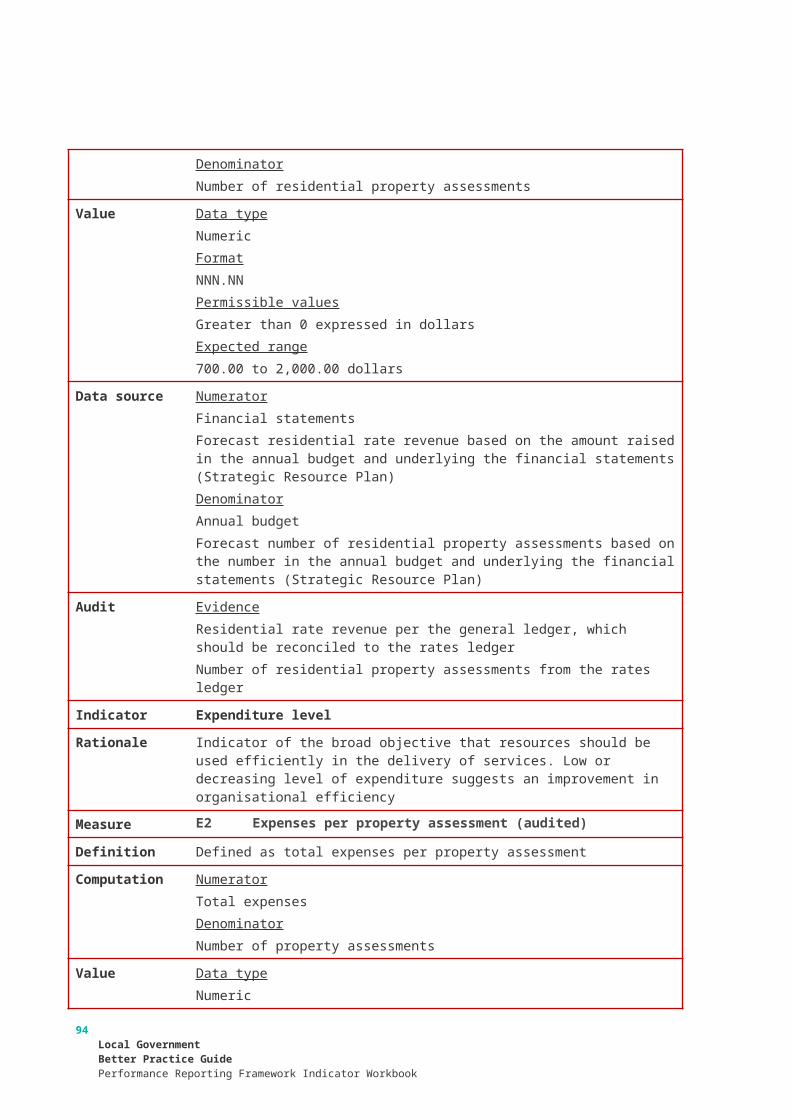
Computation AssessmentPlansNo plansOtherWhere Council has plans, it must also provide details of the date of operation of the current plans. Where Council has no plans, it must provide a reason
Data source Council records
Measure 6. Rating strategy
Definition Strategy setting out the rating structure of council to levy rates and charges
Computation AssessmentStrategyNo strategyOtherWhere Council has a strategy, it must also provide details of the date of operation of the current strategy. Where Council has no strategy, it must provide a reason
Data source Council records
Measure 7. Risk policy
Definition Policy outlining Council’s commitment and approach to minimising the risks to Council’s operations
Computation AssessmentPolicyNo policyOtherWhere Council has a policy, it must also provide details of the date of operation of the current policy. Where Council has no policy, it must provide a reason
Data source Council records
Measure 8. Fraud policy
Definition Policy outlining Council’s commitment and approach to minimising the risk of fraud
Computation AssessmentPolicyNo policyOtherWhere Council has a policy, it must also provide details of the date of operation of the current policy. Where Council has no policy, it must provide a reason
Data source Council records
Measure 9. Municipal emergency management plan
Definition Plan under section 20 of the Emergency Management Act 1986 for emergency prevention, response and recovery
Computation AssessmentPrepared and maintained in accordance with section 20 of the Emergency Management Act 1986Not prepared and maintained in accordance with section 20 of the Emergency
94Local GovernmentBetter Practice GuidePerformance Reporting Framework Indicator Workbook

Management Act 1986OtherWhere Council has prepared and maintained a Municipal Emergency Management Plan in accordance with section 20 of the Emergency Management Act 1986 it must also provide details of the date of preparation of the Plan. Where Council has not prepared and maintained a Municipal Emergency Management Plan in accordance with section 20 of the Emergency Management Act 1986 it must provide a reason
Data source Council records
Measure 10. Procurement policy
Definition Policy under section 186A of the Act outlining the matters, practices and procedures that will apply to all purchases of goods, services and works
Computation AssessmentPrepared and approved in accordance with section 186A of the ActNot prepared and approved in accordance with section 186A of the ActOtherWhere Council has prepared and approved a procurement policy in accordance with section 186A of the Act it must also provide details of the date of approval of the policy. Where Council has not prepared and approved a procurement policy in accordance with section 186A of the Act it must provide a reason
Data source Council records
Measure 11. Business continuity plan
Definition Plan setting out the actions that will be undertaken to ensure that key services continue to operate in the event of a disaster
Computation AssessmentPlanNo planOtherWhere Council has a plan, it must also provide details of the date of operation of the current plan. Where Council has no plan, it must provide a reason
Data source Council records
Measure 12. Disaster recovery plan
Definition Plan setting out the actions that will be undertaken to recover and restore business capability in the event of a disaster
Computation AssessmentPlanNo planOtherWhere Council has a plan, it must also provide details of the date of operation of the current plan. Where Council has no plan, it must provide a reason
Data source Council records
Indicator Monitoring
Rationale Indicator of the broad objective that monitoring is important for good decision-making. Having appropriate monitoring in place suggests an improvement in
Local GovernmentBetter Practice GuidePerformance Reporting Framework Indicator Workbook
95

decision-making
Measure 13. Risk management framework
Definition Framework outlining Council’s approach to managing risks to the Council’s operations
Computation AssessmentFrameworkNo frameworkOtherWhere Council has a framework, it must also provide details of the date of operation of the current framework. Where Council has no framework, it must provide a reason
Data source Council records
Measure 14. Audit committee
Definition Advisory committee of Council under section 139 of the Act whose role is to oversee the integrity of Council’s financial reporting, processes to manage risks to the Council’s operations and for compliance with applicable legal, ethical, and regulatory requirements
Computation AssessmentEstablished in accordance with section 139 of the ActNot established in accordance with section 139 of the ActOtherWhere Council has established an Audit Committee in accordance with section 139 of the Act it must also provide details of the date of establishment of the Committee. Where Council has not established an Audit Committee in accordance with section 139 of the Act it must provide a reason
Data source Council records
Measure 15. Internal audit
Definition Independent accounting professionals engaged by the Council to provide analyses and recommendations aimed at improving Council’s governance, risk and management controls
Computation AssessmentEngagedNot engagedOtherWhere Council has engaged an internal audit provider it must also provide details of the date of engagement of the current provider. Where Council has not engaged an internal audit provider it must provide a reason
Data source Council records
Measure 16. Performance reporting framework
Definition A set of indicators measuring financial and non-financial performance including the performance indicators referred to in section 131 of the Act
Computation AssessmentFrameworkNo framework
96Local GovernmentBetter Practice GuidePerformance Reporting Framework Indicator Workbook

OtherWhere Council has a framework, it must also provide details of the date of operation of the current framework. Where Council has no framework, it must provide a reason
Data source Council records
Indicator Reporting
Rationale Indicator of the broad objective that reporting is important for good decision-making. Having appropriate reporting in place suggests an improvement in decision-making
Measure 17. Council plan reporting
Definition Report reviewing the performance of the Council against the Council Plan including the results in relation to the strategic indicators for the first six months of the financial year
Computation AssessmentReportNo reportOtherWhere Council has a report, it must also provide details of the date of the report. Where Council has no report, it must provide a reason
Data source Council records
Measure 18. Financial reporting
Definition Quarterly statements to Council under section 138(1) of the Act comparing budgeted revenue and expenditure with actual revenue and expenditure
Computation AssessmentStatements presented to Council in accordance with section 138(1) of the ActNo statements presented to Council in accordance with section 138(1) of the ActOtherWhere statements have been presented to Council in accordance with section 138(1) of the Act it must also provide details of the date the statements were presented. Where Statements have not been presented to Council in accordance with section 138(1) of the Act it must provide a reason
Data source Council records
Measure 19. Risk reporting
Definition Six-monthly reports of strategic risks to Council’s operations, their likelihood and consequences of occurring and risk minimisation strategies
Computation AssessmentReportsNo reportsOtherWhere Council has reports, it must also provide details of the dates of the reports. Where Council has no reports, it must provide a reason
Data source Council records
Measure 20. Performance reporting
Local GovernmentBetter Practice GuidePerformance Reporting Framework Indicator Workbook
97

Definition Six-monthly reports of indicators measuring results against financial and non-financial performance including the performance indicators referred to in section 131 of the Act
Computation AssessmentReportsNo reportsOtherWhere Council has reports, it must also provide details of the dates of the reports. Where Council has no reports, it must provide a reason
Data source Council records
Measure 21. Annual report
Definition Annual report under sections 131, 132 and 133 of the Act to the community containing a report of operations and audited financial and performance statements
Computation AssessmentConsidered at meeting of Council in accordance with section 134 of the ActNot considered at meeting of Council in accordance with section 134 of the ActOtherWhere the Annual Report has been considered by Council in accordance with section 134 of the Act it must also provide details of the date of consideration. Where the Annual Report has not been considered by Council in accordance with section 134 of the Act it must provide a reason
Data source Council records
Indicator Decision-making
Rationale Indicator of the broad objective that good decision-making is important. Having appropriate decision-making policies and procedures in place suggests an improvement in decision-making
Measure 22. Councillor Code of Conduct
Definition Code under section 76C of the Act setting out the conduct principles and the dispute resolution processes to be followed by all Councillors
Computation AssessmentReviewed in accordance with section 76C of the ActNot reviewed in accordance with section 76C of the ActOtherWhere the Code of Conduct has been reviewed by Council in accordance with section 76C of the Act it must also provide details of the date of review. Where the Code of Conduct has not been reviewed by Council in accordance with section 76C of the Act it must provide a reason
Data source Council records
Measure 23. Delegations
Definition A document setting out the powers, duties and functions of Council and the Chief Executive Officer that have been delegated to members of staff
Computation AssessmentReviewed in accordance with section 98(6) of the Act
98Local GovernmentBetter Practice GuidePerformance Reporting Framework Indicator Workbook

Not reviewed in accordance with section 98(6) of the ActOtherWhere the Delegations have been reviewed by Council in accordance with section 98(6) of the Act Council must also provide details of the date of review. Where the Delegations have not been reviewed by Council in accordance with section 98(6) of the Act it must provide a reason
Data source Council records
Measure 24. Meeting procedures
Definition A local law governing the conduct of meetings of Council and special committees
Computation AssessmentMeeting procedures local law made in accordance with section 91(1) of the ActNo meeting procedures local law made in accordance with section 91(1) of the ActOtherWhere a meeting procedures local law has been made by Council in accordance with section 91(1) of the Act Council must also provide details of the date the local law was made. Where a meeting procedures local law has not been made by Council in accordance with section 91(1) of the Act Council it must provide a reason
Data source Council records
Local GovernmentBetter Practice GuidePerformance Reporting Framework Indicator Workbook
99

7. Optional service performance indicators
Economic Development (ED)
Definition Provision of support and advice to businesses and industry including lobbying, partnership opportunities, networking and training programs
Objective To stimulate local economic activity
Effectiveness
Efficiency
Outputs Outcomes
Appropriateness
Quality
Cost
Participation
Service standard
Service Cost
ED1 Participation in business
development activities
ED2 Delivery of planned business
development activities
ED3 Cost of economic
development service
Economic activity
ED4 Change in number of businesses
Service outcome
MeasureIndicatorDimensionKey:
Objective: To stimulate local economic activity
Dimension Appropriateness
Indicator Participation
Rationale Indicator of the broad objective that businesses should actively participate in Council funded business development activities. High or increasing participation suggests an improvement in the appropriateness of the economic development activities
Measure ED1 Participation in business development activities
Definition Defined as the percentage of businesses with an ABN in the municipality that participate in at least one Council business development activity
Computation NumeratorNumber of businesses with an ABN in the municipality that participate in a business development activityDenominatorNumber of businesses with an ABN in the municipality
Value Data typeNumericFormatNNN.NNPermissible values
100Local GovernmentBetter Practice GuidePerformance Reporting Framework Indicator Workbook

0 to 100.00 expressed as a percentage
Data source NumeratorManual record (e.g. event register)DenominatorAustralian Business Register – Australian Taxation Office
Dimension Quality
Indicator Service standard
Rationale Indicator of the broad objective that business development activities should be delivered as planned. High or increasing number of business development activities delivered in accordance with plans suggests an improvement in the quality of economic development
Measure ED2 Delivery of planned business development activities
Definition Defined as the percentage of planned Council business development activities that are delivered
Computation NumeratorNumber of business development activities deliveredDenominatorNumber of planned business development activities
Value Data typeNumericFormatNNN.NNPermissible values0 to 100.00 expressed as a percentage
Data source NumeratorManual record (e.g. event record)DenominatorManual record (e.g. business plan)
Dimension Cost
Indicator Service cost
Rationale Indicator of the broad objective that economic development activities should be delivered in a cost-efficient manner. Low or decreasing cost suggests an improvement in the cost-efficiency of economic development activities
Measure ED3 Cost of economic development service
Definition Defined as the direct cost of providing economic development services per business with an ABN in the municipality
Computation NumeratorDirect cost of delivering the economic development servicesDenominatorNumber of businesses with an ABN in the municipality
Value Data typeNumeric
Local GovernmentBetter Practice GuidePerformance Reporting Framework Indicator Workbook
101

FormatNNN.NNPermissible valuesGreater than 0 expressed in dollars
Data source NumeratorFinance system (e.g. TechnologyOne)DenominatorAustralian Business Register – Australian Taxation Office
Dimension Service outcome
Indicator Economic activity
Rationale Indicator of the broad objective that economic development activities should support the stimulation of local economic activity. High or increasing number of businesses suggests and improvement in the effectiveness of economic development activities
Measure ED4 Change in number of businesses
Definition Defined as the percentage change in the number of businesses with an ABN in the municipality
Computation NumeratorNumber of businesses with an ABN in the municipality at the end of the financial year less the number of businesses at the start of the financial yearDenominatorNumber of businesses with an ABN in the municipality at the start of the financial year
Value Data typeNumericFormatNNN.NNPermissible values-100.00 to 100.00 expressed as a percentage
Data source NumeratorAustralian Business Register – Australian Taxation OfficeDenominatorAustralian Business Register – Australian Taxation Office
Other information
Key terms BusinessIs an individual or entity registered on the Australian Business Register and resident in the municipality.Business development activityIs an activity funded through the council economic development service and delivered to a business and/or business representative for the purposes of building capacity or awareness. There should be a clear link between the activities (which would normally be expressed in the service unit’s business plan) and the council’s economic development strategy and/or council plan. Activities include events run by the council or in partnership with entities, mentoring, one-on-one meetings, business incubators and trader associations. It excludes production of
102Local GovernmentBetter Practice GuidePerformance Reporting Framework Indicator Workbook

online, social media and printed materialWhere business development activities are delivered from other service areas within the council the following principles should be applied for the purposes of determining whether they should be included in the calculation of the economic development indicators and measures: does the primary purpose of the activity support the objective of economic
development ‘to stimulate local economic activity’? does the activity fit within the definition of economic development being ‘the
provision of support and advice to businesses and industry including lobbying, partnership opportunities, networking and training programs’?
are businesses or industries the main audience for the activity? could the activity more logically fit within another service area (irrespective of
whether that service is included in the LGPRF)?Business participation in a business development activityIs a business (or its representative) that has participated in at least one council business development activity. Where more than one representative attends from the same business, it is the business that is counted.Corporate overheadsIs costs associated with supporting the delivery of the service. Examples include: payroll human resources finance (including financial and management accounting, purchasing,
accounts payable and accounts receivable) information technologyDirect costIs operating expenses directly related to the delivery of the economic development service. This includes expenses such as salaries and oncosts, agency and contract staff, training and development, conferences and seminars, materials, maintenance, legal fees, travel and vehicle/plant hire costs, phones, computer costs (where they are specific to the service), business development activities and other incidental expenses. It does not include civic events/functions, capital purchases such as vehicles or equipment. Indirect costs such as depreciation and management/corporate overheads are specifically excluded. Management overheads may be included where an employee is involved in the direct delivery of the service. In the case of an employee covering for leave, this should be included only if the leave is being covered by a temporary employee (i.e. casual, agency).Management overheadsIs employee costs associated with overseeing or managing the service. Examples might include a proportion of: chief executive officer general manager/director supervisor team leader administration staffNumber of businesses with an ABNIs the number of businesses with an ABN at the end of the financial year unless specifically stated in the computation.
Notes Australian Business RegisterThe Australian Business Register (ABR) has developed a standard reporting query that allows councils to calculate the number of businesses with an ABN, in
Local GovernmentBetter Practice GuidePerformance Reporting Framework Indicator Workbook
103

their municipality. A tutorial has been prepared by the ABR to assist councils to run the query and is available by emailing [email protected] some councils tourism is an essential part of their economic development service. Where there is a clear connection between the tourism activities of the council (e.g. tourism business association) and business development, these costs should be included for the purposes of calculating the service cost measure.
104Local GovernmentBetter Practice GuidePerformance Reporting Framework Indicator Workbook

Immunisation (I)
Definition Provision of vaccinations against preventable diseases to children and secondary school children
Objective To minimise the incidence of vaccine preventable disease
Effectiveness
Efficiency
Outputs Outcomes
Appropriateness
Quality
Cost
Satisfaction
Service standard
Service cost
I1 User satisfaction with
immunisation service
Participation
I5 Vaccination of children
Service outcome
I4 Direct cost of immunisation
service
I2 Vaccination of children by council
I3 Return of consent cards by secondary school
childrenI6 Vaccination of secondary school
children
MeasureIndicatorDimensionKey:
Objective: To minimise the incidence of vaccine preventable disease
Dimension Appropriateness
Indicator Satisfaction
Rationale Indicator of the broad objective that users should be satisfied with the provision of the immunisation service. High or increasing satisfaction suggests an improvement in the appropriateness of the immunisation service
Measure I1 User satisfaction with immunisation service
Definition Defined as the proportion of users who are satisfied with the children immunisation service
Computation NumeratorUser satisfaction with how council has performed on provision of children immunisation serviceDenominatorNot applicable
Value Data typeNumericFormatNNNPermissible valuesGreater than 0 expressed as a number
Data source NumeratorNo data availableDenominatorNot applicable
Local GovernmentBetter Practice GuidePerformance Reporting Framework Indicator Workbook
105

Dimension Quality
Indicator Service standard
Rationale Indicator of the broad objective that the immunisation service should be provided in accordance with agreed standards. High or increasing compliance with agreed standards suggests an improvement in the effectiveness of the immunisation service
Measure I2 Vaccination of children by council
Definition Defined as the proportion of children who are fully vaccinated by council
Computation NumeratorPercentage of children fully vaccinated by councilDenominatorNot applicable
Value Data typeNumericFormatNNN.NNPermissible values0 to 100.00 expressed as a percentage
Data source NumeratorAustralian Childhood Immunisation Register – NIC5B ReportDenominatorNot applicable
Measure I3 Return of consent cards by secondary school children
Definition Defined as the proportion of eligible secondary school children who return consent cards
Computation NumeratorNumber of secondary school consent cards returnedDenominatorTotal number of secondary school children
Value Data typeNumericFormatNNN.NNPermissible values0 to 100.00 expressed as a percentage
Data source NumeratorManual record (e.g. consent cards)DenominatorManual record (e.g. enrolments)
Dimension Cost
Indicator Service cost
Rationale Indicator of the broad objective that the immunisation service should be delivered
106Local GovernmentBetter Practice GuidePerformance Reporting Framework Indicator Workbook
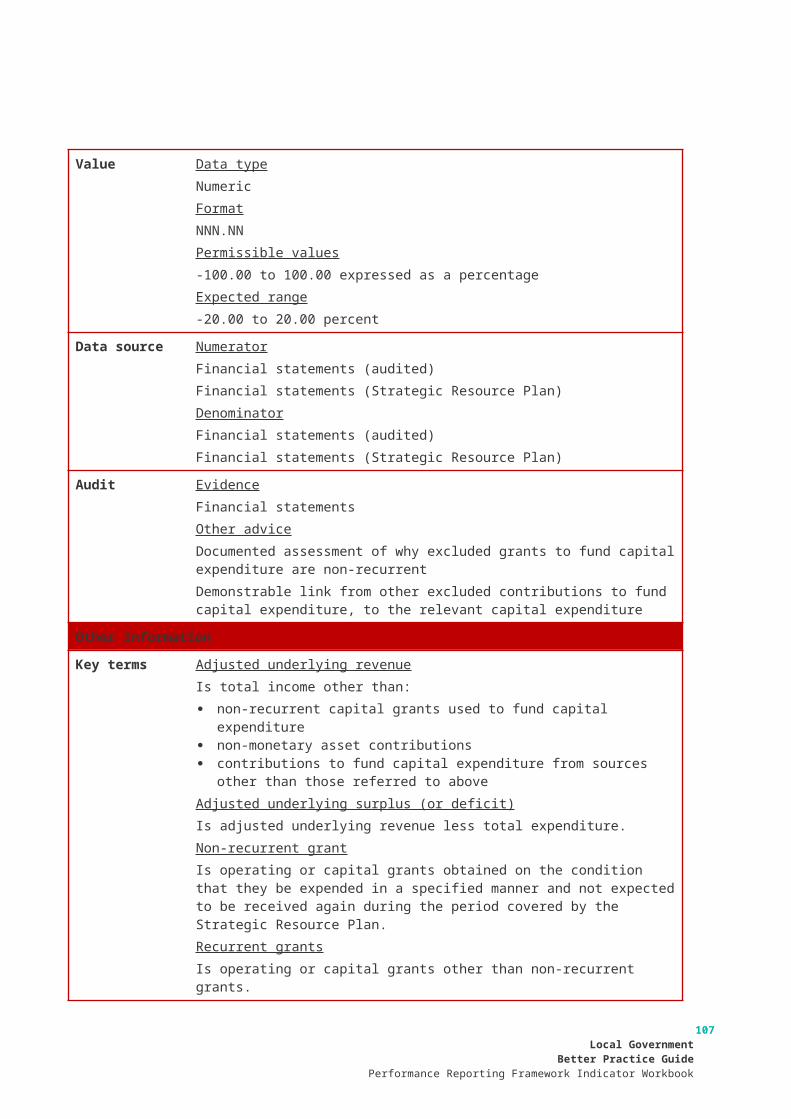
in a cost-efficient way. Low or decreasing cost suggests an improvement in the cost-efficiency of the immunisation service
Measure I4 Cost of immunisation service
Definition Defined as the direct cost of immunising children and secondary school children per vaccination
Computation NumeratorDirect cost of immunisation serviceDenominatorTotal number of vaccinations
Value Data typeNumericFormatNNN.NNPermissible valuesGreater than 0 expressed in dollars
Data source NumeratorFinance system (e.g. TechnologyOne)DenominatorImmunisation system (e.g. IMPS)
Dimension Service outcome
Indicator Participation
Rationale Indicator of the broad objective that vaccinations should be administered to minimise the incidence of vaccine preventable disease. High or increasing participation suggests an improvement in the effectiveness of the immunisation service
Measure I5 Vaccination of children
Definition Defined as the proportion of children who are fully vaccinated
Computation NumeratorPercentage of children who are fully vaccinated in each age groupDenominatorNot applicable
Value Data typeNumericFormatNNN.NNPermissible values0 to 100.00 expressed as a percentage
Data source NumeratorAustralian Childhood Immunisation Register – Coverage ReportDenominatorNot applicable
Measure I6 Vaccination of secondary school children
Local GovernmentBetter Practice GuidePerformance Reporting Framework Indicator Workbook
107

Definition Defined as the proportion of secondary school children who are fully vaccinated
Computation NumeratorNumber of secondary school children fully vaccinated by councilDenominatorTotal number of secondary school children
Value Data typeNumericFormatNNN.NNPermissible values0 to 100.00 expressed as a percentage
Data source NumeratorImmunisation system (e.g. IMPS)DenominatorManual record (e.g. school enrolments)
Other information
Key terms Age groupSee definition of children.ChildrenIs all children in the 12-15, 24-27 and 60-63 months cohort.Corporate overheadsIs costs associated with supporting the delivery of the service. Examples include: payroll human resources finance (including financial and management accounting, purchasing,
accounts payable and accounts receivable) information technologyDirect costIs operating expenses directly related to the delivery of the immunisation service. This includes expenses such as salaries and oncosts, agency and contract staff, training and development, contractors, materials, maintenance, travel and vehicle/plant hire costs, phones, computers costs (where they are specific to the service) and other incidental expenses. It does not include capital purchases such as vehicles and equipment. Indirect costs such as depreciation and management/corporate overheads and income from fees and charges are specifically excluded. Management overheads may be included where an employee is involved in the direct delivery of the service. In the case of an employee covering for leave, this should be included only if the leave is being covered by a temporary employee (i.e. casual, agency).Management overheadsIs employee costs associated with overseeing or managing the service. Examples might include a proportion of: chief executive officer general manager/director supervisor team leader administration staff
108Local GovernmentBetter Practice GuidePerformance Reporting Framework Indicator Workbook

Secondary school childrenIs all children in the 7-10 year cohort as measured by enrolments.
Notes Reporting periodThe reporting period for secondary school children vaccinations is a calendar yearSeparation of other service activitiesWhere the immunisation service forms part of a larger budget program including complementary activities such as environmental health, food safety or Maternal and Child Health it will be necessary to separate the costs of the various activities in order to calculate the service cost indicator. The following approach is suggested for allocating costs to activities:
• specific costs – Identify costs which are specific to each activity such as staff, consultants, vehicles and the like and allocate across activities
• shared costs – For the remaining costs which are shared between activities, these need to be allocated on the basis of an appropriate driver. For example, EFTs can be used as a driver for most shared costs where there is a connection between the cost and the work of the staff. Where staff work across activities, an estimate of the time spent on each activity (expressed as a percentage) will need to be made. This can be done through timesheets either on an ongoing basis or for a temporary time period provided it is representative of actual activity and workload
Local GovernmentBetter Practice GuidePerformance Reporting Framework Indicator Workbook
109

Sports grounds (SG)
Definition Provision of outdoor sports grounds including, playing surfaces and on-ground infrastructure to local sporting groups and casual users for structured activities
Objective To provide accessible and well utilised facilities
Effectiveness
Efficiency
Outputs Outcomes
Appropriateness
Quality
Cost
Utilisation
Service standard
Service Cost
SG1 Structured activities on sports
fields
SG2 Condition of sports fields
SG3 Direct cost of sports grounds
Availability
SG4 Population per sports field
Service outcome
MeasureIndicatorDimensionKey:
Objective: To provide accessible and well utilised facilities
Dimension Appropriateness
Indicator Utilisation
Rationale Indicator of the broad objective that sports grounds should be well utilised by sporting groups. High or increasing utilisation suggests an improvement the appropriateness of sports grounds
Measure SG1 Structured activities on sports fields
Definition Defined as the number of structured activities per sports field
Computation NumeratorNumber of structured activitiesDenominatorTotal number of sports fields
Value Data typeNumericFormatNNN.NNPermissible valuesGreater than 0 expressed as a number
Data source NumeratorFacilities booking systemDenominatorAsset management system
110Local GovernmentBetter Practice GuidePerformance Reporting Framework Indicator Workbook

Dimension Quality
Indicator Condition
Rationale Indicator of the broad objective that sport grounds should be maintained at the required condition standard. High or increasing condition standard suggests an improvement in the quality of sports grounds
Measure SG2 Condition of sports fields
Definition Defined as the number of sports fields unavailable for use due to sub-standard condition
Computation NumeratorNumber of days sports fields are unavailable for structured activities due to condition excluding maintenance and reconstruction/redevelopmentDenominatorTotal number of sports fields
Value Data typeNumericFormatNNN.NNPermissible valuesGreater than 0 expressed as a number
Data source NumeratorManual record (e.g. Condition report received from sporting clubs and/or council)DenominatorAsset management system
Dimension Cost
Indicator Service cost
Rationale Indicator of the broad objective that the provision of sports grounds should be undertaken in a cost-efficient way. Low or decreasing cost suggests an improvement in the cost-efficiency of sports grounds
Measure SG3 Cost of sports grounds
Definition Defined as the direct cost per sports field
Computation NumeratorDirect cost of sports groundsDenominatorTotal number of sports fields
Value Data typeNumericFormatNNN.NNPermissible valuesGreater than 0 expressed in dollars
Data source NumeratorFinance system (e.g. TechnologyOne)
Local GovernmentBetter Practice GuidePerformance Reporting Framework Indicator Workbook
111
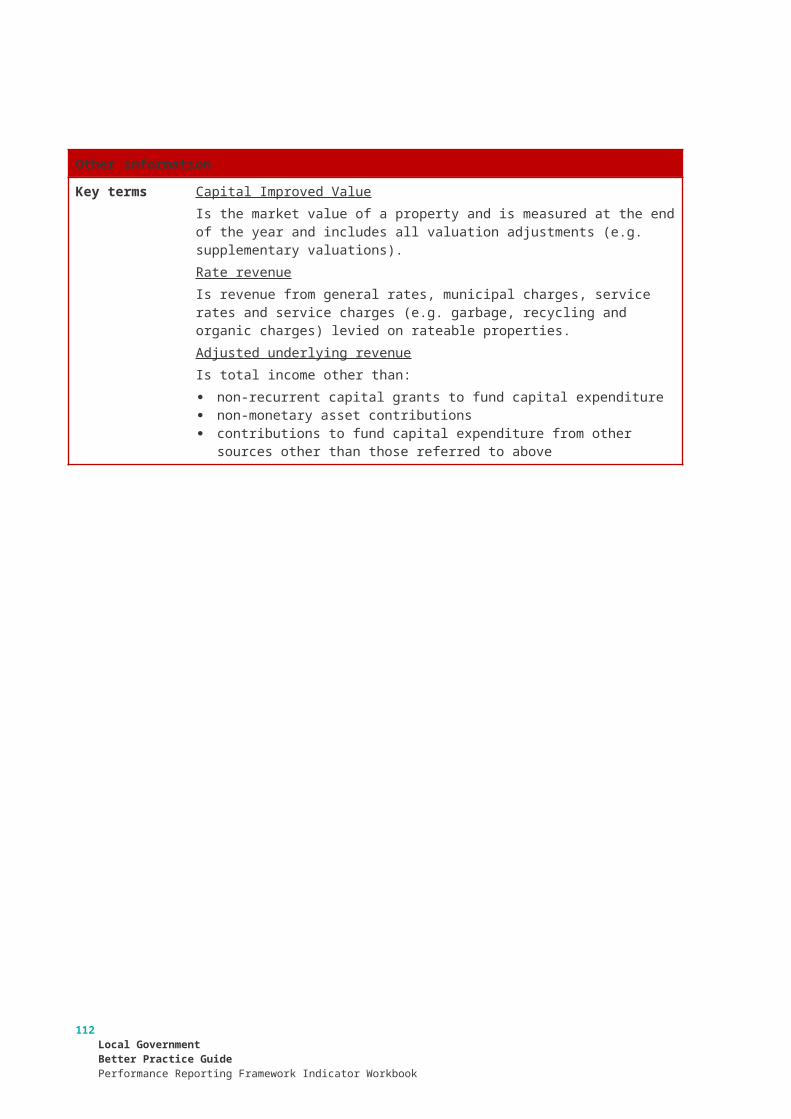
DenominatorAsset management system
Dimension Service outcome
Indicator Availability
Rationale Indicator of the broad objective sports grounds should be accessible and well utilised. High or increasing availability suggests an improvement in the effectiveness of sports grounds
Measure SG4 Population per sports field
Definition Defined as head of municipal population per sports field
Computation NumeratorMunicipal populationDenominatorTotal number of sports fields
Value Data typeNumericFormatNNN.NNPermissible valuesGreater than 0 expressed as a number
Data source NumeratorAustralian Bureau of Statistics – Catalogue 3218.0 Population Estimates by Local Government AreaDenominatorAsset management system
Other information
Key terms Corporate overheadsIs costs associated with supporting the delivery of the service. Examples include: payroll human resources finance (including financial and management accounting, purchasing,
accounts payable and accounts receivable) information technologyDirect costIs operating expenses directly related to the delivery of the sports grounds service. This includes expenses such as salaries and oncosts, agency and contract staff, training and development, contractors, materials, maintenance, travel and vehicle/plant hire costs, phones, computers costs (where they are specific to the service) and other incidental expenses. It does not include asset renewal such as redevelopment costs or capital purchases such as vehicles and equipment. Indirect costs such as depreciation and management/corporate overheads and income from fees and charges are specifically excluded. Management overheads may be included where an employee is involved in the direct delivery of the service. In the case of an employee covering for leave, this should be included only if the leave is being covered by a temporary employee (i.e. casual, agency).Management overheads
112Local GovernmentBetter Practice GuidePerformance Reporting Framework Indicator Workbook

Is employee costs associated with overseeing or managing the service. Examples might include a proportion of: chief executive officer general manager/director supervisor team leader administration staffSports FieldIs an individual field within a sports ground that is primarily for the purpose of playing one sporting activity (e.g. tennis court, football ground). It does not include fields which are not under the control of council (e.g. crown land, long term formal lease) despite them being managed by a Council Committee of Management.Structured activityIs a single sporting activity including competition, training and casual use conducted on a sports field such as cricket, football, soccer, netball etc.
Notes Not applicable
Local GovernmentBetter Practice GuidePerformance Reporting Framework Indicator Workbook
113
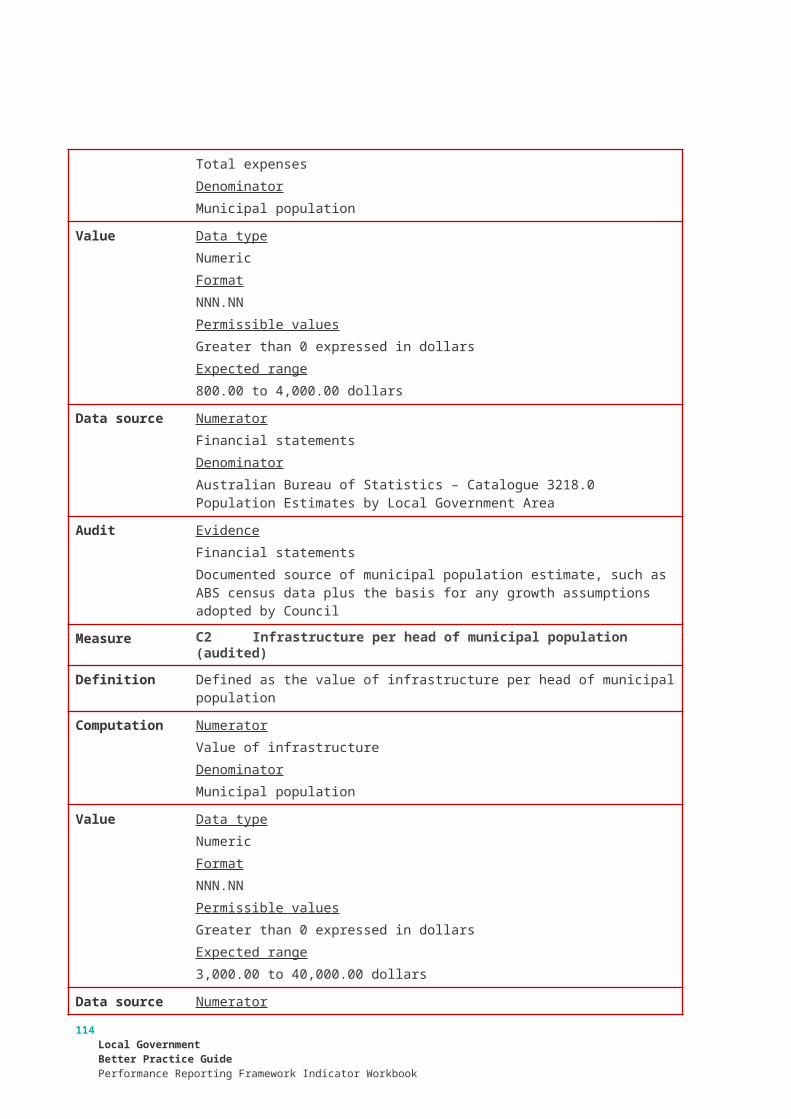
Street sweeping (SS)
Definition Provision of street sweeping services to the community including removal of litter and debris from local sealed roads
Objective To provide clean local roads while minimising environmental and flooding risks
Effectiveness
Efficiency
Outputs Outcomes
Appropriateness
Quality
Cost
Satisfaction
Service standard
Service Cost
SS1 Street sweeping requests
SS2 Frequency of local sealed road
sweeping
SS3 Cost of street sweeping service
Environmental and flooding
risk
SS4 Routine cleaning of local sealed road pits
Service outcome
MeasureIndicatorDimensionKey:
Objective: To provide clean local roads while minimising environmental and flooding risks
Dimension Appropriateness
Indicator Satisfaction
Rationale Indicator of the broad objective that users should be satisfied with the street sweeping service. High or increasing satisfaction suggests an improvement in the appropriateness of the street sweeping service
Measure SS1 Street sweeping requests
Definition Defined as the number of street sweeping requests per household
Computation NumeratorNumber of street sweeping requestsDenominatorTotal number of sealed local road households subject to a street sweeping service
Value Data typeNumericFormatNNN.NNPermissible valuesGreater than 0 expressed as a number
Data source NumeratorCustomer request system (e.g. Pathway)DenominatorAsset management system or GIS
114Local GovernmentBetter Practice GuidePerformance Reporting Framework Indicator Workbook

Dimension Quality
Indicator Service standard
Rationale Indicator of the broad objective that street sweeping should be provided in accordance with agreed standards. High or increasing compliance with standards suggests an improvement in the quality of the street sweeping service
Measure SS2 Frequency of sealed local road sweeping
Definition Defined as the number of times sealed local roads are swept
Computation NumeratorNumber of kilometres of sealed local roads sweptDenominatorTotal kilometres of local sealed local roads required to be swept
Value Data typeNumericFormatNNN.NNPermissible valuesGreater than 0 expressed as a number
Data source NumeratorManual record (e.g. work requests)DenominatorAsset management system or GIS
Dimension Cost
Indicator Service cost
Rationale Indicator of the broad objective that street sweeping should be delivered in a cost-efficient way. Low or decreasing cost suggests an improvement in the cost-efficiency of the street sweeping service
Measure SS3 Cost of street sweeping service
Definition Defined as the direct cost of the street sweeping service per length of road swept
Computation NumeratorDirect cost of street sweeping serviceDenominatorTotal kilometres of sealed local roads required to be swept
Value Data typeNumericFormatNNN.NNPermissible valuesGreater than 0 expressed in dollars
Data source NumeratorFinance system (e.g. TechnologyOne)DenominatorAsset management system or GIS
Local GovernmentBetter Practice GuidePerformance Reporting Framework Indicator Workbook
115

Dimension Service outcome
Indicator Environmental and flooding risk
Rationale Indicator of the broad objective that sweeping local roads will minimise the environmental and flooding risks. Low or decreasing number of environmental and flooding events suggests an improvement in the effectiveness of the street sweeping service
Measure SS4 Routine cleaning of sealed local road pits
Definition Defined as the proportion of sealed local road pits requiring cleaning following routine inspection
Computation NumeratorNumber of sealed local road pits requiring cleaning following routine inspectionDenominatorTotal number of sealed local road pits inspected
Value Data typeNumericFormatNNN.NNPermissible values0 to 100.00 expressed as a percentage
Data source NumeratorManual record (e.g. work requests)DenominatorManual record (e.g. work requests)
Other information
Key terms Corporate overheadsIs costs associated with supporting the delivery of the service. Examples include: payroll human resources finance (including financial and management accounting, purchasing,
accounts payable and accounts receivable) information technologyDirect costIs operating expenses directly related to the delivery of the street sweeping service. This includes expenses such as salaries and oncosts, agency and contract staff, training and development, contractors, materials, maintenance, disposal costs (fees and levies) travel and vehicle/plant hire costs, phones, computers (where they are specific to the service) costs and other incidental expenses. It does not include capital purchases such as vehicles and equipment. Indirect costs such as depreciation and management/corporate overheads are specifically excluded. Management overheads may be included where an employee is involved in the direct delivery of the service. In the case of an employee covering for leave, this should be included only if the leave is being covered by a temporary employee (i.e. casual, agency).Management overheadsIs employee costs associated with overseeing or managing the service. Examples might include a proportion of:
116Local GovernmentBetter Practice GuidePerformance Reporting Framework Indicator Workbook
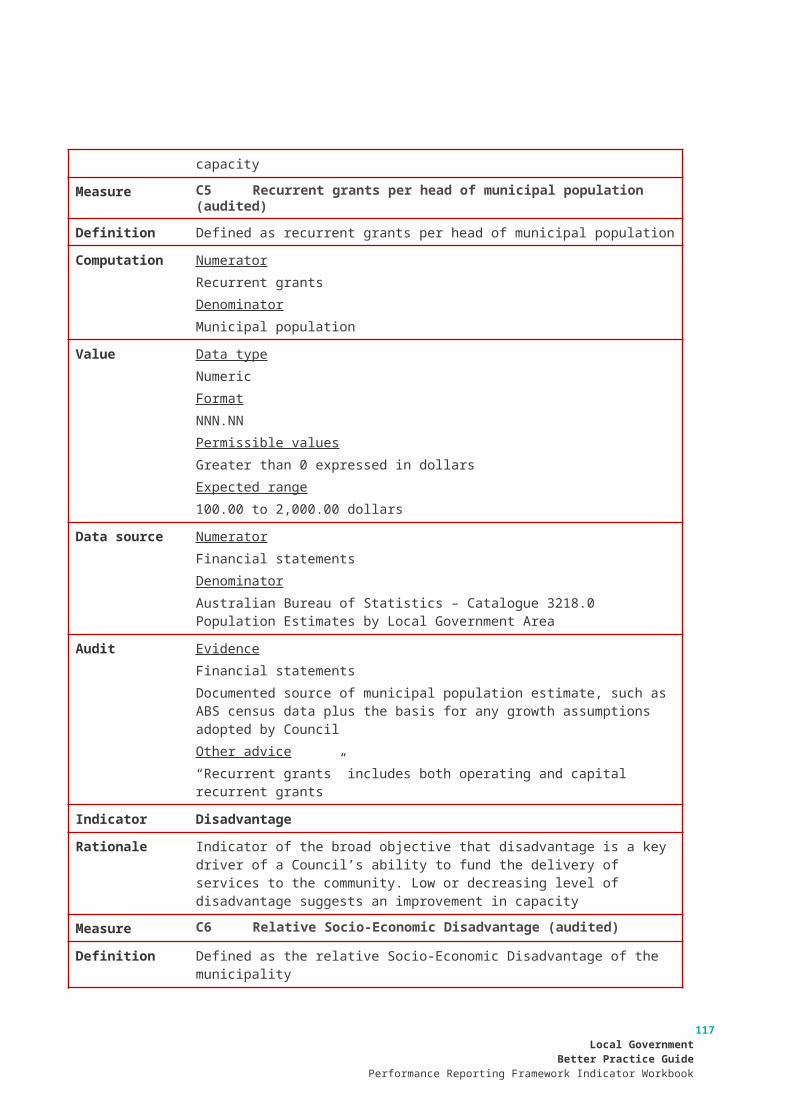
chief executive officer general manager/director supervisor team leader administration staffSealed local road pitIs a chamber constructed below ground, designed to accept rainwater runoff from local road gutters and to discharge this rainwater into a single downstream stormwater pipe on a sealed road under the control of the municipality and subject to a street sweeping service.Street sweeping requestsIs any request received from a member of the public (written or verbal) in regard to council’s street sweeping service.
Notes Not applicable
Local GovernmentBetter Practice GuidePerformance Reporting Framework Indicator Workbook
117

8. Performance reporting template8.1 The templateThis part of the Workbook has been created to assist with the completion of the Performance Reporting Template (the template).
The template is an excel spreadsheet that has been developed to assist councils to:
calculate and report the results for the performance indicators and measures in the Report of Operations and Performance Statement in council’s annual report
upload data to the Know Your Council Website.
Use of the template will assist councils to meet the statutory reporting requirements in accordance with the Local Government Act 1989 (the Act) and Local Government (Planning and Reporting) Regulations 2014 (the Regulations).
8.2 Opening and savingMacros – the spreadsheet contains macros. To enable the macros, please follow these instructions:
• open the template
• a security warning will appear on the top banner > select ‘enable content’
• you may get an additional security warning > select ‘Yes’
• save the template on your desktop in a new folder. Please note some document management systems (e.g. TRIM, Sharepoint) are not compatible with macro enabled spreadsheets and it will be necessary to work with the template from your desktop.
Locked areas - the spreadsheet has been locked to avoid any column or row inserts/deletes and to ensure that the correct data is picked up for analysis, calculations and upload. Please do not add, remove or move text as this affects how your template operates. If you wish to modify any of the locked content for your internal reporting, you can simply copy and paste the sheets into a new document. You will however need to ensure you are using the DELWP template when finalising data for upload to the Know Your Council website.
Colours – these are used to indicate where information should be entered.
Cells requiring information from CouncilTotals, sub-totals or headings
Free cells allowing councils to provide internal guidance or notes
118Local GovernmentBetter Practice GuidePerformance Reporting Framework Indicator Workbook

8.3 Input sheetsThe template contains seven (7) input sheets.
Input 1: Operational control
This sheet is where councils identify their council, the financial year and the services they fund and over which they have operational control. Councils should select their council and the financial year from the drop-down boxes at the top of the table, which will allow any ABS data to populate in the template (municipal population, index of relative socio-economic disadvantage by decile) and update the headings throughout the template.
Operational control is defined on page 15 of this workbook as well as in the Report of Operations Better Practice Guide. Data is to be provided in this template for all services marked as YES. The default position for all mandatory services is YES. If council intends to report any of the optional indicators, those services should also be marked as YES, otherwise, leave as NO. This data populates the Performance Indicators sheet.
Input 2: Service indicators
This sheet is where the data is entered for the Service Performance indicators and measures. The data entered in this sheet will allow the results to be calculated in the output sheets. The results will populate the sheets Output 1 (Report of Operations), Output 2 (Performance Statement) and Performance Indicators sheet which will be uploaded onto the Know Your Council website.
From the 2015-16 year, councils are required to identify whether data is to be reported for each measure using the DATA APPLICABLE column. For each measure, councils must select from the drop-down box either APPLICABLE, NOT APPLICABLE or NO DATA. The default position for all data is ‘Applicable’; if ‘NO’ was selected for any set of measures in Input 1, then ‘No Data’ should be selected for those indicators in Input 2.
These are explained in the following table:
APPLICABLE Council provides and has operational control of the service, and data will be reported in the template.
NOT APPLICABLE Council provides and has operational control of the service but no data will be reported in the template, as it did not provide the service for the reporting period. For example, council provides the statutory planning service but there were no planning application decisions reviewed by VCAT for the reporting period. A material variation/comment must be provided in Input 5 in this instance.
NO DATA Council either provides the service but is unable to report data in the template for the reporting period, or does not have operational control of the service. If council provides the service, but is unable to report data, a material variation/comment must be provided in Input 5 of the template.
Councils have the option to report data for the optional indicators and measures in this sheet. Councils who wish to voluntarily report against these measures in the Report of Operations and Performance Statement should complete the applicable fields. Note optional results will be uploaded, but not published, on the Know Your Council website.
Local GovernmentBetter Practice GuidePerformance Reporting Framework Indicator Workbook
119

Input 3: Finance indicators
This sheet is where the data is entered for the Financial Performance indicators and measures. It requires councils to enter the actual year’s data and four forecast years. The data entered in this sheet will then be calculated in the output sheet Output 2 (Performance Statement) and Performance Indicators sheet which will be uploaded onto the Know Your Council website.
In the unusual circumstances that a council’s current or forecast financial data is ‘Not Applicable’ or there is no data to provide, the council will need to send the template to [email protected] to make this change.
Input 4: Sustainability indicators
This sheet is where the data is entered for Sustainable Capacity indicators. Most data is entered in the Input 3 (Finance) sheet. The results will populate the Output 2 (Performance Statement) sheet and the Performance Indicators sheet which will be uploaded onto the Know Your Council website.
In the unusual circumstances that a council’s sustainable capacity data is ‘Not Applicable’ or there is no data to provide, the council will need to send the template to [email protected] to make this change.
Input 5: Material variations and council comments
This sheet is where council comments and statements of material variation are entered. Comments and material variations entered in this sheet will populate the Output 1 (Report of Operations) and Output 2 (Performance Statement) sheets and Performance Indicators sheet which will be uploaded onto the Know Your Council website. It is expected that councils provide context around each of their results in this box.
There is only a minor difference between material variation statements (or ‘material variations’) and comments. Comments, while not mandatory, allow councils to provide context around their results, especially in cases of particularly high or low results. Material variations on the other hand, are mandatory, and explain a year on year variation exceeding the materiality threshold (which is either set by council or taken from Local Government Victoria’s Report of Operations and Performance Statement Better Practice Guidance). The materiality threshold for each indicator can be manually inserted in this sheet by councils to help understand where a material variation is required.
Material variation explanations should be provided for the following:
• material variations between the current year and prior years’ results. For the Financial Performance indicators, this will also include material variations between the current year and forecast results
• zero results. This includes where the Council has operational control over the service but did not provide the service during the reporting period, or is unable to report any data for the service
• major changes. This includes changes to services or unplanned financial or other events which have impacted on the result(s).
Councils are able to include a URL link to corresponding documents or council pages in their comments or material variations where relevant. The link will then appear on the Know Your Council website.
Where there are no material variations, Council should provide a qualitative statement. Council should not comment in regard to the expected range. If information has come to light which changes the result for a previous year following the data being published on the Know Your Council website, council should reference this in the current year commentary, particularly where it results in a significant year on year variation.
To assist councils to utilise the template internally, a ‘council guidance’ column is provided on each of the input sheets. Some LGV guidance appears in this column, but can be removed or added to as needed by councils. The information provided in this column will not appear in the Performance Indicators sheet, and therefore will not be uploaded to the Know Your Council website.
Further guidance on materiality can be found in the Performance Statement and Report of Operations Better Practice Guides.120
Local GovernmentBetter Practice GuidePerformance Reporting Framework Indicator Workbook

Input 6: Governance and management checklist
This sheet is where the responses to the Governance and Management Checklist are to be entered. Councils should select from the YES/NO drop down in column ‘D’ for each item and enter the applicable date in column ‘E’ in the following format: DD/MM/YYYY. These dates may revert to the American date format if Excel is set to the default settings. Please check the ‘Gov and Mgt Checklist’ (formerly Upload 2) CSV file before uploading to the Know Your Council website to ensure that dates are presented in the correct format.
For some items (e.g. GC5 Asset Management Plans, GC17 Council Plan reporting, GC18 Financial Reporting, GC19 Risk Reporting and GC20 Performance Reporting) there may be multiple dates of operation. Where this is the case, Council should enter the name of the items and applicable date in column ‘F’ in the following format: [name of item]: DD/MM/YYYY, [name of item]: DD/MM/YYYY. An example is provided below.
Councils are encouraged to include a URL link to corresponding documents for checklist items where relevant (e.g. annual report, road management plan). The link will then appear on the Know Your Council website.
The data entered here will populate the ‘Gov and Mgt Checklist’ sheet (formerly Upload 2) and will be uploaded onto the Know Your Council website.
Please note the format of the Governance and Management Checklist reported in the annual report must be presented in the format prescribed by Schedule 2 to the Local Government (Planning and Reporting) Regulations 2014. Refer to the Report of Operations Better Practice Guide for more information.
Input 7: Workforce data
This sheet is where the Workforce data from the Report of Operations prepared in accordance with Regulation 14(2)(h) and (i) is to be entered. The total number of FTE should match figures in Council’s Strategic Resource Plan. The data entered here will populate the Staff FTE sheet (formerly Upload 3).
8.4 Previous years’ data
The template contains three (3) previous years’ data sheets.
Data from 3, 2 and 1 years ago sheetsThese sheets are where data reported in previous years is inputted to be able to show year on year comparisons in the template. These populate previous years' results in Input 5, Output 1 and Output 2 (to allow you to see whether there has been a material variation in your results). This data is not re-uploaded to the Know Your Council website.
CSVs from previous reporting periods should be downloaded from the Know Your Council website, and simply copied and pasted in to the corresponding sheets.The detailed process to copy data in to these sheets can be found on the Resources tab in the Adding Year on Year Data factsheet: https://knowyourcouncil.vic.gov.au/members/resources/Adding-year-on-year-data-to-the-performance-reporting-template.pdf
Example: items with multiple dates
Road Management Plan: 24/07/2013, Building Management Plan: 22/04/2010, Bridge Management Plan: 06/05/2013
Local GovernmentBetter Practice GuidePerformance Reporting Framework Indicator Workbook
121

8.5 Output sheetsThe template contains two (2) output sheets.
Output 1: Report of Operations
This output sheet is where the service indicator results and the explanation of material variations is reported for the Report of Operations in the annual report. The results and material variations have been populated from the Input 2 (Service Indicators), Input 5 (Material Variations) and Data from 3, 2 and 1 years ago sheets.
Output 2: Performance Statement
This output sheet is where the results for the service, financial and sustainability indicators and the material variations are reported for the Performance Statement in the annual report. The results and material variations have been populated from the Input 2 (Service Indicators), Input 3 (Finance Indicators), Input 4 (Sustainability Indicators), Input 5 (Material Variations) and Data from 3, 2 and 1 years ago sheets.
8.6 Upload sheetsThe template contains three (3) upload sheets.
Performance Indicators
This upload sheet is where the numerator, denominator, results and material variations for the service, financial and sustainability indicators are reported (inputs 1-5). There is a macro in this sheet which converts the file to comma delimited (.CSV) format which is the format required to upload your data onto the Know Your Council website at the end of the reporting period.
Governance and management checklist
This upload sheet is where the results of the Governance and Management checklist (Input 6) are reported. There is a macro in this sheet which converts the file to comma delimited (.CSV) format which is the format required to upload your data onto the Know Your Council website.
Workforce
This upload sheet is where the results of the Input 7 (Workforce Data) sheet are reported. There is a macro in this sheet which converts the file to comma delimited (.CSV) format which is the format required to upload your data onto the Know Your Council website.
Uploading data to the Council PortalTo upload the data in the performance reporting template to the Council Portal, you will first need to export the data to CSV files.
To do this, click on the ‘Export to CSV’ button at the bottom of each of the three Upload sheets. This will save three CSV files to where the template is saved on your computer. This will not work if the template is saved in a record management system such as TRIM or Sharepoint – the template should instead be saved on your desktop or elsewhere on your computer.
Once you have exported the CSV files follow the How to Upload Data guide available on the Resources tab of the Council Portal to upload and submit your data.
8.7 Interim reportingCouncils may use this template to calculate the performance measures throughout the year for monitoring and evaluation purposes.
Care should be taken when doing this, as some measures (numerators and denominators) will need to be annualised and this template does not undertake this function.
122Local GovernmentBetter Practice GuidePerformance Reporting Framework Indicator Workbook
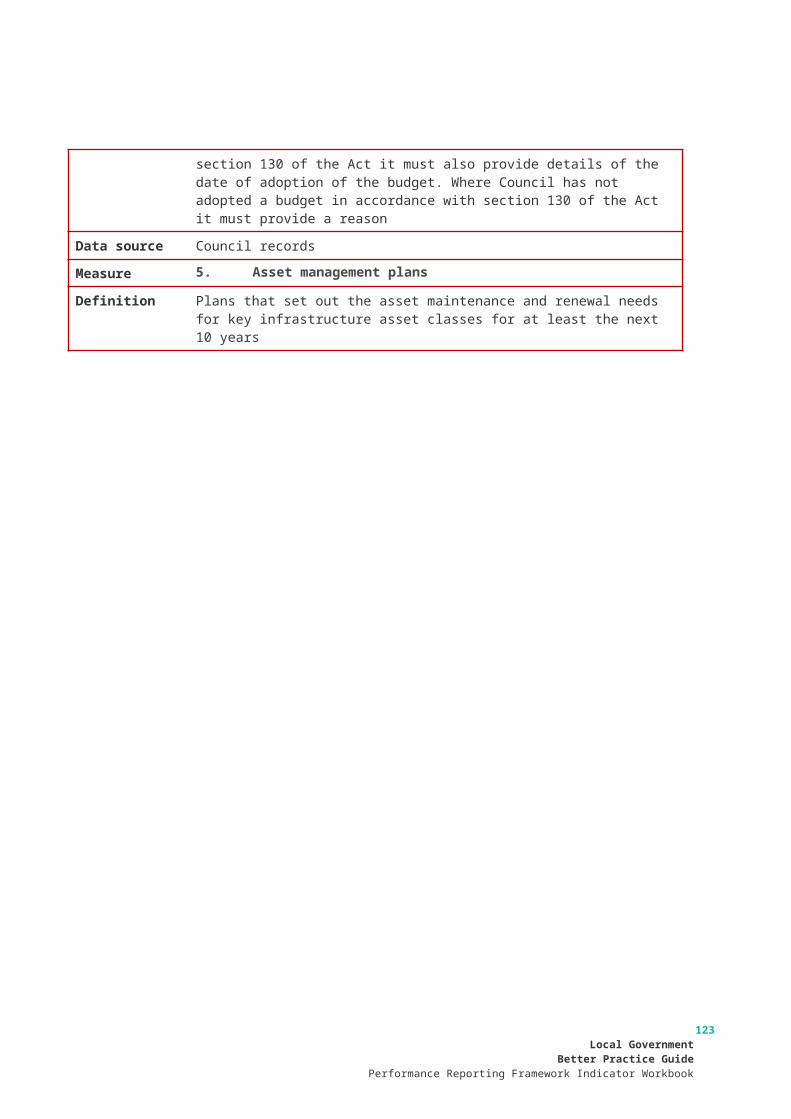
Annualised measures should be interpreted with caution as uneven reporting will occur due to seasonal variations and availability of some data elements. Therefore, results will not be uniform throughout the year. For more information, refer to Practice Note 1: Indicator Annualisation Specification .
8.8 Excel FAQsSome common issues which councils encounter when using the template are listed below, along with how to avoid them and how to fix them when they occur.
Issue Cause Preventative measures Solution
The LGV guidance comments are blocking cells
These comments have been included to assist councils in completing the template
n/a
Open the Review tab of Excel and click on ‘Show All Comments’
Cells become locked and cannot be edited
The formatting of the cells has been overwritten and locked due to data or comments being pasted into the template
Follow these steps when cutting or copying data into the template or between cells in the template, as Excel is quite sensitive to these sorts of changes.
1. Always copy as cutting may affect the formulas and cell references throughout the template (this particularly affects the Output and Upload sheets)
2. When copying, paste into the template using 'Paste Special' then 'Paste Values'
Contact LGV via email to request the affected cells are fixed
Cells are returning #REF!
Formulas have been broken due to data or comments being cut or copied between cells in the template
Data or comments are displaying in the wrong cells
Can’t read the full commentary in the Output sheets
The default size of the cells is not big enough to display the commentary
n/a
Save and close Excel, then reopen and the cells will have resized
A strange figure (�;) is displaying in the place of punctuation
This type of text appears when the comment was originally written in a Word document and then copied and pasted into the Excel spreadsheet
1. Type commentary directly into Excel, OR
2. When copying from Word into Excel, double click in the cell in Excel and then paste the text
This character can be overwritten in the CSV before uploading to the Council Portal
Corresponding guidance that has been issued with regard to the LGPRF can be found at https://www.localgovernment.vic.gov.au/council-innovation-and-performance/sector-guidance-planning-and-reporting
Local GovernmentBetter Practice GuidePerformance Reporting Framework Indicator Workbook
123