local development and global issues
TRANSCRIPT

8/14/2019 Local Development and Global Issues
http://slidepdf.com/reader/full/local-development-and-global-issues 1/82

8/14/2019 Local Development and Global Issues
http://slidepdf.com/reader/full/local-development-and-global-issues 2/82
DEPARTMENT OF ECONOMIC AND SOCIAL AFFAIRS
Local Development and Global Issues
Report of the Committee for Development Policyon the fifth session (7-11 April 2003)
United Nations • New York, 2003
asdf

8/14/2019 Local Development and Global Issues
http://slidepdf.com/reader/full/local-development-and-global-issues 3/82
NOTE
The designations employed and the presentation of thematerial in this publication do not imply the expression of anyopinion whatsoever on the part of the Secretariat of the UnitedNations concerning the legal status of any country, territory, city orarea or of its authorities, or concerning the delimitation of itsfrontiers or boundaries.
The term “country” as used in the text also refers, asappropriate, to territories or areas.
The designations of country groups are intended solely forstatistical or analytical convenience and do not necessarily expressa judgement about the stage of development reached by a particularcountry or area in the development process.
UNITED NATIONS PUBLICATIONSales No. E.03.II.A.3
ISBN 92-1-104522-3
Copyright © United Nations, 2003All rights reserved
Printed by the United NationsReproduction Section, New York

8/14/2019 Local Development and Global Issues
http://slidepdf.com/reader/full/local-development-and-global-issues 4/82
FOREWORD
Formulation of development policy is increasingly becoming a com- plex undertaking. There are, among others, two major challenges.First, developing policy tools and approaches to pursue diverse and attimes competing political and economic goals in a cohesive manner.This involves harmonization of socio-economic, ecological and politi-cal objectives. Second, devising policy frameworks to deal with emerg-ing concepts like global public goods and many new challenges posed
by the ubiquitous phenomenon of globalization. These are indeed for-midable tasks for policy makers.
The United Nations has played an important role in facilitating thetasks of policy makers. In this context, the Committee for DevelopmentPolicy has contributed to various endeavours to find answers to theemerging questions and to deal with the multidimensional challenges of development. At its fifth session, which was held in New York from 7to 11 April this year, the Committee deliberated on diverse issues, suchas an integrated approach to rural development for poverty reduction andsustainable development in developing countries, global public goods(GPGs) and the triennial review of the list of least developed countries.
While recognizing the potential of GPGs for generating effective andequitable paths towards development, the Committee recommends fur-ther clarification of the concept of GPGs so that it lends itself to open
and transparent policy dialogue and policy formulation. The Committeemakes some thought-provoking observations regarding the financing of GPGs that require further discourse. There are some useful practicalrecommendations for promoting integrated rural development and onthe question of graduation of the least developed countries.
It is hoped that the present report will serve to initiate an open, con-structive and solution-oriented debate on the questions that still sur-round these areas of economic development.
Nitin DesaiUnder-Secretary-General
for Economic and Social Affairs
iL O C A L D E V E L O P M E N T A N D G L O B A L I S S U E S

8/14/2019 Local Development and Global Issues
http://slidepdf.com/reader/full/local-development-and-global-issues 5/82
ii T H E C D P R E P O R T 2 0 0 3
PREFACE
The Committee for Development Policy
The Committee for Development Planning was established in1965 as a subsidiary body of the Economic and Social Council. Itsoriginal terms of reference were subsequently modified and, in1998, the Committee was renamed the Committee for DevelopmentPolicy.
The Committee provides inputs and independent advice to theCouncil on emerging cross-sectoral development issues and on themultilateral process, focusing on medium- and long-term aspects.The Committee is also responsible for undertaking, once everythree years, a review of the list of least developed countries, on the
basis of which it makes recommendations to the Council for
changes in the list.For its part, the Council is an intergovernmental body responsi-
ble for formulating policy recommendations to Member States andthe United Nations system on matters pertaining to development. Itis also responsible for coordinating the work of the United Nationsspecialized agencies, its own subsidiary functional commissionsand the five United Nations regional commissions.
Each year, the Council advises the Committee about the theme(s)that the Committee should consider at its annual session. TheGeneral Assembly, the Secretary-General and the subsidiary bodiesof the Council can also propose, through the Council, issues for consideration by the Committee. In addition, the Committee itself often makes suggestions to the Council concerning its work pro-gramme.
The annual meeting of the Committee usually takes place in
April of each year and lasts five working days. During this period,the Committee discusses the agreed topics and drafts its own reporton the basis of inputs from members. The report is subsequentlysubmitted to the Council at its substantive session in July.

8/14/2019 Local Development and Global Issues
http://slidepdf.com/reader/full/local-development-and-global-issues 6/82
iiiL O C A L D E V E L O P M E N T A N D G L O B A L I S S U E S
Membership
In accordance with the resolutions of the Council, the Secretary-General nominates 24 experts, in their personal capacity, as mem-
bers of the Committee for three-year terms. The Council hasresponsibility for deciding on the recommendations.
In making the nominations for the Committee, the Secretary-General takes into account the need to have a diversity of develop-ment experience, including ecologists, economists, and social sci-entists, as well as geographical balance, gender balance, and a bal-ance between continuity and change in the membership of theCommittee.
Work programme
Since 1999, the Council, as a contribution to its deliberations at
its high-level segment, has requested the Committee to address thefollowing themes:
• The role of employment and work in poverty eradication inthe context of globalization: the empowerment andadvancement of women;
• The role of information technology in development;
• The role of the United Nations system in supporting theefforts of African countries to achieve sustainable develop-ment;
• The contribution of human resources development, includ-ing in the areas of health and education, to the process of development;
• Promoting an integrated approach to rural development indeveloping countries for poverty eradication and sustain-able development.
During the same period, the Committee also examined the fol-lowing themes:
• An international development strategy for the first decadeof the new millennium;
• Governance responsibilities in a globalizing world;

8/14/2019 Local Development and Global Issues
http://slidepdf.com/reader/full/local-development-and-global-issues 7/82
iv T H E C D P R E P O R T 2 0 0 3
• Aid effectiveness in Africa;
• Global public goods and innovative financial mechanismsin the pursuit of sustainable development.
The Committee also undertook two reviews (in 2000 and 2003)of the list of least developed countries, and continued its work onimproving the methodology for the triennial review of the list (e.g.
by introducing economic vulnerability as a criterion for the desig-
nation of least developed countries).The reports of the Committee are available on the Internet at
www.un.org/esa/analysis/devplan/.
Contents of this publication
At its fifth session, held from 7 to 11 April 2003, the Committeefor Development Policy addressed three topics: the promotion of an
integrated approach to rural development for poverty reduction andsustainable development in developing countries; global publicgoods; and the identification of the least developed countries. Thereport of the Committee on its fifth session has been issued as partof the official records of the Economic and Social Council, 2003(Supplement No. 13 (E/2003/33), also available at www.un.org/esa/analysis/devplan/) and has been reproduced in this volume. Alsoavailable on the Internet at the same address is a review paper on
Global Public Goods produced by a member of the Committee.In addition to the report of the Committee for Development
Policy on its fifth session, this volume also contains the report of anexpert group meeting on the review of the list of least developedcountries, which along with other background material was dis-cussed at the fifth session of the Committee. It is hoped that thework of the Committee will contribute to discussions on these mat-ters at all levels, leading to practical solutions, policies and actions
by all concerned.

8/14/2019 Local Development and Global Issues
http://slidepdf.com/reader/full/local-development-and-global-issues 8/82
CONTENTS
Chapter Page
I. ORGANIZATION OF THE SESSION. . . . . . . . . . . . . . . . 1
II. PROMOTING AN INTEGRATED APPROACH TO
RURAL DEVELOPMENT IN DEVELOPING COUNTRIESFOR POVERTY ERADICATION AND SUSTAINABLEDEVELOPMENT . . . . . . . . . . . . . . . . . . . . . . . . . . . . . . . 4
A. Introduction . . . . . . . . . . . . . . . . . . . . . . . . . . . . . . . . . 4B. The background situation and major consequences
of rural poverty . . . . . . . . . . . . . . . . . . . . . . . . . . . . . . . 5C. Major findings and recommendations . . . . . . . . . . . . . . 8
III. GLOBAL PUBLIC GOODS AND INNOVATIVEFINANCIAL MECHANISMS IN THE PURSUIT OFSUSTAINABLE DEVELOPMENT . . . . . . . . . . . . . . . . . 15
A. The present situation. . . . . . . . . . . . . . . . . . . . . . . . . . 15B. Action required at the national and international levels . . 17C. Institutional and financial arrangements . . . . . . . . . . . 18D. Major findings and recommendations . . . . . . . . . . . . . 21
IV. REVIEW OF THE LIST OF LEAST DEVELOPEDCOUNTRIES . . . . . . . . . . . . . . . . . . . . . . . . . . . . . . . . . . . . . . . . . . . . . . . . 23
A. Introduction . . . . . . . . . . . . . . . . . . . . . . . . . . . . . . . . 23B. Criteria for the identification of the least developed
countries in 2003 . . . . . . . . . . . . . . . . . . . . . . . . . . . . . 24C. Smooth transition of countries graduating from
least developed country status . . . . . . . . . . . . . . . . . . . 33D. Major findings and recommendations . . . . . . . . . . . . . 35
V. FUTURE WORK OF THE COMMITTEE . . . . . . . . . . 37
vL O C A L D E V E L O P M E N T A N D G L O B A L I S S U E S

8/14/2019 Local Development and Global Issues
http://slidepdf.com/reader/full/local-development-and-global-issues 9/82
CONTENTS
Chapter Page
Annex
REPORT OF THE EXPERT GROUP MEETINGON THE REVIEW OF THE LIST OF
LEAST DEVELOPED COUNTRIES
I. Background to the Expert Group Meeting . . . . . . . . . . . . 39
II. Criteria for the identification of theleast developed countries . . . . . . . . . . . . . . . . . . . . . . . . . 40
A. Gross national income (GNI) per capita . . . . . . . . . . . 41B. Issues common to the two composite indices . . . . . . . 42C. Human Assets Index (HAI) . . . . . . . . . . . . . . . . . . . . . 43D. Economic vulberability index (EVI) . . . . . . . . . . . . . . 45
III. Countries with economes in transition . . . . . . . . . . . . . . . 47
IV Eligibility for inclusion and graduation . . . . . . . . . . . . . . 50
A. Additions to the list . . . . . . . . . . . . . . . . . . . . . . . . . . 50(a) Timor-Leste . . . . . . . . . . . . . . . . . . . . . . . . . . . . . . 50(b) Congo . . . . . . . . . . . . . . . . . . . . . . . . . . . . . . . . . . 51
B. Candidates for future graduation. . . . . . . . . . . . . . . . . 51(a) Kiribati . . . . . . . . . . . . . . . . . . . . . . . . . . . . . . . . . 51(b) Samoa . . . . . . . . . . . . . . . . . . . . . . . . . . . . . . . . . . 52(c) Tuvalu . . . . . . . . . . . . . . . . . . . . . . . . . . . . . . . . . . 52
C. Countries that qualify for graduation . . . . . . . . . . . . . 52(a) Cape Verde . . . . . . . . . . . . . . . . . . . . . . . . . . . . . . 53(b) Maldives . . . . . . . . . . . . . . . . . . . . . . . . . . . . . . . . 53
V. Smooth transition of countries graduating fromleast developed country status . . . . . . . . . . . . . . . . . . . . . 55
VI. Main recommendations and implicationsfor inclusion and graduation . . . . . . . . . . . . . . . . . . . . . . . 57
vi T H E C D P R E P O R T 2 0 0 3

8/14/2019 Local Development and Global Issues
http://slidepdf.com/reader/full/local-development-and-global-issues 10/82
CONTENTS
Chapter Page
Appendix I
Agenda and List of Participants . . . . . . . . . . . . . . . . . . . . 59
Appendix II
Figures
1. Relationship between calorie intake and undernourishmentin 50 least developed and low-income countries . . . . . . . . . 60
2. Human Assets Index (HAI) for 65 least developed andlow-income countries . . . . . . . . . . . . . . . . . . . . . . . . . . . . 61
Tables
1. GNI per capita for least developed and low-incomecountries. . . . . . . . . . . . . . . . . . . . . . . . . . . . . . . . . . . . . . 62
2. Indicators of hunger in least developed andlow-income countries . . . . . . . . . . . . . . . . . . . . . . . . . . . . 64
3. Human Assets Index (HAI) and its components for leastdeveloped and low-income countries . . . . . . . . . . . . . . . . . . 66
4. Economic vulnerability index (EVI) for least developedand low-income countries . . . . . . . . . . . . . . . . . . . . . . . . . . . . 69
viiL O C A L D E V E L O P M E N T A N D G L O B A L I S S U E S

8/14/2019 Local Development and Global Issues
http://slidepdf.com/reader/full/local-development-and-global-issues 11/82

8/14/2019 Local Development and Global Issues
http://slidepdf.com/reader/full/local-development-and-global-issues 12/82
I. Organization of the session
1. The fifth session of the Committee for Development Policy washeld at United Nations Headquarters from 7 to 11 April 2003. Fifteenmembers of the Committee attended: Ms. N’Dri Thérèse Assié-Lumumba, Mr. Albert Binger, Mr. Olav Bjerkholt, Mr. Eugenio B.Figueroa, Mr. Leonid M. Grigoriev, Mr. Patrick Guillaumont, Mr.Ryokichi Hirono, Ms. Marju Lauristin, Ms. Mona Makram-Ebeid, Mr.
P. Jayendra Nayak, Mr. Milivoje Panic, Ms. Suchitra Punyaratabundhu,Ms. Sylvia Saborio, Mr. Udo Ernst Simonis and Ms. Funmi Togonu-Bickersteth. Nine members were unable to attend: Ms. Lourdes Benería,Mr. Shangquan Gao, Ms. Louka T. Katseli, Ms. Mari Elka Pangestu,Mr. Eul Yong Park, Mr. Delphin G. Rwegasira, Mr. Nasser HassanSaidi, Mr. Ruben Tansini and Ms. Dorothéa Werneck.
2. The officers of the Bureau at the fifth session were:
Chairman :Mr. Ryokichi Hirono
Vice-Chairman :Mr. Eugenio B. Figueroa
Rapporteur :Ms. Mona Makram-Ebeid
3. Mr. Ryokichi Hirono, Chairman of the Committee, opened the
session. Mr. Nitin Desai, Under-Secretary-General for Economic andSocial Affairs, made an introductory statement emphasizing the impor-tance of the Committee in adding value to the topics that were to be dis-cussed. He pointed to the need for a broader socio-economic perspec-tive at both the global and local levels, and for coherence in differentdimensions of policy. One such example was the overall approach tohuman immunodeficiency virus/acquired immunodeficiency syndrome(HIV/AIDS): the priority given by the international community to this
problem was in some ways being contravened by the difficulties inincorporating the treatment of HIV/AIDS into the Agreement on Trade-related Aspects of Intellectual Property Rights. 1 Such issues could notbe addressed by limited sectoral approaches but needed to be reflectedin all aspects of policy.
1 See Legal Instruments Embodying the Results of the Uruguay Round of Multilateral Trade Negotiations, done at Marrakesh on 15 April 1994 (GATT secretariat publication,Sales No. GATT/1994-7).

8/14/2019 Local Development and Global Issues
http://slidepdf.com/reader/full/local-development-and-global-issues 13/82
4. The main items in the agenda were: the promotion of an integrat-ed approach to rural development for poverty reduction and sustainabledevelopment in developing countries; global public goods; and the iden-tification of the least developing countries.
5. It was suggested that both Governments and the market have arole in improving the status of rural populations in the developing coun-tries. The Committee might produce new models of rural development
where all issues (such as self-employment, income transfer, wageemployment, infrastructure) can complement each other.
6. Concerning global public goods, it was suggested that these mightserve as a means of strengthening the United Nations system, as peopleand States could be brought together to address issues of internationalconcern such as water shortages and investment in renewable energy. Itwas further emphasized that there was a need to clarify the way in
which global public goods are discussed as the current debate is verydiffuse. The fact that public goods such as health and education, whichare particularly important, need international action, brings to the forethe international dimension of trade and aid. In addition, the preserva-tion of cultural diversity was also seen as an important aspect of globalpublic goods.
7. The topic of the graduation of least developed countries was
addressed and the growing sensitivity of the issue was emphasized bynoting the resistance to graduation of countries qualifying for it. It wasalso recommended that the question on how the international commu-nity could assist least developed countries “cushion” or absorb potentialshocks of graduation in order to prevent disruptions in their develop-ment process be examined as a theme.
8. The Committee benefited from the active participation of a num-
ber of United Nations entities. The Department of Economic and SocialAffairs of the United Nations Secretariat provided substantive servicesfor the session. The following bodies, agencies, and programmes andfunds of the United Nations system were represented:
• Commonwealth Secretariat
• Food and Agriculture Organization of the United Nations
2 T H E C D P R E P O R T 2 0 0 3

8/14/2019 Local Development and Global Issues
http://slidepdf.com/reader/full/local-development-and-global-issues 14/82
• United Nations Conference on Trade and Development
• United Nations Children’s Fund
• United Nations Development Programme
• United Nations Educational, Scientific and Cultural Organization
• United Nations Environment Programme
• United Nations Industrial Development Organization
• Population Division,Department of Economic and Social Affairs of theUnited Nations Secretariat
• Least Developed Countries Coordination Unit, Economic andSocial Commission for Asia and the Pacific
• Department of Economic and Social Affairs of the UnitedNations Secretariat
• Office of the High Representative for the Least DevelopedCountries, Landlocked Developing Countries and Small IslandDeveloping States
• Economic and Social Commission for Asia and the Pacific
• International Labour Office
• International Monetary Fund
• World Bank
• World Food Programme
• World Health Organization
3L O C A L D E V E L O P M E N T A N D G L O B A L I S S U E S

8/14/2019 Local Development and Global Issues
http://slidepdf.com/reader/full/local-development-and-global-issues 15/82
II. Promoting an integrated approach to ruraldevelopment in developing countries for poverty
eradication and sustainable development
A. Introduction
1. The attainment of the Millennium Development Goals 2 will not be
possible without development’s making a substantial impact on ruralpoverty, since three quarters of the extreme poor in the world live inrural areas, and urban areas are unable to absorb all potential poor ruralmigrants. It is even more imperative to focus on the eradication of ruralpoverty now that economic growth worldwide is faltering, pushing mil-lions more into poverty and causing tens of thousands of children to diefrom malnutrition and deprivation. Eradicating poverty would also con-tribute to the elimination of the causes of conflict and terrorism. Povertyeradication is a long-term proposition but the alternative is a never-end-ing cycle of poverty and violence.
2. Rural development as a strategy to eradicate poverty must reflectthe multidimensional nature of poverty and thus must be multi-targeted.It has to extend across different disciplines and must encompass demo-graphic, economic, social, institutional and political factors, thus con-stituting an integrated approach. This integrated approach would differfrom previous, more sector-specific but context-neutral (“one size fitsall”) experiences in rural development. Thus, although the concept of anintegrated approach has not changed, the understanding of what itentails has changed.
3. Among the major causes of the persistence of rural poverty inmost developing countries are low or stagnant economic growth in ruralareas, often below the rate of population growth, inadequate investmentin human capital, agricultural technology and infrastructure, and inade-quacies in institutional mechanisms that address the needs of the ruralpoor. These causes are also often seen as the consequences of poverty— inadequate economic growth limits the amounts available to beinvested in human and physical capital, technology and institutions. The
4 T H E C D P R E P O R T 2 0 0 3
2 See General Assembly resolution 55/2; and A/56/326, annex.

8/14/2019 Local Development and Global Issues
http://slidepdf.com/reader/full/local-development-and-global-issues 16/82
rural poor can then be seen as caught in a vicious circle or “povertytrap”. In order to tackle rural poverty and help the rural poor escape thistrap, it is necessary to look at these old problems with new lenses inorder to address the new challenges. A fundamental reorientation of integrated rural development should focus on enhancing rural employ-ment and income-generation so as to create the conditions for decentliving conditions in rural areas. More resources should also be directed
towards rural areas which currently receive only 25 per cent of majordonors’ expenditures.
4. The enormous heterogeneity of conditions under which the ruralpoor live and work requires creativity and flexibility in project designand implementation which have to be achieved locally through decen-tralization, capacity-building and participation. Decentralization needsto be carefully conducted to ensure that rural elites do not appropriatefor themselves most of the benefits of rural development. Institutionsserving the rural poor have to be strengthened in order to empower poorpeople, and give them a stronger voice in processes of decision-makingon resource mobilization, allocation and utilization. Strengthened insti-tutions should help foster self-respect and respect for local culture andvalues consistent with environmental sustainability in order to preservesocial cohesion, as reiterated at the World Summit on SustainableDevelopment held in Johannesburg, South Africa, in August-September
2002. To achieve the full benefits of this integrated approach to ruraldevelopment, Governments, the international community, civil society,the business community and local communities must work in partnership.
B. The background situation and major consequences of rural poverty
1. The poor state of health and education
5. Underlying all analysis of the possibility of escape from ruralpoverty is the situation with respect to health and education. Ruralpeople in developing countries have long suffered from a variety of water-borne and insect-borne diseases which have reduced theircapacity for productive work and thus diminished their chances of escaping from poverty.
5L O C A L D E V E L O P M E N T A N D G L O B A L I S S U E S

8/14/2019 Local Development and Global Issues
http://slidepdf.com/reader/full/local-development-and-global-issues 17/82
6. Progress has been made in reducing the incidence of schistosomi-asis, but malaria, tuberculosis and HIV/AIDS still constitute majorobstacles, given the vulnerability of the rural poor. The prevalence of HIV/AIDS, in sub-Saharan Africa in particular, has reduced the numberof adults able to support their families and the broader rural economy. 3
7. Malaria aggravates rural poverty because of the costs of treatmentand of lost work time. Much more effort is needed from the interna-
tional community, Governments and the private sector — as called forby the Abuja Declaration on HIV/AIDS, Tuberculosis and OtherRelated Infectious Diseases 4 and the Roll Back Malaria campaign(involving the World Health Organization (WHO), the World Bank, theUnited Nations Development Programme (UNDP) and the UnitedNations Children’s Fund (UNICEF)) — to implement treatment andprevention and, in view of the increasing resistance of parasites and mos-quitoes, to promote needed research on better drugs and insecticides. 5
8. Another consequence — and cause — of rural poverty is a lowlevel of educational provision in rural areas and a high dropout rate, aschildren leave school because their parents either cannot afford to payfor their attendance or require their labour to assist in maintaining thefamily budget. Dropouts from schools tend to remain poor throughouttheir lives and to transmit poverty to future generations. This is particu-larly true for girls, as the education of girls and women has a wideimpact, given their role as family and community caregivers.
2. Excessive rural-urban migration
9. For individuals, one possible path out of the rural poverty trap isthrough migration to the urban areas, but this often worsens the situa-
6 T H E C D P R E P O R T 2 0 0 3
3For example, in Burkina Faso, it is estimated that 20 per cent of rural families havereduced their agricultural work or even abandoned their farms because of AIDS (JointUnited Nations Programme on Human Immunodeficiency Virus/AcquiredImmunodeficiency Syndrome (UNAIDS),Report on the Global HIV/AIDS Epidemic , 2002(Geneva, UNAIDS, July 2002), p. 49).
4 Available at http://www.uneca.org/adf2000/Abuja%20Declaration.htm.5 The Roll Back Malaria campaign notes that spending an additional 1 billion dollars a
year — one third of 1 per cent of sub-Saharan Africa’s gross domestic product (GDP)— on cost-effective forms of malaria control would be fully justified, as estimates sug-gest that malaria’s economic costs exceed 1 per cent of the region’s GDP.

8/14/2019 Local Development and Global Issues
http://slidepdf.com/reader/full/local-development-and-global-issues 18/82
tion in both the urban and the rural areas. In many countries, especiallythose with rapid population growth, urban areas are not able to provideall migrants from rural areas, particularly the uneducated and unskilled,with productive employment. This has caused a growing incidence of unemployment and underemployment and an expansion of slums inurban areas, leading to a growing sense of personal insecurity anduncertainty and creating a breeding ground for social discontent, unrest,
crime, including organized crime, and, in some cases, recruitment forterrorist activities. Excessive rural-urban migration often leads to a fur-ther increase of urban poverty and the ruralization of urban areas,whereby the poverty and lack of skills of the rural areas are reproducedin the shanty towns of urban conglomerations.
10. The migration of the heads of poor rural households to urbanareas has resulted, in many cases, in the weakening of family values andof the fabric of rural society, and in an increase in delinquency andcrime among the youth because they are insufficiently supervised by thefamily. Furthermore, migration of the male heads of rural householdshas major implications for the composition of the rural labour force,agricultural production, social cohesion and overall rural development.In many countries in sub-Saharan Africa, the women left behind have toprovide for their families. The task is complicated by gender inequali-ties in accessing resources, such as land and credit, which further con-
tribute to the feminization of poverty.11. Most rural migrants are adults in their most productive years. Asa consequence, a large part of the elderly are left behind in rural areasand lack the day-to-day support of adult children. The care of grand-children often prevents the elderly, predominantly grandmothers, fromthe pursuit of their own normal economic activities. Thus, the migrationof adults from the rural communities leads to a decline in the produc-
tivity and income level of rural areas and to a decrease in the stock of human capital, further reinforcing poverty in rural areas. This situationassumes even more serious dimensions in those communities affectedby the HIV/AIDS pandemic.
12. Individuals who are forced by poverty to seek a livelihood in an envi-ronment unfamiliar to them, exemplified by members of rural populationsmigrating to urban areas, are exposed to a range of unaccustomed risks.
7L O C A L D E V E L O P M E N T A N D G L O B A L I S S U E S

8/14/2019 Local Development and Global Issues
http://slidepdf.com/reader/full/local-development-and-global-issues 19/82
These include various forms of exploitation and abuse, such as sub-stan-dard working conditions and trafficking. Trafficking in human beings isa fast-growing form of transnational organized crime to which migrantsfrom rural areas are particularly vulnerable. Women and children, par-ticularly girls, are especially vulnerable to this form of abuse and slav-ery. Victims often end up contracting life-threatening diseases, such asHIV/AIDS. Their life prospects are greatly reduced. Child labour —
either in the towns to which the rural poor migrate or in the rural areasthemselves where children are used to supplement the family income —is another serious consequence of rural poverty.
3. Environmental degradation
13. Rural poverty is resulting in environmental degradation, sincepoor rural inhabitants are exerting increasing pressure on natural
resources. Forests are being depleted in many African, Asian and LatinAmerican countries to provide fuel for cooking and heating of houses.Soil erosion is an increasing problem in many developing countriesowing to forest depletion, overcultivation of unstable soils and agricul-tural malpractices. Underground- and surface-water extraction, on theone hand, and water contamination, on the other, are increasing in manyareas, reducing agricultural production and aggravating health problemsin rural areas. Poor people lack the human, financial and institutional
resources to ensure the sustainable use of their natural resources. Theresult is another “vicious circle of poverty”.
C. Major findings and recommendations
14. The above considerations underline the urgency of addressingrural poverty. As indicated above, this is a complex and multifacetedtask, requiring intensive efforts in a large number of areas by a widerange of actors. Within this range of issues, the Committee believes thatboth developing countries and the international community shouldfocus on the following priority areas:
(a) Expanding education and health services and providing incentivesfor rural people to take advantage of them;
8 T H E C D P R E P O R T 2 0 0 3

8/14/2019 Local Development and Global Issues
http://slidepdf.com/reader/full/local-development-and-global-issues 20/82
(b) Increasing agricultural productivity and non-farm activitiesthrough the use of technology, diversification and access to inputsand credit;
(c) Improving access to local, national and global markets;
(d) Examining all policies through “rural lenses” with a special focuson women.
1. Expanding education and health services and providingincentives for rural people to take advantage of them
15. As discussed in the Committee’s 2002 report, 6 improvements inthe status of health and education have synergetic effects on other devel-opment objectives — individual and collective empowerment, protec-tion of the environment and good governance. Moreover, social capaci-ty-building fosters attitudinal changes and new ways of thinking aboutsustainable development. Greater gender equity and avoidance of dis-criminatory measures against women would make a strong contributionto rural poverty reduction.
16. Sometimes it is the prohibitive opportunity cost of attendingschool or securing medical treatment, rather than the supply of theseservices, that is detrimental for rural families and communities. Thiscost needs to be offset through incentives. A good example is publiclyprovided school lunches which have an additional beneficial impact oncommunity income when they are produced locally.
17. The Committee therefore recommends that efforts should bemade by Governments, multilateral organizations and developmentpartners to build the capacities of rural people and empower themto utilize fully their potential by providing relevant education andaccessible and acceptable health-care services, particularly forwomen. Education and health policy in rural areas should aim atbuilding capacity in rural communities and should be tailored totheir needs. Educational opportunities should enable them to
9L O C A L D E V E L O P M E N T A N D G L O B A L I S S U E S
6 See Capacity-building in Africa: Effective aid and human capital. Report of the Committee for Development Policy on the fourth session (8-12 April 2002) (UnitedNations publication, Sales No. E.02.II.A.4).

8/14/2019 Local Development and Global Issues
http://slidepdf.com/reader/full/local-development-and-global-issues 21/82
acquire relevant knowledge and skills, including in information andcommunication technologies (ICT), for farm and non-farm work.Policy should include a broad-based expansion of schooling, withparental and community involvement in nutrition programmes,mother and child health programmes, vaccination and other healthinterventions. Community-based schemes to protect water resourcesand other elements of the natural environment should be promoted.
18. Multilateral organizations and development partnersshould invest in enabling the rural population to gain access toinformation and to enhance their productive activities by utiliz-ing the new knowledge.
2. Increasing agricultural productivity and non-farm activitiesthrough the use of technology, diversification and access
to inputs and credit19. There are many policies that can improve agricultural productivi-ty, such as land reform, ensuring access to water and other inputs, andestablishing a regime where property rights are respected and enforced.However, these are usually country-specific and so will not be dealtwith below. Challenges of universal applicability include the following.
(a) Improving agricultural productivity, diversification and technology use
20. Increasing agricultural productivity is critical to achieving foodsecurity and increasing the incomes of the rural poor. The large benefitsgenerated by the green revolution arose from the increased productivityof agricultural inputs (seeds, land, fertilizers etc.) that it brought about.The revolution helped provide food security in many parts of the worldand released resources, including labour, for the expansion of otheractivities. Crop and product diversification is also crucial to increasingincome and food security in agricultural areas. It reduces the risks asso-ciated with the cultivation of a few crops which can be negatively affect-ed by natural phenomena or price variations. The experience of Chile,China, Malaysia and South Africa demonstrates that diversification mayalso open export opportunities for agricultural products.
10 T H E C D P R E P O R T 2 0 0 3

8/14/2019 Local Development and Global Issues
http://slidepdf.com/reader/full/local-development-and-global-issues 22/82
21. Many new developments have occurred in agricultural technolo-gy and research and development (R&D). The trend has been towardsgreater private sector participation, including public-private participa-tion, and more involvement of farmers themselves in the R&D process.Public involvement in agricultural R&D and extension services is stillcritical given its public good characteristic. 7 Maintaining public expen-ditures in agricultural and agriculture-related R&D should be regarded
as a priority in the event of fiscal retrenchment in developing countries.22. The Committee recommends that the international communi-ty should make greater efforts to develop and transfer appropriateagricultural technologies to developing countries and foster betterutilization of indigenous technologies. Agricultural research in poorcountries should be directed towards pro-poor technology, that is tosay, it should focus on cereal and root crops, which constitute 80 percent of the nutritional intake of the poor; maximize the use of inputsthat are available to poor households, including labour and bio-mass; focus on improving poor soils, as it is on marginal lands thatthe poor live; be geared towards mixed farming systems; and pro-vide qualitative improvements to agricultural produce, includinghigher vitamin content.
(b) Enhancing non-farm activities
23. Small-scale industry in rural areas can help provide work for thelandless and additional income for smallholders. Production techniquesthat take advantage of local knowledge would contribute to the empow-erment of rural people, especially women. The promotion of agro-alliedindustries is essential to enhancing rural employment and income, butcurrent rural development policies have not been effective in generatingsuch enterprises in sub-Saharan Africa in particular. In this respect, it is
vital to reduce incentives and subsidies that encourage the location of industries in urban areas. The township and village enterprises in Chinaare one example of an undertaking that has encouraged non-farmemployment and increased rural incomes.
11L O C A L D E V E L O P M E N T A N D G L O B A L I S S U E S
7 See World Economic and Social Survey, 2002 (United Nations publication, Sales No.E.02.II.C.1), chap. V, entitled “Public-private interaction in agricultural technology”.

8/14/2019 Local Development and Global Issues
http://slidepdf.com/reader/full/local-development-and-global-issues 23/82
24. The Committee recommends that agro-industries should beestablished that adopt employment-creating technologies andprocesses, particularly in selected high value added sectors. For thispurpose, there is an urgent need to provide rural communities withfinancial and tax incentives as well as with technical know-how.While encouraging non-farm activities, Governments should ensurethat these do not result in further environmental degradation.
25. Tourism — especially ecotourism, ethnic tourism and culturaltourism, which are in high demand and where communities can beinvolved — is now emerging in many developing countries. This kindof community-based and supply-driven tourism could be coupled withimprovements in craftsmanship. Education in many countries is nowgeared towards providing skills for tourism services and local craftsproduction. This niche of the tourism industry needs to be marketed andICT can be used for this purpose. ICT is increasingly required to facil-itate networking among tourism providers so that they can improve themanagement of the natural and cultural resources that attract tourists.ICT can also help suppliers to learn best practices for the sale of localcraft products via the Web, as has been the case in Bolivia, Chile, China,India and South Africa. The Committee recommends that ICTshould be promoted to ensure that information about tourist attrac-tions is made available to potential visitors and that networking
among tourism providers and local product suppliers is facilitated.
(c) Improving access to credit
26. The rural poor find it difficult to obtain access to credit. Formalfinancial institutions frequently determine that rural areas are not prof-itable enough and the rates charged by moneylenders are often unaf-fordable. However, microfinance, which typically comprises credit
services but is increasingly encompassing deposit and insurance servic-es, provides affordable loans; although these loans are directed mainlytowards the urban areas, they can be expanded, after suitable adaptation,to the rural poor. It is non-profit organizations that often provide micro-finance, but some financial institutions do have microfinance depart-ments. Microfinance has the potential to stimulate growth in incomesand assets and helps safeguard poor households against extreme vulner-
12 T H E C D P R E P O R T 2 0 0 3

8/14/2019 Local Development and Global Issues
http://slidepdf.com/reader/full/local-development-and-global-issues 24/82
ability. Loans, savings and insurance help even out income fluctuationsand maintain consumption levels during lean periods. Evidence frommicrofinance clients demonstrates that access to financial servicesenables poor people to reduce vulnerability, increase their incomes andbuild assets.
27. The Committee recommends that Governments shouldencourage the microfinance industry to expand into rural areas.
Where necessary, Governments and the international communityshould provide funds to nurture the growth of a self-sustainingmicrofinance industry able to supply banking services, and espe-cially credit, to the rural poor.
3. Improving access to local, national and global markets
28. The inadequacy of rural infrastructure, such as transport, infor-
mation and communication networks, often impedes smooth access tomarkets. Enhancing rural infrastructure would complement farmers’efforts to improve the marketability of their produce. The export of their products requires efficient and dynamic management on the partof the rural enterprises so that they are capable of dealing with suchmatters as certification and branding of products and contracts withoverseas purchasers.
29. The Committee recommends that public investment in ruralinfrastructure, such as road, transport, information and communi-cations networks, should be expanded to connect rural with urbanareas. In this way, the products of farmers and rural entrepreneurs insmall-scale industries would be distributed and marketed more widelyand thus yield higher income and profits. Donors and multilateralorganizations should reassess their policies and ensure that agreater percentage of an expanding total of aid goes to rural areas.
30. The export of many products is still constrained by distortions ininternational product markets: in particular, the subsidies given to theirfarmers by the developed countries amount to $340 billion a year, com-pared with a foreign aid budget of $60 billion.
31. The Committee recommends the removal as soon as possi-ble of obstacles to commercializing agricultural products from
13L O C A L D E V E L O P M E N T A N D G L O B A L I S S U E S

8/14/2019 Local Development and Global Issues
http://slidepdf.com/reader/full/local-development-and-global-issues 25/82
developing countries. In this regard, the Committee feels that it isimperative for developed countries to remove all agricultural subsidies,distortions and barriers in the immediate future so that developing coun-tries can expand their exports and see their domestic markets protectedfrom dumping.
4. Examining policies through “rural lenses”, with a special
focus on women32. The harmful effect of agricultural distortions in developed coun-tries on the rural poor in developing countries shows that not just nation-al but also international policy initiatives must be scrutinized through“rural lenses” — that is to say, from the point of view of their potentialimpact on rural areas and the sustainability of the increase in well-beingof rural communities. In all cases, the gender dimension should be taken
into special consideration, as women and girls often constitute a major-ity of the rural population and therefore stand to be the most importantcontributors to, as well as beneficiaries of, accelerated rural develop-ment; and in many of the poorest developing countries, women accountfor the largest share of agricultural output. Specific needs of womenand the issue of the removal of constraints on their full participa-tion in economic activity should be addressed as a matter of urgency.
14 T H E C D P R E P O R T 2 0 0 3

8/14/2019 Local Development and Global Issues
http://slidepdf.com/reader/full/local-development-and-global-issues 26/82

8/14/2019 Local Development and Global Issues
http://slidepdf.com/reader/full/local-development-and-global-issues 27/82
cultural resources and the rise of violent conflicts cannot be preventedwithout concerted international efforts.
5. The contribution of the developing countries to the mitigation of global risks and their effective participation in the global knowledgesociety presume their access to the global information networks andinnovative technologies. The participation of developing countries inthe provision and consumption of global public goods is also an impor-tant aspect of attaining the Millennium Development Goals, in particu-lar those targeted at achieving universal education, combatingHIV/AIDS and ensuring environmental sustainability.
6. Many GPGs are provided by Governments at the national levelbecause they recognize their value for society’s well-being. However,since domestic financing is usually insufficient, there is typically under-provision of GPGs, with many countries attempting to freeride on thebudgetary financing of other countries. Where the international financ-
ing of GPGs does occur, it is often included as part of official develop-ment assistance (ODA), in which case the donors themselves are alsoamong the beneficiaries of such expenditures.
7. From the perspective of the development agenda, it is importantto disentangle ODA from the financing of GPGs, with ODA retainingits rationale primarily as a mechanism for supporting developing coun-tries in their national development efforts. The provision of GPGs toenhance global welfare, reduce global bads and mitigate global risks has
its own rationale. Accordingly, it is essential to ensure that financing theprovision of GPGs is not carried out at the expense of development aidmeant to provide for national public goods that developing countriesneed and/or at the expense of these countries’ private goods. Additionalresources need to be mobilized to provide GPGs. In addition, institu-tional arrangements and decision-making processes for the provision of GPGs should take into account the interests and concerns of developingcountries, both as consumers and as potential providers of GPGs.
8. It has been estimated that, currently, up to about one third of theannual global allocation of ODA, 10 which has itself declined signifi-
16 T H E C D P R E P O R T 2 0 0 3
10 Estimates of the total amount and its distribution vary according to sources. Accordingto one estimate, funds covering GPGs are distributed as follows: “(g)lobal environmen-tal public goods attract about half, with health, knowledge management, governance,and conflict prevention sharing the other half”. See Inge Kaul and others, eds.,Providing Global Public Goods: Managing Globalization (New York, Oxford UniversityPress for UNDP, 2003).

8/14/2019 Local Development and Global Issues
http://slidepdf.com/reader/full/local-development-and-global-issues 28/82
17L O C A L D E V E L O P M E N T A N D G L O B A L I S S U E S
cantly in recent years to about $50 billion a year, is used to finance glob-al public goods. In the opinion of the Committee, there are a number of potential sources from which revenue could be generated to provideadditional funding for GPGs without diverting ODA.
9. In order to meet urgent needs, a number of new financing arrange-ments for GPGs were created in the recent past, for example, the GlobalEnvironment Facility (GEF), the Multilateral Fund for the
Implementation of the Montreal Protocol, the Global Fund to FightAIDS, Tuberculosis and Malaria, the clean development mechanismand the emissions trading mechanisms under the Kyoto Protocol 11 to theUnited Nations Framework Convention on Climate Change. 12 So far,these measures have emerged in a more or less ad hoc fashion.Proposals for new funding mechanisms (including international taxes,charges, user fees and compensation mechanisms) have also been putforward. Thus, the examination of what has been accomplished to dateand whether the right tools are in place for today’s challenges and thosethat are foreseen for the future, is timely.
10. The Committee is of the opinion that there is a strong need to raiseglobal awareness about the nature and role of GPGs in the age of glob-alization and to develop a methodology for the assessment of the levelof demand and provision of GPGs by sectors and categories. It is alsoimportant to create and apply sound analytical tools for evaluating the
global components and effects in respect of the provision and con-sumption of national public goods.
B. Action required at the national and international levels
11. Many global problems — diseases, pollution and financial crisiscontagion — are the result of externalities spilling across borders. Inaddressing these problems, it is important to follow the principle of sub-sidiarity, by placing the responsibility on the agents with the most atstake and the ability to lower transaction costs, in order to avoid over-centralization and the inefficiencies and inequities resulting from taking
11 FCCC/CP/1997/7/Add.1, decision 1/CP.3, annex.12 United Nations,Treaty Series , vol. 1771, No. 30822.

8/14/2019 Local Development and Global Issues
http://slidepdf.com/reader/full/local-development-and-global-issues 29/82
corrective action. 13 What can be done nationally ought to be done at thatlevel; but the provision of international assistance ought to be consid-ered for developing countries lacking the resources to internalize exter-nalities that are deemed vital to their economic and social development.
12. The concept of GPGs provides a useful framework within which toexplore the institutional arrangements at all levels and the financing mech-anisms for the provision or containment of cross-border externalities.
13. Governments have a key role, albeit often only a facilitating one,in the provision of GPGs. To better understand what can be done nation-ally and internationally, it is useful to distinguish between core andcomplementary activities related to the provision of public goods.
14. Core activities aim at producing GPGs that are made availablethrough international cooperation, such as programmes undertaken witha transnational or multi-country interest in mind, as well as activitiesfocused in one country with benefits to others. Complementary activi-ties (the primary responsibility for which lies within each country)enable States to be prepared to reap the benefits of GPGs that core activ-ities make available, while simultaneously creating valuable nationalpublic goods (NPGs). Research, for example, is a core activity in theproduction of knowledge, but education is complementary to its pro-duction; the provision of schools and teachers is complementary to the
use of knowledge (see table 1).
C. Institutional and financial arrangements
15. The existing institutional arrangements and financing mecha-nisms of GPGs need to be examined. Although national and local pub-lic goods receive funding, as they are viewed as infrastructure-creationworthy of financing, there is an institutional vacuum and very lowfinancing of GPGs by the international financial institutions. The“purer” a GPG, the more pronounced the financing gap, since it wouldthen usually be considered common property, with a greater number of
18 T H E C D P R E P O R T 2 0 0 3
13 For a discussion on the concepts of financing mechanisms of GPGs, see, for example,F. Sagasti and K. Bezanson,Financing and Providing Global Public Goods: Expectations and Prospects (Stockholm, Ministry of Foreign Affairs of Sweden, November 2001).

8/14/2019 Local Development and Global Issues
http://slidepdf.com/reader/full/local-development-and-global-issues 30/82
19L O C A L D E V E L O P M E N T A N D G L O B A L I S S U E S
users prone to becoming freeriders. GPG financing therefore requiresinternational mediation; but in the absence of institutional support atthis level, there is also a stronger need for efforts at the national level,for example, collection of revenues.
16. In the absence of a global government with tax-raising powers,voluntary cooperation and collective action are the main instruments forsupplying GPGs. In the view of the Committee, financing should notpose insurmountable problems for many GPGs, given the existence of untapped potential resources. The efficient provision of different types
Complementary activityPublic goodsand sectors Core activity Production Consumption
EnvironmentInternational Emmissions reductions ResearchNational Conservation Agricultural support Poverty reduction
KnowledgeInternational Research centres Internet services Global networksNational Educational services Universal education Schools
HealthInternational Elimination of disease Research on diseaseNational Preventive health care Health care system Health clinics
SecurityInternational Conflict prevention Peacekeeping
Security councilNational Crime reduction Policing Poverty reduction
GovernanceInternational Global institutions Research Financial stability
National “Good government” Government capacity Equity
Table 1CLASSIFYING PUBLIC GOODS BY SECTOR, AND CORE ANDCOMPLEMENTARY ACTIVITY
Source: Oliver Morrissey, Dirk Willem te Velde and Adrian Hewitt, "Defining internationalpublic goods: conceptual issues", inInternational Public Goods: Incentives, Measurements and Financing , M. Ferroni and A. Mody, eds. (Dordrecht, Netherlands, Kluwer Academy Publishersand International Bank for Reconstruction and Development/World Bank, 2002).

8/14/2019 Local Development and Global Issues
http://slidepdf.com/reader/full/local-development-and-global-issues 31/82
of GPGs also requires different institutional arrangements depending onthe "technology of aggregation". 14 The provision of pure public goods,for example, would be most efficiently carried out by the internationalcommunity through international treaties and regimes; other goods, likeresearch undertaken to find cures for disease, may require public-privatepartnerships; still other group-specific goods can be provided throughthe development of private collectives that finance the shared good
through fees or tolls, and the development of robust yet flexible region-al institutions. Therefore, the Committee notes the need to explore thefeasibility of taxes, user fees, and charges for use of the global commons.
17. The Committee recognizes, however, that financing GPGs mayimply not only new resource mobilization, but also resource realloca-tion. For example, current budgetary allocations could be restructured insuch a way as to eliminate harmful subsidies (for example, the subsi-dization of coal production), which today are estimated at about $900billion a year worldwide. Likewise, instead of merely addressing theconsequences of the underprovision of a GPG (for example, in the con-tainment of financial crises), efforts could be reoriented towardsenhancing the provision of the GPG itself (for example, through nation-al capacity-building for banking supervision to enhance financial stabil-ity). Regulation and other actions could be used to change the incentivestructures that enlarge a set of options for enhancing the provision of
GPGs. For example, efforts to fight global communicable diseasescould become more affordable if medicines were priced differentially,according to the ability to pay in developed and developing countries.
18. In addition, it would be advisable to focus on non-rival GPGs,insofar as the provision of these goods can, by nature, be increased at alow cost, making them more politically viable. One example is knowl-edge. Lack of knowledge is often a key obstacle to development. While
there is a need to provide incentives to inventors, there is room for addi-tional innovative arrangements to foster the widest possible diffusion of development-relevant knowledge without compromising the incentives
20 T H E C D P R E P O R T 2 0 0 3
14 For a review of the techniques on how to best provide different types of GPGs, see forexample, P. B. Anand, “Financing the provision of global public goods”, DiscussionPaper, No. 2002/110 (Helsinki, United Nations University/World Institute forDevelopment Economics Research (UNU/WIDER), November 2002).

8/14/2019 Local Development and Global Issues
http://slidepdf.com/reader/full/local-development-and-global-issues 32/82

8/14/2019 Local Development and Global Issues
http://slidepdf.com/reader/full/local-development-and-global-issues 33/82
22 T H E C D P R E P O R T 2 0 0 3
extended to the international context, strongly suggesting that GPGstend to be undersupplied if left to the decisions of individuals, compa-nies and Governments.
23. Therefore, the Committee suggests that:
(a) There is a need to increase public awareness and understand-ing regarding GPGs in order to create the necessary conditions forGovernments and other actors, including the private sector, to raiseresources for provision of GPGs;
(b) Since the present modality of financing GPGs by divertingODA is not an efficient way of providing GPGs, new institutionaland finance arrangements must be developed;
(c) To this end, it is necessary to identify the financing gap anddevelop realistic estimates of the financing requirements for the
provision of GPGs, by category (for example, health, education andenvironment);
(d) Financing mechanisms should be mapped to ensure betterand more flexible use of existing resources and their match tourgent needs;
(e) It is necessary to consider the use of new potential sources tosupplement existing resources so as to help ensure provision of
GPGs (for example, the carbon tax and international financialtransfers);
(f) International-level decision-making should be strengthened toovercome many of the problems of underprovision existing today,especially in the global environmental domain, by involving all con-cerned stakeholders, including developing countries, in determin-ing the priority of each GPG, the appropriate production level and
its net benefits;
(g) The role of the private sector in the provision of GPGs shouldbe increased by changing incentives and correcting market failures.

8/14/2019 Local Development and Global Issues
http://slidepdf.com/reader/full/local-development-and-global-issues 34/82
23L O C A L D E V E L O P M E N T A N D G L O B A L I S S U E S
IV. Review of the list of least developed countries
A. Introduction
1. The Committee for Development Policy is required, pursuant toEconomic and Social Council resolution 1998/46 of 31 July 1998,annex I, paragraph 9, to conduct triennially a review to determine the
countries to be added to or graduated from the list of least developedcountries. Since the previous review was conducted in 2000, theCommittee conducted another review in 2003.
2. The Committee bases its identification of the least developedcountries on the consideration of three dimensions of a country’s stateof development: its income level, its stock of human assets and its eco-nomic vulnerability. The Committee thus uses (a) gross national income
(GNI) per capita as an indicator of income; (b) the Human Assets Index(HAI) as an indicator of the stock of human assets; and (c) the economicvulnerability index (EVI) as an indicator of economic vulnerability. Inaddition, because the underlying concept of the least developed countrycategory excludes large economies, in 1991 the General Assembly in itsresolution 46/206 endorsed the principle that no country with a popula-tion exceeding 75 million should be considered for addition to the list,as had been set forth in the report of the Committee for DevelopmentPlanning on its twenty-seventh session. 15
3. For each review, the Committee determines threshold levels foreach of the three indicators. These thresholds are used to identify thecountries to be added to or graduated from the category. To be added, acountry must satisfy all three criteria. To become eligible for gradua-tion, a country must meet an adjusted set of thresholds for two of thesame three indicators; to qualify for graduation, it must do so in twoconsecutive reviews. The Committee understands, however, that its roleis to assist in identifying which countries are eligible or qualify for grad-uation from least developed country status, based on the application of
15 See Revolution and Reform in Eastern Europe and the Soviet Union: the Global Development Impact. Report of the Committee for Development Planning on the twen- ty-seventh session (22-26 April 1991) (United Nations publication, Sales No. E.92.IV.2),para 242.

8/14/2019 Local Development and Global Issues
http://slidepdf.com/reader/full/local-development-and-global-issues 35/82
24 T H E C D P R E P O R T 2 0 0 3
the criteria adopted by the Committee and endorsed by the Economicand Social Council. The decision on whether the countries should begraduated is the responsibility of the Council and, ultimately, theGeneral Assembly.
4. The Economic and Social Council, in its resolution 2002/36 of 26July 2002, took note of the recommendations of the Committee regard-ing three major changes to the criteria for the identification of the least
developed countries: first, that gross national income (GNI) per capitashould replace gross domestic product (GDP) per capita as the indica-tor of income; second, that, as it was a better indicator of the level of education, the gross secondary school enrolment ratio should possiblyreplace the gross combined primary and secondary school enrolmentratio in the Human Assets Index (HAI) (previously called theAugmented Physical Quality of Life Index (APQLI)); and third, that thepercentage of the population displaced by natural disasters could beused as a supplement to the economic vulnerability index (EVI) whensuitable data became available.
5. The Committee has made improvements to the new criteria for theidentification of the least developed countries adopted in 2000.However, it considers that there is scope for further methodologicalimprovements in this before the next triennial review. Particular atten-tion should be given, as in the past, to the quality and reliability of indi-vidual indicators and the way in which the criteria are applied.
B. Criteria for the identification of the least developed countries in 2003
1. Gross national income (GNI) per capita
6. The initial list of countries to which the criteria for identifying the
least developed countries were applied during the 2003 review comprisedall countries classified by the World Bank as low-income in any one of thethree most recent years. 16 The Committee gave special attention to thelow-income countries with economies in transition of Eastern Europe
16 The World Bank’s list of low-income countries changes from year to year as a result ofchanges in the cut-off point and the differences in growth among countries over time.

8/14/2019 Local Development and Global Issues
http://slidepdf.com/reader/full/local-development-and-global-issues 36/82
25L O C A L D E V E L O P M E N T A N D G L O B A L I S S U E S
and in Central Asia that had become independent in the 1990s, butfound that none of them should be included in the initial list for the rea-sons given in the box below. As a result, 65 countries have been retainedfor consideration during the 2003 review, comprising the 49 currentleast developed countries and 16 low-income countries not currentlyincluded in the list of least developed countries, including one new StateMember of the United Nations, Timor-Leste.
7. The Committee decided that the threshold for inclusion in thepresent review should be a three-year (1999-2001) average GNI percapita of US$ 750. 17 With regard to the threshold for graduation, theCommittee increased the margin from 15 to 20 per cent above thethreshold for inclusion, primarily to avoid the possibility that graduat-ing countries would rejoin the category as a result of short-term fluctu-ations in their GNI per capita arising from exogenous shocks. It wasthus agreed that, in the 2003 review, the threshold for graduation wouldbe a three-year average GNI per capita of US$ 900. Six current leastdeveloped countries would be above the graduation threshold for thiscriterion (see table 2).
2. Human Assets Index (HAI)
8. The Committee agreed that the HAI should continue to reflect thefollowing: (a) nutrition , measured by the average calorie consumptionper capita as a percentage of the minimum requirement; (b) health ,measured by the under-five child mortality rate; and (c) education ,measured by: (i) the adult literacy rate and (ii) the gross secondaryschool enrolment ratio.
9. As agreed in 1991, the HAI threshold for inclusion is the value of the border between the third and fourth quartiles of the group of 65countries identified in table 2. In the 2000 review, the threshold forgraduation was 15 per cent above the inclusion threshold. TheCommittee decided, however, that the margin between thresholds forinclusion and graduation should be decreased from 15 to 10 per cent
17 The World Bank cut-off points for low-income countries during these three years wereUS$ 755, US$ 755 and US$ 745, respectively.

8/14/2019 Local Development and Global Issues
http://slidepdf.com/reader/full/local-development-and-global-issues 37/82
26 T H E C D P R E P O R T 2 0 0 3
The case of countries with economies in transition
N ine countries with economies in transition have been classified as low-income countries by the World Bank in at least one of the past three years.Owing to the major political and economic changes that took place during
their transition to market economies, these countries suffered deep recessions.During the period 1990-2000, for example, GDP per capita fell by over 50 per cent ineach of these. Their three-year average GNI per capita ranged from US$ 173 in
Tajikistan to US$ 780 in Turkmenistan (see table below).GNI per capita is within the current threshold for inclusion in eight of the nine
economies in transition. Similarly, seven of these countries would also be eligible forinclusion under the EVI criterion. However, as former socialist republics, they stillhave high HAI scores owing to past social policies and should not be recommendedfor inclusion in the list of least developed countries.
The Committee agreed that considering economies in transition for inclusionin the 2003 triennial review of the list of least developed countries would also cre-
ate distortions of the HAI in the establishment of thresholds for inclusion and gradu-ation. It was recalled, however, that the economic decline in these countries had last-ed longer than was expected. It was also noted that a few of these countries nowhave lower GNI per capita than many current least developed countries. If theeconomies of these low-income economies in transition do not improve in the nearfuture, erosions of social progress may be difficult to reverse, leading to a possiblelowering of HAI. The Committee thus emphasized the importance of monitoring theeconomies in transition with low incomes and decreasing HAI scores.
Population Per capita EVI2002 GNI (mod-
(millions) (US dollars) HAI EVI ified)a
Armenia 3.8 523 79.4 30.7 34.0Azerbaijan 8.1 607 72.8 38.9 40.6Georgia 5.2 647 76.2 47.6 48.2Kyrgyzstan 5.0 287 77.6 38.2 39.9Republic of Moldova 4.3 397 81.1 39.6 39.1Tajikistan 6.2 173 69.5 37.7 39.1Turkmenistan 4.9 780 84.5 60.9 53.8Ukraine 48.7 723 86.3 23.8 26.1Uzbekistan 25.6 607 81.3 40.3 36.3
ECONOMIES IN TRANSITION: DATA AND CRITERIA USED INDETERMINING ELIGIBILITY FOR LEAST DEVELOPED COUNTRY STATUS
a EVI with sixth component: percentage of population displaced by natural disasters.

8/14/2019 Local Development and Global Issues
http://slidepdf.com/reader/full/local-development-and-global-issues 38/82
27L O C A L D E V E L O P M E N T A N D G L O B A L I S S U E S
Population Per capita EVI2002 GNI (mod-
(millions) (US dollars) HAI EVI ified)a
LDC Afghanistan 23.3 523 11.6 50.1 49.0LDC Angola 13.9 447 25.6 48.5 46.8LDC Bangladesh 143.4 363 45.3 22.9 29.5LDC Benin 6.6 367 40.2 57.0 56.4LDC Bhutan 2.2 600 40.4 40.6 41.0LDC Burkina Faso 12.2 217 26.5 49.3 47.0LDC Burundi 6.7 110 19.7 53.8 49.6LDC Cambodia 13.8 263 44.5 49.7 48.1
Cameroon 15.5 583 43.8 31.9 31.2LDC Cape Verde 0.4 1 323 72.0 55.5 56.7LDC Central African Republic 3.8 277 29.9 43.1 42.0LDC Chad 8.4 203 26.1 59.2 56.6LDC Comoros 0.7 387 38.1 59.1 58.7
Congo 3.2 610 55.2 50.3 46.8Côte d'Ivoire 16.7 687 43.0 25.4 25.9Democratic People's
Republic of Korea 22.6 440 62.9 32.8 29.5LDC Democratic Republic
of the Congo 54.3 100 34.3 40.8 42.3LDC Djibouti 0.7 873 30.2 48.6 49.5LDC Equatorial Guinea 0.5 743 47.2 64.4 55.8LDC Eritrea 4.0 190 32.8 51.7 50.2LDC Ethiopia 66.0 100 25.2 42.0 40.7LDC Gambia 1.4 340 34.0 60.8 56.5
Ghana 20.2 337 57.9 40.9 41.9LDC Guinea 8.4 447 30.3 42.1 40.0LDC Guinea-Bissau 1.3 170 31.2 64.6 60.7LDC Haiti 8.4 493 35.3 41.7 43.5
India 1 041.1 450 55.7 13.5 19.6Indonesia 217.5 610 73.6 18.1 21.9
Kenya 31.9 350 49.3 28.4 29.0LDC Kiribati 0.1 923 67.5 64.8 60.4LDC Lao People's Democratic
Republic 5.5 297 46.4 43.9 43.4LDC Lesotho 2.1 573 45.4 44.2 44.5LDC Liberia 3.3 285 38.7 63.1 58.3LDC Madagascar 16.9 253 37.9 21.6 27.0LDC Malawi 11.8 177 39.0 49.0 49.4
Table 2LEAST DEVELOPED AND OTHER LOW-INCOME COUNTRIES:CRITERIA USED IN DETERMINING ELIGIBILITY FOR LEAST DEVELOPEDCOUNTRY STATUS

8/14/2019 Local Development and Global Issues
http://slidepdf.com/reader/full/local-development-and-global-issues 39/82
28 T H E C D P R E P O R T 2 0 0 3
Population Per capita EVI2002 GNI (mod-
(millions) (US dollars) HAI EVI ified)a
LDC Maldives 0.3 1 983 65.2 33.6 37.5LDC Mali 12.0 230 19.9 47.5 45.4LDC Mauritania 2.8 377 38.2 38.9 37.7
Mongolia 2.6 393 63.3 50.0 48.9
LDC Mozambique 19.0 220 20.0 35.6 39.2LDC Myanmar 49.0 282 60.0 45.4 45.6LDC Nepal 24.2 240 47.1 29.5 31.0
Nicaragua 5.3 395 60.8 39.4 42.5LDC Niger 11.6 180 14.2 54.1 53.1
Nigeria 120.0 267 52.3 52.8 51.1Pakistan 148.7 437 45.5 20.2 26.1Papua New Guinea 5.0 673 46.2 36.1 38.6
LDC Rwanda 8.1 230 34.1 63.3 59.6LDC Samoa 0.2 1 447 88.8 40.9 50.8LDC Sao Tome and Principe 0.1 280 55.8 41.8 37.0LDC Senegal 9.9 490 38.1 38.4 38.8LDC Sierra Leone 4.8 130 21.7 45.7 43.3LDC Solomon islands 0.5 657 47.3 46.7 49.1LDC Somalia 9.6 177 8.5 55.4 53.1LDC Sudan 32.6 333 46.4 45.2 46.5
Timor-Leste 0.8 478 36.4 b b
LDC Togo 4.8 293 48.6 41.5 42.8LDC Tuvalu 0.01 1 383 63.7 70.3 67.3LDC Uganda 24.8 297 39.8 43.2 41.6LDC United Republic of
Tanzania 36.8 263 41.1 28.3 30.2LDC Vanuatu 0.2 1 083 57.4 44.5 46.4
Viet Nam 80.2 390 72.7 37.1 39.4LDC Yemen 19.9 423 46.8 49.1 49.0LDC Zambia 10.9 317 43.4 49.3 47.6
Zimbabwe 13.1 463 56.5 33.7 30.3
Table 2 (continued)
Note: Thresholds for inclusion in the list of least developed countries are population less than 75million; per capita gross national income (GNI) less than $750; Human Assets Index (HAI) less than55; and economic vulnerability index (EVI) greater than 37. A country must meet all the criteria.Thresholds for graduation from the list of least developed countries are: per capita GNI greater than$900; HAI greater than 61; and EVI less than 33. A country must meet at least two criteria to be eli-gible for graduation.
The letters "LDC" before a country name indicate a country that is currently designated as a leastdeveloped country.
Figures in boldface type indicate a graduation criterion that has been met by a current least devel-oped country.
a EVI with sixth component: percentage of population displaced by natural disasters; threshold forinclusion: greater than 38; threshold for graduation: less than 34.b Data unavailable.

8/14/2019 Local Development and Global Issues
http://slidepdf.com/reader/full/local-development-and-global-issues 40/82
because this margin would be sufficient to distinguish the countries thathad developed significantly better human assets. According to theagreed guidelines, the threshold for inclusion in the list of least devel-oped countries under this index is an HAI value of 55. The threshold forgraduation under this index is 61.
3. Economic vulnerability index (EVI)
10. Economic vulnerability can take a variety of forms. The vulnera-bility that has to be considered in the identification of the least devel-oped countries is structural economic vulnerability. For this purpose,the EVI should reflect the relative risk posed to a country’s developmentby exogenous shocks, the impact of which depends not only on the sizeof the shocks, but also on structural characteristics that determine theextent to which the country would be affected by such shocks. The EVI
used by the Committee is therefore an average of five indicators: (a)merchandise export concentration; (b) instability of export earnings; (c)instability of agricultural production; (d) share of manufacturing andmodern services in GDP; and (e) population size.
11. The Committee was informed that the quality of internationallycomparable data on the number of people displaced by natural disastershad improved significantly. The Committee thus agreed that this infor-mation should be included in a modified EVI as a supplement to data onthe instability of agricultural production.
12. The Committee fully recognized that small countries are econom-ically more vulnerable to external shocks than large ones because theireconomies are heavily dependent on external trade, are less diversifiedand suffer from diseconomies of scale. In particular, most small islandleast developed countries face a range of structural handicaps — suchas high international transportation costs and relative isolation frommain markets — that make them less vulnerable to external shocks. Forthat reason, it was suggested that the remoteness of countries might alsobe taken into consideration in future reviews.
13. As in the case of the HAI, the Committee decided that the EVImargin between thresholds for inclusion and graduation should bedecreased from 15 to 10 per cent. According to these guidelines, the
29L O C A L D E V E L O P M E N T A N D G L O B A L I S S U E S

8/14/2019 Local Development and Global Issues
http://slidepdf.com/reader/full/local-development-and-global-issues 41/82
threshold for inclusion is a value of 37. The threshold for graduationunder this index is 33. With the inclusion of the percentage of popula-tion displaced by natural disasters, the threshold for inclusion would bea value of 38 and for graduation 34.
4. Eligibility for inclusion and graduation
(a) Country to be added to the list14. Timor-Leste is the only country eligible for addition to the list. ItsEVI cannot be calculated because of lack of data, but both its GNIincome per capita and HAI are well below the thresholds for inclusion.The Committee recommends that it be included in the list of least devel-oped countries.
(b) Countries to be considered for graduation
(i) Countries qualifying for graduation
15. The Committee agrees that two countries — Cape Verde andMaldives — qualify for graduation since they have met two graduationcriteria in two consecutive reviews.
a. Cape Verde
16. In 1997, the Committee had indicated that Cape Verde wouldbecome eligible for graduation in the following review, as it met twograduation criteria (income per capita and human capital indices) at thattime. The 2000 review confirmed that Cape Verde had met these twograduation criteria and qualified for graduation. However, it ranked asone of the most economically vulnerable developing countries accord-ing to the EVI. Because of its high economic vulnerability and the highdependence of the country on foreign aid and workers’ remittances, theCommittee recommended that the graduation of Cape Verde from thelist of least developed countries be postponed for reconsideration at the2003 review.
17. Cape Verde now has the fourth highest GNI per capita and thefourth highest HAI among the 65 countries. Both measures are well
30 T H E C D P R E P O R T 2 0 0 3

8/14/2019 Local Development and Global Issues
http://slidepdf.com/reader/full/local-development-and-global-issues 42/82
31L O C A L D E V E L O P M E N T A N D G L O B A L I S S U E S
above the graduation threshold. In contrast, it is economically vulnera-ble, with an EVI score of 55.5, compared with a graduation threshold of 33. Nevertheless, given that the country meets two of the three gradua-tion criteria — and that it has done so in three consecutive reviews —the Committee agrees that it qualifies for graduation from the list.
18. The Committee was informed that the Government of Cape Verdehad expressed reservations about the accuracy of data on nutrition used
in the calculation of its HAI. In the Government’s view, the calorieintake data presented by the Food and Agriculture Organization of theUnited Nations (FAO) — based on food balances that compute data onnational food production and food imports rather than on householdconsumption surveys — do not reflect the nutritional reality of thecountry. As a result, the Government believes that adjustments shouldbe made in the calculation of its HAI score. The Committee took noteof this concern but was informed by FAO that its calorie intake figurewas the most reliable statistic collected on an internationally compara-ble basis. The Committee stresses that the credibility of its triennialreview of the list is partly dependent on the fact that it uses data col-lected on an internationally comparable basis by specialized agencies of the United Nations system, such as FAO, the United NationsEducational, Scientific and Cultural Organization (UNESCO) and theWorld Health Organization (WHO).
b. Maldives
19. In its resolution 2002/36, the Economic and Social Council request-ed the Committee to continue its work on the re-examination of its rec-ommendation to graduate Maldives from the list of least developed coun-tries at its fifth session and to submit its recommendations to the Councilat its substantive session of 2003 in the context of the triennial review of
the list of least developed countries, taking into account the informationreferred to in the resolution and further information to be provided by rel-evant development partners and multilateral organizations.
20. The Committee re-examined its recommendation — made in its2000 review — that Maldives be graduated, and the subsequent con-sideration of the case of Maldives by the Committee in 2001 and 2002.

8/14/2019 Local Development and Global Issues
http://slidepdf.com/reader/full/local-development-and-global-issues 43/82

8/14/2019 Local Development and Global Issues
http://slidepdf.com/reader/full/local-development-and-global-issues 44/82
33L O C A L D E V E L O P M E N T A N D G L O B A L I S S U E S
recommends that they should not be considered. In the case of Kiribati— whose three-year average GNI per capita (US$ 923) is just above thegraduation threshold of US$ 900 — GNI per capita fell constantly overthe past four years, from US$ 1,130 in 1998 to only US$ 830 in 2001.In the case of Tuvalu, only GDP per capita data are available. In addi-tion, the Committee stresses that these are the two most economicallyvulnerable countries in the initial list according to the EVI.
C. Smooth transition of countries graduating fromleast developed country status
24. The fact that a country that has long been recognized as “leastdeveloped” qualifies for graduation is an indication of some success inits development and in its ability to achieve a degree of structuralchange in its economy. These successes, in turn, are likely to have been
largely attributable to a mix of sound domestic policies and propitiousexternal conditions. With regard to the latter, international support hasfrequently played a central role and the capacity to use world marketopportunities may also have been important.
25. Despite the progress they have achieved, countries that qualify forgraduation from least developed country status are likely to continue tohave a limited capacity to withstand exogenous shocks. A sudden with-
drawal of external support is likely to constitute such a shock and tohave negative effects, possibly reversing some of the developmentprogress achieved. Countries that qualify for graduation from the leastdeveloped country category should be commended for their success andnot penalized for it by the imposition of such a shock.
26. The Committee recalls the importance that it has consistentlyattached to “smooth transition” measures for graduating countries, as
elaborated in the reports of its third and fourth sessions.18
It also recallsthat the Economic and Social Council, in its resolution 2002/36, reiter-
18 See Participatory Development and Governance: Africa’s Special Needs. Report of the Committee for Development Polcicy on the third session (2-6 April 2001) (UnitedNations publication, Sales No. E.01.II.A.4), paras. 114-117. See alsoCapacity-building in Africa: Effective aid an human capital. Report of the Committee for Development Policy on the fourth session (8-12 April 2002) (United Nations publication, Sales No.E.02.II.A.4), paras. 158-163.

8/14/2019 Local Development and Global Issues
http://slidepdf.com/reader/full/local-development-and-global-issues 45/82
ated the importance of ensuring a smooth transition from least devel-oped country status, which it had emphasized in earlier resolutions(Council resolutions 2000/34 and 2001/43), in keeping with the obser-vation made in 1991 by the General Assembly in its resolution 46/206on the importance of ensuring that graduation from least developedcountry status would not disrupt the progress in the development of graduating countries.
27. The Committee was informed that the importance of securingsmooth transition for graduating countries had begun to be taken intoaccount by the multilateral trading system, as the question of the treat-ment of graduating member States was in the agenda of the Work Programme on Small Economies of the World Trade Organization. TheCommittee suggests that, with the general trend towards freer trade anderosion of trade preferences for all developing countries, least devel-oped country benefits should be maintained when a country graduates,as the cost to trading partners would be negligible and the benefit to thegraduating country will gradually dissipate as trade barriers for alldeveloping countries fall. The Committee recommends that theEconomic and Social Council encourage relevant development partnersand multilateral organizations to accelerate the progress in their treat-ment of graduation issues, including the provision of technical assis-tance through the Integrated Framework for Trade-related Technical
Assistance to Least Developed Countries.28. The Committee therefore recommends that a meeting of expertson the overall question of smooth transition be organized in order to castlight on the likely treatment of graduating countries by their main bilat-eral and multilateral partners.
29. It was stressed that the treatment of graduating countries by theirbilateral and multilateral partners — notably with regard to trade pref-erences — could be decided upon only in international organizations,such as the World Trade Organization. It was recalled that graduationwould imply the loss of a number of significant advantages, in particu-lar preferential market access and extended deadlines for implementa-tion with regard to World Trade Organization obligations. TheCommittee also recommends that, in each case, graduation should trig-
34 T H E C D P R E P O R T 2 0 0 3

8/14/2019 Local Development and Global Issues
http://slidepdf.com/reader/full/local-development-and-global-issues 46/82
ger the convening by the United Nations of a round-table meeting inwhich the graduating country and its development partners would iden-tify measures to ensure a smooth transition.
30. The Committee has benefited from a document submitted by theCommonwealth Secretariat, drawing attention to the general resistanceto graduation among least developed countries. This document stressesthe particular disadvantages to be faced by graduating small island
developing States and their need for assistance in maintaining access totraditional markets and securing access to new markets.
31. Bearing in mind that all countries meeting the graduation criteriain the current review were small island developing States, theCommittee recognized that the question of a smooth transition consti-tuted a particular aspect of wider considerations relating to the specialtreatment of those States. The Committee calls upon the forthcoming
international meeting in 2004 on the sustainable development of smallisland developing States (see General Assembly resolution 57/262 of 20December 2002) to give consideration to their special needs. TheCommittee urges the Economic and Social Council, in considering thequestions of graduation and smooth transition at its substantive sessionof 2003, to underline the need for a more differentiated treatment of developing countries that face special disadvantages and vulnerabilities,such as small island developing States.
D. Major findings and recommendations
32. The Committee maintained its position that, in addition to the cur-rent least developed countries, the initial list of countries to be consid-ered during the triennial review should be those identified by the WorldBank as low-income in any one of the three most recent years. Among
these countries, the Committee found that the comparatively high stocksof human assets in the low-income countries with economies in transi-tion made them ineligible to join the list of least developed countries.
33. The Committee adopted a three-year average of US$ 750 percapita as the threshold for inclusion in the category under the GNI percapita criterion. It also decided to increase the margin for graduation
35L O C A L D E V E L O P M E N T A N D G L O B A L I S S U E S

8/14/2019 Local Development and Global Issues
http://slidepdf.com/reader/full/local-development-and-global-issues 47/82
from 15 to 20 per cent above the threshold for inclusion; the graduationthreshold under this criterion thus became a three-year average of US$900 per capita.
34. The Committee agreed that the threshold for inclusion with regardto both the HAI and EVI criteria should be chosen so that three quartersof the most disadvantaged countries would be eligible under each of these criteria. The Committee also decided that the margin between the
thresholds for inclusion and graduation should be decreased from 15 to10 per cent for these indicators.
35. Applying the agreed thresholds and taking into account otherinformation and considerations, the Committee concludes that:
(a) Timor-Leste qualifies for inclusion in the list of least devel-oped countries;
(b) Cape Verde and Maldives qualify for graduation;(c) Samoa is eligible to be considered for graduation in 2006.
36. The Committee strongly emphasizes the need for a smoothtransition for countries that are graduated from the list of leastdeveloped countries and calls upon the international community,including bilateral donors and trading partners, to give urgentattention to this matter. Since all countries that either qualify or are
eligible for graduation under this review are small island develop-ing States, the Committee considers it imperative that the interna-tional meeting on small island developing States in 2004 make sub-stantial progress in formulating policies and actions that willaddress the particular set of development challenges faced by thisgroup of countries, particularly those that succeed in qualifying forgraduation from least developed country status.
36 T H E C D P R E P O R T 2 0 0 3

8/14/2019 Local Development and Global Issues
http://slidepdf.com/reader/full/local-development-and-global-issues 48/82

8/14/2019 Local Development and Global Issues
http://slidepdf.com/reader/full/local-development-and-global-issues 49/82
8/14/2019 Local Development and Global Issues
http://slidepdf.com/reader/full/local-development-and-global-issues 50/82
39L O C A L D E V E L O P M E N T A N D G L O B A L I S S U E S
Annex
REPORT OF THE EXPERT GROUP MEETING ONTHE REVIEW OF THE LIST OF LEAST DEVELOPED COUNTRIES
I. Background to the Expert Group Meeting
1. The Committee for Development Policy, at its fourth session inApril 2002, addressed a number of issues regarding the methodologyfor the identification of the least developed countries (LDCs), includingthe refinement of the economic vulnerability index introduced in 2000, a
and made major recommendations regarding the criteria for the identi-fication of the least developed countries.
2. In its resolution 2002/36 of 26 July 2002 on the Report of theCommittee for Development Policy, the Economic and Social Councilrequested the Committee, inter alia , “to continue its work on themethodology to be used for the identification of the least developedcountries, where appropriate in association with other internationalorganizations working on environmental and economic vulnerabilityissues”. In the same resolution, the Council also took note of the rec-ommendations made by the Committee at its fourth session regarding
the criteria for the identification of LDCs, namely:(a) Gross national income (GNI) per capita should replace grossdomestic product (GDP) per capita as the indicator of income;
(b) the Augmented Physical Quality of Life Index (APQLI) should berenamed the Human Assets Index (HAI) so as to conform with what thisindicator is intended to capture, namely the level of human capital;
(c) in the APQLI/HAI, the combined primary and secondary schoolenrolment ratio should be replaced by the gross secondary school enrol-ment ratio, which is a better indicator of the level of education;
a See Capacity-building in Africa: Effective aid and human capital. Report of the Committee for Development Policy on the fourth session (8-12 April 2002), (UnitedNations publication, Sales No. E.02.II.A.4), pp. 46-61.

8/14/2019 Local Development and Global Issues
http://slidepdf.com/reader/full/local-development-and-global-issues 51/82
40 T H E C D P R E P O R T 2 0 0 3
(d) when internationally comparable data on the percentage of popu-lation displaced by natural disasters become available and sufficientlyreliable, they could be used as an additional component of the econom-ic vulnerability index (EVI) ;
(e) several technical options in the use of the criteria, such as averag-ing the components of the composite indices or simultaneous consider-ation of these composite indices, should be considered before the next
review;
(f) for each graduating country, the United Nations should convene around-table meeting in which the graduating country and its develop-ment partners examine measures to ensure a smooth transition;
(g) a meeting of experts on the overall question of smooth transitionshould be organized in order to cast light on the likely treatment of grad-uating countries by their main bilateral and multilateral partners.
3. In order to facilitate the triennial review of the list – to be carriedout during the fifth session of the Committee in April 2003 – an expertgroup meeting on the review of the list of least developed countries washeld at United Nations Headquarters in New York, on 23 and 24 January2003. b The agenda of the meeting and list of participants are containedin appendix I to this report.
II. Criteria for the identification of theleast developed countries
4. There are three criteria for the identification of the least developedcountries: (a) gross national income (GNI) per capita; (b) Human AssetsIndex (HAI); and (c) economic vulnerability index (EVI). Countriesmust meet benchmarks for all three criteria to be included in the list of least developed countries. To qualify for graduation, a country mustmeet benchmarks for at least two of the three criteria in two consecutivetriennial reviews.
b Due to the continuous improvements in data - including major updates and verificationof internationally comparable data by international institutions - the data used by theCommittee for Development Policy at its fifth session (and thus referred to in ChapterIV of this report) were more up-to-date than the data used by the Expert Group andreflected in appendix II.

8/14/2019 Local Development and Global Issues
http://slidepdf.com/reader/full/local-development-and-global-issues 52/82
41L O C A L D E V E L O P M E N T A N D G L O B A L I S S U E S
5. The Expert Group took as given the rule that no country with apopulation exceeding 75 million should be considered for inclusion inthe list. The Council explicitly adopted this rule in 1991 to reflect thepreviously implicit notion that the fundamental meaning of the catego-ry — the recognition of structural handicaps — excludes largeeconomies. Only one country with a large population — Bangladesh,after gaining its independence — was ever added to the list (in 1975).
Since Bangladesh is already included in the list, it should be subjectedto the normal graduation rule: namely, that of meeting the graduationthreshold for at least two of the three criteria in two consecutive reviews.
A. Gross national income (GNI) per capita
6. The Expert Group agreed that the list of countries to which themethodology for identifying the LDCs should be applied during the tri-
ennial review should include all countries classified by the World Bank as low-income in any one of the three most recent years. c The Groupalso considered the case of the low-income countries of Eastern Europeand Central Asia that had become independent in the 1990s. However,the Group concluded that these countries did not justify being includedin the list for the reasons given in section III below. As a result, the ini-tial list to be considered during the triennial review would comprise 65countries: the 49 current least developed countries and 16 non-leastdeveloped low-income countries, including one new State Member of the United Nations, Timor-Leste (see appendix II, table 1).
7. The World Bank uses per capita gross national income (GNI), notgross domestic product (GDP), in determining membership in the groupof low-income countries. Since GNI can measure the productive capac-ity of a country as adequately as GDP, the Expert Group fully support-ed the recommendation of the Committee that, for the sake of clarityand consistency, GNI per capita should replace GDP per capita amongthe criteria for graduation, as it already does in those for inclusion. TheExpert Group recommended that, in the triennial review, the threshold
c The World Bank’s list of low-income countries changes from year to year as a resultof changes in the cut-off point and differences in growth among countries over time.

8/14/2019 Local Development and Global Issues
http://slidepdf.com/reader/full/local-development-and-global-issues 53/82
42 T H E C D P R E P O R T 2 0 0 3
for inclusion should be a three-year (1999-2001) average GNI per capi-ta of less than US$ 750. d
8. With regard to the threshold for graduation, the Expert Group rec-ommended an increase from 15 to 20 per cent above the threshold forinclusion. This increment was proposed primarily to ensure that gradu-ating countries would not move back into the category after a few yearsbecause of a decline in their GNI per capita caused by a temporary drop
in the export prices of their primary commodities, a natural disaster orother economic shock. The increase was also justified by the uncertain-ty in GNI data. It was thus agreed that, in the 2003 triennial review, thethreshold for graduation would be a three-year average GNI per capitaof US$ 900. Six current LDCs would be candidates for graduationunder this criterion (see appendix II, table 1). It was also reiterated that,in potential cases of graduation, the role played by remittances, externalaid and other forms of transfers be considered with regard to theirimpact both on GNI and domestic productive capacity.
B. Issues common to the two composite indices
9. During the deliberations, some issues common to the revision of the two composite indices (HAI and EVI) arose. Different options andcalculations were presented by the Secretariat in each case, and the
Expert Group discussed the merits and appropriateness of various alter-natives to the prevailing methodology.
10. In both composite indices, original values of relevant indicatorshad, in the past, been converted into relative values on a scale of 0 to100. e The final composite index values were arithmetic averages of theconverted values of all components. The Expert Group recommendedcontinuation of scaling indicators between maximum and minimum val-
ues for compiling the individual indices. Along with eliminating outliervalues by their compression to the next maximum or minimum value,the Group agreed on maintaining equal weights for the components of
d The World Bank cut-off points for low-income countries during these three years wereUS$ 755, US$755 and US$745, respectively.
e This procedure was applied to the data for 156 developing countries and economiesin transition.

8/14/2019 Local Development and Global Issues
http://slidepdf.com/reader/full/local-development-and-global-issues 54/82
43L O C A L D E V E L O P M E N T A N D G L O B A L I S S U E S
both indices. The Group also explored the possibility of fixing naturalor normal bounds instead of using actual maximum and minimum val-ues, in order to allow the comparability of composite indices from onereview to the next.
11. There was broad support for maintaining equal weights for thecomponents of both indices, which consist of four indicators for theHAI and five indicators for the EVI. It was recalled that the choice of
equal weights was not arbitrary since the indicators were the mostimportant factors influencing structural handicaps.
12. As agreed in 1991, and in conformity with the principle that leastdeveloped countries are low-income countries with a low level of human capital and a high level of economic vulnerability, the HAIthreshold for inclusion would be the value of the index for the upperquartile of the group of 65 least developed and low-income countries as
identified above. In the case of the EVI – where high values reflect highvulnerability – the threshold would be the value of the index for thelower quartile.
13. In the 2000 triennial review, the thresholds for graduation were 15per cent higher than the inclusion threshold for the HAI and 15 per centlower than the inclusion threshold for the EVI. The Expert Group rec-ommended that the margin between thresholds for inclusion and gradu-
ation for both the HAI and the EVI be decreased from 15 to 10 per cent.The reason was that, whereas GNI could grow exponentially, the changein the value of the composite indices is bound by their maximum (orminimum) values. Smaller margins could thus better distinguish thecountries that had achieved significantly better scores than the majorityof least developed countries without necessarily having reached the topvalues of the composite indices.
C. Human Assets Index (HAI)
14. The Expert Group agreed that human capital status should con-tinue to be reflected in the HAI by four indicators: (a) nutrition , meas-ured by the average calorie consumption per capita as a percentage of the minimum requirement; (b) health , measured by the under-five child

8/14/2019 Local Development and Global Issues
http://slidepdf.com/reader/full/local-development-and-global-issues 55/82
44 T H E C D P R E P O R T 2 0 0 3
mortality rate; (c) education , measured by the gross secondary schoolenrolment ratio and by the adult literacy rate.
15. As far as the nutrition indicator is concerned, the Group support-ed previous Committee decisions — endorsed by the Council — to con-tinue to use data on average calorie consumption per capita as a per-centage of the minimum calorie requirement. It was recalled, however,that, as part of efforts to implement the goals of the UN Millennium
Declaration, FAO was expected to improve the quality and coverage of data on the percentage of population undernourished and that these datacould be used in calculating HAI scores in future triennial reviews. Therelationship between the proportion of population undernourished andthe calorie intake as a percentage of requirement, found for LDCs andother low-income countries for which both sets of data are available,validated the practice of the Committee to use the logarithm of the calo-rie intake indicator instead of its gross value (see appendix II, table 2and figure 1).
16. The Expert Group also supported maintaining the under-five childmortality rate, as data in that regard were more reliable than the data forlife expectancy at birth. For cases of graduation, other health indicatorscould be considered to complement the under-five child mortality rateindicator. As suggested by the Committee at its fourth session, this isparticularly relevant to countries where HIV/AIDS has significantlyreduced life expectancy.
17. With regard to the two education-related indicators, it was furtheragreed that, since historical progress in primary schooling is reflectedby the adult literacy rate, the primary school enrolment ratio should bedropped from the HAI. The Group concurred that the gross secondaryschool enrolment ratio would be a better indicator of the level of edu-cation than the combined primary and secondary school enrolment ratioused in the 2000 triennial review.
18. According to the agreed threshold guidelines, the cut-off point forinclusion in the list of least developed countries under this index wouldbe the value between the sixteenth and seventeenth highest scores in thelist of 65 candidate countries (see appendix II, table 3 and figure 2). TheExpert Group thus proposed that the inclusion threshold be a value of

8/14/2019 Local Development and Global Issues
http://slidepdf.com/reader/full/local-development-and-global-issues 56/82
55. The 48 countries with an HAI score under 55 would thus be con-sidered for inclusion in the list under this index. Conversely, applyingthe 10 per cent margin, the threshold for graduation under this indexwould be 61. Nine countries had an HAI score above this value.
D. Economic vulnerability index (EVI)
19. Vulnerability, even from a purely economic point of view, cantake a variety of forms. It was recalled that, for the purpose of identify-ing LDCs, the vulnerability that should be considered is the relative risk to a country's development posed by exogeneous shocks. The extent towhich a country would be affected by such shocks depends on the struc-tural characteristics of its economy. The economic vulnerability index(EVI) should therefore be such as to reflect this structural vulnerability.
20. In its previous consideration of this matter, the Committee identi-fied two main types of exogenous shocks: those emanating from exter-nal economic developments and those related to natural causes. Theproxies chosen to reflect these shocks — endorsed by the Council —were the instability of the exports of goods and services, the degree of merchandise export concentration and the instability of agricultural pro-duction. It was also previously agreed that the structural factors deter-mining the extent of the exposure to these shocks should be represent-
ed by the share of manufacturing and modern services in GDP and thesize of the population. The Expert Group agreed that these previousdecisions should be maintained, namely that EVI should continue to bean average of five indicators: (a) merchandise export concentration; (b)instability of export earnings; (c) instability of agricultural production;(d) share of manufacturing and modern services in GDP; and (e) popu-lation size.
21. With regard to export concentration, the Expert Group recalledthe recommendation of the Committee at its fourth session f that, for the2003 triennial review, the EVI should be recalculated to include con-centration of exports of services in addition to concentration of exports
45L O C A L D E V E L O P M E N T A N D G L O B A L I S S U E S
f See Capacity-building in Africa: Effective aid and human capital. Report of the Committee for Development Policy on the fourth session (8-12 April 2002), (UnitedNations publications, Sales No. E.02.II.A.4), para 139.

8/14/2019 Local Development and Global Issues
http://slidepdf.com/reader/full/local-development-and-global-issues 57/82
of goods, but noted that such data for exports of services were not yetavailable because of methodological problems. It was also noted that theconstruction and interpretation of this indicator would be difficult.However, the present indicator appeared to be particularly high for oil-exporting countries, which are not the most vulnerable countries amongprimary producers. The Expert Group agreed to use the traditional mer-chandise export concentration coefficient for the present review, but sug-
gested that this indicator should be refined or replaced for the next review.22. Regarding the instability of exports of goods and services, theGroup stressed the need to take into account fluctuations in the pur-chasing power of exports. Therefore, export earnings in current dollars(based on International Monetary Fund (IMF) balance-of-payments sta-tistics) should continue to be deflated by the unit value of imports of developing countries, as reported by IMF.
23. The Group examined whether a more direct measure of the eco-nomic impact of natural disasters, such as number of people displacedor economic damage caused by such disasters, could be introduced intothe EVI. The Group agreed that the quality of comparable data on thenumber of people displaced by natural disasters had improved signifi-cantly. It was thus recommended that the Committee consider includingthis information as a sixth component of the EVI in order to supplementthe information on the instability of agricultural production. In themeantime, if reliable data became available for countries that are beingconsidered for graduation, it was agreed that their country profiles couldinclude data on the number of people displaced by natural disasters andon their economic impacts.
24. It was also stressed that the services category used in the fourthindicator (share of manufacturing and modern services in GDP) shouldcontinue to be broader than in the conventional definition. The inclusionof transport and communications in this indicator is aimed at reflectingthe importance of infrastructure in the modern economy. Due to the sen-sitivity of this indicator to the year of observation and its statistical het-erogeneity, it was suggested that it could be revised, or even replaced,in the future by a less ambiguous indicator of the structural factors thatdetermine the capacity to withstand external shocks.
46 T H E C D P R E P O R T 2 0 0 3
8/14/2019 Local Development and Global Issues
http://slidepdf.com/reader/full/local-development-and-global-issues 58/82
47L O C A L D E V E L O P M E N T A N D G L O B A L I S S U E S
25. With regard to maintaining population size as a component of theEVI, it was agreed that small countries tend to be more vulnerable toexternal shocks than large ones because (a) their economies are usuallymore open to external trade and (b) their exports tend to be highly con-centrated due to their limited scope for diversification. Size of popula-tion is, therefore, one of the most important proxies for overall eco-nomic vulnerability. It was also stressed that some small island devel-
oping States (SIDS) face a series of structural handicaps — such as highinternational transportation costs and relative isolation from main mar-kets – that make them particularly vulnerable to external shocks. Forthat reason, it was suggested that the remoteness of countries might betaken into consideration in future reviews.
26. EVI scores for 64 least developed and low-income countries areshown in table 4 of appendix II. In this candidate list of 64 countries, thecut-off point for inclusion in the list would be the value of the sixteenthlowest score. The Expert Group thus proposed that the inclusion thresh-old be established at 37 (see appendix II, table 4). The 49 countries withan EVI score of 37 or higher would thus be considered for inclusion inthe list under this index. Given the 10 per cent margin, an EVI score forgraduation under this index would be 33 or smaller; 11 countries sur-passed this threshold.
27. With the addition of a sixth component — percentage of popula-tion displaced by natural disasters — the cut-off point for inclusionwould be 38 (see appendix II, table 4). The 49 countries with an EVIscore of 38 or higher would meet the criteria for inclusion in the listunder this six-component index. Conversely, 12 countries with an EVIscore of 34 or less would be considered for graduation under this index.
III. Countries with economies in transition
28. The Expert Group examined the situation of countries in EasternEurope and those in Central Asia that became independent States in theearly 1990s for the review of the list of least developed countries. Ninecountries of these economies in transition (EITs) have been classified aslow-income countries by the World Bank in at least one of the years1999-2001, namely Armenia, Azerbaijan, Georgia, Kyrgyzstan, the

8/14/2019 Local Development and Global Issues
http://slidepdf.com/reader/full/local-development-and-global-issues 59/82
48 T H E C D P R E P O R T 2 0 0 3
Republic of Moldova, Tajikistan, Turkmenistan, Ukraine andUzbekistan. During the period 1990-2000, GDP per capita fell by over50 per cent in each of these countries and fell by over 80 per cent in theRepublic of Moldova and Tajikistan. In 2000, it ranged from US$ 163in Tajikistan to US$ 930 in Uzbekistan.
29. Owing to the major political and economic changes that took place during their transition to market economies, these countries suf-
fered deep recessions in their early years. The data show that the three-year average GNI per capita is within the threshold for inclusion in eightof the nine low-income economies in transition (EITs) (see appendix II,table 1). Similarly, seven of these countries would also be eligible forinclusion under the EVI criterion (see appendix II, table 4). However, asformer socialist states or republics, they still have high HAI scores dueto past social policies (see box below). This group of nine EITs hasamong the 13 highest HAI scores in an expanded set of 74 least devel-oped and low-income countries (see appendix II, table 3). As a result,they do not meet all three criteria for inclusion in the list of least devel-oped countries.
30. The Expert Group agreed that considering EITs for inclusion inthe 2003 triennial review of the list of least developed countries wouldalso create distortions in the establishment of HAI thresholds for inclu-sion and graduation. It was recalled, however, that the economic declinein these countries had lasted longer than was expected. It was also notedthat a few of these countries now have lower GNI per capita than manycurrent least developed countries. If the economies of these low-incomeEITs do not improve in the near future, erosions of social progress maybe difficult to reverse, leading to a possible lowering of their HAIs. TheExpert Group thus emphasized the importance of monitoring theeconomies in transition with low incomes and decreasing HAI scores
for possible inclusion in the list of LDCs.
8/14/2019 Local Development and Global Issues
http://slidepdf.com/reader/full/local-development-and-global-issues 60/82
49L O C A L D E V E L O P M E N T A N D G L O B A L I S S U E S
The state of human resources in the economies in transition
In order to evaluate the state of human resources in the low-income transitioncountries, the four indicators that are used to construct the HAI were compiled.Based on the inclusion threshold for this index established for the 2003 trienni-
al review (that is, an HAI score of 55), none of the low-income EITs would meet thiscriterion for inclusion in the list of LDCs (see table at the end of this box).
A comparison based on individual indicators was then conducted. The valuesof indicators for the low-income transition countries were compared against thethreshold determined by the highest (lowest in case of the under-five child mortalityrates) quartile for all low-income countries (a procedure corresponding to that usedfor inclusion in the LDC list). The values for the calorie intake as percentage of theminimum requirement fall below the threshold for five countries. For the remainingthree HAI indicators, all the values for the nine transition countries fall outside thelowest (highest in case of the under-five child mortality rates) three quartiles. It isnoteworthy, however, that the gross secondary enrolment ratios deteriorated in sixout of nine countries and remained constant in one between 1990 and 2000.Tajikistan reported the largest fall, of above 25 per cent.
A relatively high stock of human assets was accumulated in EITs when therewere comprehensive state systems for the provision of social services and protec-tion. However, following the collapse of the previous administrative system, healthand education indicators worsened, as some of the fiscal adjustment made in EITsinvolved large cuts in social expenditure. Public spending on health and education,both as a percentage of GDP and in per capita terms, decreased substantially in allnine EITs between 1990 and 1999. Poverty increased due to the collapse in output,but also because of accelerated inflation, which disproportionately affected the poorand undermined the real value of pensions and savings deposits. For example, morethan 80 per cent of the population in Tajikistan and the Republic of Moldova wasreported to be below the national poverty line in 1999, as compared to 59 and 13 per
cent respectively in 1988.a
The low-income countries with economies in transition rank high in terms ofeconomic vulnerability but have relatively high stocks of human assets, accumulated
a International Monetary Fund and World Bank, “Poverty reduction, growth and debtsustainability in low-income CIS countries”, 4 February 2002. Available athttp://www.imf.org/external/np/eu2/2002/edebt/eng.

8/14/2019 Local Development and Global Issues
http://slidepdf.com/reader/full/local-development-and-global-issues 61/82
50 T H E C D P R E P O R T 2 0 0 3
IV. Eligibility for inclusion and graduation
A. Additions to the list
(a) Timor-Leste
31. Timor-Leste — a State Member of the United Nations sinceSeptember 2002 — appears to be the only additional country eligiblefor inclusion in the list. It has one of the lowest levels of income percapita amongst the 65 countries under consideration, as well as a lowsecondary school enrolment ratio and a low literacy rate. Confirmationof this recommendation will, however, require further research, particu-
before the transition. The break-up of the former Soviet Union, however, causedmajor structural changes and significantly altered the economic well-being of someof the new countries. Health and economic indicators have deteriorated in most EITs,and poverty and income inequality have increased in many of these countries. Long-term prospects are thus a matter of concern, given the decreasing social spendingexperienced in most EITs.
CalorieGross intake as Under-5
secondary % of child Adultenrollment requirement mortality literacy HAI
Armenia 89.6 120.5 18.0 98.4 79.2
Azerbaijan 80.2 113.5 40.0 97.0 72.7Georgia 77.7 119.6 21.8 99.0 76.0Kyrgyzstan 83.0 131.1 46.0 97.0 77.4Moldova 80.5 137.9 25.3 98.9 80.9Tajikistan 76.0 114.9 76.3 99.2 69.4Turkmenistan 112.0 138.6 67.7 98.0 84.3Ukraine 92.8 144.4 19.3 99.6 86.0Uzbekistan 94.2 134.9 51.8 99.2 81.1
HUMAN ASSETS INDEX (HAI) AND ITS COMPONENTS FORLOW-INCOME ECONOMIES IN TRANSITION
Source: World Bank,World Development Indicators 2002,and UNESCO, see relevantinformation available at <www.unesco.org>.

8/14/2019 Local Development and Global Issues
http://slidepdf.com/reader/full/local-development-and-global-issues 62/82
51L O C A L D E V E L O P M E N T A N D G L O B A L I S S U E S
larly the collection and verification of comparable data for HAI compo-nents. The lack of historical data for the calculation of its EVI score willalso need to be carefully considered by the Committee. A recent prece-dent for inclusion of a newly independent state in the list, followingsecession, was Eritrea.
(b) Congo
32. Congo meets the criteria for inclusion in the list with regard toboth GNI per capita and the EVI. Its HAI score (55.2) is above thethreshold for inclusion (55 or lower). The Expert Group also recalledthat Congo met all three criteria for inclusion in the 2000 triennialreview. However, the recent decline in the economic and social indica-tors of the country had been associated with civil war and, pending clar-ification of their longer-term evolution, was considered to be a tempo-rary (rather than a structural) phenomenon.
B. Candidates for future graduation
33. In keeping with the rule whereby a country qualifies for gradua-tion if it meets at least two graduation criteria in two consecutivereviews of the list, the Committee should consider whether the follow-ing three countries should be designated as candidates for graduation if they qualify again in the 2006 review.
(a) Kiribati
34. With a three-year average GNI per capita of US$ 923, Kiribati is just above the graduation threshold (US$ 900) for that criterion. Thecountry also meets the HAI criterion with the fifth highest HAI scoreamong the list of candidate countries. It could therefore be identifiedduring the 2003 review as a candidate for future graduation. However,
the country ranks as the second most vulnerable country according tothe EVI and this considerably offsets the benefits of its HAI; combiningthe index of its human assets with its high vulnerability places it in themost “disadvantaged” quartile of the 64 countries. Given that Kiribati ison the borderline for the GNI threshold and is among the most vulner-able among the least developed and other low-income countries, theCommittee may wish not to identify Kiribati as a candidate for future

8/14/2019 Local Development and Global Issues
http://slidepdf.com/reader/full/local-development-and-global-issues 63/82
52 T H E C D P R E P O R T 2 0 0 3
graduation. A vulnerability profile of this country should be preparedfor the 2006 review.
(b) Samoa
35. Samoa has the second highest average GNI per capita (US$1,447) amongst the 65 countries and it also has by far the highest levelof human assets among the 65 countries, with an HAI of 88.8. Samoacontinues to be economically vulnerable (as reflected in its EVI of 40.9), but not among the most vulnerable — it ranks 42 under this cri-terion. Combining its HAI and EVI suggests that it is among the lessseverely disadvantaged of the candidate countries.
36. Samoa became a candidate for graduation in the 1997 review, butit became ineligible in 2000 because its GDP per capita no longer metthe graduation criterion. Given the significant improvement in its GNIper capita and HAI, the Expert Group agreed that it should become acandidate whose graduation should be considered in the 2006 review.
(c) Tuvalu
37. Despite the absence of consistent GNI per capita data for the1999-2001 period for Tuvalu, its GDP per capita is well above the grad-uation threshold. With the sixth highest HAI score amongst the 65 coun-tries, the country also meets the human assets criterion for graduation.
However, Tuvalu, with the lowest population among the least developedcountries (10,500), ranks as the most vulnerable country under the EVIcriterion, with or without the sixth component. The Committee may,therefore, wish to give special consideration to Tuvalu — particularly if no reliable data on GNI per capita become available for the triennialreview — and not identify it as a candidate for future graduation at thepresent time.
C. Countries that qualify for graduation
38. The Expert Group found that two countries — Cape Verde andMaldives — had met two graduation criteria for a third consecutivetime. It was, therefore, agreed that these two countries qualify for grad-uation in 2003.

8/14/2019 Local Development and Global Issues
http://slidepdf.com/reader/full/local-development-and-global-issues 64/82
53L O C A L D E V E L O P M E N T A N D G L O B A L I S S U E S
(a) Cape Verde
39. In 1997, the Committee had identified Cape Verde as a graduationcandidate for the following review, as it met two graduation criteria(income per capita and human assets) at that time. The 2000 review con-firmed that Cape Verde had met these two graduation criteria and qual-ified for graduation. However, it ranked as one of the most vulnerabledeveloping countries according to the EVI. Because of its high eco-
nomic vulnerability and the high dependency of the country on foreignaid and workers’ remittances, the Committee recommended that thegraduation of Cape Verde from the list of least developed countries bepostponed for reconsideration at the 2003 triennial review.
40. Cape Verde has the fourth highest GNI per capita (US$ 1,323)among the 65 countries, well above the threshold for graduation. It alsohas the fourth highest HAI score amongst these countries, which is also
well above the graduation threshold. In contrast, according to its EVI(55.5), it is the eleventh most economically vulnerable of the candidatecountries (or the seventh most vulnerable with the inclusion of a sixthcomponent). Nevertheless, given that the country meets two of the threegraduation criteria — and that it has been a graduation candidate inthree consecutive triennial reviews – the Expert Group agreed that itqualifies for graduation from the list.
(b) Maldives41. The Economic and Social Council, in resolution 2002/36, request-ed the Committee to continue its work on the re-examination of its rec-ommendation to graduate Maldives from the list of least developedcountries at its fifth session and to submit its recommendations to theCouncil at its substantive session of 2003 in the context of the triennialreview of the list of least developed countries, taking into account the
information referred to in the resolution and further information to beprovided by relevant development partners and multilateral organizations.
42. The Expert Group re-examined the recommendation of theCommittee — made in its 2000 triennial review — that Maldives begraduated from the list of least developed countries and that subsequentconsideration be given to the case of Maldives by the Committee in

8/14/2019 Local Development and Global Issues
http://slidepdf.com/reader/full/local-development-and-global-issues 65/82
2001 and 2002. The Group recalled that, in the 2000 review, the coun-try met two of the three graduation criteria: its income per capita andhuman capital scores were both well above the graduation threshold.
43. The information made available to the Expert Group during itsJanuary 2003 meeting supported the conclusion that Maldives onceagain qualifies for graduation. Its GNI per capita (almost US$ 2,000) isnot only the highest amongst the 65 countries but also more than twice
the graduation threshold. Its HAI score (63) ranks as the seventh high-est and is above the graduation threshold (61 or higher). Its EVI, how-ever, does not meet the graduation criterion. Given that Maldives meetsat least two graduation criteria (GNI and HAI) for a third consecutivetime, the Group agreed that the country qualified for graduation.
44. The Expert Group was informed of relevant data collected by theGovernment of Maldives — with the assistance of UNDP — pointing
to possible anomalies in the estimation of the HAI score of Maldives.There appear to be discrepancies with regard to the nutrition, schoolenrolment and under-five child mortality indicators. The Group ques-tioned these discrepancies and noted that the data used in the review arecollected on an internationally comparable basis by specialized agen-cies of the United Nations system, such as FAO, UNESCO and WHO.The Group recommended that the apparent discrepancies be examinedby these agencies before the triennial review is carried out.
45. The Group also addressed the issue of environmental vulnerabili-ty as elaborated in the 2000 vulnerability profile of Maldives and in doc-umentation submitted by the Government of Maldives to theCommittee. Particular attention was paid to the challenge Maldives mayface from climatic change and sea level rise. It was recalled that the sealevel rise implied population relocation and high infrastructural cost, aswell as high insurance cost, for which special assistance is deemed vitalto the country in the context of international cooperation.
46. The Group fully recognized that environmental vulnerabilitycould pose a serious problem for many small island developing States(SIDS), including Maldives. Such problems should, however, be con-sidered and dealt with primarily as a characteristic of SIDS — as dis-tinct from the structural problems that beset least developed countries.
54 T H E C D P R E P O R T 2 0 0 3

8/14/2019 Local Development and Global Issues
http://slidepdf.com/reader/full/local-development-and-global-issues 66/82
55L O C A L D E V E L O P M E N T A N D G L O B A L I S S U E S
The Expert Group was of the view that the task of identifying leastdeveloped countries should focus on economic and structural, asopposed to environmental, vulnerability.
47. The treatment of graduating countries by their bilateral and mul-tilateral partners — notably with regard to trade preferences — can bedecided upon only in international organizations, such as the WorldTrade Organization (WTO). The Expert Group noted that its role was to
assist in identifying which countries are eligible for graduation fromLDC status based on application of the criteria adopted by theCommittee and the Economic and Social Council. The decision onwhether the countries should be graduated is the responsibility of theCouncil and, ultimately, the General Assembly.
V. Smooth transition of countries graduating from leastdeveloped country status
48. The fact that a country that has long been recognized as “leastdeveloped” meets the criteria for graduation in two consecutive reviewsis an indication of some success in its development and in its ability toachieve a degree of structural change in its economy. These successes,in turn, are likely to have been largely attributable to a mix of sounddomestic policies and propitious external conditions. With regard to the
latter, international support has frequently played a central role and thecapacity to exploit world market opportunities may also have beenimportant. For those countries that currently qualify for graduation fromLDC status, the ability to integrate into and benefit from the interna-tional tourism market has made an important contribution to the growthof national income.
49. The international community has increasingly recognized notonly that, because of their structural weaknesses, LDCs require sub-stantial external support but also that, because progress is fragile, thissupport is likely to be needed for an extended period if development isto be sustained. Despite the progress they have achieved, countries thatqualify for graduation from LDC status are likely to continue to haveonly limited capacity to withstand external shocks. A sudden withdraw-al of external support is likely to constitute such a shock and to have
8/14/2019 Local Development and Global Issues
http://slidepdf.com/reader/full/local-development-and-global-issues 67/82
56 T H E C D P R E P O R T 2 0 0 3
negative effects, possibly reversing some of the development progressachieved. Countries that qualify for graduation from the LDC categoryshould be commended for their success and not penalized for it.
50. It was from this perspective that the Group recalled the impor-tance that the Committee has consistently attached to “smooth transi-tion” measures for graduating countries, as elaborated in the reports of its third and fourth sessions. g The Group noted that the Economic and
Social Council, in its resolution 2002/36, reiterated the importance of smooth transition, which it had emphasized in earlier resolutions(Council resolutions 2000/34 and 2001/43), in keeping with the obser-vation made in 1991 by the General Assembly in its resolution 46/206on the importance of ensuring that graduation from LDC status wouldnot disrupt the progress of relevant countries in their development path.They also recalled that, in the only case of graduation (Botswana in1994), the Government had stressed the desirability of smooth transitionmeasures.
51. The Group observed that, since 2000, the primary understandingof the notion of smooth transition had related to “post-graduation” con-cessionary measures. The international community had not paid atten-tion to “pre-graduation” transition policies or measures in favour of countries in the three-year period between the review when a country isfound to be a candidate for graduation and the subsequent review whenits qualification for graduation is confirmed. The Group was informedthat the least developed countries that were candidates for graduationregarded smooth transition as a paramount element of the graduationprocess.
52. Bearing in mind that all candidate countries are small islanddeveloping States (SIDS), the question of smooth transition was recog-nized by the Group as being only one particular aspect of wider consid-erations relating to the special treatment of SIDS. This wider consider-
g See Participatory Development and Governance: Africa’s Special Needs. Report of the Committee for Development Polcicy on the third session (2-6 April 2001) (UnitedNations publication, Sales No. E.01.II.A.4), paras. 114-117. See alsoCapacity-building in Africa: Effective aid an human capital. Report of the Committee for Development Policy on the fourth session (8-12 April 2002) (United Nations publication, Sales No.E.02.II.A.4), paras. 158-163.

8/14/2019 Local Development and Global Issues
http://slidepdf.com/reader/full/local-development-and-global-issues 68/82
ation, they noted, is likely to gain increased attention from the interna-tional community with the international meeting on the sustainabledevelopment of SIDS in 2004 (see General Assembly resolution57/262).
53. The Group therefore took the view that the Committee shouldurge the Council, in considering the questions of graduation and smoothtransition at its substantive session of 2003, to take into account the
progress to date or expected in the international community towards amore differentiated treatment of developing countries with special dis-advantages and vulnerabilities, such as SIDS. Greater differentiationcould take place, it was suggested, in the framework of current arrange-ments (such as special market access concessions), in the context of newtrade and related arrangements and through innovative modalities fordevelopment financing.
VI. Main recommendations and implications for inclusionand graduation
54. The Expert Group reiterated that the initial list of candidate coun-tries to be considered during the triennial review should be based on thegroup of countries identified by the World Bank as low-income in anyone of the three most recent years. The Group also recommended that
low-income countries in Eastern Europe and Central Asia should beamong those considered by the Committee, but they found that thesecountries’ comparatively advanced levels of human capital made themineligible to join the list of LDCs. At the same time, the Group empha-sized that economies in transition with very low incomes and deterio-rating human capital conditions should be monitored for possible inclu-sion in the list.
55. With regard to the GNI per capita criterion, it was recommendedthat the benchmark for inclusion be a three-year average GNI per capi-ta of less than US$ 750. As far as the threshold for graduation is con-cerned, the Expert Group recommended an increase from 15 to 20 percent above the cut-off point for inclusion. The threshold for graduationwould thus be an average GNI per capita of US$ 900.
57L O C A L D E V E L O P M E N T A N D G L O B A L I S S U E S

8/14/2019 Local Development and Global Issues
http://slidepdf.com/reader/full/local-development-and-global-issues 69/82
56. It was agreed that the threshold for inclusion with regard to boththe HAI and EVI criteria should be the border between the third andfourth quartiles of the list of 65 current least developed countries andother low-income countries. The Expert Group also recommended thatthe threshold margin between inclusion and graduation should bedecreased from 15 to 10 per cent with a view to drawing attention to thecountries whose position with regard to human capital and economic
vulnerability was much better than the majority of least developedcountries, without being necessarily at the top level of the indicator.
57. According to the data provided to the Expert Group, as a result of preliminary calculations, 48 countries had an HAI score under 55 andwould be considered for inclusion in the list under this index.Conversely, nine countries with an HAI score greater than 61 would beconsidered for graduation. EVI calculations had to be limited to 64 leastdeveloped and low-income countries as one Member State had to beexcluded due to a lack of the historical data required to calculate itsEVI. In this list of 64 countries, 49 countries with an EVI score of 37 orhigher would be considered for inclusion in the list and 11 countrieswith an EVI score under 33 would be considered for graduation underthis index.
58. Applying the agreed criteria to the data available to the Group, theimplications for the list of least developed countries would be as fol-lows: (a) Timor-Leste would qualify for inclusion in the list of LDCs;(b) Samoa would become a candidate to be considered for graduation in2006 and, depending on a number of considerations that required the
judgement of the Committee, Kiribati and Tuvalu could be candidatesand (c) Cape Verde and Maldives would again qualify for graduation.No other countries appeared to be eligible for inclusion or graduationaccording to the criteria.
58 T H E C D P R E P O R T 2 0 0 3

8/14/2019 Local Development and Global Issues
http://slidepdf.com/reader/full/local-development-and-global-issues 70/82
59L O C A L D E V E L O P M E N T A N D G L O B A L I S S U E S
Appendix I
Agenda and List of Participants
Agenda of the Expert Group Meeting on the Identification of theLeast Developed Countries
New York, 23-24 January 2003
1. Adoption of the agenda and organization of work.2. Criteria for the identification of the least developed countries
(a) Gross National Income (GNI) per capita(b) Issues common to the composite indices(c) Human Assets Index (HAI)(d) Economic Vulnerability Index (EVI)
3. Countries with economies in transition
4. Eligibility for inclusion and graduation5. Smooth transition of countries graduating from least developed
country status6. Other issues
List of Participants
ExpertsMr. Patrick GUILLAUMONT, Chairman of the Expert GroupMr. Olav BJERKHOLTMr. P. Jayendra NAYAKMr. Milivoje PANICMs. Suchitra PUNYARATABANDHUMs. Funmi TOGONU-BICKERSTETH
Staff of the United Nations Secretariat
Ms. Dominika HALKAMr. Ian KINNIBURGHMr. Frederico NETOMr. Anatoly SMYSHLYAEV
Staff of the United Nations Conference on Trade and Development Mr. Pierre ENCONTRE

8/14/2019 Local Development and Global Issues
http://slidepdf.com/reader/full/local-development-and-global-issues 71/82
Appendix II
Figures
60 T H E C D P R E P O R T 2 0 0 3
Figure 1.RELATIONSHIP BETWEEN CALORIE INTAKE AND
UNDERNOURISHMENT IN 50 LEAST DEVELOPED
AND LOW-INCOME COUNTRIES
0
20
40
60
80
1.9 1.95 2 2.05 2.1 2.15 2.2 2.25Calorie intake as percentage of minimum requirement (in logarithms)
U n
d e r n o u r i s
h e
d a s p e r c e n
t a g e o
f p o p u
l a t i o n

8/14/2019 Local Development and Global Issues
http://slidepdf.com/reader/full/local-development-and-global-issues 72/82
61L O C A L D E V E L O P M E N T A N D G L O B A L I S S U E S
Figure 2.HUMAN ASSETS INDEX (HAI) FOR 65 LEASTDEVELOPED AND LOW-INCOME COUNTRIES
0
20
40
60
80
100
0 10 20 30 40 50 60 70Countries (ordered according to HAI values)
H A I
6155

8/14/2019 Local Development and Global Issues
http://slidepdf.com/reader/full/local-development-and-global-issues 73/82
Tables
62 T H E C D P R E P O R T 2 0 0 3
A. Developing countries
LI L Dem. Republic of the Congo 100 LI L Benin 367LI L Ethiopia 100 LI L Mauritania 377LI L Burundi 110 LI L Comoros 387LI L Sierra Leone 130 LI Viet Nam 390LI L Guinea-Bissau 170 LI Mongolia 393LI L Somalia 177 LI Nicaragua 395LI L Malawi 177 LI L Yemen 423LI L Niger 180 LI Pakistan 437LI L Eritrea 190 LI Dem. Peo. Rep. of Korea 440LI L Chad 203 LI L Angola 447LI L Burkina Faso 217 LI L Guinea 447LI L Mozambique 220 LI India 450LI L Mali 230 LI Zimbabwe 463LI L Rwanda 230 LI Timor-Leste 478LI L Nepal 240 LI L Senegal 490LI L Madagascar 253 LI L Haiti 493LI L Cambodia 263 LI L Afghanistan 523LI L United Rep. of Tanzania, 263 LI L Lesotho 573LI Nigeria 267 LI Cameroon 583LI L Central African Republic 277 LI L Bhutan 600LI L Sao Tome and Principe 280 LI Congo 610LI L Myanmar 282 LI Indonesia 610LI L Liberia 285 LI L Solomon Islands 657LI L Togo 293 LI Papua New Guinea 673LI L Lao People's Democratic Republic 297 LI Cote d'Ivoire 687LI L Uganda 297 LI L Equatorial Guinea 743LI L Zambia 317 L Djibouti 873
LI L Sudan 333 L Kiribati 923LI Ghana 337 L Vanuatu 1083LI L Gambia 340 L Cape Verde 1323LI Kenya 350 L Tuvalu 1383LI L Bangladesh 363 L Samoa 1447
L Maldives 1983
Average 1999-2001
Table 1GNI PER CAPITA FOR LEAST DEVELOPED ANDLOW-INCOME COUNTRIES

8/14/2019 Local Development and Global Issues
http://slidepdf.com/reader/full/local-development-and-global-issues 74/82
63L O C A L D E V E L O P M E N T A N D G L O B A L I S S U E S
B. Economies in transition
LI Tajikistan 173 LI Uzbekistan 607LI Kyrgyzstan 287 LI Georgia 647LI Republic of Moldova 397 LI Ukraine 723LI Armenia 523 LI Turkmenistan 780LI Azerbaijan 607
Average 1999-2001
Note: LI: Low-income country; L: Least developed country.
Table 1 (continued)

8/14/2019 Local Development and Global Issues
http://slidepdf.com/reader/full/local-development-and-global-issues 75/82
64 T H E C D P R E P O R T 2 0 0 3
Calorie Undernourishedintake as as % of
% of reqirement population
LI L Afghanistan 89 70LI L Angola 110 43LI L Bangladesh 115 38LI L Benin 142 14LI L Burkina Faso 119 32LI L Burundi 92 68LI L Cambodia 117 33LI Cameroon 118 29LI L Central African Republic 111 41
LI L Chad 114 38LI Congo 119 32LI Cote d'Ivoire 142 14LI Dem Peo Rep of Korea 98 57LI L Dem Rep of the Congo 96 61LI L Eritrea 94 65LI L Ethiopia 105 49LI L Gambia 136 16LI Ghana 146 10
LI L Guinea 126 29LI L Haiti 95 62LI India 136 21LI Indonesia 157 6LI Kenya 108 43LI L Lao People's Democratic Republic 124 29LI L Lesotho 120 29LI L Liberia 110 46LI L Madagascar 112 40
LI L Malawi 121 32LI L Mali 119 32LI L Mauritania 143 13LI Mongolia 107 45LI L Mozambique 98 58LI L Myanmar 155 7LI L Nepal 122 28LI Nicaragua 122 31
Table 2INDICATORS OF HUNGER IN LEAST DEVELOPED ANDLOW-INCOME COUNTRIES a

8/14/2019 Local Development and Global Issues
http://slidepdf.com/reader/full/local-development-and-global-issues 76/82
65L O C A L D E V E L O P M E N T A N D G L O B A L I S S U E S
Calorie Undernourishedintake as as % of
% of requirement population
LI L Niger 108 46LI Nigeria 151 8LI Pakistan 138 20LI L Rwanda 115 39LI L Senegal 125 23LI L Sierra Leone 113 43LI L Somalia 85 75LI L Sudan 132 18LI L Togo 135 18
LI L Uganda 120 30LI L United Rep. of Tanzania 111 41LI Viet Nam 134 22LI L Yemen 116 35LI L Zambia 108 45LI Zimbabwe 116 37
a Data on percentage of undernourished population are available for only 50 least developedand other low-income countries.
Table 2 (continued)

8/14/2019 Local Development and Global Issues
http://slidepdf.com/reader/full/local-development-and-global-issues 77/82
66 T H E C D P R E P O R T 2 0 0 3
Secondary Calorie Under-5enrolment intake mortality Literacy
ratio as % req. (per 1000) rate1999/2000 1998 2000-2005 2000
values values values values HAI
A. Developing countriesLI L Somalia 5.7 85.2 186.0 16.0 8.5LI L Afghanistan 22.1 89.0 279.2 37.3 11.6LI L Niger 6.5 107.8 209.9 16.0 14.2LI L Burundi 7.1 91.6 197.9 48.0 19.7LI L Mali 15.0 118.8 235.6 25.6 19.9LI L Mozambique 13.9 98.4 224.2 44.0 20.0LI L Sierra Leone 23.9 112.6 254.3 36.3 21.7LI L Ethiopia 17.0 105.1 182.9 39.1 25.2LI L Angola 15.5 110.4 201.4 42.0 25.6LI L Chad 11.5 113.7 198.3 42.6 26.1LI L Burkina Faso 10.0 119.3 146.3 23.9 26.5LI L Central African Republic 9.6 111.1 156.5 46.7 29.9
L Djibouti 14.7 104.4 202.3 64.6 30.2LI L Guinea 13.8 126.2 189.5 41.1 30.3LI L Guinea-Bissau 20.4 133.5 207.8 38.4 31.2LI L Eritrea 28.2 93.8 141.9 55.7 32.8LI L Gambia 27.0 136.2 195.5 36.6 34.0LI L Rwanda 12.1 115.3 196.0 66.8 34.1LI L Dem. Rep. of the Congo 18.4 96.2 127.9 61.4 34.3LI L Haiti 29.3 95.3 103.7 49.8 35.3LI Timor-Leste 38.0 110.0 159.0 48.0 36.4LI L Madagascar 14.3 111.7 147.0 66.5 37.9LI L Comoros 20.6 101.1 92.0 55.9 38.1LI L Senegal 19.5 125.1 104.7 37.4 38.1LI L Mauritania 18.4 142.9 156.4 40.2 38.2
LI L Liberia 22.5 109.9 111.9 53.5 38.7LI L Malawi 45.2 121.2 223.8 60.1 39.0LI L Uganda 16.1 120.2 159.4 67.0 39.8LI L Benin 21.8 141.9 132.3 37.4 40.2LI L Bhutan 9.9 122.9 80.0 47.3 40.4LI L United Rep. of Tanzania 5.7 111.1 116.6 75.0 41.1LI Côte d'Ivoire 21.7 141.8 137.7 48.6 43.0
Table 3HUMAN ASSETS INDEX (HAI) AND ITS COMPONENTS FOR LEASTDEVELOPED AND LOW-INCOME COUNTRIES a
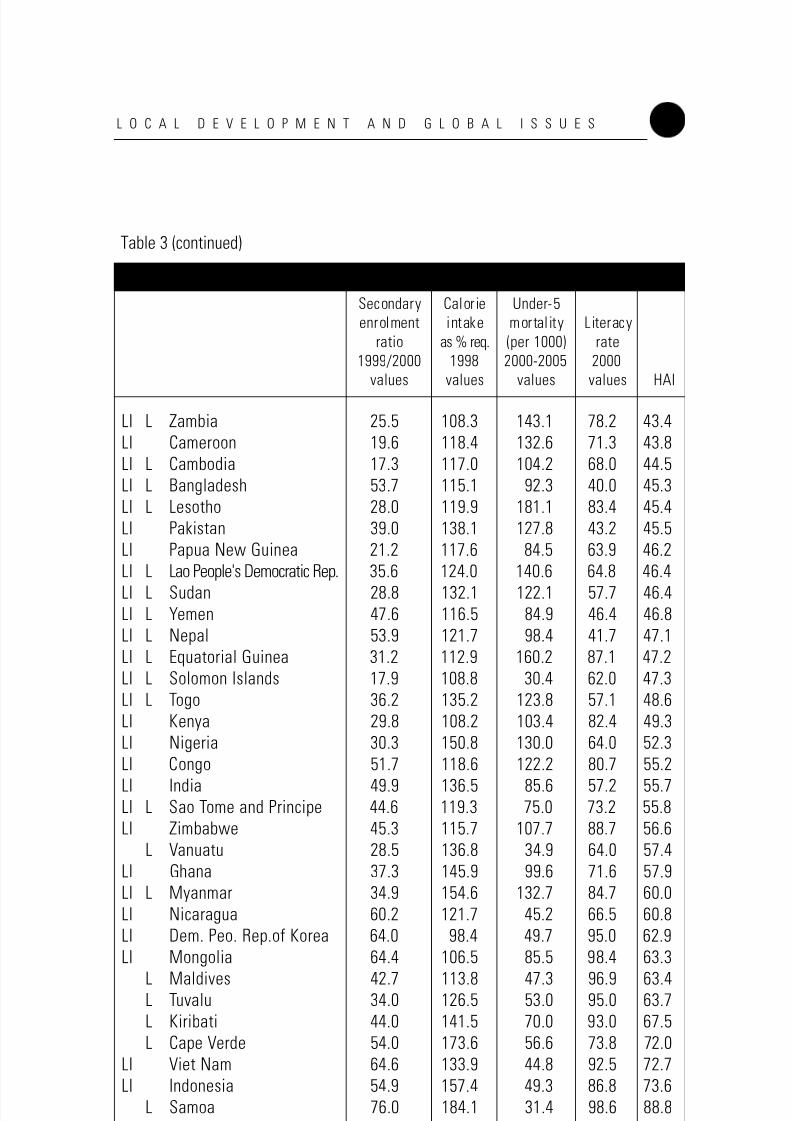
8/14/2019 Local Development and Global Issues
http://slidepdf.com/reader/full/local-development-and-global-issues 78/82
67L O C A L D E V E L O P M E N T A N D G L O B A L I S S U E S
Secondary Calorie Under-5enrolment intake mortality Literacy
ratio as % req. (per 1000) rate1999/2000 1998 2000-2005 2000
values values values values HAI
LI L Zambia 25.5 108.3 143.1 78.2 43.4LI Cameroon 19.6 118.4 132.6 71.3 43.8LI L Cambodia 17.3 117.0 104.2 68.0 44.5LI L Bangladesh 53.7 115.1 92.3 40.0 45.3LI L Lesotho 28.0 119.9 181.1 83.4 45.4LI Pakistan 39.0 138.1 127.8 43.2 45.5LI Papua New Guinea 21.2 117.6 84.5 63.9 46.2LI L Lao People's Democratic Rep. 35.6 124.0 140.6 64.8 46.4LI L Sudan 28.8 132.1 122.1 57.7 46.4LI L Yemen 47.6 116.5 84.9 46.4 46.8LI L Nepal 53.9 121.7 98.4 41.7 47.1LI L Equatorial Guinea 31.2 112.9 160.2 87.1 47.2LI L Solomon Islands 17.9 108.8 30.4 62.0 47.3LI L Togo 36.2 135.2 123.8 57.1 48.6LI Kenya 29.8 108.2 103.4 82.4 49.3LI Nigeria 30.3 150.8 130.0 64.0 52.3LI Congo 51.7 118.6 122.2 80.7 55.2
LI India 49.9 136.5 85.6 57.2 55.7LI L Sao Tome and Principe 44.6 119.3 75.0 73.2 55.8LI Zimbabwe 45.3 115.7 107.7 88.7 56.6
L Vanuatu 28.5 136.8 34.9 64.0 57.4LI Ghana 37.3 145.9 99.6 71.6 57.9LI L Myanmar 34.9 154.6 132.7 84.7 60.0LI Nicaragua 60.2 121.7 45.2 66.5 60.8LI Dem. Peo. Rep.of Korea 64.0 98.4 49.7 95.0 62.9LI Mongolia 64.4 106.5 85.5 98.4 63.3
L Maldives 42.7 113.8 47.3 96.9 63.4L Tuvalu 34.0 126.5 53.0 95.0 63.7L Kiribati 44.0 141.5 70.0 93.0 67.5L Cape Verde 54.0 173.6 56.6 73.8 72.0
LI Viet Nam 64.6 133.9 44.8 92.5 72.7LI Indonesia 54.9 157.4 49.3 86.8 73.6
L Samoa 76.0 184.1 31.4 98.6 88.8
Table 3 (continued)

8/14/2019 Local Development and Global Issues
http://slidepdf.com/reader/full/local-development-and-global-issues 79/82
68 T H E C D P R E P O R T 2 0 0 3
Secondary Calorie Under-5enrolment intake mortality Literacy
ratio as % req. (per 1000) rate1999/2000 1998 2000-2005 2000
values values values values HAI
B. Economies in transitionLI Tajikistan 76.0 114.9 76.3 99.2 69.5LI Azerbaijan 80.2 113.5 40.0 97.0 72.8LI Georgia 77.7 119.6 21.8 99.0 76.2LI Kyrgyzstan 83.0 131.1 46.0 97.0 77.6LI Armenia 89.6 120.5 18.0 98.4 79.4LI Moldova 80.5 137.9 25.3 98.9 81.1LI Uzbekistan 94.2 134.9 51.8 99.2 81.3LI Turkmenistan 112.0 138.6 67.7 98.0 84.5LI Ukraine 92.8 144.4 19.3 99.6 86.3
a Countries in each panel are ordered according to values of HAI.
Table 3 (continued)

8/14/2019 Local Development and Global Issues
http://slidepdf.com/reader/full/local-development-and-global-issues 80/82
69L O C A L D E V E L O P M E N T A N D G L O B A L I S S U E S
EVI EVI with addition of variable forpopulation displaced by natural disasters
A. Developing countries
L Tuvalu 70.3 L Tuvalu 67.3L Kiribati 64.8 LI L Guinea-Bissau 60.7LIL Guinea-Bissau 64.6 L Kiribati 60.4
LI L Equatorial Guinea 64.4 LI L Rwanda 59.6LI L Rwanda 63.3 LI L Comoros 58.7LI L Liberia 63.1 LI L Liberia 58.3LI L Gambia 60.8 L Cape Verde 56.7LI L Chad 59.2 LI L Chad 56.6LI L Comoros 59.1 LI L Gambia 56.5LI L Benin 57.0 LI L Benin 56.4
L Cape Verde 55.5 LI L Equatorial Guinea 55.8LI L Somalia 55.4 LI L Niger 53.1LI L Niger 54.1 LI L Somalia 53.1LI L Burundi 53.8 LI Nigeria 51.1LI Nigeria 52.8 L Samoa 50.8LI L Eritrea 51.7 LI L Eritrea 50.2LI Congo 50.3 LI L Burundi 49.6LI L Afghanistan 50.1 L Djibouti 49.5
LI Mongolia 50.0 LI L Malawi 49.4LI L Cambodia 49.7 LI L Solomon Islands 49.1LI L Burkina Faso 49.3 LI L Yemen 49.0LI L Zambia 49.3 LI L Afghanistan 49.0LI L Yemen 49.1 LI Mongolia 48.9LI L Malawi 49.0 LI L Cambodia 48.1
L Djibouti 48.6 LI L Zambia 47.6LI L Angola 48.5 LI L Burkina Faso 47.0LI L Mali 47.5 LI L Angola 46.8
LI L Solomon Islands 46.7 LI Congo 46.8LI L Sierra Leone 45.7 LI L Sudan 46.5LI L Myanmar 45.4 L Vanuatu 46.4LI L Sudan 45.2 LI L Myanmar 45.6
L Vanuatu 44.5 LI L Mali 45.4LI L Lesotho 44.2 LI L Lesotho 44.5LI L Lao People's Democratic Rep. 43.9 LI L Haiti 43.5LI L Uganda 43.2 LI L Lao People's Democratic Rep. 43.4
Table 4ECONOMIC VULNERABILITY INDEX (EVI) FOR LEASTDEVELOPED AND LOW-INCOME COUNTRIES ab

8/14/2019 Local Development and Global Issues
http://slidepdf.com/reader/full/local-development-and-global-issues 81/82

8/14/2019 Local Development and Global Issues
http://slidepdf.com/reader/full/local-development-and-global-issues 82/82
71L O C A L D E V E L O P M E N T A N D G L O B A L I S S U E S
EVI EVI with addition of variable forpopulation displaced by natural disasters
B. Economies in transition
LI Turkmenistan 60.9 LI Turkmenistan 53.8LI Georgia 47.6 LI Georgia 48.2LI Uzbekistan 40.3 LI Azerbaijan 40.6LI Republic of Moldova 39.6 LI Kyrgyzstan 39.9LI Azerbaijan 38.9 LI Tajikistan 39.1LI Kyrgyzstan 38.2 LI Republic of Moldova 39.1LI Tajikistan 37.7 LI Uzbekistan 36.3LI Armenia 30.7 LI Armenia 34.0
LI Ukraine 23.8 LI Ukraine 26.1
Table 4 (continued)
a Excludes Timor-Leste due to the lack of historical data.b Countries in each panel are ordered according to the index values.