local climate change action plan
TRANSCRIPT


1 | P a g e

2 | P a g e
TABLE OF CONTENTS
MESSAGE ---------------------------------------------------------------------------------------------------------------- 1
TABLES AND FIGURES ------------------------------------------------------------------------------------------ 3
BACKGOUND AND RATIONALE-------------------------------------------------------------------------------------- 5
LEGAL MANDATE ------------------------------------------------------------------------------------------------------------- 5
THE CALOOCAN CITY CLIMATE CHANGE ACTION PLAN ------------------------------------------------------------ 5 GUIDING PRINCIPLES ---------------------------------------------------------------------------------------------------------------------- 5
CITY PROFILE------------------------------------------------------------------------------------------------------------------- 7 HISTORY --------------------------------------------------------------------------------------------------------------------------------------- 7 THE MAKING OF A CITY ------------------------------------------------------------------------------------------------------------------- 7 GEOGRAPHICAL LOCATION AND LAND AREA --------------------------------------------------------------------------------------- 8 TERRITORIAL COMPOSITION ------------------------------------------------------------------------------------------------------------ 9 TOPOGRAPHY ----------------------------------------------------------------------------------------------------------------------------- 12
South Caloocan ----------------------------------------------------------------------------------------------------------------------- 12 North Caloocan ----------------------------------------------------------------------------------------------------------------------- 12
GEOLOGY ----------------------------------------------------------------------------------------------------------------------------------- 12 Rock Formation ----------------------------------------------------------------------------------------------------------------------- 12
GEOMORPHOLOGY ---------------------------------------------------------------------------------------------------------------------- 17 Basic Soil Types ----------------------------------------------------------------------------------------------------------------------- 17 The Novaliches Series --------------------------------------------------------------------------------------------------------------- 17
NATURAL SURFACE DRAINAGE ------------------------------------------------------------------------------------------------------- 21 CLIMATE ------------------------------------------------------------------------------------------------------------------------------------ 23
Rainfall ---------------------------------------------------------------------------------------------------------------------------------- 24 Maximum Occurrence -------------------------------------------------------------------------------------------------------------- 24
WIND DIRECTION ------------------------------------------------------------------------------------------------------------------------- 25 South Caloocan ----------------------------------------------------------------------------------------------------------------------- 25 North Caloocan ----------------------------------------------------------------------------------------------------------------------- 25
POPULATION------------------------------------------------------------------------------------------------------------------------------- 26 Historical Growth --------------------------------------------------------------------------------------------------------------------- 26 Population Distribution ------------------------------------------------------------------------------------------------------------- 27 Household Population, Household Size And Population Density -------------------------------------------------------- 29 Age, Sex Composition --------------------------------------------------------------------------------------------------------------- 29 Household Population, Household Size and Population Density -------------------------------------------------------- 31
HOUSING ----------------------------------------------------------------------------------------------------------------------------------- 31 ECONOMIC DEVELOPMENT------------------------------------------------------------------------------------------------------------ 32 DEVELOPMENT TREND ------------------------------------------------------------------------------------------------------------------ 32
Development Growth --------------------------------------------------------------------------------------------------------------- 32 Development Potentials ------------------------------------------------------------------------------------------------------------ 34
THE LOCAL CLIMATE CHANGE ACTION PLANNING FRAMEWORK --------------------------------------------- 38 PLANNING CONTEXT AND APPROACH ---------------------------------------------------------------------------------------------- 38
Vision ------------------------------------------------------------------------------------------------------------------------------------ 38 Goals ------------------------------------------------------------------------------------------------------------------------------------- 38
VULNERABILITY AND ADAPTATION ASSESSMENT RESULTS ---------------------------------------------- 40
GEOLOGIC HAZARD ASSESSMENT ------------------------------------------------------------------------------------- 40 GEOHAZARDS ------------------------------------------------------------------------------------------------------------------------------ 40
Flooding --------------------------------------------------------------------------------------------------------------------------------- 40 Rain-Induced Landslide ------------------------------------------------------------------------------------------------------------- 44

3 | P a g e
Sea-level Rise and Land Subsidence --------------------------------------------------------------------------------------------- 44 PHILIPPINE GREENHOUSE GAS EMISSION ------------------------------------------------------------------------------------------ 47
Rating ------------------------------------------------------------------------------------------------------------------------------------ 47 Assessment----------------------------------------------------------------------------------------------------------------------------- 47 Green House Gas (GHG) Inventory ---------------------------------------------------------------------------------------------- 48 Caloocan City Green House Gas (GHG) Inventory --------------------------------------------------------------------------- 48
ELEMENTS, SECTORS AND INSTITUTIONS EXPOSED TO CLIMATE CHANGE HAZARDS -------------------- 49
VULNERABILITY AND CROSS-SECTORAL ANALYSIS ---------------------------------------------------------------- 60
LCCAP OBJECTIVES ---------------------------------------------------------------------------------------------------- 62
PROPOSED CLUP OUTPUT AND OUTCOME INDICATORS -------------------------------------------------------- 62
CLIMATE CHANGE ADATATION AND MITIGATION MEASURES ------------------------------------------ 67
ADAPTATION/ MITIGATION ACTIONS -------------------------------------------------------------------------------- 68
IDENTIFIED ADAPTATION/ MITIGATION OPTIONS ---------------------------------------------------------------- 71
CROSS-CUTTING STRATEGIES ------------------------------------------------------------------------------------------- 74 CAPACITY DEVELOPMENT -------------------------------------------------------------------------------------------------------------- 74
Strategic Priorities -------------------------------------------------------------------------------------------------------------------- 74 KNOWLEDGE MANAGEMENT AND INFORMATION, EDUCATION AND COMMUNICATION (IEC) -------------------- 75
Strategic Priorities -------------------------------------------------------------------------------------------------------------------- 75 RESEARCH DEVELOPMENT AND TECHNOLOGY TRANSFER -------------------------------------------------------------------- 75
BUDGETARY REQUIREMENTS ------------------------------------------------------------------------------------------- 75
MONITORING AND EVALUATION -------------------------------------------------------------------------------- 77
MEANS OF IMPLEMENTATION ------------------------------------------------------------------------------------------ 77
MONITORING AND EVALUATION OF THE FRAMEWORK --------------------------------------------------------- 77
REFERENCES AND ANNEXES --------------------------------------------------------------------------------------- 78
ABBREVIATIONS AND ACRONYMS ------------------------------------------------------------------------------------- 78
REFERENCES ----------------------------------------------------------------------------------------------------------------- 80
TABLES AND FIGURES
TABLES ------------------------------------------------------------------------------------- Error! Bookmark not defined. Table 1-01. Priorities and Outcomes -------------------------------------------------------------------------------------------------- 6 Table 1-02. List of Barangay Zones by Political District --------------------------------------------------------------------------- 9 Table 1-03. Land Area Distribution by Geology ----------------------------------------------------------------------------------- 17 Table 1-04. Land Area Distribution by Soil ----------------------------------------------------------------------------------------- 17 Table 1-05. Soil Characteristics ------------------------------------------------------------------------------------------------------- 18 Table 1-06. River Systems -------------------------------------------------------------------------------------------------------------- 21 Table 1-07. Average Climatological Normals, North Caloocan----------------------------- Error! Bookmark not defined. Table 1-08. Average Climatological Normals, South Caloocan ---------------------------------------------------------------- 24 Table 1-09. Historical Growth of Population --------------------------------------------------- Error! Bookmark not defined. Table 1-10. Comparative Population Result -------------------------------------------------- 2Error! Bookmark not defined. Table 1-11. Actual and Projected Population ------------------------------------------------ 2Error! Bookmark not defined. Table 1-12. Age, Sex Composition ---------------------------------------------------------------------------------------------------- 30

4 | P a g e
Table 1-13. Actual and Projected Number of Housing Units by Tenurial Status ---- Error! Bookmark not defined.1 Table 1-14. 10-Year Major Land Use Growth Trend ---------------------------------------- Error! Bookmark not defined.4 Table 1-15. Suitability Analysis for Future Development Areas ------------------------- Error! Bookmark not defined.4 Table 2-01. Barangays and Estimated Population Affected by Flood -------------------- Error! Bookmark not defined. Table 2-02. Barangays and Estimated Population Affected by Rain-Induced Landslide -------- Error! Bookmark not defined. Table 2-03. Estimated GHG Emission due to Mobile Fuel Consumption --------------------------------------------------- 48 Table 2-04. Estimated GHG Emission due to Purchased Electricity --------------------------------------------------------- 48 Table 2-05. Estimated GHG Emission due to Waste Generated in Operations ------------------------------------------- 49 Table 2-06. Critical Economic facilities by Barangay Location ---------------------------------------------------------------- 49 Table 2-07. School Facilities Risk Assessment and hazard Vulnerability----------------- Error! Bookmark not defined. Table 2-08. Hospitals and Health centers by Hazard Susceptibility ----------------------- Error! Bookmark not defined. Table 2-09. Location of Infornal Settler families by Hazard Susceptibility -------------- Error! Bookmark not defined. Table 2-10. Police Stations by Hazard Susceptibility ----------------------------------------- Error! Bookmark not defined. Table 2-11. Fire stations by Hazards Susceptibility ------------------------------------------- Error! Bookmark not defined. Table 2-12. Critical Institutional Facilities ------------------------------------------------------- Error! Bookmark not defined. Table 2-13. Sectoral Impacts ----------------------------------------------------------------------- Error! Bookmark not defined. Table 3-01. Vision, Goals and Objectives with Output/ Outcome Indicators----------- Error! Bookmark not defined. Table 4-01. Impacts of Climate Change on Different Infrastructures, Mitigation and Adaptation Measures Error! Bookmark not defined. Table 4-02. Mitigation/ Adaptation Initiatives for Temperature Increase ------------ Error! Bookmark not defined.1 Table 4-03. Mitigation/ Adaptation Initiatives for Flooding due to Increase Precipitation ---- Error! Bookmark not defined.2 Table 4-04. Mitigation/ Adaptation Initiatives for Flooding due to Sea Level Rise---- Error! Bookmark not defined.
FIGURES ------------------------------------------------------------------------------------ Error! Bookmark not defined. Figure 1-01. Caloocan Map -------------------------------------------------------------------------------------------------------------- 8 Figure 1-02. NCR Map --------------------------------------------------------------------------------------------------------------------- 8 Figure 1-03. Barangay Map, North Caloocan -------------------------------------------------------------------------------------- 10 Figure 1-04. Barangay Map, South Caloocan -------------------------------------------------------------------------------------- 11 Figure 1-05. Topographic Map, South Caloocan --------------------------------------------------------------------------------- 13 Figure 1-06. Slope Map, South Caloocan ------------------------------------------------------------------------------------------- 14 Figure 1-07. Topographic Map, North Caloocan --------------------------------------------------------------------------------- 15 Figure 1-08. Slope Map, North Caloocan ------------------------------------------------------------------------------------------- 16 Figure 1-09. Soil Map, South Caloocan --------------------------------------------------------------------------------------------- 19 Figure 1-10. Soil Map, North Caloocan --------------------------------------------------------------------------------------------- 20 Figure 1-11. 10-Year Average Monthly Temperature ---------------------------------------- Error! Bookmark not defined. Figure 1-12. 10-Year Average Rainfall ------------------------------------------------------------ Error! Bookmark not defined. Figure 1-13. Historical Growth of Population -------------------------------------------------- Error! Bookmark not defined. Figure 1-14. Comparative Population Result ------------------------------------------------- 2Error! Bookmark not defined. Figure 1-15. Population Growth by Geographic Location ---------------------------------------------------------------------- 28 Figure 1-16. Population Growth by Political District ----------------------------------------------------------------------------- 29 Figure 1-17. Population Age, Sex Composition ----------------------------------------------------------------------------------- 30 Figure 1-18. Land Suitability Map, South Caloocan ----------------------------------------- Error! Bookmark not defined.6 Figure 1-19. Land Suitability Map, North Caloocan ----------------------------------------- Error! Bookmark not defined.7 Figure 1-20. Climate Change Framework ----------------------------------------------------- Error! Bookmark not defined.8 Figure 1-21. Climate Change Operational Chart --------------------------------------------- Error! Bookmark not defined.9 Figure 2-01. Flood Map, North Caloocan ------------------------------------------------------------------------------------------- 42 Figure 2-02. Flood Map, South Caloocan ------------------------------------------------------------------------------------------- 43 Figure 2-03. Rain-Induced Landslide, North Caloocan --------------------------------------- Error! Bookmark not defined. Figure 2-04. Rain-Induced Landslide, South Caloocan --------------------------------------- Error! Bookmark not defined. Figure 2-05. Greenhouse Gas Fair Emission Range ----------------------------------------- 4Error! Bookmark not defined.
5 | P a g e
Chapter One
BACKGOUND AND RATIONALE
LEGAL MANDATE
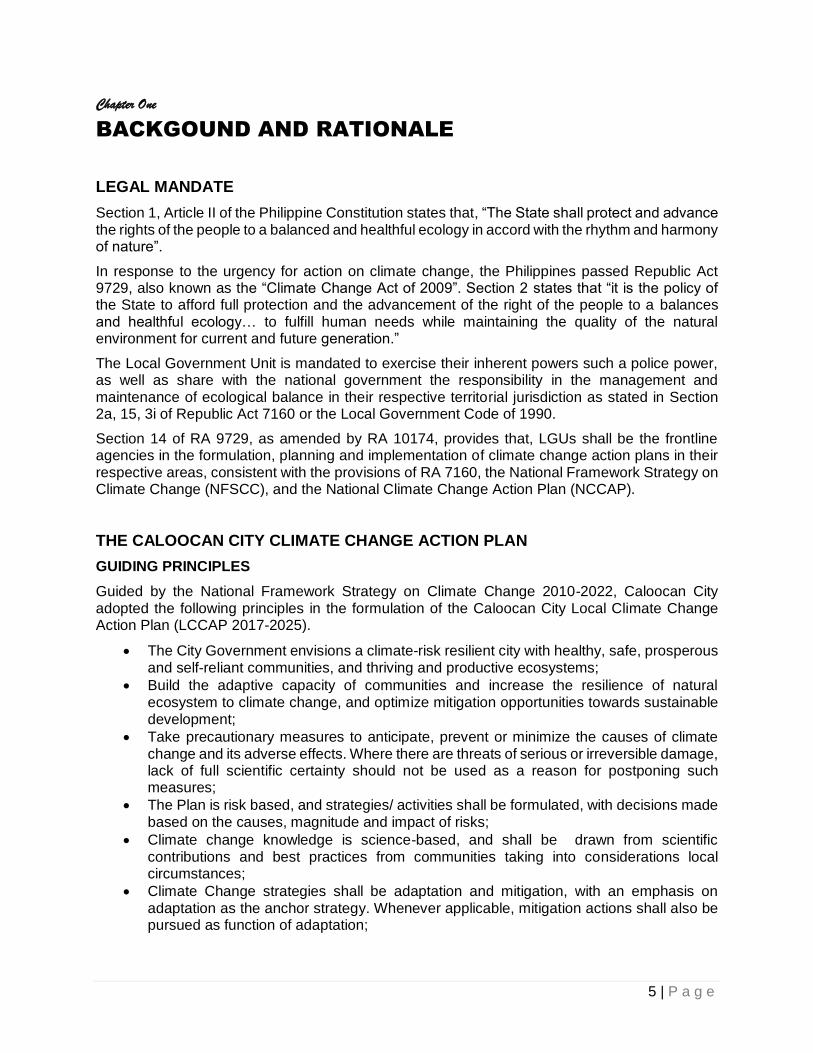
Section 1, Article II of the Philippine Constitution states that, “The State shall protect and advance the rights of the people to a balanced and healthful ecology in accord with the rhythm and harmony of nature”.
In response to the urgency for action on climate change, the Philippines passed Republic Act 9729, also known as the “Climate Change Act of 2009”. Section 2 states that “it is the policy of the State to afford full protection and the advancement of the right of the people to a balances and healthful ecology… to fulfill human needs while maintaining the quality of the natural environment for current and future generation.”
The Local Government Unit is mandated to exercise their inherent powers such a police power, as well as share with the national government the responsibility in the management and maintenance of ecological balance in their respective territorial jurisdiction as stated in Section 2a, 15, 3i of Republic Act 7160 or the Local Government Code of 1990.
Section 14 of RA 9729, as amended by RA 10174, provides that, LGUs shall be the frontline agencies in the formulation, planning and implementation of climate change action plans in their respective areas, consistent with the provisions of RA 7160, the National Framework Strategy on Climate Change (NFSCC), and the National Climate Change Action Plan (NCCAP).
THE CALOOCAN CITY CLIMATE CHANGE ACTION PLAN
GUIDING PRINCIPLES
Guided by the National Framework Strategy on Climate Change 2010-2022, Caloocan City adopted the following principles in the formulation of the Caloocan City Local Climate Change Action Plan (LCCAP 2017-2025).
The City Government envisions a climate-risk resilient city with healthy, safe, prosperous and self-reliant communities, and thriving and productive ecosystems;
Build the adaptive capacity of communities and increase the resilience of natural ecosystem to climate change, and optimize mitigation opportunities towards sustainable development;
Take precautionary measures to anticipate, prevent or minimize the causes of climate change and its adverse effects. Where there are threats of serious or irreversible damage, lack of full scientific certainty should not be used as a reason for postponing such measures;
The Plan is risk based, and strategies/ activities shall be formulated, with decisions made based on the causes, magnitude and impact of risks;
Climate change knowledge is science-based, and shall be drawn from scientific contributions and best practices from communities taking into considerations local circumstances;
Climate Change strategies shall be adaptation and mitigation, with an emphasis on adaptation as the anchor strategy. Whenever applicable, mitigation actions shall also be pursued as function of adaptation;

6 | P a g e
Adaptation measures shall be based on equity, in accordance with common but differentiated responsibility; special attention must be given to ensure equal and equitable protection of the poor, women, children and other vulnerable and disadvantaged sectors;
Even with inadequate scientific information, anticipatory adaptation measures should be undertaken to prevent or minimize the causes and potential impacts of climate change, whenever necessary;
The LCCAP shall be sustainable that fulfill human needs while maintaining the quality of the natural environment for current and future generations;
The principle of complementation shall be observed to ensure that climate change initiatives by one sector do not restrict the adaptation of the other sector;
It shall recognize the value of forming multi-stakeholder participation and partnerships in climate change initiatives, including with civil society, private sector and other marginalized groups most vulnerable to climate change impacts; and
Policies and incentive mechanisms to facilitate private sector participation in addressing adaptation and mitigation objectives shall be promoted and supported.
Following the development concepts outlined in the NCCAP, Caloocan City’s LCCAP has the following work priorities and targeted outcomes;
Table 1-01: Priorities and Outcomes
Priorities Outcomes
Food security - Availability, stability, accessibility and affordability of safe and healthy food amidst
climate change.
Water sufficiency - Resiliency of major water resources and infrastructures; - Efficient management of water supply and demand; - Effective management of water quality promotion and conservation.
Environmental and Ecological Stability
- Achieved resilient ecosystem and environmental stability; - Attained protection and rehabilitation of critical ecosystems, and restoration of
ecological services.
Human Security - Reduced risks for women and men; children, senior citizens, people with disabilities
and other vulnerable sector to climate change and disasters.
Climate-Friendly Industries and Services
- Prioritized creation of green and eco-jobs; - Attained sustainable consumption and production.
Sustainable Energy
- Prioritized the promotion and expansion of energy efficiency and conservation; - Achieved development of sustainable and renewable energy; environmentally
sustainable transport; and climate-proofing and rehabilitation of energy systems infrastructures.
Knowledge and Capacity Development
- Enhanced knowledge on the science of climate change; - Enhanced capacity for climate change adaptation, mitigation and disaster risk reduction
at the local and community level; and - Established gendered climate change knowledge management accessible to all
sectors at the national and local levels.

7 | P a g e
CITY PROFILE
HISTORY
From its beginning as a humble barrio of the town of Tondo, Caloocan is located in a ‘libis’ (lowland) known as ‘Libis Espina’ or ‘Aromahan’. Its name originated either from the Tagalog word ‘look’ meaning bay or ‘sulok’ meaning corner. Caloocan might have meant ‘nasa sulok’ or in the corner since the city is located where the ends of the old town of Tondo and Tambobong (now Malabon) meet.
At the end of the 18th century, the fishermen of Aromahan climbed the hills to open homesteads in Caloocan. Here, the land was free of thorny plants that infested the banks/ shorelines and although the hill was naturally stony, some form of agriculture was possible and fishermen became farmers.
In 1815, Caloocan was separated from Tondo and became an independent municipality. Its original territory extended to the foothills of Marikina, San Mateo and Montalban in the east; from Tinajeros, Tanza and Tala Rivers in the North; San Francisco del Monte, Sampalok, Sta. Cruz and Tondo in the south; and Dagat-Dagatan or Aromahan in the west.
The first settlers of Libis Espina, mostly oppressed people from Tondo, fought the landlords of Hacienda de Maysilo, the upper lands of the Dagat-dagatan area, the battle for terrestrial rights went on for almost a hundred years. And on August 30, 1896, the Katipuneros led by Gat Andres Bonifacio aided them in the rebellion against their oppressors in what is now known as the “Cry of Balintawak”.
The Filipino forces in Caloocan participated actively in Intramuros siege of the Spanish forces in Manila until their surrender to the Americans on August 13, 1898.
On January 11, 1899, the people of Caloocan showed resistance to coming to terms with the Americans, who were bent on extending their supremacy over the country. The men of Caloocan fought the new invaders on February 23, 1899, victory eluded the local troops on the pretext of Gen. Antonio Luna’s rift with Aguinaldo’s loyalists.
THE MAKING OF A CITY
In 1901, under the American Regime, Caloocan became one of the towns of the Province of Rizal. Due to the consolidation of several municipalities, Novaliches became part of Caloocan pursuant to Act 942, as amended by Acts 984 and 1008 of the Philippine Commission.
In 1939, pursuant to Commonwealth Act 502, which created Quezon City as Capital of the Philippines, Caloocan lost the following barrios or sitios, namely: Balingasa, Kaingin, Kangkong, La Loma, Malamig, Matalahib, Masambong, San Isidro, San Jose, Santol and Tatalon.

8 | P a g e
In 1949, boundaries of Quezon City were redefined pursuant to Republic Act 392 as recommended by the Capital City Planning Commission. Caloocan again lost several barrios, namely: Baesa, Bagbag, Bahay-Toro, Banlat, Novaliches, Pasong Tamo, San Bartolome and Talipapa. This explains why the City of Caloocan has two separate territories.
In 1961, the late Mayor Macario B. Asistio, Sr., led the people of Caloocan to turn the historic town into a city through a plebiscite held in accordance with House Bill 6038, which was passed and approved by both chambers of the defunct Philippine Congress.
On February 16, 1962, the Municipality of Caloocan was inducted into Cityhood.
GEOGRAPHICAL LOCATION AND LAND AREA
Caloocan City is situated in the northern part of Metro Manila or the National Capital Region (NCR, Region IV-A), within coordinates of 14°39'4"N latitude and 120°58'18"E longitude. It is divided into two geographic locations with a combined total land area of 5,333.40 hectares.
South Caloocan has an area of 1,362.50 hectares. It is bounded on the north-northwest by Valenzuela, Malabon and Navotas; on the east by Quezon City; and on the south by the City of Manila. The greatest length, north to south of the boundaries is about six kilometers and the greatest width, east to west is seven kilometers.
North Caloocan’s total expanse is at 3,970.90 hectares. It is bounded on the north-northwest by the province of Bulacan; on the south-southeast by Quezon City; and southwest by Valenzuela. Its extreme southern boundary is about 1.7 Kilometers apart from the northern extreme boundary of South Caloocan.
The greatest length, north to south of the boundaries is eight kilometers and the greatest width, east to west is ten kilometers.
Map No. G-2
Figure 1-02. NCR Map
Map No. G-2
Original Territorial Boundaries
Figure 1-01.
Caloocan Map

9 | P a g e
TERRITORIAL COMPOSITION
The City of Caloocan is divided into 16 zones, which is composed of 188 barangays. It is further divided into two political boundaries, namely: District 1 and District 2. District 1 is composed of 70 barangays, which include Barangays 1 to 4, 77 to 85 and 132 to 188, while District 2 is composed of 118 barangays, which include Barangays 5 to 76 and 86 to 131.
Table 1-02: List of Barangay Zones by Political District
Barangay Zone Congressional District
Barangays Old District Name / Location
Zone 01 – District I 001 - 004 Sangandaan
Zone 01 – District II 005 - 012 Sangandaan & Dagat-Dagatan
Zone 02 – District II 013 - 024 Poblacion & Dagat-Dagatan
Zone 03 – District II 025 - 035 Sampalukan, Maypajo & Dagat-Dagatan
Zone 04 – District II 036 - 048 Marulas, Barrio Obrero, &Bagong Grace Park
Zone 05 – District II 049 - 058 Bagong Grace Park & Grace Park
Zone 07 – District II 071 - 076 Calaanan West
Zone 07 – District I 077 - 080 Bonifacio
Zone 08 – District I 081 - 085 Bonifacio, & Morning Breeze,
Zone 08 – District II 086 - 093 Calaanan East, Our Lady of Grace, & Barrio Rodriguez
Zone 09 – District II 094 – 105 Calaanan East, Barrio Pacita, & Barrio Galino
Zone 10 - District II 106 – 120 Our Lady of Grace, &Bagong Silang (Old)
Zone 11 – District II 121 – 131 Bagong Silang (Old), Barrio Galino, & Barrio San Jose
Zone 12 – District I 132 – 141 Bagong Barrio
Zone 13 – District I 142 – 155 Bagong Barrio
Zone 14 – District I 156 – 164 Bagong Barrio, Baesa & Talipapa
Zone 15 – District I 165 – 178 Bagbaguin, Kaybiga, Llano, Deparo, Bagumbong, Camarin, & Tala-Bagong Silang Resettlement Project
Zone 16 – District I 179 – 188 Amparo, & Tala (Pangarap, Malaria-Barracks, Tala-NHA,)

10 | P a g e
Figure 1-03. Barangay Map, North Caloocan

11 | P a g e
Figure 1-04. Barangay Map, South Caloocan

12 | P a g e
TOPOGRAPHY
South Caloocan
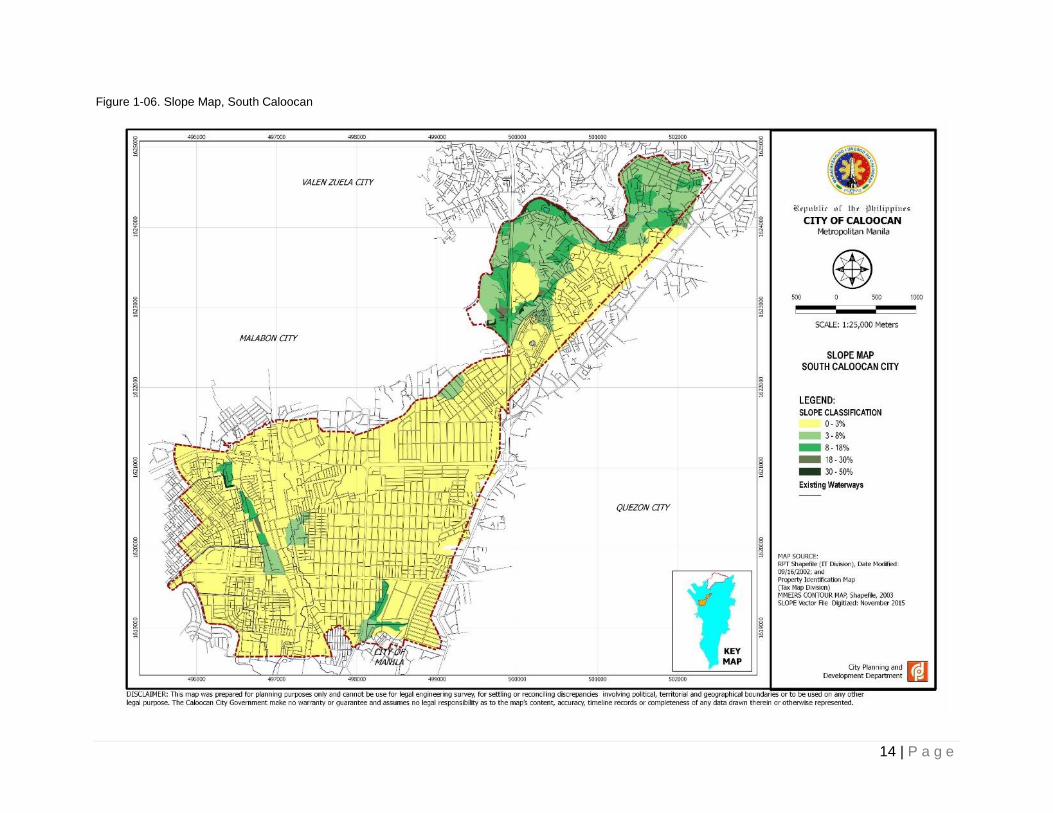
A westward trend of flat lands covers a land area of about 1,001.64 hectares or 74.25% of the whole southern portion of the city, slopes of which ranging from 0% to 3%. Being flat and highly accessible to neighboring cities and municipalities. It is where most of the commercial and industrial establishments in the city can be found.
Along the North Diversion Road, the topography of South Caloocan, gradually changes into gently to moderately sloping to rolling, with slopes ranging from 3 to 18%. Adjacent to residential and industrial areas within the sector, vast tracts of land still exist. In these areas lie the highest point found to be 35.00 meters above mean sea level. The lowest is in the southernmost end of Kaunlaran Village (Dagat-Dagatan Development Project) measuring about 0.993 meters above mean sea level.
North Caloocan
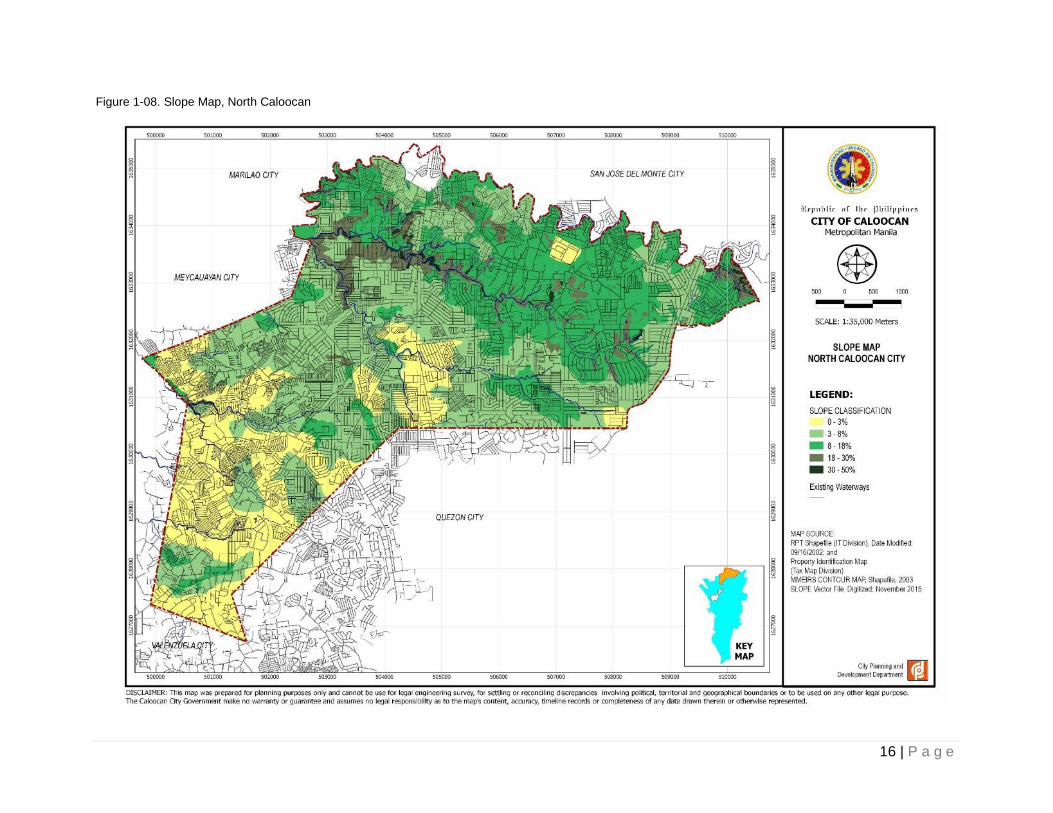
Out of the total land area, 58.49% or 2,322.80 hectares are characterized to have gently to steeply undulating to rolling topography with slopes ranging from 3 to 18%. This terrain is noted in the northern and central portion and gradually transforming into a southward trend of flat lands down to the southwestern tip of the boundary. Several industrial and residential subdivisions have already been developed in these broadly to nearly level lands, because of its proximity to some of the major access roads in the area.
GEOLOGY
Rock Formation
The geologic formation of the two portions of Caloocan City varies in type and characteristics, and are specifically classified as: quaternary alluvium, tuff and tuffaceous sediment, pyroclastic flow deposit, and conglomerates1. The formation on the eastern half of Metropolitan Manila extending to the coastline of Manila Bay and including a greater part of South Caloocan, is the
quaternary alluvium -- consisting of unconsolidated stream‐deposited sediments that includes sand, silt, clay or gravel.
Eastward of South Caloocan, large areas consisting of tuff and tuffaceous sediment can be traced, spreading towards the whole eastern side of Metropolitan Manila. Tuff rocks or volcanic ash are composed of pyroclastic materials that have been ejected from a volcano and formed like "welded" rock mass2, composed largely of fragments that is less than 4 millimeters (mm) in diameter. Tuffaceous sediments, on the other hand, are a mass of organic or inorganic solid fragmented material that contain 50 percent tuff. This sediment comes from weathering of rock and carried, suspended or dropped by air, water, or ice; or accumulated by any other natural agent forming in layers on earth’s surface such as sand, gravel, silt, mud, fill, or loess (silt).
Pyroclastic flow deposit or igneous rocks formed by the lithification of ash flow are likewise present in northern fringes of South Caloocan and in most part of North Caloocan. Lithification is a process by which sediment is converted into sedimentary rock, including cementation and compaction. On the northeast borders of North Caloocan, conglomerate rocks were traced, crossing Tala Estate and extending to the province of Bulacan and the La Mesa Watershed. Conglomerates are coarse grained sedimentary rocks composed of rounded fragments of pebbles, cobbles or boulders3.
1/ Source: MMEIRS Geological Map (Raster Format), Phivolcs, MMDA, and JICA, ______ 2/ Hamblin and Christiansen, Glossary of Common Geological Terms, Pearson Education Inc., Upper Saddle River, NJ, 2003 3/Hamblin and Christiansen, Glossary of Common Geological Terms, Pearson Education Inc., Upper Saddle River, NJ, 2003

13 | P a g e
Figure 1-05. Topographic Map, South Caloocan
14 | P a g e
Figure 1-06. Slope Map, South Caloocan

15 | P a g e
Figure 1-07. Topographic Map, North Caloocan
16 | P a g e
Figure 1-08. Slope Map, North Caloocan

17 | P a g e
Table 1-03: Land Area Distribution by Type of Geology
Geologic Forms North Caloocan South Caloocan Total
Conglomerates 460.45
460.45
Pyroclastic Flow Deposit 3,069.03 65.53 3,134.56
Quarternary Alluvium
866.96 866.96
Tuff &Tuffaceous Sediment 441.41 430.02 871.43
Total 3,970.90 1,362.50 5,333.40
GEOMORPHOLOGY
Basic Soil Types Soil is unconsolidated rock material over bedrock, containing an admixture of organic matter and capable of supporting vegetation.
Soil found in Caloocan City predominantly fall under the Novaliches series. This series is found in both South and North Caloocan. In area distribution,
Novaliches clay loam - the largest coverage with an area of 2,538.87 hectares or 47.60% of the total land area
Novaliches clay loam adobe - 1,195.94 hectares or 22.42% of the total area
Novaliches loam - 869.70 hectares or 16.31% of the total area
Prensa clay loam - about 522.25 hectares 9.79% or 9.79% of land falling under the Prensa series
Hydrosol type - remaining 206.64 hectares representing 3.87% of the land area The Novaliches Series (See Table No. 1-3 and 1-4)
Covers 96.13% of the total land area of the city
Light reddish brown, reddish brown to bright reddish brown in color
Surface and subsoil are friable in consistency and granular in structure
Spherical concretions are present in the subsoil and underneath are tuffaceous material of varying degrees of disintegration and weathering
Tuffaceous material is exposed by extensive erosion in some places.
Table 1-04: Land Area Distribution by Soil Type, Caloocan City4
Type no. Soil Type
Land Area
(in hectare)
% Distribution
Characteristics
South North South North
11 Novaliches Loam
- 869.70 - 21.90 Poor in organic matter, surface soil is friable and easily eroded
4 Source: Based on Topographic Map prepared by Almar Surveying Co., Inc., 1987

18 | P a g e
Type no. Soil Type
Land Area
(in hectare)
% Distribution
Characteristics
South North South North
12 Novaliches Clay 368.22 2,170.65 27.02 54.66
Surface soil is friable when dry and slightly sticky when wet, substratum are highly weathered tuffaceous materials
17 Novaliches Clay, Loam and Adobe
787.64 408.30 57.81 10.28
Surface soil is friable and in some places shallow, substratum is compact volcanic tuff / adobe rock
6 Prensa Clay - 522.25 - 13.15
Surface soil is loose and granular, presence in some places of volcanic tuffaceous materials used for building purposes
1 Hydrosol (Rizal) 206.64 - 15.17 -
Former body of water now a reclaimed area, presence of salt intrusion
Table 1-05: Soil Characteristics5
Soil Type Depth (in cm.) Characteristic
Novaliches Loam
20 – 40 Reddish brown, friable and fine to coarse granular loam. Concretions are present and the soil is comparatively poor in organic matter. Being friable, the soil is easily eroded.
40 – 60 Brownish red, friable and granular clay loam with concretions and gravel.
60 – 111 Light brick to rusty red.
111 – below Varying degrees of weathering.
Novaliches Clay Loam
12 - 29 Red to light reddish brown clay loam, granular and friable when seemingly dry and slightly sticky when wet. Presence of brown concretions in considerable amount.
54 - 81 Brick red clay loam to clay with gravel reddish brown concretions
100 - 150 Highly weathered tuffaceous material
Novaliches Clay
Loam Adobe
0 - 5 Brown loose and friable loam to clay loam.
5 -20 Dark brown granular clay loam with gravel and concretions
20 - 35 Adobe clay loam with concretions and gravel, highly weathered tuff.
60 Weathered adobe rock, slightly compact
Downward Compact and massive adobe rock
Prensa Clay Loam
20 – 25 Brown to dark yellowish brown clay loam, loose and granular with plenty of spherical iron concretion.
40 – 50 Gray, light yellowish gray to dull grayish brown, loose and gravelly clay grading to sandy clay with plenty of concretions.
50 – downward Gravelly clay, light grayish brown or dark brown in color.
5 Soil Map based on Bureau of Soils Report, 1935

19 | P a g e
Figure 1-09. Soil Map, North Caloocan

20 | P a g e
Figure 1-10. Soil Map, South Caloocan

21 | P a g e
NATURAL SURFACE DRAINAGE
Natural surface drainage or surface waters are all “waters, which are open to the atmosphere and subject to surface runoff” (par. jj. Section 4, Article 2, RA 9275). Caloocan City has a total of 68.9 kilometer-length (km length) of surface waters that either have natural course (creeks and rivers) or constructed to serve as drainages to remove excess water from soil surfaces.
South Caloocan has about a total of 5.0 km length of open drainage canals that serve mainly the reclamation area comprising Kaunlaran Village (Dagat-Dagatan Development Project) and nearly 11.3 km length of natural surface water coursing through different natural river systems that exist in the northern part of Metropolitan Manila.
In North Caloocan, all surface waters consist of natural streams of different width and length. A total of 52.7 km length of these waters crosses or starts within the City’s territorial boundaries. Names and descriptions of these surface waters are shown in the table below.
Table 1-06. River Systems6
River System Approx. Length (l.m.)
Midline Coordinate (Latitude / Longitude)
Covered Barangays (Old
Districts) Description
SOUTH CALOOCAN
Tinajeros - Tullahan River
5250 14°40’56”N / 121°00’42”E
160, 162, 163, 164 (Baesa,
Santa Quiteria, Barrio Talipapa)
5.25 km river (length within boundary line only), that divides territories of Valenzuela City and South Caloocan City, and receives drainage outflow from Barangays Nagkaisang Nayon, Gulod, San Bartolome, Bagbag, Talipapa and Baesa in Quezon City
DDDP Peripheral Canal 1 (From C3 Road northward to Buklod ng Nayon Sangandaan)
2163 14°39’15”N / 120°58’44”E
8, 12, 14, 22 (Kaunlaran
Village, Poblacion,
Sangandaan)
2.16 km peripheral canal cutting across Dagat-Dagatan Development Project (Kaunlaran Village), located along Talakitok, Tanigue, Tamban, Bangayngay, Salay-salay, Lapu-Lapu Ext, and Sabalo Streets.
DDDP Peripheral Canal 2 (From Tawilis St. Kaunlaran Village southward to J.P. Rizal Maypajo)
792 14°38’27”N / 120°58’10”E
28, 31, 35 (Kaunlaran
Village, Maypajo)
0.79 km peripheral canal cutting across Dagat-Dagatan Development Project (Kaunlaran Village), located along Tawilis, Tuna, and Talilong Streets.
Lapu-Lapu Extension Lateral Canal
535 14°39’19”N / 120°57’51”E
8, 12
(Kaunlaran Village)
0.53 km lateral canal cutting across Dagat-Dagatan Development Project (Kaunlaran Village), receiving drainage outflow from DDDP peripheral canal.
Tanigue Lateral Canal 953 14°38’52”N / 120°57’56”E
14, 18, 20, 22
(Kaunlaran Village)
0.95 km lateral canal cutting across Kaunlaran Village, receiving drainage outflow from DDDP Peripheral Canal.
Torsillo Lateral Canal 582 14°38’33”N / 120°58’68”E
28
(Kaunlaran Village)
0.58 km lateral canal cutting across Kaunlaran Village, receiving drainage outflow from DDDP peripheral canal.
6 Electronic Survey –CAD Data (dwg format), MMDA Caloocan City District Map, ______

22 | P a g e
River System Approx. Length (l.m.)
Midline Coordinate (Latitude / Longitude)
Covered Barangays (Old
Districts) Description
Maligaya Creek Main Segment
2nd Avenue / West Cemetery Wall (Main Segment)
882 14°38’28”N / 120°59’65”E
118, 120
(La Loma, Grace Park -
East)
0.88 km creek located along the west wall of La Loma Cemetery and runs across Rizal Avenue Extension to City of Manila. It receives drainage outflow from eastern portion of Grace Park via underground main drainages along 2nd Street.
Maligaya Creek Branch
La Loma Cemetery
496 14°38’51”N / 120°59’11”E
118
(La Loma)
0.50 km small creek running across La Loma Cemetery receiving drainage outflow from Barrio San Jose via underground main drainages along Tagaytay Street towards Maligaya Creek Main
Casili Creek 3440 14°38’51”N / 120°58’29”E
19, 17, 21, 29, 32, 33, 34, 43, 46, 49, 59, 63, 65, 66, 70, 72,
75, 76
(Maypajo, Grace Park (West), Poblacion, Calaanan
(West),&Bonifacio
3.44 km small creek running across old districts of Bonifacio, Calaanan (West), Grace Park (West), Sampalukan, Maypajo and terminates at Estero de Maypajo. A total of 1.92 km is already covered by culverts found at different segments of the creek.
Cantarilla / Panaca Creek
1099 14°39’39”N / 120°58’14”E
1, 2, 3
(Sangandaan)
1.1 km (length along boundary lines) small creek, divides Malabon City and South Caloocan City with main outflow going to Longos River.
NORTH CALOOCAN
Meycauayan-Marilao River
17037 14°46’57”N / 121°02’53”E
176, 181, 185, 186, 188
(Bagong Silang, Tala, Malaria-
Barracks, Pangarap)
17 km (length along boundary lines) River, divides Bulacan Province from North Caloocan City, with main outflow crossing Bulacan Province towards Manila Bay. A total of 3.1 km of small tributaries or branches connects to this river system from Bagong Silang Resettlement Area
Tala Creek 2118 14°46’02”N / 121°04’43”E
180, 183, 184, 185
(Tala, Malaria – Barracks)
2.1 km (within City boundary) small creek crossing Mountain Heights Subdivision, Bankers Village 2 Subdivision, Soldiers Hills Subdivision, and Malaria-Barracks, westward to Meycauayan - Marilao River
Bagong Silang River 8869 14°45’56”N / 121°03’11”E
176, 179, 180, 187
(Tala, Bagong Silang)
8.9 km (within City boundary) creek crossing Amparo Subdivision, Miramonte Heights Subdivision, Tala, Bagong Silang Resettlement Project (Matarik), and Shelter Ville Subd. westward to Meycauayan – Marilao River
Camarin Creek 8152 14°45’15”N / 121°02’38”E
175, 177, 178
(Bagumbong,
8.2 km creek receiving drainage outflow from Sacred Heart Village VI, Capitol Parkland Subdivision, Camarin II (Area D), Lilies

23 | P a g e
River System Approx. Length (l.m.)
Midline Coordinate (Latitude / Longitude)
Covered Barangays (Old
Districts) Description
Camarin) Subd., Castle Spring Subd., Ma. Luisa Subd., North Matrix Village I, Almar Subd., Villa Amor 2 Subd., Palmera Springs II Subd., Senate Village, Congressional Model Subd., Union Village, Kalikasan Hills, Bankers Village, and Forest Park westward to Meycauayan – Marilao River.
Pasong Malapad Creek 2780 14°44’50”N / 121°02’32”E
172, 173, 177
(Camarin)
2.8 km small tributary creek receiving drainage outflow from Constellation Homes, Merry Homes II Subd., Franville V, MC Homes and Villa Angelica Subd. Northward to Camarin Creek.
Bagumbong Creek (Main Segment & Branches)
7718 14°44’40”N / 121°00’42”E
168, 171
(Bagumbong, Deparo)
7.7 km creek with tributaries receiving drainage outflow from Villa Maria Subd., Northcrest Subd., Evergreen Executive Village, Villa Sarah, Tierra Nova Royale, Saint Dominic I, Sto. Thomas Village 7 westward to Meycauayan River
Bignay-Llano Creek (Main Segment & Branches)
3631 14°44’02”N / 121°00’52”E
167 (Llano) 3.6 km creek with tributaries receiving drainage outflow from Silangan Village, Del Mundo Subd., and Sanchez Subd., westward to Bignay Punturin Creek in Valenzuela City.
Sapang Bakaw 2389 14°43’33”N / 121°00’31”E
165, 166, 167
(Llano, Kaybiga)
2.4 km small creek receiving drainage outflow from Sunriser Village, Pleasant View Subd. II, and Vista Verde North, westward to Lingunan Creek in Valenzuela City.
CLIMATE
Just like the rest of the towns and cities of Metro Manila, Caloocan City falls under type 1 of the Philippine Climate Classification which has two distinct seasons. First is the Dry High Pressure season, which comes in the months of November till April. The dry season corresponds with the northeast monsoon (October to January). The Wet season which starts from May and lasts up to October is consistent with the southwest monsoon (June to September). Between these two well-defined monsoon periods, the southeast trade winds blow from February to May.
Table 1-07: Average climatological normals, 1981-2010 North Caloocan City (Science Garden, Diliman, Quezon City)
Month Rainfall
(mm) Rainy Days
Temperature (oc) Mean Sea Level Pressure
Prevailing Wind
Maximum Minimum Mean Direction Speed (mps)
NORTH CALOOCAN (SCIENCE GARDEN, DILIMAN, QUEZON CITY)
January 18.5 4 30.6 20.8 25.7 1012.3 N 1
February 14.6 3 31.7 20.9 26.3 1012.0 NE 1
March 24.8 4 33.4 22.1 27.8 1011.3 SE 1
April 40.4 5 35.0 23.7 29.4 1009.7 SE 1
May 186.7 12 34.7 24.7 29.7 1008.5 S 1
24 | P a g e
Month Rainfall
(mm) Rainy Days
Temperature (oc) Mean Sea Level Pressure
Prevailing Wind
Maximum Minimum Mean Direction Speed (mps)
June 316.5 18 33.1 24.6 28.8 1008.1 SW 1
July 493.3 22 31.9 24.1 28.0 1007.7 SW 2
August 504.2 23 31.3 24.2 27.8 1007.4 SW 2
September 451.2 22 31.6 24.0 27.8 1010.6 SW 1
October 296.6 18 31.6 23.5 27.6 1008.8 N 1
November 148.8 14 31.4 22.7 27.1 1010.1 N 1
December 78.7 8 30.5 21.6 26.0 1011.5 N 1
Annual 2574.4 153 32.2 23.1 27.7 1009.8 N 1
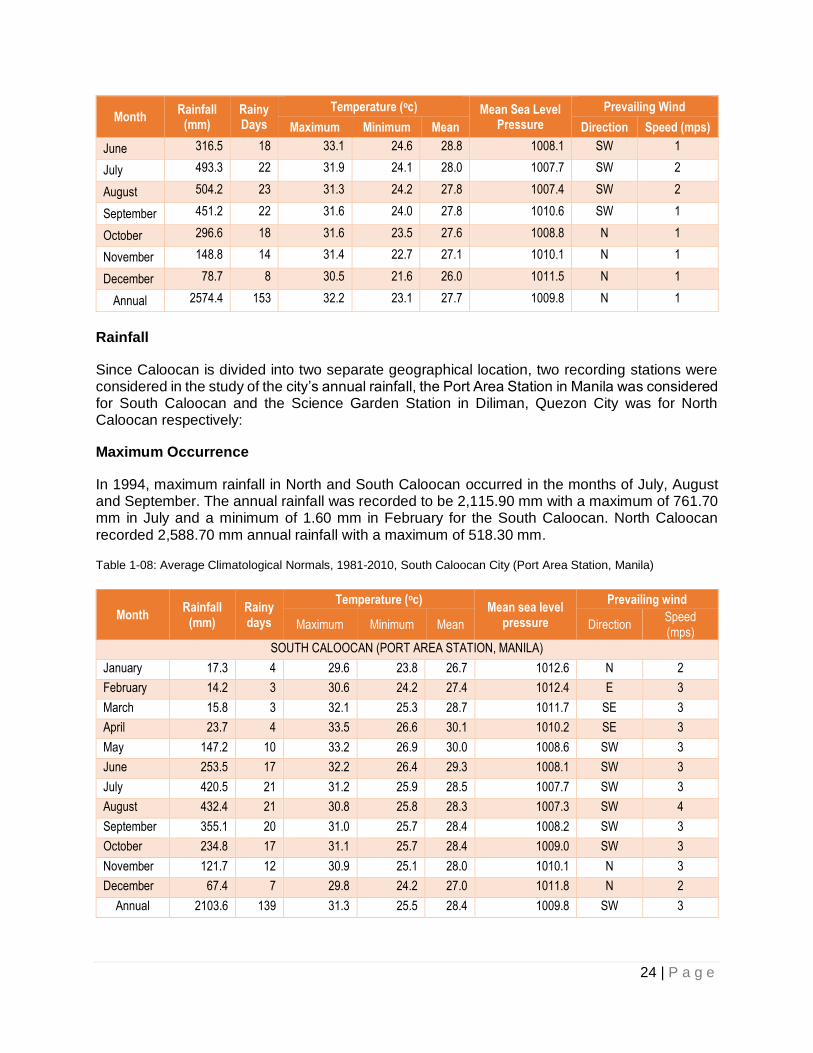
Rainfall
Since Caloocan is divided into two separate geographical location, two recording stations were considered in the study of the city’s annual rainfall, the Port Area Station in Manila was considered for South Caloocan and the Science Garden Station in Diliman, Quezon City was for North Caloocan respectively:
Maximum Occurrence
In 1994, maximum rainfall in North and South Caloocan occurred in the months of July, August and September. The annual rainfall was recorded to be 2,115.90 mm with a maximum of 761.70 mm in July and a minimum of 1.60 mm in February for the South Caloocan. North Caloocan recorded 2,588.70 mm annual rainfall with a maximum of 518.30 mm. Table 1-08: Average Climatological Normals, 1981-2010, South Caloocan City (Port Area Station, Manila)
Month Rainfall
(mm) Rainy days
Temperature (oc) Mean sea level
pressure
Prevailing wind
Maximum Minimum Mean Direction Speed (mps)
SOUTH CALOOCAN (PORT AREA STATION, MANILA)
January 17.3 4 29.6 23.8 26.7 1012.6 N 2
February 14.2 3 30.6 24.2 27.4 1012.4 E 3
March 15.8 3 32.1 25.3 28.7 1011.7 SE 3
April 23.7 4 33.5 26.6 30.1 1010.2 SE 3
May 147.2 10 33.2 26.9 30.0 1008.6 SW 3
June 253.5 17 32.2 26.4 29.3 1008.1 SW 3
July 420.5 21 31.2 25.9 28.5 1007.7 SW 3
August 432.4 21 30.8 25.8 28.3 1007.3 SW 4
September 355.1 20 31.0 25.7 28.4 1008.2 SW 3
October 234.8 17 31.1 25.7 28.4 1009.0 SW 3
November 121.7 12 30.9 25.1 28.0 1010.1 N 3
December 67.4 7 29.8 24.2 27.0 1011.8 N 2
Annual 2103.6 139 31.3 25.5 28.4 1009.8 SW 3

25 | P a g e
Figure 1-11: 10-Year Average Monthly Temperature 1981-2010, Caloocan City
Figure 1-12: 10-Year Average Monthly Rainfall (in mm.)1981 – 2010, Caloocan City
WIND DIRECTION
South Caloocan The northeast winds prevail during the months of November and December. The west wind is predominant in February, March and April. The southwest monsoon blows From May to October, this procures the heavy rain experienced during that period. Maximum wind speed recorded was 28 miles per second, which occurs in October. North Caloocan The north winds prevail during the months of January, March, October, November and December. The southwest monsoon prevails From April till July, this explains the heavy rains experienced during these months.
26.7
30.1
25.70
29.70
232425262728293031
Janu
ary
Feb
ruar
y
Ma
rch
Apr
il
Ma
y
June
July
Aug
ust
Sep
tem
ber
Oct
ober
Nov
em
ber
Dec
em
ber
10-Year Ave Monthly Temp 1981-2010
South Caloocan (Port Area Station, Manila) North Caloocan (Science Garden, Diliman, Quezon City)
14.2
432.4
14.6
504.2
0
100
200
300
400
500
600
Janu
ary
Feb
ruar
y
Ma
rch
Apr
il
Ma
y
June
July
Aug
ust
Sep
tem
ber
Oct
ober
Nov
em
ber
Dec
em
ber
10-Year Ave. Monthly Rainfall 1981-2010
South Caloocan (Port Area Station, Manila) North Caloocan (Science Garden, Diliman, Quezon City)

26 | P a g e
POPULATION
Historical Growth
1903 - Census of Population and Housing (CPH) reported a population of 7,847 for Caloocan City.
1918 - Significantly doubled the 1903 figures.
1960 - population zoomed to 145,523
1980 - population was on the threshold of the half million mark at 467,816
2007 - total population surpassed the one million mark at 1,381,610, 15.09% higher from the census of 2000
2010 - Population accounted for 12.56% of the National Capital Region total of 11,855,975 and 1.61% of the Philippines’ total population of 92,337,852. By population size, Caloocan ranks third among the cities and municipalities in NCR.
The average annual growth rate based on 2000 and 2010 actual census is 2.37%, which is higher compared to the National Capital Region’s (NCR) 1.78%.
It is projected that by year 2020 the population of the city will reach 1,680,013 Table 1-09. Historical Growth of Population (1903 – 2015)7
Date Actual Population Growth Rate
March 2, 1903 7,847
December 31, 1918 19,551 5.9674
January 1, 1939 38,320 3.3202
October 1, 1948 58,208 4.2423
February 15, 1960 145,523 8.4209
May 6, 1970 274,453 6.3853
May 1, 1975 397,201 7.6734
May 1, 1980 467,816 3.3268
May 1, 1990 761,824 4.9973
September 1, 1995 1,023,159 5.6858
May 1, 2000 1,177,604 3.0584
August 1, 2007 1,381,610 2.2282
May 1, 2010 1,489,040 2.3714
August 1, 2015 1.583.978 1.1842
Figure 1-13. Historical Growth of Population (1903-2010)7
7 Various Census Years, National Statistics Office (Philippine Statistics Authority)
0.00%
2.00%
4.00%
6.00%
8.00%
10.00%
0
200,000
400,000
600,000
800,000
1,000,000
1,200,000
1,400,000
1,600,000
1903 1918 1939 1948 1960 1970 1975 1980 1990 1995 2000 2007 2010
ACTUAL POPULATION GROWTH RATE

27 | P a g e
Table 1-10. Comparative Population Result8
2000 2007 2010
POPULATION GROWTH RATE
POPULATION GROWTH RATE
POPULATION GROWTH RATE
PHILIPPINES 76,504,077 2.36% 88,564,453 2.36% 92,337,852 1.90%
NATIONAL CAPITAL REGION
9,932,560 1.06% 11,566,325 2.04% 11,855,975 1.78%
CALOOCAN CITY 1,177,604 3.06% 1,381,610 2.23% 1,489,040 2.37%
Figure 1-14. Comparative Population Result8
Population Distribution
The 1995 Census of Population and Housing conducted by the NSO established that the population of South Caloocan exceeds that of North. In the succeeding census years beginning 2000, the statistics started to show otherwise, that of North surpassing its Southern counterpart in terms of populace.
Barangay 176 in North Caloocan was registered as the most populated barangay in the Philippines, tallied as having 243,878 individuals, accounting for 16% of the city’s total population On the other hand, Barangay 76 in South Caloocan registered the least number of inhabitants at 106. Barangays 167 and 171 had the fastest growing population in the city with an annual growth rate of 9.77% and 9.78%, respectively.
Table 1-11. Actual and Projected Population (1990-2025)
Year Total Based on Geographical Location Based on Political District
North South District I District II
ACTUAL POPULATION
1990 781,824 277,635 484,189 421,517 340,307
1995 1,023,159 482,351 540,808 653,704 369,455
2000 1,177,604 609,812 567,792 789,129 388,475
8 Various NSO Census of Population
0.00%
0.50%
1.00%
1.50%
2.00%
2.50%
3.00%
3.50%
0
10,000,000
20,000,000
30,000,000
40,000,000
50,000,000
60,000,000
70,000,000
80,000,000
90,000,000
100,000,000
2000 2007 2010
PHILIPPINES POPULATION NCR POPULATION CALOOCAN POPULATION
PHILIPPINES GROWTH RATE NCR GROWTH RATE CALOOCAN GROWTH RATE

28 | P a g e
Year Total Based on Geographical Location Based on Political District
North South District I District II
2007 1,381,610 809,731 571,879 984,530 397,080
2010 1,489,040 908,394 580,646 1,093,424 395,616
2015 1,538,978 998,887 585,091 1,193,419 309,559
PROJECTED POPULATION9
2011 1,524,393 926,961 594,432 1,119,385 405,009
2012 1,560,586 952,041 608,545 1,145,961 414,625
2013 1,597,638 974,645 622,994 1,173,169 424,469
2014 1,635,570 997,785 637,785 1,201,023 434,547
PROJECTED POPULATION10
2016 1,602,735 1,010,715 592,020 1,207,551 395,184
2017 1,621,715 1,022,685 599,030 1,221,851 399,864
2018 1,640,919 1,034,795 606,124 1,236,320 404,599
2019 1,660351 1,047,049 613,302 1,250,961 409,390
2020 1,680,016 1,059,449 620,564 1,265,775 414,238
2021 1,699,908 1,071,995 627,913 1,280,764 419,144
2022 1,720,038 1,084,689 635,349 1,129,931 424,107
2023 1,740,407 1,097,534 642,873 1,311,278 429,129
2024 1,761,017 1,110,531 650,486 1,326,806 434,211
2025 1,781,871 1,123,682 658,189 1,342,518 439,353
Figure 1-15. Population Growth by Geographic Location
9 Projected Population based on the 2000 and 2010 Actual Population 10 Projected Population based on the 2010 and 2015 Actual Population
277,6
35
482,3
51
609,8
12 809,7
31
908,3
94
484,1
89
540,8
08
567,7
92
571,8
79
580,6
46
(200,000)
-
200,000
400,000
600,000
800,000
1,000,000
1990 1995 2000 2007 2010
North South Variance N & S

29 | P a g e
Figure 1-16. Population Growth by Political District
Household Population, Household Size And Population Density
The city’s population represented 13% (1,487,245) of the National Capital Region’s (NCR) total household population of 11,796,873 based on the statistics of the 2010 NSO Census. It has a total of 345,444 households (establishing an increase of 38.42 percent from 249,567 in 2000) with and average size of 4.37 occupants respectively. The household size considerably decreased from the 4.71 documented in 2000. Bagong Silang (Barangay 176) holds the most number of households at 53,425 while Barangay 76 has only a single domiciliary.
In terms of population density, South Caloocan’s compacity is placed at 426 persons per hectare and is highly expected to reach the 600 mark in 2025. On the other hand, North Caloocan registered an average of 229 persons per hectare and is projected to reach 325 by 2025. In general, population density was placed at 279 person per hectare in entirety (citywide), manifesting an increase of 26.45 percent since 2000 or 58 persons per hectare for the last 10 years.
Age, Sex Composition
Of the total household population in 2010, 49.80 percent were males and 50.20 percent were females. These figures equates to a ratio of 99 males for every 100 females. The census results likewise affirmed that the sex ratio for the age groups 15 to 64 had more females than males while those below the 15 year age group is contrasting in terms of proportion. Senior citizens (aged 60 and over) represent 5.17 per cent of the total household population while the school age group occupies about 41.45 per cent as per the 2010 NSO Census of Population.
The dependency age covers about 34.57 percent of the population (14 and below age group at 32 percent). This reflected a dependency ratio of 53 dependents for every 100 persons of the working populace.
421,
517.
00
653,
704.
00
789,
129.
00
984,
530.
00
1,09
3,42
4.00
340,
307.
00
369,
455.
00
388,
475.
00
397,
080.
00
395,
616.
00
81,2
10.0
0
284,
249.
00
400,
654.
00
587,
450.
00
697,
808.
00
0
200000
400000
600000
800000
1000000
1200000
1990 1995 2000 2007 2010
District I District II Variance I & II

30 | P a g e
Figure 1-17: Population Age, Sex Composition
Table 1-12: Age Sex Composition, Caloocan City, 201011
Age Group Both Sexes Male Female Ratio
Under 1 33,068 16,818 16,250 103.495
1 to 4 127,479 65,595 61,884 105.996
5 to 9 155,563 80,473 75,090 107.169
10 to 14 153,873 78,891 74,982 105.213
15 to 19 151,002 74,619 76,383 97.691
20 to 24 144,315 70,991 73,324 96.818
25 to 29 134,156 66,040 68,116 96.952
30 to 34 121,941 60,879 61,062 99.700
35 to 39 103,410 52,158 51,252 101.768
40 to 44 93,933 46,982 46,951 100.066
45 to 49 80,146 39,733 40,413 98.317
50 to 54 64,905 32,136 32,769 98.068
55 to 59 46,490 22,682 23,808 95.270
60 to 64 32,806 15,285 17,521 87.238
65 to 69 18,140 8,100 10,040 80.677
70 to 74 13,092 5,310 7,782 68.234
75 to 79 7,137 2,618 4,519 57.933
80 to 84 3,692 1,159 2,533 45.756
85 and over 2,097 ,561 1,536 36.523
Caloocan City 1,487,245 741,030 746,215 99.305
11 National Statistics Office, 2010 Census of Population and Housing
100000 80000 60000 40000 20000 0 20000 40000 60000 80000
Under 1
1 - 4
5 - 9
10 - 14
15 - 19
20 - 24
25 - 29
30 - 34
35 - 39
40 - 44
45 - 49
50 - 54
55 - 59
60 - 64
65 - 69
70 - 74
75 - 79
80 - 84
16,818
65,595
80,473
78,891
74,619
70,991
66,040
60,879
52,158
46,982
39,733
32,136
22,682
15,285
8,100
5,310
2,618
1,159
16,250
61,884
75,090
74,982
76,383
73,324
68,116
61,062
51,252
46,951
40,413
32,769
23,808
17,521
10,040
7,782
4,519
2,533
Male Female

31 | P a g e
Household Population, Household Size and Population Density
The city’s population represented 13% (1,487,245) of the National Capital Region’s (NCR) total household population of 11,796,873 based on the statistics of the 2010 NSO Census. It has a total of 345,444 households (establishing an increase of 38.42 percent from 249,567 in 2000) with and average size of 4.37 occupants respectively. The household size considerably decreased from the 4.71 documented in 2000. Bagong Silang (Barangay 176) holds the most number of households at 53,425 while Barangay 76 has only a single domiciliary.
In terms of population density, South Caloocan’s compacity is placed at 426 persons per hectare and is highly expected to reach the 600 mark in 2025. On the other hand, North Caloocan registered an average of 229 persons per hectare and is projected to reach 325 by 2025. In general, population density was placed at 279 person per hectare in entirety (citywide), manifesting an increase of 26.45 percent since 2000 or 58 persons per hectare for the last 10 years
HOUSING
Based on the 2010 Census of Population and Housing (CPH), a total of 331,345 occupied housing units were recorded in Caloocan City. This translates to a ratio of 100 occupied housing units for 4.5 persons per occupied housing unit. However, almost 20% of the total occupied housing units are rent-free with and without consent of the lot owners. With an annual growth of 3.30% households (2000-2010), there is an estimated housing needs of 10,000 units annually to meet the standard of 1 household per housing unit.
Urban blight and slum areas remain to be a major concern in the housing programs of the city government. The lack of access to affordable housing results to the proliferation of informal settlers and professional squatting.
These resulted to urban congestion and deterioration of environmental conditions. The problems arising from urban blights such as worsening of structural conditions, poor health and sanitation, increase in crime and decline of public order continuous to pose as a challenge to the city government.
Table 1-13, Actual and Projected Number of Housing Units by Tenure Status of Lot 2000, 2010, 2016-2025
Particulars No. of HH (Actual) Projected No. of HH
2000 2010 2016 2017 2018 2019 2020 2021 2022 2023 2024 2025
Owned/Being Amortized
119,970 176,534 215,747 223,081 230,666 238,508 246,616 255,000 263,670 272,634 281,903 291,487
Rented 63,673 88,330 108,012 111,683 115,480 119,407 123,466 127,663 132,004 136,492 141,132 145,930
Sub-Total 183,643 264,864 323,759 334,764 346,146 357,915 370,082 382,663 395,674 409,126 423,035 437,417
% Share (A+B/ Total)
80.42 80.52 80.53 80.53 80.53 80.53 80.53 80.53 80.53 80.53 80.53 80.53
Rent-free with consent of owner
28,875 42,713 52,201 53,975 55,810 57,708 59,670 61,698 63,796 65,965 68,207 70,256
Rent free without consent of owner
15,824 16,806 20,539 21,237 21,959 22,706 23,478 24,276 25,101 25,955 26,837 27,749
Sub-Total 44,699 59519 72,740 75,212 77,769 80,414 83,148 85,974 88,897 91,920 95,044 98,002
% share (C+D/Total)
19.58 18.09 18.09 18.09 18.09 18.09 18.09 18.09 18.09 18.09 18.09 18.04
Grand Total 228,342 328,948 402,016 415,683 429,815 444,428 459,537 475,160 491,314 508,018 525,289 543,147

32 | P a g e
ECONOMIC DEVELOPMENT
With Caloocan City’s growing population and the rising demand for economic activities, there is a need to develop more strategies to address the issues of poverty and unemployment, provide opportunities for investments, and encourage the growth of commercial and other business establishments in the city. Those would serve as primary catalysts for a more balanced development of Caloocan. The city’s advantage is the presence of vacant land or open areas in the North which remain untapped and are highly suitable for further development. Considering that the current trends in both property and commercial development is the movement towards the north of Metropolitan Manila, Caloocan City is rightfully the gateway towards Northern Luzon and its peripheries such as Malabon, Navotas, Valenzuela, Quezon City, including Novaliches and Fairview and the Province of Bulacan.
DEVELOPMENT TREND
Development Growth
Growth of Commercial and Business Centers along Major Transit Points and Corridors
City’s several business center brought by various land using activities, have grown rapidly in number and density for the past ten (10) years. The changes eventually resulted to more economic opportunities and challenges as well.
Commercial areas in South Caloocan City grew in land area from 152.6 to 168.41 hectares. On the average, properties being use for commercial purposes increased in area about 1% annually. These businesses were mostly small and large retail stores, supermarkets, especially service shops, wet and dry markets, food service outlets, commercial and industrial product distributors, transport vehicle trading (heavy equipment, trucks, cars and motorcycle), hospitality services (hotels and ins), and shopping malls.
One can observe major commercial activities in North Caloocan City at vicinities surrounding the following locations:
Whole stretch and some junctions along
Epifanio de los Santos Avenue
Rizal Avenue Extension
General San Miguel Streets and Samson Road
Mabini Street
C-3 (5th Avenue)
10th Avenue
Tullahan-Santa Quiteria Road
Baesa Road
Along several roads within vicinities of Grace Park (east and west) and Bagong Barrio (Balintawak Estate)
Major infrastructure projects that are recently been completed or being proposed, forms the direction of business growth in South Caloocan City, particularly those surrounding A. Bonifacio Monument Circle and General San Miguel – A. Mabini Junction (Sangandaan). The said projects were generally proposed or implemented to improve mobility of people between major business centers in northern Metro Manila and northern suburbs of Bulacan. These significant transportation projects are the proposed North-South Commuter Railway from Tutuban to Malolos, the completed LRT Line 1 extension as part of “Closing the Loop” of various LRT lines, and Stage 10 (Segment 10) of NLEX Harbor Link Project. The North-South Commuter Line would have one (1) boarding station within South Caloocan City.

33 | P a g e
Other factors causing rapid business growth within the CBD of South Caloocan City are on-going operation of several transit terminals that eventually rendered Bonifacio Monument Area as major transit point of northern Metropolitan Manila.
In North Caloocan City, commercial areas are growing annually at an average of 33.2% from 2003 to 2013. Total commercial land area in 2003 was 39.44 hectares and rose to 52.47 hectares in 2013. Businesses in these zones were mostly small and large retail stores, supermarkets, specialty service shops, wet and dry markets, and food service outlets.
Location of commercial activities in North Caloocan City can be found at vicinities surrounding the following locations:
Junctions of Camarin-Susano Road and Camarin-Zabarte Road;
Major junctions within Phases II, IV and X of Bagong Silang Resettlement Project;
Kiko Road up to junction of Sampaloc Road;
Malaria-Barracks Road up to junction of Quirino Highway;
Whole stretch and junctions along Camarin –Susano Road;
Junction of Deparo Road and T. Samson Street; and
Junction of Quirino Highway and Apitong Road (Pangarap Village).
Expansion of Industrial Areas within Existing Industrial Zones
The long-established zones for industrial activities are expanding in number and land area. These industries are engaged generally in product (food and non-food) manufacturing, processing, packaging and warehousing activities.
In the last 10 years Industrial land area in North Caloocan City grew from 177.74 to 197.49 hectares or an added 19.76 hectares of land uses, with average increases of 1.10% annually. Industrial establishments generally thrive in Industrial Zones of Kaybiga, Bagbaguin, Llano, Bagumbong, Camarin, and Tala. However there are still few existing industrial plant and warehouse that could be found inside residential subdivisions particularly Amparo Subdivision that apparently infringes against the provisions of subdivision’s zoning classification. Similarly, cluster of industries can be seen in some parts of Bagumbong that is originally designated as Residential Zone under Zoning Ordinance 0369 S. 2003, but existed before the enactment of the said Ordinance.
In South Caloocan City, lands having industrial activities are larger than those lands being utilized for commercial businesses. The said areas increased in size by 3.2% in the last ten (10) years but still cover a significant 14.5% part of South Caloocan City. Parcels that are being used for industrial purposes largely cover Dagat-Dagatan Area, old districts of Grace Park (East and West), Bonifacio, Morning Breeze, Bagong Barrio (Balintawak Estate), and Baesa.
Rapid increase of Residential Land Area in North Caloocan City
In the past 10 years about 344.65 hectares of residential land area are added within several vacant properties in North Caloocan City. The total land cover with existing residential uses increased in average of 1.73% per year or 19.0% in 10 years. The said large sum of residential lands are generally located within new residential subdivisions, existing government relocation areas, CMP Projects, government and private low-rise residences, informal settlements, and newly occupied vacant residential lots. There are also low-rise private condominium and socialized housing complexes, currently being developed in Camarin area that may well alter the overall character of residential districts from typical landed housing to multi-level housing units.

34 | P a g e
Table 1-14. 10-Year Major Land Use Growth Trend – South and North Caloocan City
Land Use Classification Land Area (Ha.) 2003
Land Area (Ha.) 2013
10-Year Land Area Increase / Decrease
10-Year Increase
Annual Rate of Increase
2003-2013
North Caloocan City
Residential 1,837.18 2,186.35 349.17 19.0% 1.8%
Commercial 39.44 52.47 13.03 33.0% 2.9%
Industrial 177.74 197.49 19.76 11.1% 1.1%
South Caloocan City
Residential 545.62 561.07 15.45 2.8% 0.3%
Commercial 152.62 168.41 15.79 10.3% 1.0%
Industrial 191.44 197.61 6.17 3.2% 0.3%
Development Potentials
Availability of Areas Suitable for New Development
North Caloocan City has a total of 867.22 hectares or 21.84% of vacant land area that generally with moderate or no susceptibility to any natural hazard. These areas are vacant large parcels of land and unoccupied subdivision lots. Around 72.24% or total of 626.50 hectares of these vacant lands on different parts of North Caloocan City are found to be moderately to highly suitable for future development given the type of slope, type of soil and susceptibility to natural hazards of each parcel. Similar measures, 27.76% of vacant spaces or a total of 240.72 hectares are learnt to have poor to very poor suitability rating. Improving these vacant properties requires using more sustainable type of soil surface grading, cutting and filling without altering extensively the natural land form and surface drainages within and surrounding its environment. Most of the open grounds available for improvements are spread out in Llano, Deparo, Bagumbong and Camarin. Those areas not suitable for urban development (CRITICAL AREAS) are parcels near river ways and creeks and vacant subdivided lots with steeply rolling and undulating terrain -- stretching in some portions of Bagumbong, Camarin, Tala, Amparo and Pangarap.
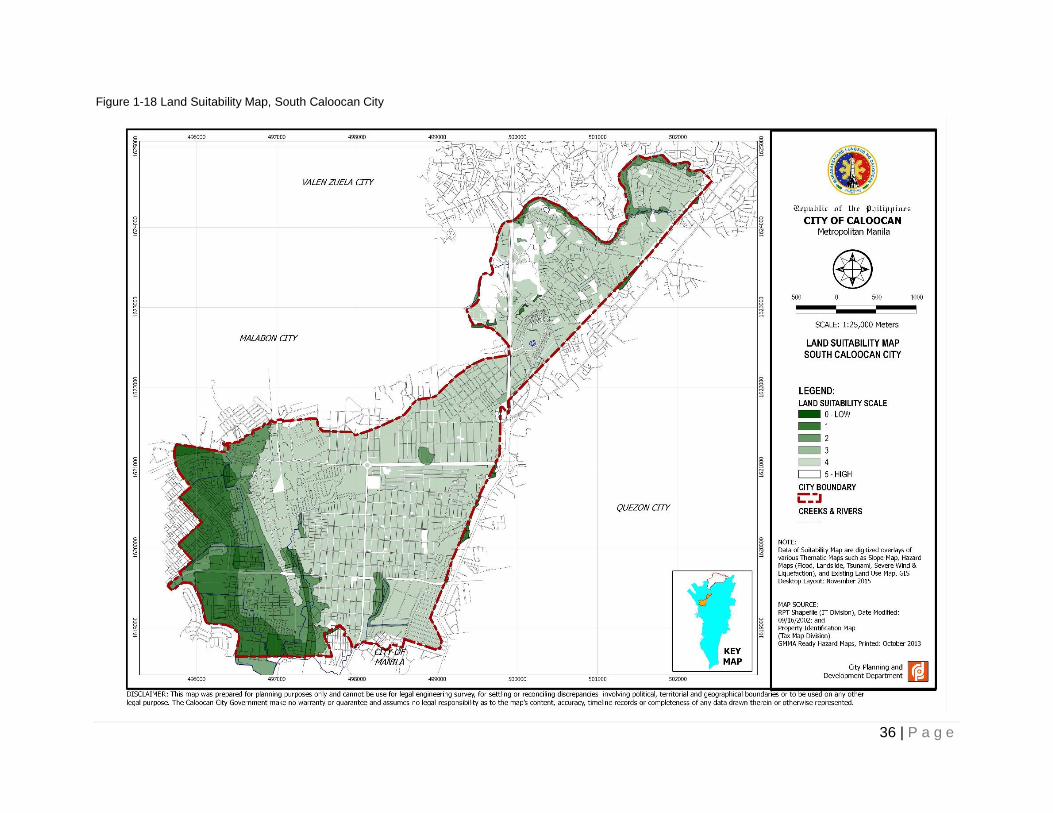
South Caloocan City, yet being considered as 95.10% built-up in terms of land area still have a total of 66.77 hectares or 4.90% vacant land that is available for future development. Roughly 86.16% of the said total is Moderately to Highly Suitable for future development based on each parcels slope classification and exposure to natural hazards. The developable spaces are generally located along North Luzon Expressway and in some portion of the old district of Baesa. Around major business center in Bonifacio district, a 2.5 hectare estate was included in the total developable plot which is formerly a shopping mall area that was raged in fire. However, there is a sum of 9.24 hectares of parcels with different sizes and location that can be considered as not suitable for land development, which locations are traced along Tullahan River within Baesa District. About 5.3 hectare contiguous property lying near Tullahan Bridge was included in this total.
Table[C1] 1-15: Suitability Analysis for Future Development Areas – Caloocan City 2013
Suitability Rating for Future Development Areas
South Caloocan City North Caloocan City
Area (Ha.) % Distribution Area (Ha.) % Distribution
Highly Suitable (0 - 3% Slope) 33.34 49.93% 220.86 25.47%
Moderately Suitable (3 - 8% Slope) 24.19 36.23% 405.64 46.77%

35 | P a g e
Suitability Rating for Future Development Areas
South Caloocan City North Caloocan City
Area (Ha.) % Distribution Area (Ha.) % Distribution
Not Suitable (8 - 18% Slope) 9.24 13.84% 133.12 15.35%
Not Suitable (18 - 30% Slope) - - 107.60 12.41%
TOTAL 66.77 100.00% 867.22 100.00%
General Land Use 2013
Vacant Land 66.77 4.90% 867.22 21.84%
Built-Up Area 1,295.73 95.10% 3,103.68 78.16%
Total Land Area 1,362.50 100.00% 3,970.90 100.00%
Future[C2] Development of New Road and Transportation Services
For the next ten (10) years, new roads and transportation projects that would cut across areas of Caloocan City, shall be implemented in Metropolitan Manila. These major projects in due course shall cause large changes in the City’s land use pattern particularly on those areas surrounding each project’s immediate location. Efficiency of traveling through the City’s future road network system using modern transport facilities would achieve one of the basic land use planning goals of the Caloocan City CLUP -- that is to shorten travel time and distances between journeys.
36 | P a g e
Figure 1-18 Land Suitability Map, South Caloocan City

37 | P a g e
Figure 1-19. Land Suitability Map, North Caloocan City

38 | P a g e
THE LOCAL CLIMATE CHANGE ACTION PLANNING FRAMEWORK
PLANNING CONTEXT AND APPROACH
The City hereby promotes the following Vision and Goal for Climate Change, the achievement of which is operationalized in the succeeding Framework Diagram:
Vision
“A City peopled by resilient, peace-loving and dynamic communities, living in a safe and ecologically balanced environment”.
Goals
1. A progressive City that provides excellent urban services and amenities;
2. A harmonious community with utmost capacity to deter the effect of natural and human-made hazards and other calamities that threatens the general welfare, health and safety of the population particularly woman, children and the differently-abled city residents.
3. A City that efficiently use, acquire and manage land as a limited resource.
4. Governance that advances acceptable and orderly development of growth and progress.
5. A vibrant Local Economy that promotes key investment opportunities and balances physical development with sustainable use of local resources.
6. A City that promotes sustainable development, preservation of the natural environment and the conservation of historical and cultural heritage.
Figure 1-20. Climate Change Framework

39 | P a g e
The Caloocan City Local Climate Change Action Plan was a local adaptation of the National Framework Strategy on Climate Change. As such it is formulated within the context of the City’s sustainable development goals and governance that affects the City’s ability to respond to climate change as laid out in the 2017-2019 City Comprehensive Development Plan and the 2016-2025 Disaster Risk and Climate Change Adaptive City Comprehensive Land Use Plan (CLUP).
The changing climate conditions caused by global warming will have a myriad of impacts and underscore the vulnerabilities in all sectors of society and economy. The LCCAP will require resources and the cooperation of all the sectors. Strategies geared towards climate change, therefore, moved beyond the environmental challenges and was closely linked with economic targets and social sustainability.
Increasing temperatures, changing rainfall patterns, sea level rise, and extreme weather events form the backdrop upon which the City endeavors to pursue its development goals. These factors affects the food, water, health infrastructure, energy and the society. The ability of the City to address such impacts and vulnerabilities of the sectors affect the facility by which the sustainable development is pursued.
The LCCAP identified Key Result Areas (KRAs) to be pursued I key climate-sensitive sectors in addressing he adverse effects of climate change both under adaptation and mitigation. In order to achieve the Key Result Areas (KRAs), cross-cutting strategies were likewise given attention. As means of implementation, the framework puts forward multi-stakeholder partnerships, financing, valuation and policy planning and mainstreaming.
The following diagram specifically illustrates the City’s climate change framework, taking into account how climate change impacts and vulnerabilities shall be addressed by adaptation, mitigation and cross-cutting strategies and supported by the means of implementation- which would eventually lead to achievement of the goal.
Figure 1-21. Climate Change Framework

40 | P a g e
Chapter Two
VULNERABILITY AND ADAPTATION ASSESSMENT
RESULTS
GEOLOGIC HAZARD ASSESSMENT
Climate change, involving both natural climate variability and anthropogenic global warming, has been a major worldwide concern, particularly with the publication of the Fourth Assessment Report (AR4) of the Intergovernmental Panel on Climate Change. Considering the archipelagic nature of the Philippines and despite its being a very minor emitter of greenhouse gases, adaptation to climate change has been the Government’s national policy. The importance of expediting these climate change-related adaptation measures was highlighted by a string of geo-meteorological-related disasters, specifically triggered by landslides and floods consequent to unusual weather conditions. Recognition of the pertinent issues and the extant challenges point to the urgent need for mainstreaming both geo-meteorological-related disaster risk management and climate change adaptation measures in the light of changing climate conditions.
GEOHAZARDS
The GMMA Ready Project that started in 2011 identified at least six major natural hazards that
could eventually affect the Greater Metropolitan Manila Area in the future. The Project, a multi-
lateral aid granted to CSAND agencies, conducted the Hazard Profiling and Risk Assessments
within the Project boundaries and provided related technical assistance to local government units
(LGUs), concerned national government agencies, academic institutions and civil society
organizations. The Project aims to decrease the vulnerability of the Greater Metro Manila Area
(GMMA) to natural hazards and increase the resilience of concerned agencies, by strengthening
their institutional capacities in managing disaster and climate change risks (UNDP, 2011).
Hazards identified can be classified into climate and geologic hazard. Geologic hazards are
ground shaking, liquefaction and tsunami. Meanwhile the climate related hazards are flooding,
rain-induced landslide and severe winds.
Flooding
Flooding due to monsoon rains and typhoon is anticipated to intensify due to climate change. Recurrent problems of flood and destruction of properties and loss of lives due to typhoons is expected to aggravate this coming rainy season.
Severe flood problems in the city are mostly due to river overflow, excessive rainfall and inadequate channel capacity. In some areas within higher elevation, accidents from flooding hazards (such as flash floods) are cause by erosion and landslides. These flood problems gave rise to the loss of property and some lives (on isolated cases) as well. Those areas identified at risk on this action plan report are classified as potential disaster areas; taking into account its physical condition and/or limitation, and known case of disaster or accident occurred within because of flood.
Based on the study conducted under the GMMA Ready Project, 15 barangays in the South Caloocan will be susceptible to high flooding and 5 barangays will have a very high flooding. Meanwhile, 20 barangays in the North Caloocan will be vulnerable to high flooding and 18 barangays to a very high flooding.

41 | P a g e
Table No. 2-01: Barangays and Estimated Population to be Affected by Flood
Bgy. No.
Susceptibility Levels
Land Area (hectares)
Population (2015)
Barangay No.
Susceptibility Levels Land Area (hectares)
Population (2015)
SOUTH CALOOCAN
16 High 6.25 1,450 70 High 5.64 4,318
18 High 10.34 3,376 75 Moderate to High 4.98 3,806
20 High 11.28 2,771 76 Moderate to High 3.04 4
22 High 5.71 901 95 High to very High 5.82 2,549
33 High 5.45 10,296 113 High 0.38 22
34 High 5.36 2,090 114 High 0.62 569
36 High 2.44 2,675 117 High 1.04 369
37 High 2.54 1,254 118 High 0.16 281
37 Very High 2.69 1,326 118 Very High 4.79 8,447
43 High 2.00 2,123 119 High 1.49 285
46 Very High 1.06 365 120 High 1.51 2,182
49 High 1.23 1,535 120 Very High 0.60 873
49 Very High 1.23 1,535 128 Moderate to High 1.19 946
52 High 0.35 272 159 High 69.29 21,855
59 Very High 1.81 1,946 160 Moderate to High 47.32 10,357
63 High 0.92 753 162 Very High 0.01 2
69 High 3.19 3,395 163 Very High 0.02 8
164 Very High 0.93 227
Total 38,066 57,101
NORTH CALOOCAN
166 Moderate to High 189.96 19,864 177 Very High 3.95 1,672
167 High 29.00 8,713 178 High 3.73 1,282
168 High 35.55 3,750 178 Very High 7.46 2,564
169 High 12.95 1,054 179 High 13.42 2,630
169 Very High 0.13 10 179 Very High 19.17 3,757
169 Very High 1.29 105 180 High 3.75 1,191
170 High 2.42 643 180 Very High 6.26 1,986
170 High - 181 High 6.70 1,873
170 Very High 1.45 386 181 Very High 9.57 2,675
171 High 34.52 6,305 182 High 4.34 315
172 Very High 8.26 1,311 182 Very High 6.20 449
173 Very High 7.60 1,236 185 High 4.15 1,705
174 High 3.53 518 185 Very High 6.92 2,842
174 Very High 2.65 389 186 High 8.22 1,176
175 High 26.78 6,438 186 Very High 5.14 735
175 Very High 40.17 9,658 187 High 1.53 415
176 High 50.92 23,926 187 Very High 0.77 207
176 Very High 76.39 35,889 188 High 4.23 1,915
177 High 5.92 2,508 188 Very High 3.02 1,368
Total 122,703 30,759
Grand Total
160,769 87,860

42 | P a g e
Figure No. 2-01: Flood Map- North Caloocan (PAG-ASA-DOST, October 2013)

43 | P a g e
Figure No. 2-02: Flood Map- South Caloocan (PAG-ASA-DOST, October 2013)

44 | P a g e
Rain-Induced Landslide
From the study conducted by Metro Manila Earthquake impact Reduction Study, (MMEIRS),
GMMA RAP and MGB, two barangays in South Caloocan City are high susceptible to rain-
induced landslide. These barangays were formerly a garbage dumpsite. Meanwhile in North
Caloocan portions of Barangays 178 and 179 are moderately susceptible while part of Barangays
168 and 175 are highly susceptible, this is in NW of Deparo Subdivision and Sitio Matarik
respectively.
Table No. 2-02: Barangays and Estimated Population to be Affected by Rain-Induced Landslide
Barangay No.
Susceptibility Levels
Land Area (hectares)
Estimated Population (2015)
SOUTH CALOOCAN
8 HIGH 1.47 1,149
12 HIGH 1.97 1,567
Total 3.44 2,716
NORTH CALOOCAN
168 HIGH 0.44 47
175 HIGH 7.58 1,823
Total 8.02 1,870
Grand Total 11.46 4,586
Sea-level Rise and Land Subsidence
Land subsidence resulting from excessive extraction of groundwater is particularly acute in East Asian countries. Some Philippine government sectors have been to recognize that the sea-level rise of one to three millimeters per year due to global warming is a cause of worsening floods around Manila Bay.12 Enhance flooding and tidal incursion are not only deleterious effects of subsidence. It can trigger minor seismicity. Based on the study conducted on 2003, 5-9 cm/per year of subsidence were observed in Metro Manila during 1991-2003.
12 “Global sea-level rise is recognized, but flooding from anthropogenic land subsidence is ignored around northern Manila Bay, Philippines by Kevin S. Rodolfo and Fernando P. Siringan

45 | P a g e
Figure No. 2-03: Rain-Induced Landslide – North Caloocan (MGB, DENR, October 2013)

46 | P a g e
Figure No. 2-04: Rain-Induced Landslide – South Caloocan (MGB, DENR, October 2013)

47 | P a g e
PHILIPPINE GREENHOUSE GAS EMISSION Source: Climate Action Tracker (Page last updated: 2nd November 2016)
Rating
Figure No. 2-05
Note: More information here on the fair emissions range per effort sharing category.
Assessment The Philippines’ emissions pathway towards 2030, as proposed in its Intended Nationally Determined Contribution (INDC), could be rated “sufficient,” however the high uncertainty in its envisioned emissions pathway leads to a “medium” rating. The Philippines’ reference—or business as usual (BAU)—scenario, against which the target is measured, has not yet been published and the government has shared no details explaining how the NDC target relates to the LULUCF sector, nor how this will be quantified. Recent statements from the President of the Philippines regarding his country’s position on the Paris Agreement (King, 2016b), as well as previous announcements on increasing coal-fired power capacity, add significantly to the uncertainty as to whether the government intends to take substantial action in adopting the policy changes required to meet its INDC target. This lack of details on how the target will be achieved and the role that the LULUCF sector will play in it, leaves the option open for achieving the target by increasing carbon sinks (LULUCF) which is not compatible with what is needed—or fair—to keep global warming below 2°C. Current policies indicate a rapid and ongoing increase in greenhouse gas emissions, which appear inconsistent with meeting the INDC goals
In its INDC, submitted on 1 October 2015, the Philippines included a conditional greenhouse gas reduction target of 70% below business as usual (BAU) levels by 2030. The INDC states that the target is conditional on “the extent of financial resources, including technology development & transfer, and capacity building, that will be made available to the Philippines.” The target covers all emissions from all sectors, including land use, land use change and forestry (LULUCF) (Government of the Philippines, 2015).

48 | P a g e
Green House Gas (GHG) Inventory
Greenhouse gases trap heat in the atmosphere, which makes the earth warmer, thus resulting to climate change. Carbon dioxide is the most important greenhouse gas emitted by humans. Greenhouse gases come from all sorts of everyday activities, such as using electricity, heating our homes and driving around town. The three top most gases that contributes to the global warming are carbon dioxide (CO2 ) which is 77% of the global anthropogenic emissions, methane (CH4), 14% and nitrous oxide (N2O).
Greenhouse emissions are classified into 3 main sources or scopes. Scope 1 refers to direct emissions from fuel that vehicles consume, Scope 2 is the indirect emissions that come mostly from electricity consumption and Scope 3 refers to other emissions not falling under Scopes 1 and 2.
Caloocan City Green House Gas (GHG) Inventory Table No. 4-06: Estimated GHG Emission due to mobile fuel combustion13
Year
Motor Vehicle
Registered Per Type of fuel used/1
Estimated Gross Sale of Fuels
(PhP)/2
Estimated Price Per
Liter/3
Estimated Liters sold
kgCO2 (li x 2.30)
kgCH4 (li x emission factor/4 x GWP/5)
kgN2O (li x emission factor/6 x GWP/7)
TOTAL GHG Emission (kgCO2)
2013 Gas 165,340,417.95 31.52 5,245,571.64 16,064,814.76 120,071.13 172,369.48 12,357,255.38
Diesel 89,104,231.61 33.78 2,637,780.69 7,148,385.66 7,755.08 86,677.47 7,242,818.21
2014 Gas 66,856,696.68 60.62 2,183,432.29 5,021,894.26 49,978.77 71,747.59 5,143,620.61
Diesel 25,054,662.19 32.89 761,771.43 2,064,400.56 2,239.61 25,031.81 2,091,671.98
2015 Gas 72,365,216.36 19.33 3,743,673.89 8,610,449.95 85,692.70 123,017.12 8,819,159.77
Diesel 30,352,924.34 19.92 1,523,741.18 4,129,338.60 4,479.80 50,070.14 4,183,888.54
Table No. 4-07: Estimated GHG Emission due to Purchased Electricity14
Year
kWh used per Type of Use/1 GHG Emission kgCO2 /2
(kWh used x emission factor for Luzon grid)
Residential Commercial Industrial Streetlights Total Residential Commercial Industrial Streetlights Total
2013 478,557,000 209,503,000 241,261,000 4,579,000 933,900,000 48,371,083 08,732,057 25,214,459 2,376,501 484,694,100
2014 482,433,000 211,259,000 243,674,000 4,638,000 942,004,000 250,382,727 09,643,421 26,466,806 2,407,122 88,900,076
2015 510,093,000 221,480,000 249,974,000 4,640,000 986,187,000 264,738,267 114,948,120 129,736,506 2,408,160 511,831,053
TOTAL 1,471,083,000 642,242,000 734,909,000 13,857,000 2,862,091,000 763,492,077 333,323,598 381,417,771 7,191,783 1,485,425,229
13 Source:
/1 – Number of Registered Vehicles Per Type of Fuel Used, Land Transportation Office-Caloocan City District Office, August 2011 /2 – Gross Sale of Registered Gasoline Station in Caloocan City, Business Permits and Licensing Office, April 2015 /3 – Gasoline and Diesel Price – Philippine Peso per Liter, Webpage, Index Mundi, November 2016 /4 – emission factor for gas – 0.001090 kg/CH4/li /5 – Global Warming Potential for gas – 21 /6 – emission factor for diesel – 0.000140 kg/li /7 – Global Warming Potential for diesel – 310
14 Source:
/1 – kWH Sales Per Type of Use, MECO, March, 2016 /2 – emission factor for Luzon Grid – 0.519 kg CO2/kWh

49 | P a g e
Table 4-08: Estimated GHG Emission from waste generated in operations15
Waste Generated/1 Waste Treatment
Proportion (percent)
Average emission factor of waste
treatment method (kg CO2/ton)
GHG emission ((kg CO2) kg ton
566,408.88 566.408 Landfill 77.6 300 131,859.78
187,156.88 187.157 Recycled 22.0 10 411.745
TOTAL 132,271.525
ELEMENTS, SECTORS AND INSTITUTIONS EXPOSED TO CLIMATE CHANGE HAZARDS
Table 2-03. Critical Economic Facilities by Barangay Location
BGY. NO NUMBER OF ECONOMIC
FACILITIES FLOOD
RAIN INDUCED LANDSLIDE
ZONE 1
008 7 MODERATE
(Flood Level = 0.5m) HIGH
012 9 MODERATE
(Flood Level = 0.5m) HIGH
ZONE 2
014 10 MODERATE
(Flood Level = 1m) _
016 3 HIGH
(Flood Level = 1.1.5m) _
020 2 MODERATE to HIGH _
021 3 LOW to MODERATE _
022 8 MODERATE to HIGH (Flood Level = 0to1m)
_
023 2 MODERATE _
ZONE 3
025 5 MODERATE
(Flood Level = 1m) _
028 5 MODERATE
(Flood Level = 1m) _
029 1 MODERATE
(Flood Level = 1m) _
030 MODERATE
(Flood Level = 1m) _
030 10 MODERATE
(Flood Level = 1m) _
032 4 MODERATE
(Flood Level = 1m) _
033 7 MODERATE to HIGH _
034 HIGH PEIS 8.5 INUNDATED
035 HIGH PEIS 8.5 NONE
15 Source:
/1 – Summary Showing the Quantity and Composition of Waste Disposal from all sources, WACS, ESS, 2015

50 | P a g e
BGY. NO NUMBER OF ECONOMIC
FACILITIES FLOOD
RAIN INDUCED LANDSLIDE
ZONE 4
036 MODERATE to HIGH (Flood Level = 1.5m)
_
037 VERY HIGH _
039 1 LOW to MODERATE (Flood Level = 0.1m)
_
043 1
LOW to HIGH
(Flood Level = 1m to 1.5m)
_
ZONE 5
056 MODERATE _
057 1 LOW to MODERATE (Flood Level = 0.5m)
_
ZONE 6
059 1 LOW to
VERY HIGH (Flood Level = 2m)
_
060 4 MODERATE
(Flood Level = 0.5-1.0m) _
063 3 LOW to HIGH
(Flood Level = 1.0m) _
066 1 MODERATE
(Flood Level = 1.0m) _
067 MODERATE
(Flood Level = 0.3m) _
070 3 HIGH
(Flood Level = 1.0m) _
ZONE 7
075 3 MODERATE to HIGH (Flood Level = 0.3 TO
0.5m) _
076 7 MODERATE to HIGH
(Flood Level = 1m) _
ZONE 9
095 2 HIGH to
VERY HIGH (Flood Level = 1m)
_
102 1 LOW to
MODERATE (Flood Level = 0 to 1m)
_
ZONE 10
106 8 MODERATE _
107 1 LOW to
MODERATE (Flood Level = 1m)
_
108 1 LOW to
MODERATE _

51 | P a g e
BGY. NO NUMBER OF ECONOMIC
FACILITIES FLOOD
RAIN INDUCED LANDSLIDE
109 3 LOW to
MODERATE (Flood Level = 1m)
_
110 6 LOW to
MODERATE (Flood Level = 1m)
_
111 2 LOW to
MODERATE (Flood Level = 0.5 to 1m)
_
112 5 LOW _
113 3 LOW to
MODERATE (Flood Level = 0.5 to 1m)
_
119 3
LOW to VERY HIGH
(Flood Level = 1.5m to 2m)
_
ZONE 11
120 3
LOW to VERY HIGH
(Flood Level = knee-deep/1.5m)
_
ZONE 14
159 1 High
(Flood Level = 1.5m) _
160 1 MODERATE
to HIGH (Flood Level = 1.5m)
_
162 5 LOW to
VERY HIGH (Flood Level 3 to 6m)
_
163 4 LOW to
VERY HIGH (Flood Level = 0.4m)
_
164 1 LOW to
VERY HIGH _
ZONE 15
165 4 LOW to
MODERATE (Flood Level = up to 1.5m)
_
166 12 MODERATE to
HIGH LOW
167 10 MODERATE to
HIGH LOW
168 22 LOW to
MODERATE HIGH
169 3 LOW to
MODERATE _
170 3
LOW to VERY HIGH
(Overflow of Creek, Flood Level = 12 to 1.5m)
LOW

52 | P a g e
BGY. NO NUMBER OF ECONOMIC
FACILITIES FLOOD
RAIN INDUCED LANDSLIDE
171 13 LOW to HIGH _
172 5 LOW to VERY HIGH _
173 3 LOW to
VERY HIGH (Flood Level 1m)
_
174 5 LOW to
VERY HIGH (Overflow of Creek)
_
175 22 LOW to
VERY HIGH HIGH
176 52 LOW to
VERY HIGH _
177 16 HIGH to
Very HIGH (Flood Level = 1.5 t0 3m)
_
178 19 HIGH to
Very HIGH (Flood Level = >1.5m)
LOW to MODERATE
ZONE 16
179 16 LOW to
VERY HIGH (Flood Level 1 to 1.5m)
LOW to MODERATE
180 2 HIGH to
VERY HIGH _
181 LOW to
VERY HIGH _
182 1 LOW to
VERY HIGH _
183 MODERATE
(Flood Level = 0.5m) _
184 3 MODERATE
(Flood Level = 1m) _
185 8
LOW (Flood Level=6 inches)
to VERY HIGH
(Flood Level = 0.5m,1.0-1.5m)
_
186 2 LOW to
VERY HIGH _
187 3 LOW to
VERY HIGH _
188 4 LOW to
VERY HIGH _
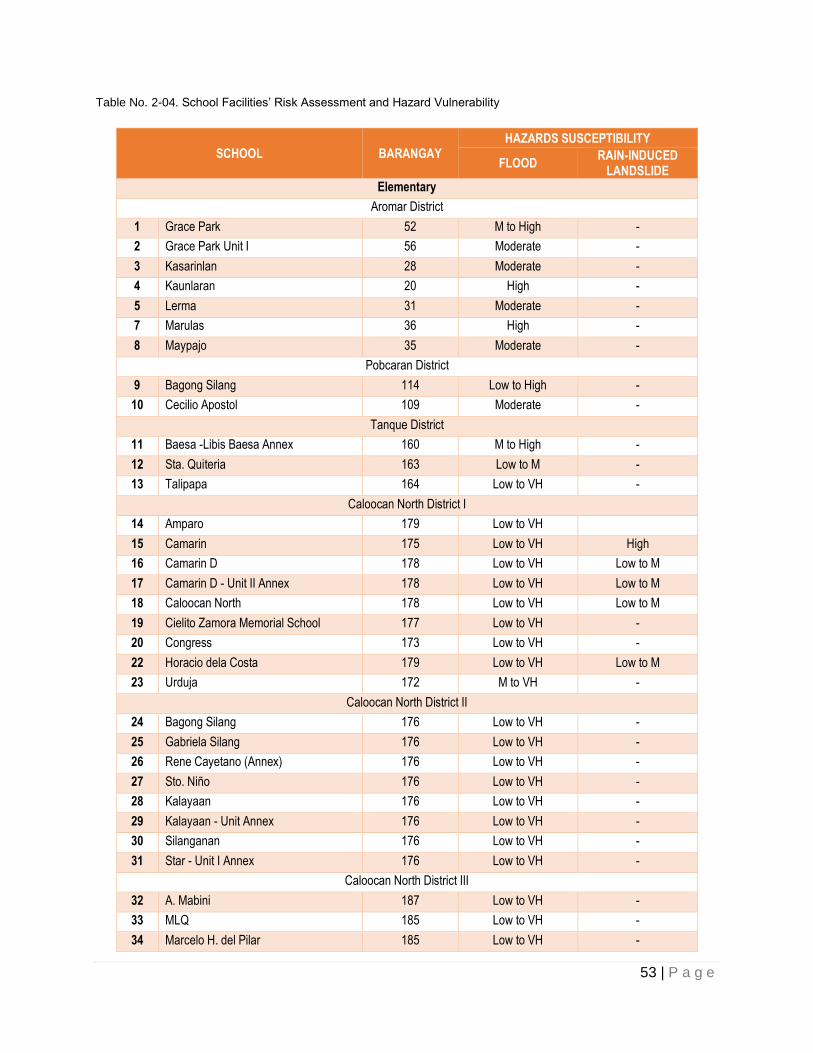
53 | P a g e
Table No. 2-04. School Facilities’ Risk Assessment and Hazard Vulnerability
SCHOOL BARANGAY HAZARDS SUSCEPTIBILITY
FLOOD RAIN-INDUCED
LANDSLIDE
Elementary
Aromar District
1 Grace Park 52 M to High -
2 Grace Park Unit I 56 Moderate -
3 Kasarinlan 28 Moderate -
4 Kaunlaran 20 High -
5 Lerma 31 Moderate -
7 Marulas 36 High -
8 Maypajo 35 Moderate -
Pobcaran District
9 Bagong Silang 114 Low to High -
10 Cecilio Apostol 109 Moderate -
Tanque District
11 Baesa -Libis Baesa Annex 160 M to High -
12 Sta. Quiteria 163 Low to M -
13 Talipapa 164 Low to VH -
Caloocan North District I
14 Amparo 179 Low to VH
15 Camarin 175 Low to VH High
16 Camarin D 178 Low to VH Low to M
17 Camarin D - Unit II Annex 178 Low to VH Low to M
18 Caloocan North 178 Low to VH Low to M
19 Cielito Zamora Memorial School 177 Low to VH -
20 Congress 173 Low to VH -
22 Horacio dela Costa 179 Low to VH Low to M
23 Urduja 172 M to VH -
Caloocan North District II
24 Bagong Silang 176 Low to VH -
25 Gabriela Silang 176 Low to VH -
26 Rene Cayetano (Annex) 176 Low to VH -
27 Sto. Niño 176 Low to VH -
28 Kalayaan 176 Low to VH -
29 Kalayaan - Unit Annex 176 Low to VH -
30 Silanganan 176 Low to VH -
31 Star - Unit I Annex 176 Low to VH -
Caloocan North District III
32 A. Mabini 187 Low to VH -
33 MLQ 185 Low to VH -
34 Marcelo H. del Pilar 185 Low to VH -

54 | P a g e
SCHOOL BARANGAY HAZARDS SUSCEPTIBILITY
FLOOD RAIN-INDUCED
LANDSLIDE
35 NHC 186 Low to VH -
36 Pag-asa 176 Low to VH -
37 Pangarap 181 Low to VH -
38 Tala 186 Low to VH -
Caloocan North District IV
39 Bagbaguin 165 Low to M -
40 Bagumbong 171 Low to High -
41 Bagumbong - Annex 171 Low to High -
42 Caybiga 166 M to High -
43 Deparo 168 Low to High -
44 Llano 167 Low to High -
45 Sampaguita 175 Low to VH -
Secondary
1 Ma. Clara High School 109 Moderate -
2 M. B. Asistio, Sr. High School 14 Moderate -
3 M. B. Asistio, Sr. - Unit I 14 High High 8
4 Maypajo High School 35 Moderate -
5 Kasarinlan High School 28 Moderate -
6 Talipapa High School 164 Low to Very High -
7 Caybiga High School 165 Low to Moderate Low -
8 Deparo High School 168 Low to High Low High
9 Llano High School 167 Low to High Low Low
10 Sampaguita High Schl. 175 Low High
11 Cielito Zamora 172 Moderate Low 8
12 Urduja Business High School 172 Moderate -
13 Amparo High School 179 High to Very High Low to Moderate
14 AHS-H. Dela Costa -Annex 179 Moderate Low to Moderate
15 Pangarap High School 182 Moderate -
16 Mountain Heights High School 183 Moderate -
17 NHC High School 186 Moderate -
18 Manuel L. Quezon High School 185 Moderate -
19 Tala High school 188 Moderate -
20 Bagong Silang High School 176 Low to Very High -
21 Benigno Aquino, Jr. 176 Low to Very High -
22 Kalayaan National HS 176 Moderate -
23 Caloocan National Science & Tech. 173 Moderate -

55 | P a g e
Table No. 2-05. Hospitals and Health Centers by Hazards Susceptibility
HEALTH FACILITIES BARANGAY HAZARD SUSCEPTIBILITY
FLOOD RAIN-INDUCED
LANDSLIDE
Hospitals
1 Martinez Memorial Hospital 32 Moderate
2 Our Lady of Grace Hospital 61 Low
3 Our Lady of Lourdes Hospital of Caybiga, Inc.
166 M to H
4 Markvim Hospital 177 Low to VH
5 Nodado General Hospital 175 L to M
6 North Caloocan Doctor's Hospital 185 Low to VH
7 Caloocan City Medical Center 15 Low
8 Dr. Jose Rodriguez Memorial Hospital 186 Low to VH
Health Centers
1 Julian Felipe Health Center 8 Moderate High
2 Barangay 12 Health Center 12 Moderate High
3 Barangay 14 Health Center 14 Moderate
4 Barangay 18 Health Center 18 High
5 Ana Health Center 28 Moderate
6 A. A. Zapa Puericulture Center 34 High
7 Marulas Puericulture Center 36 M to H
8 Barangay 118/120 Health Center 120 L to VH
9 Calaanan Puericulture Center 53 L to M
10 Francisco Health Center 75 M to H
11 Grace Park Health Center 108 L to M
12 Barrio San Jose Health Center 128 M to H
13 Baesa Health Center 161 High
14 Sta. Quiteria Health Center 162 L to VH
15 Talipapa Health Center 164 Very High
16 Bagbaguin Health Center 165 L to M
17 Llano Health Center 167 Low to high Low
18 Deparo Health Center 168 L to M High
25 Urduja Health Center 172 Very High
26 Bagumbong Health Center 171 Low to high
27 Bagumbong Dulo 173 L to VH
28 Camarin Lying-in 174 L to VH
29 Camarin Health Center 175 L to VH High
30 Brixton Health Center 175 L to VH High
31 Bagong Silang Health Center Ph. 1 176 L to VH
32 Bagong Silang Health Center Ph. 2 176 L to VH
33 Bagong Silang Health Center Ph. 7 176 L to VH
34 Bagong Silang Health Center Ph. 8 176 L to VH
35 Bagong Silang H. C. Ph. 9 176 L to VH
36 Bagong Silang Health Center Ph. 10 176 L to VH

56 | P a g e
HEALTH FACILITIES BARANGAY HAZARD SUSCEPTIBILITY
FLOOD RAIN-INDUCED
LANDSLIDE
37 Parkland Health Center 177 L to VH
38 Cielito Health Center 177 L to VH
39 Barangay 178 A Health Center 178 L to VH Low to Moderate
40 Barangay 178 B 178 L to VH Low to Moderate
41 Amparo Health Center 179 L to VH Low to Moderate
42 Pangarap Health Center 181 Very High
43 Malaria Health Center 185 L to VH
44 Tala Health Center 188 L to VH
Table No. 2-06. Location of Informal Settler Families (ISFs) By Hazard Susceptibility
DANGER AREAS (Creek, Riverside, Canals, Esteros and Under the
Bridge) BARANGAY
HAZARD SUSCEPTIBILITY
FLOOD RAIN-INDUCED
LANDSLIDE
1 Cantarilla Creek - 212 families 1 Low Low
2 Low Low
4 Low Low
2 Caloocan Navotas River - 689 families 8 Low to Moderate High
12 Moderate High
14 Moderate Low
16 High Low
18 High Low
20 High Low
28 Moderate Low
3 Casili Creek - 1,402 families 17 Moderate Low
19 Moderate Low
21 Low to Moderate Low
29 Moderate Low
31 Moderate Low
32 Moderate Low
33 Moderate to High Low
34 High Low
35 Moderate Low
43 High Low
46 Low Low
49 Very High Low
59 Very High Low
63 Moderate Low
65 Low Low
66 Moderate Low
67 Moderate Low
70 High Low

57 | P a g e
DANGER AREAS (Creek, Riverside, Canals, Esteros and Under the
Bridge) BARANGAY
HAZARD SUSCEPTIBILITY
FLOOD RAIN-INDUCED
LANDSLIDE
72 Low Low
75 Moderate to High Low
76 Moderate to High Low
4 Estero de Maypajo - 374 families 35 Moderate Low
5 Maligaya Creek - 555 families 118 Low to Very High Low
120 Low to Very High Low
6 Tullahan River - 341 families 160 Moderate to High Low
161 Low Low
162 Low to Very High Low
163 Low Low
164 Low Low
7 Bisalaw Creek - 202 families 166 Moderate to High Low
8 Bignay Llano Creek - 104 families 167 Low to High Low
9 Camarin Creek (Pasong Palad) - 398 families
171 Low to High Low
172 None to Very High Low
173 Low to Very High Low
175 Low to Very High High
177 None to Very High Low
10 Bagong Silang Creek - 174 families 176
Ph. 7 Low to Very High Low
8 Low to Very High Low
9 Low to Very High Low
10 Low to Very High Low
11 Matarik Creek (B. Silang Creek) - 725 families
174 Low to Very High Low
175 Low to Very High High
178 Low to Very High Low to Moderate
179 Low to Very High Low to Moderate
180 Low to Very High Low
187 Low to Very High Low
12 Sapang Alat River (Marilao Creek) - 1,665 fam.
181 Low to Very High Low
182 Low to Very High Low
184 Moderate Low
185 Moderate to VH Low
186 Low to Very High Low

58 | P a g e
Table No. 2-07. Police Stations by Hazards Susceptibility
POLICE STATION/ SUBSTATION BARANGAY
HAZARD SUSCEPTIBILITY
FLOOD RAIN-INDUCED
LANDSLIDE
1 PCP 4 124 Low to Very High -
2 PCP 3 118 Low to High -
3 PCP 7 23 High -
4 PCP 9 31 High -
5 PSB 36 36 Moderate to High -
6 PCP 8 16 High -
7 North Extension PCP 13 175 Very High High
8 North Extension PCP 14 176 Very High High
9 Sub-Station 4 175 Very High High
10 PCP 6 162 Very High -
11 PCP 16 179 Very High -
12 PCP 17 180 Very High -
13 PCP 18 181 Very High -
14 PCP 19 182 Very High -
15 PCP 20 185 Very High -
16 PCP 21 186 Very High -
17 PCP 23 177 Very High -
18 Sub-Station 5 176 Very High -
19 PCP 22 166 Moderate to High -
Table 2-08. Fire Stations by Hazards Susceptibility
FIRE STATION/ SUBSTATION BARANGAY HAZARD SUSCEPTIBILITY
FLOOD RAIN-INDUCED
LANDSLIDE
1 Central Fire Sub-Station 80 Low -
2 Bagong Barrio Fire Sub Station 146 Low -
3 Barrio San Jose Fire Sub station 128 M to H -
4 4th Ave. Fire Sub Station 51 Low -
5 Maypajo Fire Sub Station 34 High -
6 B.F. Homes Fire Sub Station 169 M to VH -
7 Talipapa Fire Sub Station 164 Very High -
8 Kaybiga Fire Sub Station 166 M to H -
Table No. 2-09. Critical Institutional Facilities as of 201416
BARANGAY CRITICAL FACILITIES FLOOD RAIN-INDUCED LANDSLIDE
8 Barangay Hall Moderate
(Flood level = 0.5m) High
16 Evaluated base on GMMA Ready Risk Assessment Project’s Hazard Mapping

59 | P a g e
BARANGAY CRITICAL FACILITIES FLOOD RAIN-INDUCED LANDSLIDE
12 Barangay Hall Moderate
(Flood level = 0.5m) -
14 Barangay Hall Moderate
(Flood level = 1m) -
20 Barangay Hall Moderate to High
34 Barangay Hall High _
37 Barangay Hall Very High _
16 Barangay Hall High (Flood level = 1.1.5m)
_
22 Barangay Hall Moderate to High
(Flood level = 0to1m) _
25 Barangay Hall Moderate
(Flood level = 1m) _
30 Barangay Hall Moderate
(Flood level = 1m) _
33 Barangay Hall Moderate to High _
35 Barangay Hall Moderate
(Flood level = 1m) _
18 Barangay Hall High
(Flood level = 1.1.5m) _
23 Barangay Hall Moderate _
28 Barangay Hall Moderate
(Flood level = 1m) _
31 Barangay Hall Moderate
(Flood level = 1m) _
32 Barangay Hall Moderate
(Flood level = 1m) _
36 Barangay Hall Moderate to High
(Flood level = 1.5m) _
119 Barangay Hall Low to
Very High (Flood level = 1.5m to 2m)
_
21 Barangay Hall Low to Moderate _
29 Barangay Hall Moderate
(Flood level = 1m) _
43 Barangay Hall Low to High
(Flood level = 1m to 1.5m) _
109 Barangay Hall Low to Moderate
(Flood level = 1m) _
113 Barangay Hall Low to Moderate
(Flood level = 0.5 to 1m) _
49 Barangay Hall Low to Very High
(Flood level = 0.5m) _
60 Barangay Hall Moderate
(Flood level = 0.5-1.0m) _
76 Barangay Hall Moderate to High (Flood level = 1m)
_
110 Barangay Hall Low to Moderate
(Flood level = 1m) _

60 | P a g e
BARANGAY CRITICAL FACILITIES FLOOD RAIN-INDUCED LANDSLIDE
116 Barangay Hall Low _
118 Barangay Hall Low to High
(Flood level = 2m) _
120 Barangay Hall Low to Very High
(Flood level = knee deep/1.5m)
_
122 Barangay Hall Moderate
(Flood level = 0.5 to 1m) _
125 Barangay Hall Moderate
(Flood level = 0.5 to 1m) _
128 Barangay Hall Moderate to High
(Flood level - 1.5 to 2m) _
53 Barangay Hall Low to Moderate
(Flood level = 0.5m) _
57 Barangay Hall Low to Moderate
(Flood level = 0.5m) _
59 Barangay Hall Low to Very High (Flood level = 2m)
_
66 Barangay Hall Moderate
(Flood level = 1.0m) _
67 Barangay Hall Moderate
(Flood level = 0.3m) _
106 Barangay Hall Moderate _
107 Barangay Hall Low to Moderate
(Flood level = 1m) _
108 Barangay Hall Low to Moderate _
VULNERABILITY AND CROSS-SECTORAL ANALYSIS The expected effects of climate change such as warmer temperature, increased rainfall variability, sea level rise and more intense typhoons. According to the Philippine Atmospheric Geophysical and Astronomical Services Administration (PAGASA) the country’s average annual mean temperature is expected to increase up to 1.2oC by 2020 and up to 3oC by 2050. Meanwhile, rainfall is expected to become more variable with changes ranging from -0.5 – 17.4% in 2020 and -2.4 – 16.4% in 2050. Luzon and Visayas are projected to have increased rainfall while Mindanao is projected to dry up. Associated with increase in temperature will be sea level rise, which have the potential to inundate coastal settlements and low-lying areas, and more intense typhoons, which pack more devastating winds. The impacts of climate variability on different sectors would likely to differ from one place to another due to differences in local conditions.

61 | P a g e
Table No. 2-10: Sector Impacts
SECTOR SUB-SECTOR IMPACTS
SOCIAL Public health and health services
Increase levels of heat stress, respiratory illness, chronic disease, human displacement, infectious disease and premature death
The populations at greater risk are those with the least ability to adapt
The number of people at risk for flooding increases
Health facilities on the low-lying and areas near waterways areas will be severely affected by flood
Human Settlement Destruction due to landslides, flooding and sea level rise
causing climate induced environmental refugees
Communities near coastal/waterways are at high risk
Education
12 public schools near Casili Creek and Dagat-Dagatan in South Caloocan and 30 public schools lying near Tullahan, Marilao and other tributary rivers in North Caloocan will be affected by flooding
INFRASTRUCTURE Transportation and Infrastructure
Damage from sea-level rise, erosion, flooding, landslides, and temperature extremes
Flooding and heavy rainfall may overwhelm local water infrastructure and increase the level of sediment and contaminants in the water supply
Delays on the respond to disasters and delivery of basic services due to damage to some transportation infrastructure
Drainage and Flood Control
Frequent flooding at low-lying areas
Obstruction of illegal structures and massive volume of dumped solid wastes at existing natural surface drainage system due to ISFs
ECONOMIC Tourism and recreation Shorter recreation season due to severe typhoons
Land Use Rate of conversion of land areas for urban uses
Conflicting/competing land uses
ENVIRONMENT Solid Waste Management Increase pollution level along easements of waterways
Disposal of domestic sewage
INSTITUTIONAL Administrative Governance
Interruption in government service and delays of delivery of basic services
33 barangay halls located in the Dagata-Dagatan were identified as critical areas

62 | P a g e
Chapter Three
LCCAP OBJECTIVES
PROPOSED CLUP OUTPUT AND OUTCOME INDICATORS
Table[C3] 3-01. Vision, Goals and Objectives with Output / Outcome Indicators, CLUP 2016-2025
VISION GOALS / OBJECTIVES OUTPUT INDICATORS OUTCOME INDICATORS
“Peopled by resilient, peace-loving and dynamic communities, living in a safe and ecologically balanced environment”
GOAL 1. A progressive City that provides excellent urban services and amenities;
Encourage development of new sustainable residential communities that would accommodate locally displaced informal settlers.
Increased in number of housing projects and housing units for local informal settlers as beneficiaries
Decrease in number of local informal settlers
Reduced housing backlog
Secured tenurial status of informal settlers
Maximize public investments on critical facilities delivering health, education and protective services in partnership with local and international organizations;
Increase in the new development or improvement of facilities that provides health, educational, and protective services to marginalize communities, in partnership with local and international organization
Compliance to social development indicators and standards such as student – classroom ratio, hospital bed – population ratio, police-population ratio, fireman-population ratio, etc.
Improved effectiveness and efficiency of the City Government in providing basic economic and social services
Reduced crime-rate, increased completion rate of basic education, reduced threat to lives and properties from fire hazards, decreased total morbidity and mortality rates, etc.
GOAL 2. A harmonious community with utmost capacity to deter the effect of natural and human-made hazards and other calamities that threatens the general welfare, health and safety of the population particularly woman, children and the differently-abled city residents;
Protect and manage critical areas such as major watercourses and its
Increase length of waterways protected from all types of illegal
Improved water quality of natural surface drainages
Reduced risks on life and

63 | P a g e
VISION GOALS / OBJECTIVES OUTPUT INDICATORS OUTCOME INDICATORS
embankments together with communities exposed to natural hazards, against human encroachments and other unsustainable human activities.
encroachment through clearing of illegal structures and improvement of all embankments
property of residents brought by perennial flood hazards
Protects health and safety welfare of marginalized member of communities particularly woman, children and person with disabilities
Implement sustainable system of infrastructure development that would avert impact of eminent hazards and protect natural resources (e.g. ground water, natural surface drainages)
Increased number and scale of road and utility infrastructure that adopted sustainable form of development
Lowered risks on damages to life and property brought about by natural and man-made hazards.
Promote and sustain redevelopment of communities potentially exposed to various type of natural and human-made hazards.
Increased land area of communities redeveloped to adapt with the effect of Natural and Human-Made Hazards
Reduced risks on life and property of residents brought about by multiple natural hazards (e.g. flood, severe wind, ground shake, etc.) and human-made hazards (e.g. crime, civil disorder, fire, industrial accidents, etc.)
Strictly enforce accessibility and gender laws, regulations and standards to all habitable buildings, transportation facilities, and public spaces; and mainstream said legal measures to local development policies, standards, programs, projects and activities
Increase in percentage and number of habitable buildings, transportation facilities, and public spaces that complies with accessibility and gender laws, regulations and standards
Increased accessibility and usability of public facilities and infrastructure by women and children, and persons with disabilities.
GOAL 3. A City that efficiently use, acquire and manage land as a limited resource;
Facilitate the renewal and revitalization of blighted areas, and informal settlements
Increased in area of upgraded blighted communities
Improved general living condition of settlers on upgraded blighted areas
Direct the protection, preservation and conservation of sites and structures that has ecological, aesthetic,
Identified, assessed, restored and improved sites and structures that has ecological, aesthetic, historical and cultural
Protection, preservation, conservation and promotion of the City's historical and cultural heritage;

64 | P a g e
VISION GOALS / OBJECTIVES OUTPUT INDICATORS OUTCOME INDICATORS
historical and cultural significance;
significance Established growth of local historical and cultural tourism
GOAL 4. Governance that advances acceptable and orderly development of growth and progress.
Direct all implementation and management of various local infrastructure programs and projects in coordination with on-going and proposed major projects of NGA’s and PPP proponents;
Coordinated implementation of government projects and projects implemented by utility concessionaires (e.g. water supply, power services, and telecommunication projects)
Increased number of development programs and projects implemented through Public-Private Partnerships.
Incurred financial and economic savings from wasteful uncoordinated series of projects implemented by various government agencies and utility concessionaires
Maximize partnership with the business sector and civil society groups in pursuing progress through participatory development
Increased number of programs and projects implemented with coordination or direct participation of business sector and civil society groups using Bottom-Up Approach (BUB) in Planning
Increased participation of the private sector in local development planning
Support and sustain a desirable local land use pattern that would prevent wasteful development of resources and minimize the cost of establishing public infrastructure, utilities and institutional amenities;
Increased number of public infrastructure, community facilities, utilities and institutional amenities; developed in remote areas located apart from major urban centers and primary arterial roads.
Incurred economic savings from shortened journeys between residential neighborhoods
Added business revenues from new commercial and institutional services and amenities
Improve travel efficiency, mobility and accessibility of local residents and enterprises to essentially needed goods, services and facilities,
Increased completion and success rates in the research, planning and development of proposed and existing road infrastructure, traffic management and traffic engineering system
Increase rate of compliance of existing and proposed economic and
Reduced volume of motor vehicles
Decreases travel time and use of motor vehicle mode in all journeys
Reduced emission and concentration of gaseous pollutants (e.g. CO, HC, NOX, PM) from motor vehicles at traffic congested areas
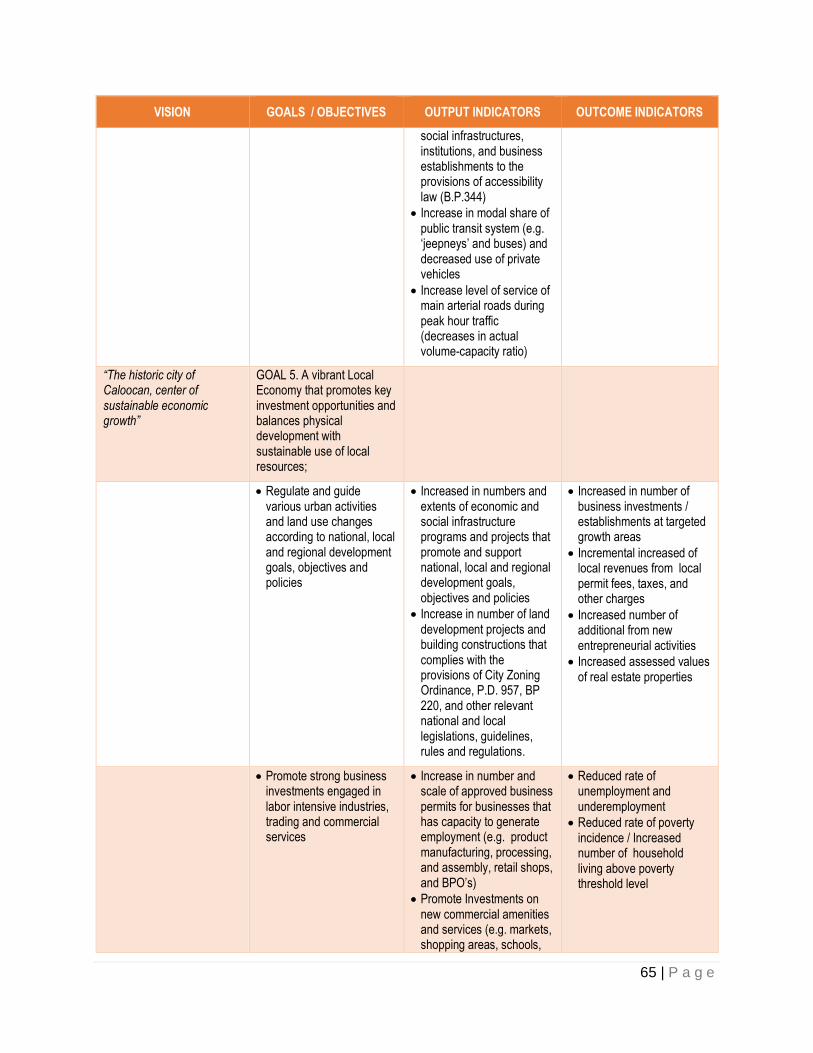
65 | P a g e
VISION GOALS / OBJECTIVES OUTPUT INDICATORS OUTCOME INDICATORS
social infrastructures, institutions, and business establishments to the provisions of accessibility law (B.P.344)
Increase in modal share of public transit system (e.g. ‘jeepneys’ and buses) and decreased use of private vehicles
Increase level of service of main arterial roads during peak hour traffic (decreases in actual volume-capacity ratio)
“The historic city of Caloocan, center of sustainable economic growth”
GOAL 5. A vibrant Local Economy that promotes key investment opportunities and balances physical development with sustainable use of local resources;
Regulate and guide various urban activities and land use changes according to national, local and regional development goals, objectives and policies
Increased in numbers and extents of economic and social infrastructure programs and projects that promote and support national, local and regional development goals, objectives and policies
Increase in number of land development projects and building constructions that complies with the provisions of City Zoning Ordinance, P.D. 957, BP 220, and other relevant national and local legislations, guidelines, rules and regulations.
Increased in number of business investments / establishments at targeted growth areas
Incremental increased of local revenues from local permit fees, taxes, and other charges
Increased number of additional from new entrepreneurial activities
Increased assessed values of real estate properties
Promote strong business investments engaged in labor intensive industries, trading and commercial services
Increase in number and scale of approved business permits for businesses that has capacity to generate employment (e.g. product manufacturing, processing, and assembly, retail shops, and BPO’s)
Promote Investments on new commercial amenities and services (e.g. markets, shopping areas, schools,
Reduced rate of unemployment and underemployment
Reduced rate of poverty incidence / Increased number of household living above poverty threshold level

66 | P a g e
VISION GOALS / OBJECTIVES OUTPUT INDICATORS OUTCOME INDICATORS
groceries, etc.) near sub-urban neighborhood communities
“Living in a safe and ecologically-balanced environment, served by a government that gives the highest value to the needs of its citizens”
GOAL 6. A City that promotes sustainable development, preservation of the natural environment and the conservation of historical and cultural heritage
Implement the development of all existing subdivision parks and playgrounds into urban greenery area and new public spaces
Increase in area of new and existing public spaces, parks, playgrounds, recreation and similar community facilities developed or improved with landscapes, hardscapes, outdoor amenities and utilities
Compliance with current and future land area requirement for parks and playground at 500 square meters per 1,000 population
Increased number of individuals and household engaging in active and passive recreations
Improved living standard and health of communities
-do-
Promote improvement of air and water quality
Increased rate of compliance of industries and motor vehicle owners on water quality standards and ambient air quality standards
Decreased emission level of air / gaseous pollutants (PM10,/ PM2.5 level, NOx., Sox) from various sources
Decreased total load of water pollutants (BOD, COD, TSP) disposed to natural surface drainages
Control disposal of solid waste and promote waste recovery
Improved solid waste management collection, handling, treatment and disposal
Increased number of improved material recovery system per Barangay
Decreased disposal of uncollected solid waste to natural surface drainage
Decreased volume of residual waste disposed to landfill
A community that supports conservation of historical and cultural heritage
Increased number of restored / conserved sites and structures that has historical, cultural and aesthetic significance / relevance
Enhanced awareness on significance of local sites, structures, relics and records to national and City’s history and culture
Increased number of tourists and development of tourism-related activities.

67 | P a g e
Chapter Four
CLIMATE CHANGE ADATATION AND MITIGATION
MEASURES
The greenhouse gas emissions that are causing global warming come from a wide range of sources including cars and trucks, power plants and others. Because of these sources there are many options for reducing emissions.
The manifestations of climate change in the form of temperature increase, flooding, land subsidence and others have impacts on the city’s economy, infrastructure, and use and on the city’s 188 barangays.
In response to all of these and in consonance with the Climate Change Act which provides the policy framework with which to systematically address the growing threats on community life and its impact on the environment.

68 | P a g e
ADAPTATION/ MITIGATION ACTIONS
Table 4-01: Impacts of Climate Change on Different Infrastructures, Mitigation and Adaptation Measures17
Infrastructure Description Impacts Mitigation Adaptation
Buildings Refers to residential dwellings, commercial, industrial and institutional buildings
Increased residential, commercial and industrial property damage
Increased maintenance, repair and replacement of residential, commercial and industrial buildings
Reduction in capacity of businesses to operate due to property damage
Reduction in use of buildings and facilities due to inundation, flooding, ground movement and structural integrity
Promotion of green buildings such as building with energy efficient designs (natural lighting and ventilation)
Adopt alternative and more efficient construction methods (pre-fabrication and off-site construction)
Increase density of homes and mixing uses to minimize transportation
Locate settlements away from vulnerable areas (waterways, powerlines, road-right-of ways, etc.)
Improve building design (e.g. use of climate change resilient materials, stronger roof fixing connections, installation of essential vulnerable equipment on higher elevations)
Transportation Refers to roads, highways and bridges
Increased roads, highways and bridges damage and deterioration
Increased maintenance, repair and replacement of roads, highways and bridges
Reduction in use of transport infrastructure due to inundation, flooding, ground movement and structural integrity
Promotion of electric vehicles
Planning for efficient transport system to minimized trip generation
Anti-smoke belching campaign
Encourage non-motorized transport (i.e. cycling and walking)
Locating major transport infrastructure away from vulnerable areas
Improve transport infrastructure design such as higher road embankment elevation, use of elevated roads, walkways, pathways and thicker pavement
Ensure new settlements are accessible by all-weather roads
Improve traffic management
Water Supply Water supply includes sources of water, reservoirs, treatment facilities, and transmission and distribution lines. As water is crucial to man’s existence, climate-proofing this infrastructure is of utmost importance
Reduction in available water for consumptive use-potable, commercial and industrial
Declining water quality leading to higher treatment costs
Accelerated degradation and increased failure of water distribution infrastructure
One way to mitigate the impact of climate change in the field of water supply is through the use of water supply systems with minimal contribution to climate change, e.g. gravity over pumped systems, which does not require power.
Encourage water use efficiency and conservation (technology, behavioral and pricing solutions and incentives)
Develop and implement rainwater harvesting systems
Promote water reuse and/or recycling
17 LGU Guidebook in LCCAP Formulation-Book 2

69 | P a g e
Infrastructure Description Impacts Mitigation Adaptation
(i.e. pipe breakage due to increased ground movement)
Increase in water cost per unit of production
Stormwater and Drainage
Stormwater and drainage infrastructures are very important in conveying flood water from settlements and thereby preventing flooding. It is thus crucial that these facilities are strengthened in the face of climate change.
Increased stormwater flows Increased flood occurrence
Wider areas of inundation
Prioritize drainage system options with mini
Develop and implement flood
plain zones
Improving natural and artificial
drainage system
Improve drainage infrastructure
design such as accounting for
increased rainfall intensities in
design flow calculations
Create and develop flood and
storm shelters
Develop locally specific flood
protection programs
Water river management by avoiding bank erosion and creating buffer zones
Waste Water System
Wastewater systems are those infrastructures that deal with the collection, conveyance and treatment of wastewater or sewage generated from households, commercial and industrial establishments and including institutional establishments.
Increased wastewater flows due to
inflow/infiltration, which would require
larger sewer lines and treatment
facilities, thus more expensive facilities
Increased damage to pipes and appurtenances due to flooding, ground movement and structural integrity, which would require higher maintenance costs
Prioritize wastewater system
options with minimal contribution
to climate change such as
conveying wastewater by gravity
as opposed to pumped systems
Construction and operation of energy-neutral wastewater treatment facilities
Locating major wastewater
infrastructure away from
vulnerable areas. Example of
this is situating certain
components such as electrical
and electronic equipment in
higher elevations to avoid
damage by flooding
Improve wastewater
infrastructure design to account
for climate change e.g. increase
design flows
Adopt formal asset management
approach that can effectively
consider climate inputs to

70 | P a g e
Infrastructure Description Impacts Mitigation Adaptation
maintain wastewater
infrastructures
Solid Waste Systems
Refers to solid waste disposal facilities
Higher generation rate of methane due to increasing temperature
Increased leachate production due to increased rainfall intensities
Full implementation of proper solid waste management program
Reserve local sites to accommodate waste sorting, recycling and re-use; locate sites away from climate change vulnerable areas
Power Systems Largely refers to transmission and distribution systems
Damage to transmission and distribution
lines resulting in increased blackouts
Reduced network capacity
Accelerated deterioration and
depreciation of assets due to highly
variable climate
Potential blackout due to increased
demand especially in areas where
temperature is increasing thus
increased air-condition units use
Promote alternative energy sources that will minimize need for transmission and distribution infrastructure.
Improve power infrastructure design such as us of climate change resilient materials, changes of design parameters
Use of locally sources energy to minimize transmission infrastructure
Adopt formal asset management approach that can effectively consider climate inputs to maintain power infrastructures

71 | P a g e
IDENTIFIED ADAPTATION/ MITIGATION OPTIONS
Table No. 4-02 Mitigation/ Adaptation Initiatives for Temperature Increase
Programs/ Projects and Activities NCCAP Priority Responded to
Responsible Office Implementation
Period
Median and sidewalk landscaping, greening, installation of bike lanes
Ecological and environmental stability
Human security
DPSTM. CED 2017-2025
Reduction of Greenhouse Gas through:
Procurement of Energy Efficient lightings on different offices on the government
Ecological and environmental stability
All government offices and
departments 2017-2025
Landscaping and greening Ecological and
environmental stability
Parks Administration
Services
Installation of Traffic Road sign and engineering devices (i.e. smoke belching)
Ecological and environmental stability
DPSTM 2017-2019
Strict implementation of traffic rules Ecological and
environmental stability
DPSTM 2017-2025
Regular maintenance of vehicles Ecological and
environmental stability
All offices/departments of city government
2017-2025
Anti-Smoke belching operation (installation of equipment)
Ecological and environmental stability
Human security
DPSTM 2017-2025
Urban Greening
Ecological and environmental stability
Human security
Parks and Recreation Services
2017-2025
Promotion of waste composting
Ecological and environmental stability
Human security
ESS 2017-2025
Installation of energy efficient streetlights (LED) to various streets, pathwalks and alleys
Ecological and environmental stability Human security
City Engineering Department
2017-2025
Promotion and Purchase of e-bicycles and tricycles
Ecological and environmental stability Human security
DPSTM 2017-2025
Site acquisition/ preparation of additional 3 air quality monitoring station
Ecological and environmental stability
ESS 2017-2019
Acquisition of air quality monitoring equipment/ analyzer, with data logger and data acquisition system
Ecological and environmental stability
ESS, EMB 2017-2019

72 | P a g e
Programs/ Projects and Activities NCCAP Priority Responded to
Responsible Office Implementation
Period
Conduct monitoring of water quality of natural surface drainage based on parameters prescribed by ESS on Water Quality Criteria for Freeh Waters
Ecological and environmental stability
Human security
Water sufficiency
ESS,EMB 2017-2019
IEC campaign on the strict implementation of “NO SEGREGATION NO COLLECTION POLICY” at BARANGAY LEVEL
Ecological and environmental stability
Human security
ESS, 2017-2025
Massive information campaign on cleanliness, tree planting and adaptability to climate change – “KALINISAN AT KALUSUGAN PARA SA KAUNLARAN”(Henson, 2016)
Ecological and environmental stability
Human security
ESS 2017-2025
Conduct massive Information, Education, & Communication (IEC) campaign activities to all schools, institutions, and selected communities to promote waste reduction and bio-composting and printing of campaign materials
Ecological and environmental stability
ESS, DepEd, CRO, PIO
2017-2025
Integrating increased temperature and urban heat concerns in the city’s development plans, programs and policies such as:
Comprehensive Land Use Plan
Comprehensive Development Plan
Annual Investment Plan
City Disaster Risk Reduction and Management Plan
Traffic Code
Executive Legislative Agenda
Ten Year Solid Waste Management Plan
Ecological and environment stability
Human security
Knowledge and capacity development
All departments/offices
of the city government
2017-2025
Food Security
Vegetable seed distribution Food security Parks 2017-2019
Table No 4-03: Mitigation/ Adaptation Initiatives for flooding due to increase precipitation
Programs/ Projects and Activities NCCAP Priority
Responded to
Responsible Office
Implementation Period
Flooding brought on by typhoon
Relocating flood prone/danger area communities and commercial centers like public market/s to safer place
Human security UPAO 2017-2025
Develop and implement a CCA Plan for settlement and resettlement in consultation with affected communities, private sector and civil society organizations
Human security UPAO 2017-2025

73 | P a g e
Programs/ Projects and Activities NCCAP Priority
Responded to
Responsible Office
Implementation Period
Finalization and Approval of Caloocan City Comprehensive Shelter Plan
Human security
UPAO, CSWD, CED,CHD,
Caloocan City Local Housing
Board
2017-2019
Capacity Building
Conduct seminars, trainings workshop on climate change and climate variability
Knowledge and capacity development
All offices and departments of the
city government 2017-2019
Improving city flood management
Construction, rehabilitation and improvement of pathwalks and drainage system
Ecological and environmental stability
Human security
City Engineering Department
2017-2025
Concreting/ asphalting/ improvement of various roads, alleys, bridges, highways and pathwalks
Ecological and environmental stability
City Engineering Department
2107-2025
Construction of creek Rip-rap
Ecological and environmental stability
Human security
City Engineering Department
2017-2019
Clearing of illegal structures along easement of creeks and rivers and peripheral / lateral canals
Ecological and environmental stability
Human security
City Engineering Department
2017-2019
Annual dredging of creeks and rivers and peripheral / lateral canals
Ecological and environmental stability
Human security
City Engineering Department
2017-2025
Infrastructure and Structures
Construction, repair, rehabilitation and maintenance of school buildings, multi-purpose and other government building
Ecological and environmental stability
Human security
City Engineering Department
2017-2019
Maintenance of existing city-own parks and other similar facilities
Ecological and environmental stability
CATO, PAS. GSO. Sports
Development Services, ESS,
Barangays
2017-2019
Table No 4-04: Mitigation/ Adaptation Initiatives for flooding due sea level rise
Programs/ Projects and Activities NCCAP Priority Responded to
Responsible Office
Implementation Period
Installation of CCTV especially on hazard prone areas
Ecological and environmental stability
Human security
DPSTM, CCDRRMO
2017-2025

74 | P a g e
CROSS-CUTTING STRATEGIES
The city government espoused several cross-cutting areas that were identified by the National Framework as crucial to the achievement of the local goals: Capacity Development, Knowledge Management, Information, Education and Communication (IEC), Research and Development (R&D), and Technology Transfer. The succeeding sections outline the priority strategies that would be undertaken under these critical areas of concern.
CAPACITY DEVELOPMENT
Capacity development objectives in the area of policy formulation, organizational development and systems improvement shall be pursued by the local government congruent to the programs of national government agencies and stakeholders group involved. At the city level, specialized capacity (training) needs in the areas of adaptation and mitigation have to be addressed to enable the full, effective and sustained implementation of the Local Framework and Action Plan. Overall, these strategies are aimed at strengthening the capacity of local institutions and individual stakeholders for undertaking climate change initiatives. Strategic Priorities
a. Review and develop policy instruments at all levels to facilitate the implementation of the Local Frameworks Strategy on Climate Change.
b. Enhance the Capacity to plan, prepare, implement , monitor and report on climate change
actions, including the integration of such actions into relevant local strategies and plans;
c. Coordinate with concerned national agencies for enhancement of systematic observation, research and knowledge management, which includes strengthening and using data for systematic observation, early warning, local downscaling and modeling, disaster preparedness, vulnerability assessment and other climate services.
d. Strengthen climate change communication, education, training and public awareness at
all levels, including grassroots levels, taking into account gender issues;
e. Encourage and strengthen participatory and integrated approaches taking climate change considerations into account to the extent feasible in relevant social, economic and environmental policies and actions.
f. Enhance systems and procedures to strengthen institutional arrangements in addressing
climate change mitigation and adaptation.
g. Harmonize the development of appropriate assessment tools such as carrying capacity assessment incorporating an appropriate environmental valuation methodology in the area of decision-making, policy development, research and development (R&D), payment and incentive mechanisms, and other climate change-related endeavors with other NGAs, LGUs and stakeholders concern.

75 | P a g e
KNOWLEDGE MANAGEMENT AND INFORMATION, EDUCATION AND COMMUNICATION (IEC) Under knowledge management, mechanisms and protocols shall be installed for a well-coordinated climate change information and data management and reporting system. The information management system includes the adoption and sharing of experiences and lessons with other local government units along with their best practices and innovative measures in addressing climate change adaptation and mitigation with the inclusion of assessments/ evaluations. This knowledge management mechanism shall then be translated into IEC materials and tools in advancing the public approach towards awareness on Climate Change. Strategic Priorities
a. Educate the public and private sectors to secure broad public awareness, support and cooperation in disaster risk reduction, mitigation and adaptation programs.
b. Mainstream climate change into all levels of formal education.
c. Provide socio-economic and cross-sectoral climate change impacts and vulnerability assessment and decision-making tools in all levels of development.
d. Maximize utility of forecast, research and climate change knowledge through coordination with all concerned NGAs to capacitate local agencies in the oversight of citywide behavior change communication (BCC) and IEC campaigns.
e. Establish an operational network in partnership with other NGAs, NGO institutions and professionals to provide the city with necessary tools, observation and information in dealing with climate change.
RESEARCH DEVELOPMENT AND TECHNOLOGY TRANSFER The local government shall coordinate with the Department of Science and Technology to avail of the agency’s Research and Development as well as Technology Transfer of data on the current trends in climate change approach. This shall ensure the success of mainstreaming climate change adaptability in all the cities various programs and plans.
BUDGETARY REQUIREMENTS
Programs, Projects and activities identified the Caloocan City Local Climate Change Action Plan shall be funded through the following funding sources:
1. National Government Funding
The required funding for programs, projects and activities in the city comes from the national government agencies implementing it. It comes as an assistance to the local government infrastructure projects from the Office of the Congressional representative under the General Appropriations Act.
2. Caloocan City Government Funding
Funding requirements from the Local Government of Caloocan may come from its regular annual City Executive Budget which might include the following:

76 | P a g e
20% Internal Revenue Allotment (IRA) Development Fund which is
annual appropriation that are earmarked for development Projects as
defined by the Joint Memorandum Circular No. 2011-1
Local Disaster Risk Reduction Management Fund or the 5% of the estimated revenue from regular sources shall be set aside to support disaster risk management activities as per Joint Memorandum Circular No. 2013-1 s. 2013
Special Education Fund
Incentivized Awards Program such as the Seal of Good Local Governance
3. Other Sources of Funding
Other sources of local funding comes through external sources that include but do not limit to the locally-based private corporations and enterprises, NGOs/POs, academe and private volunteer group or individuals.

77 | P a g e
Chapter Five
MONITORING AND EVALUATION
MEANS OF IMPLEMENTATION
The following Strategies in the areas of governance, coordination, financing, valuation and partnerships are adopted to facilitate the implementation of the Framework. Other mechanism that may be appropriately during the formulation of the Action Plan shall be included.
Establish appropriate management and institutional arrangements and coordination mechanisms for climate change at the national, sub-national and local levels.
Maximize government financing instruments and local levels as source of funds for the National Framework Strategy.
Install policy and incentive mechanism to facilitate and leverage private sector investments
in climate change.
Provide and access scaled-up, new and additional financial resources to support the requirements of the National Framework, including sectoral and local financing requirements.
Development of appropriate assessment tool such as carrying capacity assessment incorporating an appropriate environmental valuation methodology to inform decision-making, policy development, research and development (R&D), payment and incentive mechanism, and other climate change-related endeavors.
Establish partnerships among national and local government agencies, business,
professional and other private groups, community-based organizations, academic and scientific organizations, and civil society organizations.
MONITORING AND EVALUATION OF THE FRAMEWORK
The Climate Change Commission, in coordination with concerned agencies and stakeholder groups, shall install a monitoring and evaluation (M&E) system to tack the implementation progress of the provisions of this Framework and resulting National Climate Change Action Plan and Local Climate Change Action Plan. As per Rule VIII, Sec.1 of the Implementing Rules and Regulations of the Climate Change Act of 2009, review the provisions of this Framework every three (3) years using a participatory evaluation process.

78 | P a g e
Chapter Six
REFERENCES AND ANNEXES
ABBREVIATIONS AND ACRONYMS
ABC – Association of Barangay Captains
BDRRMC – Barangay Disaster Risk Reduction Management Committee
Brgy. – Barangay
BP – Batas Pambansa
BPO – Business Process Outsourcing
CAO – City Assessor’s Office
CATO – Cultural Affairs and Tourism Office
CCDRRMC – Caloocan City Risk Reduction and Management Council
CCDRRMO – Caloocan City Disaster Risk Reduction and Management Office
CCDRRMP – Caloocan City Disaster Risk Reduction and Management Plan
CC – Climate Change
CCA – Climate Change Adaptation
CCATWG – Climate Change Adaptation Technical Working Group
CCC – Climate Change Commission
CCSWDD – Caloocan City Social Welfare Department
CCVI – Climate Change Vulnerability Index
CDP – Comprehensive Development Plan
CED – City Engineering Department
CEMO – City Environmental Management Office
CHD – City Health Department
CLUP – Comprehensive Land Use Plan
CMO – City Mayor’s Office
CRO – Community Relations Office
CPDD – City Planning and Development Department
DA – Department of Agriculture
DENR – Department of Environment and Natural Resources
DepEd – Department of Education
DILG – Department of Interior and Local Government
DOST – Department of Science and Technology

79 | P a g e
DPWH – Department of Public Works and Highways
DPSTM – Department of Public Safety and Traffic Management
DRR – Disaster Risk Reduction
DRRM – Disaster Risk Reduction and Management
EMB – Environmental Management Bureau
ESS – Environmental and Sanitation Services
GG – Greenhouse Gases
GSO – General Services Office
HUDCC – Housing and Urban Development Coordinating Council
LEIPO – Local Economic and Investment Promotion Office
IEC – Information and Education Campaign
IRA – Internal Revenue Allotment
IWRM - Integrated Water Resources Management
LDC – Local Development Council
LCCAP – Local Climate Change Action Plan
LCE – Local Chief Executive
LEIPO – Local Economic and Investment Promotion Office
NCCAP – National Climate Change Action Plan
NDRRMC – National Disaster Risk Reduction and Management Council
NGA – National Government Agency
NGO – Non-Government Organization
NWRB – National Water Resources Board
PAS – Parks Administration Services
PhiVolcs – Philippine Institute of Volcanology and Seismology
PIO – Public Information Office
PNP – Philippine National Police
POs – People’s Organization
PPP – Public-Private Partnership
RA – Republic Act
SP – Sangguniang Panlungsod
TMO – Traffic Management Office
UPAO – Urban Poor Affairs Office

80 | P a g e
REFERENCES
NATIONAL CLIMATE CHANGE ACTION PLAN 2011 - 2028
NATIONAL FRAMEWORK STRATEGY ON CLIMATE CHANGE 2010 – 2022
LGU GUIDEBOOK ON THE FORMULATION OF LOCAL CLIMATE CHANGE ACTION PLAN
Local Government Academy (LGA)
Department of Interior and Local Government
ISBN: 978-971-0576-55-5 (Copyright © 2014)
CALOOCAN CITY COMPREHENSIVE LAND USE PLAN 2016 – 2025
CDC Resolution No. CM-OGM 16-010
Sangguniang Panlungsod Resolution No. 2559, series of 2016
CALOOCAN CITY COMPREHENSIVE DEVELOPMENT PLAN 2017 – 2019
CDC Resolution No. CM-OGM 16-011
Sangguniang Panlungsod Resolution No. 2560, series of 2016
CALOOCAN CITY EXECUTIVE LEGISLATIVE AGENDA 2017 – 2019
CDC Resolution No. CM-OGM 16-012
Sangguniang Panlungsod Resolution No. 2561, series of 2016
CALOOCAN CITY ANNUAL INVESTMENT PLAN 2017
CDC Resolution No. CM-OGM 16-014
Sangguniang Panlungsod Resolution No. 2564, series of 2016
GLOBAL SEA LEVEL RISE IS RECOGNIZED
By Kevin S. Rodolfo and Fernando V. Siringan
METHOD OF COMPUTATION:
http://climateactiontracker.org/methodology/85/Comparability-of-effort.html