local binary patterns versus signal processing texture
TRANSCRIPT
Research article
Local binary patterns versus signal processingtexture analysis: a study from a performance
evaluation perspectiveOvidiu Ghita and Dana Ilea
School of Electronic Engineering, Dublin City University, Dublin, Ireland
Antonio FernandezSchool of Industrial Engineering, University of Vigo, Vigo, Spain, and
Paul WhelanSchool of Electronic Engineering, Dublin City University, Dublin, Ireland
AbstractPurpose – The purpose of this paper is to review and provide a detailed performance evaluation of a number of texture descriptors that analyse textureat micro-level such as local binary patterns (LBP) and a number of standard filtering techniques that sample the texture information using either a bankof isotropic filters or Gabor filters.Design/methodology/approach – The experimental tests were conducted on standard databases where the classification results are obtained forsingle and multiple texture orientations. The authors also analysed the performance of standard filtering texture analysis techniques (such as thosebased of LM and MR8 filter banks) when applied to the classification of texture images contained in standard Outex and Brodatz databases.Findings – The most important finding resulting from this study is that although the LBP/C and the multi-channel Gabor filtering techniques approachtexture analysis from a different theoretical perspective, in this paper the authors have experimentally demonstrated that they share some commonproperties in regard to the way they sample the macro and micro properties of the texture.Practical implications – Texture is a fundamental property of digital images and the development of robust image descriptors plays a crucial role inthe process of image segmentation and scene understanding.Originality/value – This paper contrast, from a practical and theoretical standpoint, the LBP and representative multi-channel texture analysisapproaches and a substantial number of experimental results were provided to evaluate their performance when applied to standard texture databases.
Keywords Signal processing, Pattern recognition, Texture classification, Local binary patterns, Rotational invariance, Gabor filters, Isotropic filters
Paper type Research paper
1. Introduction
Textured surfaces are an omnipresent characteristic of digital
images and their precise identification plays an important role in
the development of computer vision algorithms that target real-
world applications. Although there is no widely accepted
definition for texture, many image analysis approaches
attempted to model this fundamental property in conjunction
with the human visual system (HVS). In this regard, many
psychophysical studies demonstrated that texture perception
and interpretation is an early neural mechanism of the HVS
which plays an important role in the process of figure-ground
segmentation (Julesz, 1981; Bergen and Adelson, 1988;
Balas, 2006). According to these studies, texture can be
conceptualised as a statistical or geometric repetition of
primitive descriptors (micro patterns) in the image and
specific measures such as roughness, regularity, linearity,
frequency, directionality, granularity and density can be
employed to attain texture discrimination (one prominent
example is the theoryof textons that has beenproposedby Julesz
(1981) in the early 1980s). While the surfaces of the imaged
objects are often defined by an unbounded variety of textures,
the task relating to the identification of the optimal texture
analysis approach proved extremely challenging and the
substantial efforts devoted by the vision community in the
field of texture analysis were justified, as the availability of a
robust texture descriptor will be extremely beneficial for a large
spectrum of applications (Manjunath and Ma, 1996;
Kovalev et al., 2001; Maenpaa et al., 2003; Nammalwar et al.,
2003; Ghita et al., 2005; Rodriguez andMarcel, 2006; Xie and
Mirmehdi, 2007; Tosun andGunduz-Demir, 2011). Due to its
intrinsic complexity, this fundamental image property has been
researched for a number of decades and there is a large degree of
consensus among vision researchers that texture analysis can
The current issue and full text archive of this journal is available at
www.emeraldinsight.com/0260-2288.htm
Sensor Review
32/2 (2012) 149–162
q Emerald Group Publishing Limited [ISSN 0260-2288]
[DOI 10.1108/02602281211209446]
149

be divided into four major categories: statistical, model-based,
signal processing and structural, with statistical and signalprocessing techniques being the most investigated.As indicated in numerous reviews on texture analysis
(Chellappa et al., 1998; Materka and Strzelecki, 1998;
Tuceryan and Jain, 1998; Zhang and Tan, 2002; Petrou andSevilla, 2006), statistical approaches evaluate the spatialdistribution of the pixels in the image by calculating features
using first- and second-order statistics (Haralick, 1979;Dyer et al., 1980; Haley and Manjunath, 1999). Among
statistical texture analysis techniques the most investigated arebased on the evaluation of the grey-level differences (first-orderstatistics) and co-occurrence matrices (second-order statistics).
These techniques are viewed as “historical” approaches totexture analysis and since their introduction they have been
further advanced to improve either their discriminative power ortheir computational cost (Tsatsanis and Giannakis, 1992;
Valkealahti and Oja, 1998). More recently the research focushas been on signal processing-based texture analysis methods.With these techniques, the image is typically filtered with a bank
offiltersofdiffering scales andorientations inorder tocapture thechanges between specific frequency bands in the analysed image
(Coggins and Jain, 1985; Haley and Manjunath, 1999; Liu andWang, 2003). Early studies attempted to analyse the texture inthe Fourier domain (Weszka et al., 1976), but these approacheswere clearly outperformed by techniques that either analyse thetexture using multi-channel narrow band Gabor filters or
perform texture decomposition using the wavelet representation(Mallat, 1989; Porter and Canagarajah, 1997; Weber andCasasent, 2001). The multi-channel texture decomposition
approach was first introduced by Jain and Farrokhnia (1991)when they applied dyadic Gabor filters (Daugman, 1988;
Kamarainen et al., 2006) to extract the textural features fromimages defined by oriented patterns. Arising from theexperimental results, the authors conclude that the spectral
information sampled by the narrow-band filters is sufficient torobustly discriminate between different textures in the image.
Other studies have shown that the Gabor representation isoptimal in the sense of minimising the uncertainties in space/
frequency decomposition (Daugman, 1988; Bovik et al., 1990;Dunn et al., 1994; Dunn and Higgins, 1995; Kachouie andAlirazae, 2005), but the main practical problem with this
approach is the onerous computational cost required to filter theimage with a large bank of filters. To address this issue, Randen
and Husoy (1999a, b) proposed a methodology to computeoptimised narrow-band filters and they evaluated theirperformance with respect to complexity/feature separation on a
large number of test images. A conceptually related techniquewas proposed by Manjunath and Ma (1996) where they
attempted to minimise the redundancies generated by the non-orthogonal Gabor wavelets in the implementation of adaptivetexture descriptors for browsing and image retrieval. A distinct
alternative to address the limitations associatedwith the standardmulti-channel texture decomposition based on Gabor filters
resides in the construction of a universal dictionary of textonswhich can be regarded as textural primitives that are able todescribe any digital image. Building on this concept, Leung and
Malik (2001) were among the first to apply the texton-basedrepresentation to textureclassification/recognition. In theirwork,
the textons are calculated by clustering the responses of the filterbank (in this paper it is referred to as LMfilter bank) into a set of
prototype vectors that sample the principal texturecharacteristics. To this end, the authors proposed a bank of
48filters that consist of a set of 36 orientedfilters and12 isotropic
filters and the resulting textons were evaluated in the context oftexture recognition. The experimental data proved the efficiency
of this approach (97 per cent detection rate) and due to its soundtheoretical foundation this texture decomposition scheme hasbeen further developed by other researchers. In this regard,
Varma and Zisserman (2002, 2004) redeveloped the LM filterbank by retaining only the maximum responses returned by the
oriented filters at each scale, a fact that allowed theimplementation of a rotational invariant (RI) filter bank (which
was referred to asMR8). In their paper the authors performed alarge number of experiments to identify the optimal filter bankand they conclude that RI can be achieved at the expense of a
marginal decrease in classification accuracy. A related approachthat also addressed the texton-based texture analysis was
proposed by Cula and Dana (2004) where the authors appliedbi-directional feature histograms for 3D texture recognition.A recent direction of research in the field of texture
classification attempted to bridge the concepts behindstatistical and geometric texture analysis approaches. As
indicated earlier, the statistical texture analysis evaluate thefirst- and second-order statistics of the intensities and pixel
positions in the image, whereas geometrical approaches regardthe texture as the spatial arrangement of textural primitives.While at the first glance the statistical and geometric texture
analysis methods appear antagonistic, several researchers(Ojala et al., 1994, 2001, 2002a, b; Rodriguez and Marcel,
2006; Petrou and Sevilla, 2006; Nammalwar et al., 2010)observed that these approaches have strong complementarycharacteristics that allow modelling the macro-texture as the
distribution of micro textural descriptors (or texture units). Inthis regard, the introduction of the local binary patterns (LBPs)
concept by Ojala et al. (1994) has represented a milestone intexture analysis. This assertion is motivated not only by thesheer amount of LBP-related research published in the
literature (according to the www.cse.oulu.fi/MVG/LBP_Bibliography web site 1,047 papers were published on the
topic of LBP), but also by the vast spectrum of applicationdomains that were well served by the LBP-based texture
analysis approach. Based on these compelling arguments,there is no doubt that LBP is one of themost researched areas inthe field of texture analysis and it is the main objective of this
paper to review this texture modelling approach from atheoretical and practical perspective. To further elevate the
relevance of this paper, in this work we also assess the intrinsiccharacteristics of the LBP and mainstream signal processingtexture analysis methods with a view of finding the
commonalities (and differences) between these fundamentalapproaches in the process of texture modelling. Thus, in this
paper we provide a detailed study that evaluates theperformance of the LBP technique and a number of signalprocessing techniques that filter the image data with a bank of
isotropic filters (Schmid, 2001), Gabor filters (Bovik et al.,1990;DunnandHiggins, 1995) and texture analysis techniques
that model the texture as a distribution of textons (Leung andMalik (LM) and Maximum Response (MR8) filter banks)(Leung and Malik, 2001; Varma and Zisserman, 2002, 2004).
In the experimental section of this paper, the aforementionedtechniques are evaluated on standard databases where the
classification rate is calculated for one texture orientation andfor multiple texture orientations. While the detailed
performance evaluation represents the major contributionassociated with this work, we would like to mention other novel
Local binary patterns versus signal processing texture analysis
Ovidiu Ghita, Dana Ilea, Antonio Fernandez and Paul Whelan
Sensor Review
Volume 32 · Number 2 · 2012 · 149–162
150
aspects associated with our investigation that we believe are ofinterest to the computer vision research community. Inparticular, we would like to mention the in-depth evaluationof the effects of image interpolation in the calculation of thestandard LBP texture unit, which helped us to clarify severalissues relating to the drop in classification that is characteristicfor RI LBP forms. To further emphasise the link betweenclassification accuracy and RI, in this paper we also provide
comparative experimental results between texture classificationschemes based on standard Gabor filtering (GF) andsymmetrical (S) filters. Last but not least, a novel aspectassociatedwith thiswork also reside in the detailed discussion ofthe experimental results that advance conclusions in regard tothe process employed by the LBP and signal processingtechniques in the process of sampling the texture in digitalimages.This paper is organised as follows. Section 2 presents the
texture extraction techniques evaluated in this study. Section 3details the experimental results, while in Section 4 theclassification results are analysed and discussed. Section 5concludes this paper.
2. Methods
2.1 LBPs texture extraction
The LBPs concept, as developed by Ojala et al. (2002a),attempts to decompose the texture into small units where thetexture features are defined by the distribution (histogram) ofthe LBP values calculated for each pixel in the image. Theconcept behind LBP is appealing since the LBP distributionsare suitable to sample the textural properties in thehomogenous image regions irrespective to their sizes. TheLBP texture unit is calculated in a 3 £ 3 squareneighbourhood by applying a simple threshold operationwith respect to the central pixel as illustrated in equation (1):
T ¼ {tðg0 2 gcÞ; . . . ; tðgP21 2 gcÞ}; tðxÞ ¼1 x $ 0
0 x , 0
(ð1Þ
where T is the texture unit, gc is the grey level value of thecentral pixel, gP are the grey level values of the pixels adjacentto the central pixel in the 3 £ 3 neighbourhood, P defines thenumber of pixels in the 3 £ 3 neighbourhood and function t(.)defines the threshold operation. For a 3 £ 3 neighbourhoodthe value of P is 8. To encompass the spatial arrangement ofthe pixels in the 3 £ 3 neighbourhood, the LBP value for thetested (central) pixel is calculated using the followingrelationship:
LBP ¼XP21
i¼0
tðgi 2 gcÞ*2i ð2Þ
where t(gi 2 gc) is the value of the thresholding operationillustrated in equation (1). The LBP values calculated usingequation (2) are in the range [0,255].As the LBP values do not measure the greyscale variation,
the LBP is commonly used in conjunction with a contrastmeasure C. In our implementation, the contrast measure C, assuggested by Ojala et al. (2002a), is calculated as the normalizeddifference between the grey levels of the pixels with a value of 1and thepixelswith avalueof0 in the textureunitT (equation (1)).The distribution of the LBP/C values calculated for all pixels inthe image represents the texture spectrum. The LBP/C
distribution can be defined as a histogram of size 256 þ b,
where the first 256 bins are required by the distribution of the
LBP values and the last b bins of the distribution are required to
sample the quantized contrast measure. In practice, the contrast
measure is sampled in 4, 8 or 16 bins to obtain a compact
descriptor. Figure 1 shows the LBPand contrast distributions for
three differently textured images (top – oriented texture,
middle – mildlyoriented texture andbottom – isotropic texture).
2.2 Rotational invariant LBP descriptors
The LBP values calculated for each texture unit using
equation (2) are sensitive to texture orientation. This is
motivated by the fact that the standard LBP descriptor
encompasses the spatial distribution of the pixels along with
the distribution of the intensity values within a square 3 £ 3
neighbourhood. While this property may be useful when this
texture descriptor is included in the development of
applications such as inspection of surfaces defined by oriented
textures, it is a considerable drawback when this image
descriptor is used for texture classification. To address this
problem (Ojala et al., 2002a) proposed to modify the LBP
descriptor in order to achieve RI. To remove the sensitivity to
rotation, the texture descriptor has to be calculated within a
circular neighbourhood and the texture should be evaluated in
terms of uniformity. Since the pixels in the image are organised
as a discrete matrix, the pixels situated within the circular
neighbourhood are not positioned exactly on the image grid and
their values are calculated by using bilinear interpolation. To
enforce the concept of uniformity in the calculation of the LBP
values, Ojala et al. (2002a) introduced the term “uniform
patterns” that is defined in terms of the number of transitions
between 0 and 1 in the LBP mask obtained after thresholding
the pixels from the circular neighbourhood with the intensity
value of the central pixel. In this way, they defined a pattern as
uniform if the binary LBP pattern has a maximum of two
transitions; otherwise the pattern is classed as non-uniform. For
instance, if the LBP value is calculated in a circular 8
neighbourhood, the binary patterns 00000000, 00000001,
00000011, 00001000, . . . , 11111111 are classed as uniform,
while patterns such as 01100101, 10101000, 01101101, . . . ,
10101010 are classed as non-uniform (Figure 2).As indicated earlier, the idea behind uniformity concept is
to group the non-uniform patterns in a distinct class while the
values for uniform patterns are given by the total number of
elements with a value 1 in the binary LBP pattern
(equation (5)). In the original implementation (Ojala et al.,
2002a), the RI LPB descriptors are calculated for
neighbourhoods with different sizes (Figure 3) as follows:
Trðgm; gnÞ ¼ jtðgm 2 gcÞ2 tðgn 2 gcÞj ð3Þ
UP ;R ¼ TrðgP21; g0Þ þXP21
i¼1
Trðgi ; gi21Þ ð4Þ
LBPriP ;R ¼
PP21i¼0 tðgi 2 gcÞ if UP ;R # 2
P þ 1 Otherwise
(ð5Þ
where P is the number of pixels in the LBP mask, R is the
radius of the mask, ri indicates that the LBP value is RI,
Tr(gm,gn) defines the transition between pixels with indexes m
and n and UP,R is the function that evaluates the uniformity of
the binary LBP pattern.
Local binary patterns versus signal processing texture analysis
Ovidiu Ghita, Dana Ilea, Antonio Fernandez and Paul Whelan
Sensor Review
Volume 32 · Number 2 · 2012 · 149–162
151

Figure 1 The LBP and contrast (quantization level 8) distributions calculated for thereof the textures used in our experiments
0
50
100
150
200
250
1 21 41 61 81 101 121 141 161 181 201 221 241
LBP value
LBP value
LBP value
Fre
qu
ency
0
2,000
4,000
6,000
8,000
10,000
1 2 3 4 5 6 7 8Contrast value
1 2 3 4 5 6 7 8
Contrast value
1 2 3 4 5 6 7 8
Contrast value
Fre
qu
ency
0
2,000
4,000
6,000
8,000
10,000
Fre
qu
ency
Fre
qu
ency
0
50
100
150
200
250
1 21 41 61 81 101 121 141 161 181 201 221 241
Fre
qu
ency
0
50
100
150
200
250
1 21 41 61 81 101 121 141 161 181 201 221 241
Fre
qu
ency
0
2,000
4,000
6,000
8,000
10,000
12,000
Source: Ojala et al. (2002b)
Figure 2 LBP masks obtained after the application of the thresholding operation
Notes: The pixels that return the value 0 in equation (1) are marked in the diagram with a black discwhile the pixels that generate a value 1 are marked with a white disc; (top row) examples of uniformpatterns (maximum of two transitions in the binary pattern); (bottom row) examples of non-uniformpatterns
Local binary patterns versus signal processing texture analysis
Ovidiu Ghita, Dana Ilea, Antonio Fernandez and Paul Whelan
Sensor Review
Volume 32 · Number 2 · 2012 · 149–162
152
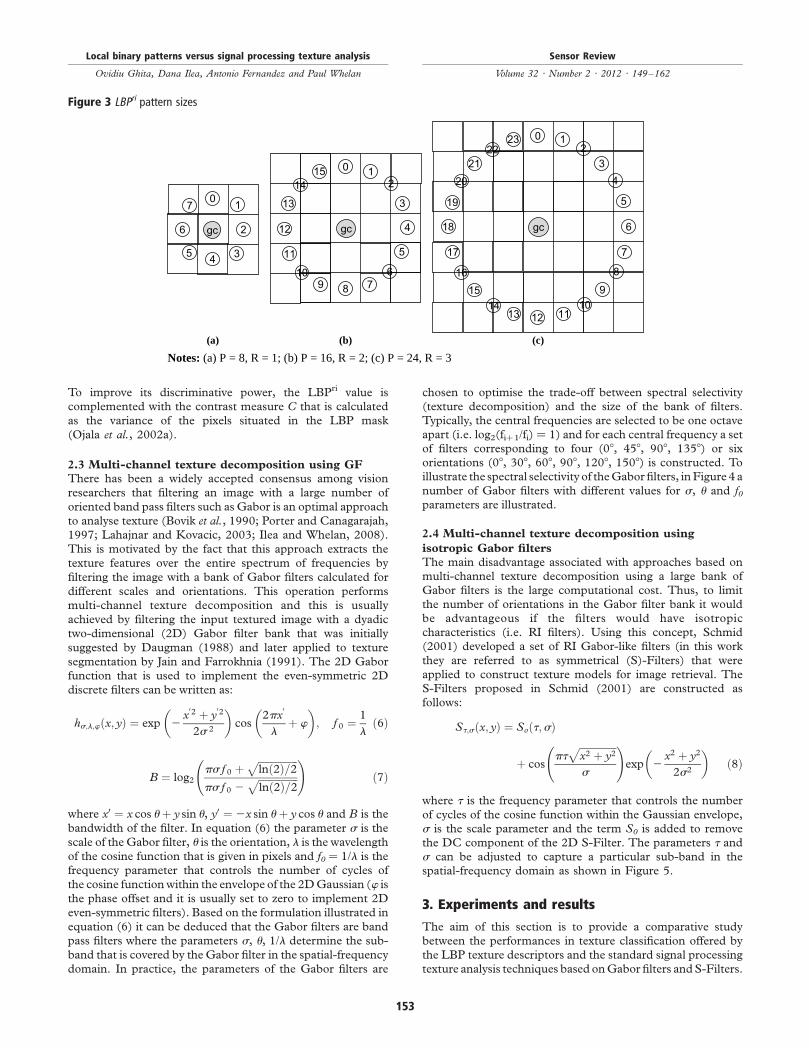
To improve its discriminative power, the LBPri value is
complemented with the contrast measure C that is calculated
as the variance of the pixels situated in the LBP mask
(Ojala et al., 2002a).
2.3 Multi-channel texture decomposition using GF
There has been a widely accepted consensus among vision
researchers that filtering an image with a large number of
oriented band pass filters such as Gabor is an optimal approach
to analyse texture (Bovik et al., 1990; Porter and Canagarajah,
1997; Lahajnar and Kovacic, 2003; Ilea and Whelan, 2008).
This is motivated by the fact that this approach extracts the
texture features over the entire spectrum of frequencies by
filtering the image with a bank of Gabor filters calculated for
different scales and orientations. This operation performs
multi-channel texture decomposition and this is usually
achieved by filtering the input textured image with a dyadic
two-dimensional (2D) Gabor filter bank that was initially
suggested by Daugman (1988) and later applied to texture
segmentation by Jain and Farrokhnia (1991). The 2D Gabor
function that is used to implement the even-symmetric 2D
discrete filters can be written as:
hs;l;wðx; yÞ ¼ exp 2x02 þ y
02
2s 2
� �cos
2px0
lþ w
� �; f 0 ¼ 1
lð6Þ
B ¼ log2ps f 0 þ
ffiffiffiffiffiffiffiffiffiffiffiffiffiffiffiffilnð2Þ=2
pps f 0 2
ffiffiffiffiffiffiffiffiffiffiffiffiffiffiffiffilnð2Þ=2
p !
ð7Þ
where x0 ¼ x cos uþ y sin u, y0 ¼ 2x sin uþ y cos u and B is the
bandwidth of the filter. In equation (6) the parameter s is the
scale of the Gabor filter, u is the orientation, l is the wavelength
of the cosine function that is given in pixels and f0 ¼ 1/l is the
frequency parameter that controls the number of cycles of
the cosine functionwithin the envelope of the 2DGaussian (w is
the phase offset and it is usually set to zero to implement 2D
even-symmetric filters). Based on the formulation illustrated in
equation (6) it can be deduced that the Gabor filters are band
pass filters where the parameters s, u, 1/l determine the sub-
band that is covered by the Gabor filter in the spatial-frequency
domain. In practice, the parameters of the Gabor filters are
chosen to optimise the trade-off between spectral selectivity
(texture decomposition) and the size of the bank of filters.
Typically, the central frequencies are selected to be one octave
apart (i.e. log2(fiþ1/fi) ¼ 1) and for each central frequency a set
of filters corresponding to four (08, 458, 908, 1358) or six
orientations (08, 308, 608, 908, 1208, 1508) is constructed. To
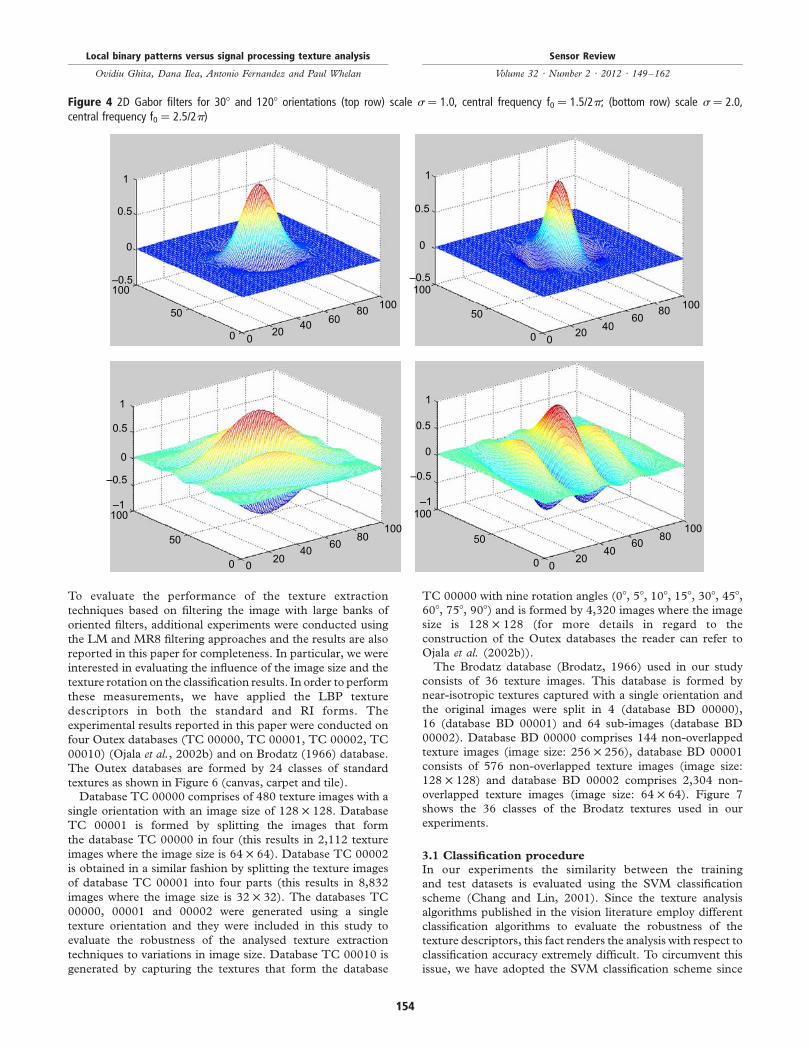
illustrate the spectral selectivity of theGabor filters, inFigure 4 a
number of Gabor filters with different values for s, u and f0parameters are illustrated.
2.4 Multi-channel texture decomposition using
isotropic Gabor filters
The main disadvantage associated with approaches based on
multi-channel texture decomposition using a large bank of
Gabor filters is the large computational cost. Thus, to limit
the number of orientations in the Gabor filter bank it would
be advantageous if the filters would have isotropic
characteristics (i.e. RI filters). Using this concept, Schmid
(2001) developed a set of RI Gabor-like filters (in this work
they are referred to as symmetrical (S)-Filters) that were
applied to construct texture models for image retrieval. The
S-Filters proposed in Schmid (2001) are constructed as
follows:
St;sðx; yÞ ¼ Soðt;sÞ
þ cospt
ffiffiffiffiffiffiffiffiffiffiffiffiffiffiffix2 þ y2
ps
!exp 2
x2 þ y2
2s2
� �ð8Þ
where t is the frequency parameter that controls the number
of cycles of the cosine function within the Gaussian envelope,
s is the scale parameter and the term S0 is added to remove
the DC component of the 2D S-Filter. The parameters t and
s can be adjusted to capture a particular sub-band in the
spatial-frequency domain as shown in Figure 5.
3. Experiments and results
The aim of this section is to provide a comparative study
between the performances in texture classification offered by
the LBP texture descriptors and the standard signal processing
texture analysis techniques based onGabor filters andS-Filters.
Figure 3 LBPri pattern sizes
(a) (b) (c)
1
1
2
2
3
3
4
4
0
0
7
78910
12
13
1415
6
6
5 5
gc gc
11
12
3
4
0
7
8
9
101213
14
15
16
17
18
2322
21
20
19
6
5
gc
11
Notes: (a) P = 8, R = 1; (b) P = 16, R = 2; (c) P = 24, R = 3
Local binary patterns versus signal processing texture analysis
Ovidiu Ghita, Dana Ilea, Antonio Fernandez and Paul Whelan
Sensor Review
Volume 32 · Number 2 · 2012 · 149–162
153
To evaluate the performance of the texture extraction
techniques based on filtering the image with large banks of
oriented filters, additional experiments were conducted using
the LM and MR8 filtering approaches and the results are also
reported in this paper for completeness. In particular, we were
interested in evaluating the influence of the image size and the
texture rotation on the classification results. In order to perform
these measurements, we have applied the LBP texture
descriptors in both the standard and RI forms. The
experimental results reported in this paper were conducted on
four Outex databases (TC 00000, TC 00001, TC 00002, TC
00010) (Ojala et al., 2002b) and on Brodatz (1966) database.
The Outex databases are formed by 24 classes of standard
textures as shown in Figure 6 (canvas, carpet and tile).Database TC 00000 comprises of 480 texture images with a
single orientation with an image size of 128 £ 128. Database
TC 00001 is formed by splitting the images that form
the database TC 00000 in four (this results in 2,112 texture
images where the image size is 64 £ 64). Database TC 00002
is obtained in a similar fashion by splitting the texture images
of database TC 00001 into four parts (this results in 8,832
images where the image size is 32 £ 32). The databases TC
00000, 00001 and 00002 were generated using a single
texture orientation and they were included in this study to
evaluate the robustness of the analysed texture extraction
techniques to variations in image size. Database TC 00010 is
generated by capturing the textures that form the database
TC 00000 with nine rotation angles (08, 58, 108, 158, 308, 458,
608, 758, 908) and is formed by 4,320 images where the image
size is 128 £ 128 (for more details in regard to the
construction of the Outex databases the reader can refer to
Ojala et al. (2002b)).The Brodatz database (Brodatz, 1966) used in our study
consists of 36 texture images. This database is formed by
near-isotropic textures captured with a single orientation and
the original images were split in 4 (database BD 00000),
16 (database BD 00001) and 64 sub-images (database BD
00002). Database BD 00000 comprises 144 non-overlapped
texture images (image size: 256 £ 256), database BD 00001
consists of 576 non-overlapped texture images (image size:
128 £ 128) and database BD 00002 comprises 2,304 non-
overlapped texture images (image size: 64 £ 64). Figure 7
shows the 36 classes of the Brodatz textures used in our
experiments.
3.1 Classification procedure
In our experiments the similarity between the training
and test datasets is evaluated using the SVM classification
scheme (Chang and Lin, 2001). Since the texture analysis
algorithms published in the vision literature employ different
classification algorithms to evaluate the robustness of the
texture descriptors, this fact renders the analysis with respect to
classification accuracy extremely difficult. To circumvent this
issue, we have adopted the SVM classification scheme since
Figure 4 2D Gabor filters for 308 and 1208 orientations (top row) scale s ¼ 1.0, central frequency f0 ¼ 1.5/2p; (bottom row) scale s ¼ 2.0,central frequency f0 ¼ 2.5/2p)
100
1
0.5
0
–0.5100
50
0 020
40 6080
1
0.5
0
–0.5
–1100
50
0 020
4060
80100
1
0.5
0
–0.5
50
0 020
4060
80
100100
1
0.5
0
–0.5
–1
50
0 020
4060
80
100100
Local binary patterns versus signal processing texture analysis
Ovidiu Ghita, Dana Ilea, Antonio Fernandez and Paul Whelan
Sensor Review
Volume 32 · Number 2 · 2012 · 149–162
154

its implementation is standard and readily available (Chang and
Lin, 2001) and the results reported in this paper can be
easily benchmarked against the results obtained by other
texture analysis algorithms. To avoid the computational
problems associated with complex classification models (such
as the optimisation of a large set of parameters), in our
implementation we have used polynomial kernels to map the
feature space. The first tests were conducted on texture
databases formed by non-rotated texture images. In our
experiments half of the images were used for training and the
remaining half were used for testing.To evaluate the robustness to image rotation of the algorithms
detailed in this paper, we have conducted a number of
experiments on database TC 00010 that comprises texture
images captured with nine rotation angles. In order to sample
the effect of image rotation we have adopted the approach
suggested byOjala et al. (2002a) where the classifier was trained
with 480 images captured with the standard orientation (angle
08) while the images with the remaining (rotated) orientations
were used for testing. Training the classifier with a single
orientation is the optimal strategy to assess the robustness of the
evaluated techniques to image rotation since no bias in
classification is introduced.The trainingprocess is shown inFigure 8 and it canbenoticed
that the classifier is trainedwith feature vectors that define either
the LBP/C distributions (size: 256 þ b, where 256 is the size
of the LBP distribution and b is the quantisation level of the
contrast measure) or by the distributions calculated from
the responses obtained after filtering the texture imageswith the
multi-channel filter banks (in our implementation we have
normalized the intensity values of the filtered images in the
range [0,255] and as a result the size of the feature vector is:
256 £ num_filters, where num_filters defines the number of
filters in the filter bank).
3.2 Classification results for the LBP technique
In this section we evaluate the classification accuracy returned
by the LBPs technique where the operators were used in both
the standard and RI forms. In this study, the standard LBP
descriptor and the RI LBPri8,1, LBPri
16,2, LBPri24,3 texture
descriptors are evaluated.As indicated inSection3.1 these experimentswereperformed
using four Outex databases (TC 00000, TC 00001, TC 00002,
TC00010) and threeBrodatz databases (BD00000, BD00001
and BD 00002) and the classification results are illustrated in
Tables I and II (in these tables the parameter bins indicates the
quantization level for the contrast measure andLBPriMR denotes
that the RI LBP operator has been applied in the multi-
resolution form – the construction of this texture descriptorwill
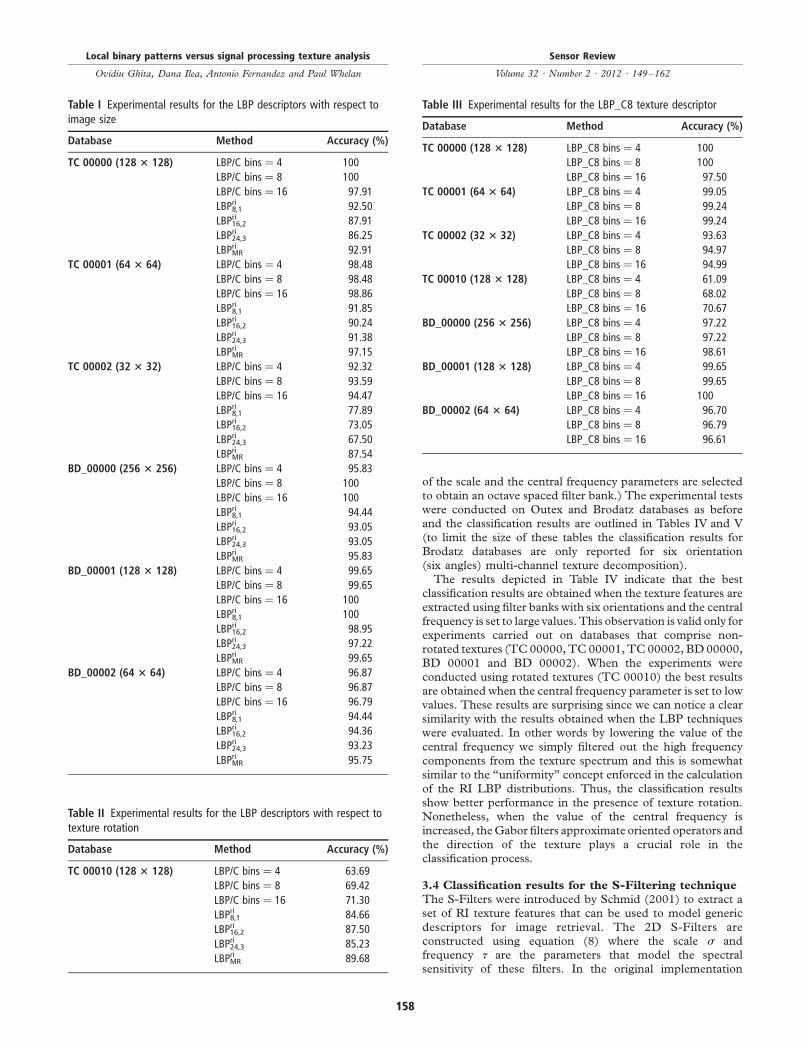
be explained later in this section).The results illustrated inTables I and II are quite interesting and
require a more detailed analysis. For instance, it can be observed
that the standard LBP/C operator provides excellent
discrimination when the classifier is trained and tested on
Figure 5 2D S-Filters constructed using the following (s,t) parameters: (a) (1,0); (b) (2,1); (c) (4,1) and (d) (4,2)
100
0.8
1
0.2
0.4
0.6
0100
50
0 020
4060
80
1
0.5
0
–0.5
–1100
50
0 020
4060
80100
1
0.5
–0.5
0
–1
50
0 020
4060
80
100100
1
0.5
0
–0.5
–1
50
0 0 2040
6080
100100
Local binary patterns versus signal processing texture analysis
Ovidiu Ghita, Dana Ilea, Antonio Fernandez and Paul Whelan
Sensor Review
Volume 32 · Number 2 · 2012 · 149–162
155

texture images defined by a single orientation, but its
discriminative power is substantially diminished even whendealing with small texture rotations. Table II shows that the RI
LBPoperators aremore robust to handle texture rotation. But it isuseful to note that the discriminative power of these descriptorswhen applied to non-rotated textures is significantly lower than
that of the standard LBP/C texture descriptor especially whenapplied to small images definedbyoriented textures (databaseTC
00002). Thus, the question that immediately arises is what causesthe drop in classification accuracy for RI descriptorswhen appliedtonon-rotated texturedatabases?Toanswer this questionweneed
to revisit Section 2.2 where the calculation of these RI descriptorsis presented. In our opinion, this drop in classification can becaused by two factors, either by the image interpolation that is
applied to calculate the intensity values of the pixels in the circularneighbourhood that arenotpositionedexactlyon the imagegridor
by the poor discriminative power offered by the “uniform”patterns (we recall that the non-uniformpatterns are labelledwiththe same value P þ 1). To clarify the impact of the interpolation
procedure on the discriminative power of the LBP descriptors, inthis paper we propose an approach that implements a newLBP/C
operator where the LBP value is calculated within the circularpattern (P ¼ 8, R ¼ 1) shown in Figure 3(a). The LBP values forthe circularly symmetric texture unit are calculated using equation
(2) and the new operator is referred to as LBP_C8. Theclassification results obtained when this new texture descriptor(LBP_C8) is employed are illustrated in Table III.From the results outlined in Table III it can be concluded
that image interpolation does not have a negative impact on
the classification accuracy (in fact the classification results areeven better than those obtained when the standard LBP/Cdescriptor was evaluated) and we can safely assume that the
loss in discrimination associated with the RI LBP descriptors
is caused by the relative weak discrimination offered by the
“uniform” patterns in sampling the texture characteristics.This conclusion is also validated by the accurate classification
results obtained when the RI LBP operators were applied toBrodatz databases (Table I) and these results are motivated bythe fact that the Brodatz databases are constructed using
images defined by isotropic textures that would favour the RIassociated with the RI LBP texture descriptors.To further analyse theperformanceof theRILBPoperators, the
next tests were conducted to evaluate whether the inclusion of theRI LBP operators into a multi-resolution classification approach
would produce better results. To achieve this, we haveconcatenated the distributions that have been obtained when theRI LBP operators are calculated for all pattern sizes shown in
Figure 3 ((P ¼ 8, R ¼ 1), (P ¼ 16, R ¼ 2) and (P ¼ 24, R ¼ 3)).The multi-resolution operator is referred to as LBPri
MR and theclassification results when this operator has been applied toOutex
and Brodatz databases are depicted in Tables I and II. Theexperimental results indicate that the performance of the newmulti-resolution operator is higher than the results attained when
the RI LBP operators have been applied to texture databases ateach resolution. The improved performance of the multi-
resolution RI LBP operator is especially noticeable when appliedtodatabasesTC00001,TC00002andTC00010.Basedon theseexperimental results we conclude that the discriminative power of
the distribution of the “uniform” patterns improves dramaticallywhen they are jointly analysed at different resolutions.
3.3 Classification results for the multi-channel GF
technique
In this section we evaluate the classification results achieved
using the multi-channel texture decomposition techniquedetailed in Section 2.3. In our experiments we have filtered
Figure 6 Samples of the 24 textures contained in the Outex databases
Source: Ojala et al. (2002b)
Local binary patterns versus signal processing texture analysis
Ovidiu Ghita, Dana Ilea, Antonio Fernandez and Paul Whelan
Sensor Review
Volume 32 · Number 2 · 2012 · 149–162
156

the input image with a small bank of filters with four (08, 458,
908, 1358) and six (08, 308, 608, 908, 1208, 1508) orientations.
The central frequency parameter was also varied by setting it
to the values 1.0/2p, 1.5/2p, 2.0/2p and 2.5/2p. Since the size
of the texture images in databases TC 00001 and TC 00002
is relatively small, the standard deviation (scale) parameter
was fixed to 1.0 to avoid the windowing errors caused by the
convolution with large filters (additional experimental tests on
the same databases (Brodatz, 1966; Ojala et al., 2002b) where
the scale parameter (s) is set to 1.5, 2.0 and 2.5 are available
online at: www.cipa.dcu.ie/code/TextureResults.pdf). The
calculation of the Gabor filter bank using a small value of
the scale parameter is also motivated by the fact that the LBP
descriptors are calculated within a small neighbourhood and
this will generate a fair scenario when their relative texture
classification performances are evaluated. (It is important to
note that in the implementation of large filter banks the values
Figure 7 The 36 textures from the Brodatz database used in our experiments
Source: Brodatz (1966)
Figure 8 Training process
Texture Database
LBP operators
LBP
LBP C
Vector size = 256 + b
SVM Classifier
Vector size = num_filters * 256
Joint distributions
4 or 6 oriented filters
Gabor/s-Filters Bank
SVM Classifier
Contrast
Local binary patterns versus signal processing texture analysis
Ovidiu Ghita, Dana Ilea, Antonio Fernandez and Paul Whelan
Sensor Review
Volume 32 · Number 2 · 2012 · 149–162
157
of the scale and the central frequency parameters are selectedto obtain an octave spaced filter bank.) The experimental testswere conducted on Outex and Brodatz databases as beforeand the classification results are outlined in Tables IV and V(to limit the size of these tables the classification results forBrodatz databases are only reported for six orientation(six angles) multi-channel texture decomposition).The results depicted in Table IV indicate that the best
classification results are obtained when the texture features areextracted using filter banks with six orientations and the centralfrequency is set to large values. This observation is valid only forexperiments carried out on databases that comprise non-rotated textures (TC00000,TC00001,TC00002, BD00000,BD 00001 and BD 00002). When the experiments wereconducted using rotated textures (TC 00010) the best resultsare obtained when the central frequency parameter is set to lowvalues. These results are surprising since we can notice a clearsimilarity with the results obtained when the LBP techniqueswere evaluated. In other words by lowering the value of thecentral frequency we simply filtered out the high frequency
components from the texture spectrum and this is somewhatsimilar to the “uniformity” concept enforced in the calculationof the RI LBP distributions. Thus, the classification resultsshow better performance in the presence of texture rotation.Nonetheless, when the value of the central frequency isincreased, theGabor filters approximate oriented operators andthe direction of the texture plays a crucial role in theclassification process.
3.4 Classification results for the S-Filtering technique
The S-Filters were introduced by Schmid (2001) to extract aset of RI texture features that can be used to model genericdescriptors for image retrieval. The 2D S-Filters areconstructed using equation (8) where the scale s andfrequency t are the parameters that model the spectralsensitivity of these filters. In the original implementation
Table I Experimental results for the LBP descriptors with respect toimage size
Database Method Accuracy (%)
TC 00000 (128 3 128) LBP/C bins ¼ 4 100
LBP/C bins ¼ 8 100
LBP/C bins ¼ 16 97.91
LBPri8,1 92.50
LBPri16,2 87.91
LBPri24,3 86.25
LBPriMR 92.91
TC 00001 (64 3 64) LBP/C bins ¼ 4 98.48
LBP/C bins ¼ 8 98.48
LBP/C bins ¼ 16 98.86
LBPri8,1 91.85
LBPri16,2 90.24
LBPri24,3 91.38
LBPriMR 97.15
TC 00002 (32 3 32) LBP/C bins ¼ 4 92.32
LBP/C bins ¼ 8 93.59
LBP/C bins ¼ 16 94.47
LBPri8,1 77.89
LBPri16,2 73.05
LBPri24,3 67.50
LBPriMR 87.54
BD_00000 (256 3 256) LBP/C bins ¼ 4 95.83
LBP/C bins ¼ 8 100
LBP/C bins ¼ 16 100
LBPri8,1 94.44
LBPri16,2 93.05
LBPri24,3 93.05
LBPriMR 95.83
BD_00001 (128 3 128) LBP/C bins ¼ 4 99.65
LBP/C bins ¼ 8 99.65
LBP/C bins ¼ 16 100
LBPri8,1 100
LBPri16,2 98.95
LBPri24,3 97.22
LBPriMR 99.65
BD_00002 (64 3 64) LBP/C bins ¼ 4 96.87
LBP/C bins ¼ 8 96.87
LBP/C bins ¼ 16 96.79
LBPri8,1 94.44
LBPri16,2 94.36
LBPri24,3 93.23
LBPriMR 95.75
Table III Experimental results for the LBP_C8 texture descriptor
Database Method Accuracy (%)
TC 00000 (128 3 128) LBP_C8 bins ¼ 4 100
LBP_C8 bins ¼ 8 100
LBP_C8 bins ¼ 16 97.50
TC 00001 (64 3 64) LBP_C8 bins ¼ 4 99.05
LBP_C8 bins ¼ 8 99.24
LBP_C8 bins ¼ 16 99.24
TC 00002 (32 3 32) LBP_C8 bins ¼ 4 93.63
LBP_C8 bins ¼ 8 94.97
LBP_C8 bins ¼ 16 94.99
TC 00010 (128 3 128) LBP_C8 bins ¼ 4 61.09
LBP_C8 bins ¼ 8 68.02
LBP_C8 bins ¼ 16 70.67
BD_00000 (256 3 256) LBP_C8 bins ¼ 4 97.22
LBP_C8 bins ¼ 8 97.22
LBP_C8 bins ¼ 16 98.61
BD_00001 (128 3 128) LBP_C8 bins ¼ 4 99.65
LBP_C8 bins ¼ 8 99.65
LBP_C8 bins ¼ 16 100
BD_00002 (64 3 64) LBP_C8 bins ¼ 4 96.70
LBP_C8 bins ¼ 8 96.79
LBP_C8 bins ¼ 16 96.61
Table II Experimental results for the LBP descriptors with respect totexture rotation
Database Method Accuracy (%)
TC 00010 (128 3 128) LBP/C bins ¼ 4 63.69
LBP/C bins ¼ 8 69.42
LBP/C bins ¼ 16 71.30
LBPri8,1 84.66
LBPri16,2 87.50
LBPri24,3 85.23
LBPriMR 89.68
Local binary patterns versus signal processing texture analysis
Ovidiu Ghita, Dana Ilea, Antonio Fernandez and Paul Whelan
Sensor Review
Volume 32 · Number 2 · 2012 · 149–162
158

(Schmid, 2001) the filter set has been constructed by varying
the scale s between 2 and 10 and t between 0 and 4. In our
implementation we have implemented a filter set using the
following pairs for (s, t): (1,0), (2,1), (4,1), (6,2), (8,3),
(10,4) and the experimental results are depicted in Table VI.
The results depicted inTableVI indicate that the best results are
obtained when this technique is applied to the database TC00010 and Brodatz databases (this is motivated by the fact that
the Brodatz textures have strong isotropic characteristics).In Table VI, it can be observed that the classification accuracydrops significantly when this texture analysis scheme is applied
to small images (database TC 00002). We conclude that thetexture features extracted by filtering the texture images with a
bank of S-Filters are suitable to discriminate isotropic textures,but are inefficient when applied to the classification of oriented
textures, which is in line with the concept behind this textureanalysis technique.
3.5 Classification results for the LM and MR8 filter
banks
While the texture analysis techniques based on filtering the
input images with Leung and Malik (LM) (Leung and Malik,2001) and Maximum Response (MR8) filter banks (Varma
and Zisserman, 2004) are standard signal processingapproaches that sample the texture characteristics using
multi-channel filter banks, in this section we evaluate theirperformance when applied to Outex and Brodatz databases.The LM is a multi-scale, multi-orientation filter bank that
consists of 48 filters (36 oriented and 12 isotropic). Fromthese 48 filters, 36 are calculated using the first and second
derivative of the Gaussian for three scales (sx,sy) ¼ {(1,3),(2,6), (4,12)}, six orientations and two phases (to implement
odd and even-symmetric filters), eight isotropic filters aregenerated using the Laplacian of Gaussian (LoG) and the
remaining four isotropic filters are calculated using thestandard Gaussian. The MR8 filter bank is obtained byrecording only the filter from the LM bank that generates the
maximum response from all orientations for the symmetricand odd filters at each scale (for more details refer to Varma
and Zisserman (2002, 2004)). Thus, the MR8 filter bank isformed by eight filters that implement a multi-scale RI filter
bank (in the original implementation detailed in (Varma andZisserman, 2004) only two isotropic filters were included in
the construction of the MR8 filter bank, where the standarddeviation for the Gaussian and LoG operators is set to tenpixels). The experimental results when the LM and MR8
filter banks are applied to the Outex and Brodatz databasesare depicted in Tables VII and VIII.The results depicted in Tables VII and VIII indicate that
sampling the texture properties using a large bank of filters is
unjustified and this observation is supported both by ourexperimental results and the findings reported in Varma and
Zisserman (2003). Our studies show that the textureorientation is the dominant textural property and thisobservation is supported by the fact that optimal classification
results are obtained when the texture features are calculated
Table IV Experimental results for the GF technique with respect toimage size
Database Method Accuracy (%)
TC 00000 (128 3 128) GF f0 ¼ 1.0/2p, four angles 85.83
GF f0 ¼ 1.5/2p, four angles 92.08
GF f0 ¼ 2.0/2p, four angles 96.25
GF f0 ¼ 2.5/2p, four angles 97.50
GF f0 ¼ 1.0/2p, six angles 86.25
GF f0 ¼ 1.5/2p, six angles 92.91
GF f0 ¼ 2.0/2p, six angles 97.08
GF f0 ¼ 2.5/2p, six angles 98.33
TC 00001 (64 3 64) GF f0 ¼ 1.0/2p, four angles 83.99
GF f0 ¼ 1.5/2p, four angles 90.62
GF f0 ¼ 2.0/2p, four angles 96.96
GF f0 ¼ 2.5/2p, four angles 98.20
GF f0 ¼ 1.0/2p, six angles 84.75
GF f0 ¼ 1.5/2p, six angles 91.47
GF f0 ¼ 2.0/2p, six angles 97.72
GF f0 ¼ 2.5/2p, six angles 98.95
TC 00002 (32 3 32) GF f0 ¼ 1.0/2p, four angles 64.35
GF f0 ¼ 1.5/2p, four angles 69.54
GF f0 ¼ 2.0/2p, four angles 86.07
GF f0 ¼ 2.5/2p, four angles 87.95
GF f0 ¼ 1.0/2p, six angles 63.26
GF f0 ¼ 1.5/2p, six angles 71.73
GF f0 ¼ 2.0/2p, six angles 86.73
GF f0 ¼ 2.5/2p, six angles 90.76
BD 00000 (256 3 256) GF f0 ¼ 1.0/2p, six angles 86.11
GF f0 ¼ 1.5/2p, six angles 91.66
GF f0 ¼ 2.0/2p, six angles 97.22
GF f0 ¼ 2.5/2p, six angles 100
BD 00001 (128 3 128) GF f0 ¼ 1.0/2p, six angles 94.09
GF f0 ¼ 1.5/2p, six angles 95.83
GF f0 ¼ 2.0/2p, six angles 98.95
GF f0 ¼ 2.5/2p, six angles 99.65
BD 00002 (64 3 64) GF f0 ¼ 1.0/2p, six angles 86.73
GF f0 ¼ 1.5/2p, six angles 93.58
GF f0 ¼ 2.0/2p, six angles 95.92
GF f0 ¼ 2.5/2p, six angles 96.61
Table V Experimental results for the GF technique with respect totexture rotation
Database Method Accuracy (%)
TC 00010 (128 3 128) GF f0 ¼ 1.0/2p, four angles 79.01
GF f0 ¼ 1.5/2p, four angles 68.28
GF f0 ¼ 2.0/2p, four angles 64.03
GF f0 ¼ 2.5/2p, four angles 60.72
GF f0 ¼ 1.0/2p, six angles 79.14
GF f0 ¼ 1.5/2p, six angles 68.88
GF f0 ¼ 2.0/2p, six angles 64.50
GF f0 ¼ 2.5/2p, six angles 63.15
Table VI Experimental results for the S-Filtering technique
Database Method Accuracy (%)
TC 00000 S-Filtering 59.58
TC 00001 66.19
TC 00002 46.15
TC 00010 68.61
BD 00000 75.00
BD 00001 74.30
BD 00002 66.69
Local binary patterns versus signal processing texture analysis
Ovidiu Ghita, Dana Ilea, Antonio Fernandez and Paul Whelan
Sensor Review
Volume 32 · Number 2 · 2012 · 149–162
159
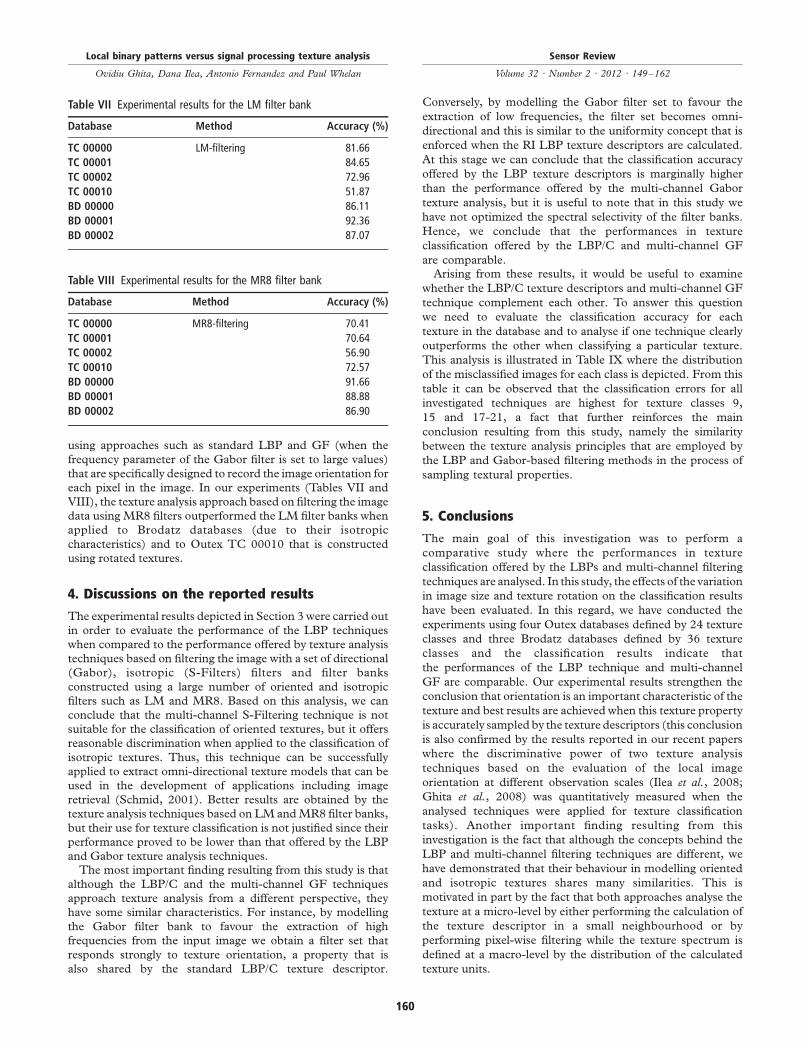
using approaches such as standard LBP and GF (when the
frequency parameter of the Gabor filter is set to large values)
that are specifically designed to record the image orientation for
each pixel in the image. In our experiments (Tables VII and
VIII), the texture analysis approach based on filtering the image
data using MR8 filters outperformed the LM filter banks when
applied to Brodatz databases (due to their isotropic
characteristics) and to Outex TC 00010 that is constructed
using rotated textures.
4. Discussions on the reported results
The experimental results depicted in Section 3 were carried out
in order to evaluate the performance of the LBP techniques
when compared to the performance offered by texture analysis
techniques based on filtering the image with a set of directional
(Gabor), isotropic (S-Filters) filters and filter banks
constructed using a large number of oriented and isotropic
filters such as LM and MR8. Based on this analysis, we can
conclude that the multi-channel S-Filtering technique is not
suitable for the classification of oriented textures, but it offers
reasonable discrimination when applied to the classification of
isotropic textures. Thus, this technique can be successfully
applied to extract omni-directional texture models that can be
used in the development of applications including image
retrieval (Schmid, 2001). Better results are obtained by the
texture analysis techniques based on LM andMR8 filter banks,
but their use for texture classification is not justified since their
performance proved to be lower than that offered by the LBP
and Gabor texture analysis techniques.The most important finding resulting from this study is that
although the LBP/C and the multi-channel GF techniques
approach texture analysis from a different perspective, they
have some similar characteristics. For instance, by modelling
the Gabor filter bank to favour the extraction of high
frequencies from the input image we obtain a filter set that
responds strongly to texture orientation, a property that is
also shared by the standard LBP/C texture descriptor.
Conversely, by modelling the Gabor filter set to favour the
extraction of low frequencies, the filter set becomes omni-
directional and this is similar to the uniformity concept that is
enforced when the RI LBP texture descriptors are calculated.
At this stage we can conclude that the classification accuracy
offered by the LBP texture descriptors is marginally higher
than the performance offered by the multi-channel Gabor
texture analysis, but it is useful to note that in this study we
have not optimized the spectral selectivity of the filter banks.
Hence, we conclude that the performances in texture
classification offered by the LBP/C and multi-channel GF
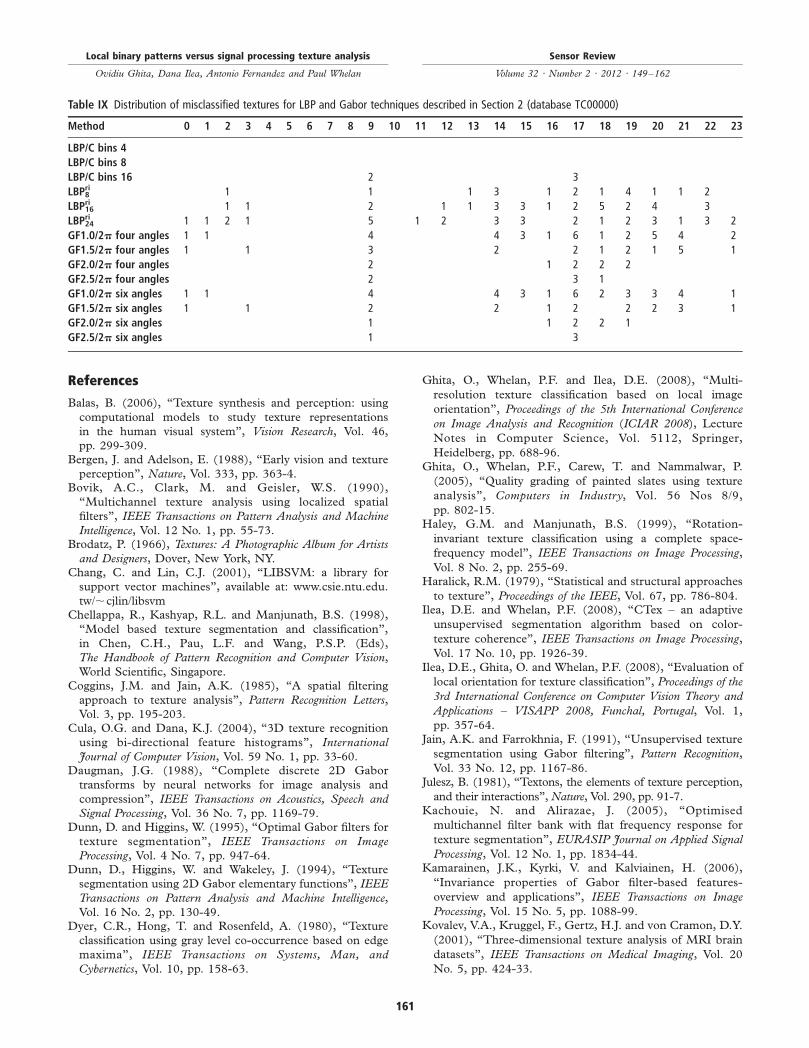
are comparable.Arising from these results, it would be useful to examine
whether the LBP/C texture descriptors and multi-channel GF
technique complement each other. To answer this question
we need to evaluate the classification accuracy for each
texture in the database and to analyse if one technique clearly
outperforms the other when classifying a particular texture.
This analysis is illustrated in Table IX where the distribution
of the misclassified images for each class is depicted. From this
table it can be observed that the classification errors for all
investigated techniques are highest for texture classes 9,
15 and 17-21, a fact that further reinforces the main
conclusion resulting from this study, namely the similarity
between the texture analysis principles that are employed by
the LBP and Gabor-based filtering methods in the process of
sampling textural properties.
5. Conclusions
The main goal of this investigation was to perform a
comparative study where the performances in texture
classification offered by the LBPs and multi-channel filtering
techniques are analysed. In this study, the effects of the variation
in image size and texture rotation on the classification results
have been evaluated. In this regard, we have conducted the
experiments using four Outex databases defined by 24 texture
classes and three Brodatz databases defined by 36 texture
classes and the classification results indicate that
the performances of the LBP technique and multi-channel
GF are comparable. Our experimental results strengthen the
conclusion that orientation is an important characteristic of the
texture and best results are achieved when this texture property
is accurately sampled by the texture descriptors (this conclusion
is also confirmed by the results reported in our recent papers
where the discriminative power of two texture analysis
techniques based on the evaluation of the local image
orientation at different observation scales (Ilea et al., 2008;
Ghita et al., 2008) was quantitatively measured when the
analysed techniques were applied for texture classification
tasks). Another important finding resulting from this
investigation is the fact that although the concepts behind the
LBP and multi-channel filtering techniques are different, we
have demonstrated that their behaviour in modelling oriented
and isotropic textures shares many similarities. This is
motivated in part by the fact that both approaches analyse the
texture at a micro-level by either performing the calculation of
the texture descriptor in a small neighbourhood or by
performing pixel-wise filtering while the texture spectrum is
defined at a macro-level by the distribution of the calculated
texture units.
Table VII Experimental results for the LM filter bank
Database Method Accuracy (%)
TC 00000 LM-filtering 81.66
TC 00001 84.65
TC 00002 72.96
TC 00010 51.87
BD 00000 86.11
BD 00001 92.36
BD 00002 87.07
Table VIII Experimental results for the MR8 filter bank
Database Method Accuracy (%)
TC 00000 MR8-filtering 70.41
TC 00001 70.64
TC 00002 56.90
TC 00010 72.57
BD 00000 91.66
BD 00001 88.88
BD 00002 86.90
Local binary patterns versus signal processing texture analysis
Ovidiu Ghita, Dana Ilea, Antonio Fernandez and Paul Whelan
Sensor Review
Volume 32 · Number 2 · 2012 · 149–162
160
References
Balas, B. (2006), “Texture synthesis and perception: using
computational models to study texture representations
in the human visual system”, Vision Research, Vol. 46,
pp. 299-309.Bergen, J. and Adelson, E. (1988), “Early vision and texture
perception”, Nature, Vol. 333, pp. 363-4.Bovik, A.C., Clark, M. and Geisler, W.S. (1990),
“Multichannel texture analysis using localized spatial
filters”, IEEE Transactions on Pattern Analysis and Machine
Intelligence, Vol. 12 No. 1, pp. 55-73.Brodatz, P. (1966), Textures: A Photographic Album for Artists
and Designers, Dover, New York, NY.Chang, C. and Lin, C.J. (2001), “LIBSVM: a library for
support vector machines”, available at: www.csie.ntu.edu.
tw/,cjlin/libsvmChellappa, R., Kashyap, R.L. and Manjunath, B.S. (1998),
“Model based texture segmentation and classification”,
in Chen, C.H., Pau, L.F. and Wang, P.S.P. (Eds),
The Handbook of Pattern Recognition and Computer Vision,
World Scientific, Singapore.Coggins, J.M. and Jain, A.K. (1985), “A spatial filtering
approach to texture analysis”, Pattern Recognition Letters,
Vol. 3, pp. 195-203.Cula, O.G. and Dana, K.J. (2004), “3D texture recognition
using bi-directional feature histograms”, International
Journal of Computer Vision, Vol. 59 No. 1, pp. 33-60.Daugman, J.G. (1988), “Complete discrete 2D Gabor
transforms by neural networks for image analysis and
compression”, IEEE Transactions on Acoustics, Speech and
Signal Processing, Vol. 36 No. 7, pp. 1169-79.Dunn, D. and Higgins, W. (1995), “Optimal Gabor filters for
texture segmentation”, IEEE Transactions on Image
Processing, Vol. 4 No. 7, pp. 947-64.Dunn, D., Higgins, W. and Wakeley, J. (1994), “Texture
segmentation using 2D Gabor elementary functions”, IEEE
Transactions on Pattern Analysis and Machine Intelligence,
Vol. 16 No. 2, pp. 130-49.Dyer, C.R., Hong, T. and Rosenfeld, A. (1980), “Texture
classification using gray level co-occurrence based on edge
maxima”, IEEE Transactions on Systems, Man, and
Cybernetics, Vol. 10, pp. 158-63.
Ghita, O., Whelan, P.F. and Ilea, D.E. (2008), “Multi-
resolution texture classification based on local image
orientation”, Proceedings of the 5th International Conference
on Image Analysis and Recognition (ICIAR 2008), Lecture
Notes in Computer Science, Vol. 5112, Springer,
Heidelberg, pp. 688-96.Ghita, O., Whelan, P.F., Carew, T. and Nammalwar, P.
(2005), “Quality grading of painted slates using texture
analysis”, Computers in Industry, Vol. 56 Nos 8/9,
pp. 802-15.Haley, G.M. and Manjunath, B.S. (1999), “Rotation-
invariant texture classification using a complete space-
frequency model”, IEEE Transactions on Image Processing,
Vol. 8 No. 2, pp. 255-69.Haralick, R.M. (1979), “Statistical and structural approaches
to texture”, Proceedings of the IEEE, Vol. 67, pp. 786-804.Ilea, D.E. and Whelan, P.F. (2008), “CTex – an adaptive
unsupervised segmentation algorithm based on color-
texture coherence”, IEEE Transactions on Image Processing,
Vol. 17 No. 10, pp. 1926-39.Ilea, D.E., Ghita, O. and Whelan, P.F. (2008), “Evaluation of
local orientation for texture classification”, Proceedings of the
3rd International Conference on Computer Vision Theory and
Applications – VISAPP 2008, Funchal, Portugal, Vol. 1,
pp. 357-64.Jain, A.K. and Farrokhnia, F. (1991), “Unsupervised texture
segmentation using Gabor filtering”, Pattern Recognition,
Vol. 33 No. 12, pp. 1167-86.Julesz, B. (1981), “Textons, the elements of texture perception,
and their interactions”, Nature, Vol. 290, pp. 91-7.Kachouie, N. and Alirazae, J. (2005), “Optimised
multichannel filter bank with flat frequency response for
texture segmentation”, EURASIP Journal on Applied Signal
Processing, Vol. 12 No. 1, pp. 1834-44.Kamarainen, J.K., Kyrki, V. and Kalviainen, H. (2006),
“Invariance properties of Gabor filter-based features-
overview and applications”, IEEE Transactions on Image
Processing, Vol. 15 No. 5, pp. 1088-99.Kovalev, V.A., Kruggel, F., Gertz, H.J. and von Cramon, D.Y.
(2001), “Three-dimensional texture analysis of MRI brain
datasets”, IEEE Transactions on Medical Imaging, Vol. 20
No. 5, pp. 424-33.
Table IX Distribution of misclassified textures for LBP and Gabor techniques described in Section 2 (database TC00000)
Method 0 1 2 3 4 5 6 7 8 9 10 11 12 13 14 15 16 17 18 19 20 21 22 23
LBP/C bins 4
LBP/C bins 8
LBP/C bins 16 2 3
LBPri8 1 1 1 3 1 2 1 4 1 1 2
LBPri16 1 1 2 1 1 3 3 1 2 5 2 4 3
LBPri24 1 1 2 1 5 1 2 3 3 2 1 2 3 1 3 2
GF1.0/2p four angles 1 1 4 4 3 1 6 1 2 5 4 2
GF1.5/2p four angles 1 1 3 2 2 1 2 1 5 1
GF2.0/2p four angles 2 1 2 2 2
GF2.5/2p four angles 2 3 1
GF1.0/2p six angles 1 1 4 4 3 1 6 2 3 3 4 1
GF1.5/2p six angles 1 1 2 2 1 2 2 2 3 1
GF2.0/2p six angles 1 1 2 2 1
GF2.5/2p six angles 1 3
Local binary patterns versus signal processing texture analysis
Ovidiu Ghita, Dana Ilea, Antonio Fernandez and Paul Whelan
Sensor Review
Volume 32 · Number 2 · 2012 · 149–162
161
Lahajnar, F. and Kovacic, S. (2003), “Rotation-invarianttexture classification”, Pattern Recognition Letters, Vol. 24Nos 9/10, pp. 1141-61.
Leung, T. and Malik, J. (2001), “Representing andrecognizing the visual appearance of materials using three-dimensional textons”, International Journal of ComputerVision, Vol. 43 No. 1, pp. 29-44.
Liu, X. and Wang, D. (2003), “Texture classification usingspectral histograms”, IEEE Transactions on Image Processing,Vol. 12 No. 6, pp. 661-70.
Maenpaa, T., Viertola, J. and Pietikainen, M. (2003),“Optimising colour and texture features for real-timevisual inspection”, Pattern Analysis and Applications, Vol. 6No. 3, pp. 169-75.
Mallat, S.G. (1989), “A theory for multiresolution signaldecomposition: the wavelet representation”, IEEETransactions on Pattern Analysis and Machine Intelligence,Vol. 11 No. 7, pp. 674-93.
Manjunath, B.S. and Ma, W.Y. (1996), “Texture features forbrowsing and retrieval of image data”, IEEE Transactions onPattern Analysis and Machine Intelligence, Vol. 18 No. 8,pp. 837-42.
Materka, A. and Strzelecki, M. (1998), “Texture analysismethods – a review”, Technical Report, University of Lodz,Lodz, Cost B11 Report.
Nammalwar, P., Ghita, O. and Whelan, P.F. (2003),“Experimentation on the use of chromaticity features,local binary pattern and discrete cosine transform in colourtexture analysis”, Proceedings of the Scandinavian Conferenceon Image Analysis (SCIA 2003), Goteborg, Sweden,pp. 186-92.
Nammalwar, P., Ghita, O. and Whelan, P.F. (2010),“A generic framework for colour texture segmentation”,Sensor Review, Vol. 30 No. 1, pp. 69-79.
Ojala, T., Pietikainen, M. and Harwood, D. (1994),“Performance evaluation of texture measures withclassification based on Kullback discrimination ofdistributions”, Proceedings of the International Conference onPattern Recognition (ICPR), Jerusalem, Israel, pp. 582-5.
Ojala, T., Pietikainen, M. and Maenpaa, T. (2002a),“Multiresolution gray-scale and rotation invariant textureclassification with local binary patterns”, IEEE Transactionson Pattern Analysis and Machine Intelligence, Vol. 24 No. 7,pp. 971-87.
Ojala, T., Valkealahti, K. and Pietikainen, M. (2001),“Texture discrimination with multidimensionaldistributions of signed gray-level differences”, PatternRecognition, Vol. 34 No. 3, pp. 727-39.
Ojala, T.,Maenpaa, T., Pietikainen,M., Viertola, J., Kyllonen, J.and Huovinen, S. (2002b), “Outex – a new framework forempirical evaluation of texture analysis algorithms”,Proceedings of the 16th International Conference on PatternRecognition (ICPR 2002), Quebec, Canada, Vol. 1, pp. 701-6.
Petrou, M. and Sevilla, P.G. (2006), Image Processing: Dealingwith Texture, Wiley, Chichester.
Porter, R. and Canagarajah, N. (1997), “Robust rotation-invariant texture classification: wavelet, Gabor filter andGMRF based schemes”, IEE Proceedings – Vision, Image,and Signal Processing, Vol. 144 No. 3, pp. 180-8.
Randen, T. and Husoy, J.H. (1999a), “Filtering for textureclassification: a comparative study”, IEEE Transactions onPattern Analysis and Machine Intelligence, Vol. 21 No. 4,pp. 291-310.
Randen, T. and Husoy, J.H. (1999b), “Texture segmentationusing filters with optimized energy separation”, IEEETransactions on Image Processing, Vol. 8 No. 4, pp. 571-82.
Rodriguez, Y. and Marcel, S. (2006), “Face authenticationusing adapted local binary pattern histograms”, Proceedingsof the 9th European Conference on Computer Vision (ECCV2006), Graz, Austria, Vol. 4, pp. 321-32.
Schmid, C. (2001), “Constructing models for content-basedimage retrieval”, Proceedings of the IEEE Conference onComputer Vision and Pattern Recognition (CVPR 2001),Vol. 2, pp. 39-45.
Tosun, A.B. and Gunduz-Demir, C. (2011), “Graph run-lengthmatrices for histopathological image segmentation”, IEEETransactions on Medical Imaging, Vol. 30 No. 3, pp. 721-32.
Tsatsanis, M.K. and Giannakis, G.B. (1992), “Object andtexture classification using higher order statistics”,IEEE Transactions on Pattern Analysis and MachineIntelligence, Vol. 14 No. 7, pp. 733-50.
Tuceryan, M. and Jain, A.K. (1998), “Texture analysis”, inChen, C.H., Pau, L.F. and Wang, P.S.P. (Eds),The Handbook of Pattern Recognition and Computer Vision,World Scientific, Singapore.
Valkealahti, K. and Oja, E. (1998), “Reducedmultidimensional co-occurrence histograms in textureclassification”, IEEE Transactions on Pattern Analysis andMachine Intelligence, Vol. 20 No. 1, pp. 90-4.
Varma, M. and Zisserman, A. (2002), “Classifying images ofmaterials: achieving viewpoint and illumination
independence”, Proceedings of the 7th European Conferenceon Computer Vision (ECCV 2002), Copenhagen, Denmark.
Varma, M. and Zisserman, A. (2003), “Texture classification:are filter banks necessary?”, Proceedings of the IEEEConference on Computer Vision and Pattern Recognition(CVPR 2003), Vol. 2, pp. 691-8.
Varma, M. and Zisserman, A. (2004), “Unifying statisticaltexture classification frameworks”, Image and VisionComputing, Vol. 22 No. 14, pp. 1175-83.
Weber, D.M. and Casasent, D.P. (2001), “Quadratic Gaborfilters for object detection”, IEEE Transactions on ImageProcessing, Vol. 10 No. 2, pp. 218-30.
Weszka, J.S., Dyer, C.R. and Rosenfeld, A. (1976),“A comparative study of texture measures for terrainclassification”, IEEE Transactions on Systems, Man andCybernetics, Vol. 6, pp. 269-85.
Xie, X. and Mirmehdi, M. (2007), “TEXEMS: textureexemplars for defect detection on random texturedsurfaces”, IEEE Transactions on Pattern Analysis andMachine Intelligence, Vol. 29 No. 8, pp. 1454-64.
Zhang, J. and Tan, T. (2002), “Brief review of invarianttexture analysis methods”, Pattern Recognition, Vol. 35No. 3, pp. 735-47.
Corresponding author
Ovidiu Ghita can be contacted at: [email protected]
Local binary patterns versus signal processing texture analysis
Ovidiu Ghita, Dana Ilea, Antonio Fernandez and Paul Whelan
Sensor Review
Volume 32 · Number 2 · 2012 · 149–162
162
To purchase reprints of this article please e-mail: [email protected]
Or visit our web site for further details: www.emeraldinsight.com/reprints