local accident information
TRANSCRIPT

1
An Experimental Study into the Impact of Local Accident Information on Driver’s Route Planning Behaviour
Y. Zheng, C.W. Johnson, M.R. McGee and P.D. Gray,
Glasgow Accident Analysis Group,
Dep.t of Computing Science, University of Glasgow, Glasgow, G12 8QQ. {zhengy,johnson,mcgeemr,pdg}@dcs.gla.ac.uk +44 141 330 6053 (tel.), +44 141 330 4913 (fax)
Abstract: Government and regulatory agencies rely on the presentation of national and aggregate statistics to influence driver behaviour. The intention is, for instance, to illustrate the dangers of drink driving by publicising the number of road users who die annually from accidents involving alcohol abuse. These aggregate statistics often have only a limited impact on driver behaviour. Experimental studies have shown the effects of attribution error, it is easy to believe that these adverse events will ‘never happen to me’. The following pages describe the development of a web-based system Geographical Information System that enables drivers to find out about previous accidents on their local roads. Unfortunately, it can be difficult to show that the provision of such information has an impact on driver behaviour. Psychometric risk assessments provide indirect evidence for the utility of such driver information systems. In contrast, this paper goes on to describe an experimental study into the effects that local accident information has on drivers’ route planning tasks. Our results show that information about previous accidents can encourage two cohorts of taxi drivers to change their routes both for areas in which they work and for journeys on roads with which they are less familiar. We chose taxi drivers because these individuals often have the highest exposure to the risks of driving and, consequently, have amongst the highest insurance premiums. The closing sections use the results from this study to inform the development of in-car systems that provide safety-related information based on the frequency of previous accidents just as existing GPS tools provide data about average delays and fuel consumption. Such information will become increasingly important as insurance companies continue to develop GPS-based systems derived from Electronic Road Pricing applications. These systems will calculate insurance premiums based on risk exposure during individual journeys rather than charging drivers an annual aggregate fee. Keywords: Driver behaviour; safety; accident information; route planning.
1. Introduction In the UK, road traffic accidents are the leading injury-related cause of death among people aged between 15 and 44. Approximately 4,000 people died every year from road traffic accidents. 30 percent of all accidents are due to drink-driving. The World Health Organisation has estimated that more than 1.2 million people are killed in road traffic accidents every year. The annual death toll on US roads alone exceeds 40,000 per annum. A number of national and international initiatives have been launched to address these statistics. A World Health Day was organised to focus public attention on road safety around the globe. In the UK successive governments have launched initiatives, such as “Think!” (UK Department of Transport, 2005). There have also been regional projects including the Scottish Roads Safety Campaign (2005). The aim of these projects has been to reduce traffic accidents by increasing public awareness of road safety issues.

2
Many of these initiatives rely upon national or regional statistics similar to those cited in the opening paragraph. Aggregate values are presented in a range of graphs and tables. However, these high level aggregate statistics can have a limited effect on driver behaviour (Noy, 1997). For example, many individuals feel that these adverse events will not happen to them. Such ‘attribution errors’ occur because many drivers believe they are more careful, have more experience or understand the driving environment better than their peer group. A number of other problems also explain the limited success of national and regional road safety campaigns. In particular, this information is only one of many competing themes that appear in a growing number of public health and safety campaigns. Everyday, we are surrounded by government advice on diet and exercise. We are presented with messages in the press and broadcast media about the dangers of anti-social behaviour and the need to follow particular norms. For example, a recent UK campaign against driving while tired involved four posters, a leaflet, several different radio advertisements as well as a ‘brand partnership activity’ that included companies sponsoring the distribution of a tiredness test. The importance of these initiatives should not be underestimated, however, the cumulative effect of these campaigns can help to reduce the effectiveness of particular messages. In a previous study, we have shown that many road users are insufficiently motivated to follow much of the road safety information that has been produced by national and regional agencies [Zheng and Johnson, 2005].
Figure 1: Example of UK National Road Safety Campaign
As part of this earlier work, we conducted a number of focus groups with different categories of road users including pedestrians and cyclists as well as drivers. We also consulted with a range of road planning agencies and local government officials. These meetings helped to identify the importance of local road safety information. Individuals were concerned to find out about previous accidents on the roads that they used most. We, therefore, went on to develop a Geographical Information System, illustrated in Figure 2. Users can manipulate this system to zoom into a map of their local area down to the level of individual

3
streets. Individual accidents appear as small dots that can be selected to extract further details about the circumstances surrounding each of these mishaps. Unlike existing systems, this application does not simply provide information about current accidents on a particular stretch of road. Instead, it provides access to information about previous accidents that stretch back up to a decade.
Accident locations
denoted by dots.
Tool tip providing accident identifier of
selected event.
Information panel showing contributory
factors for the selected accident.
Menus and buttons used to control the filtering of accidents shown on the map.
Control panel for manipulating the view of the map.
Figure 2: Interface to the Local Accident Information System The development of this local accident information system was partly motivated by wider movements within the Information Systems communities. There has been a recent trend to tailor the presentation of a broad range of data to suit the particular needs of local citizens. For example, Don Brown’s group at the University of Virginia have used this approach to show how property crime can spread within a district. Again, the intention has been to show the tremendous micro-variations that are often hidden by aggregate statistics [Chung et al, 2004]. 2. The Problems of Validation Recent work in localised information systems raises a number of research questions. In particular, it can be difficult to validate the utility of these applications given that they provide access to information that would not otherwise have been available through national, aggregate sources. From our perspective, it is difficult to determine what impact a localised accident information system might have upon driver behaviour. In early studies, we validated our system using techniques from psychometric risk assessment. Ulleberg and Rundmo’s [2004] work on eliciting information about the impact of personality and attitudes on driver behavior was combined with Iversen’s [2003] questionnaire on adolescent driving behavior. We also integrated aspects of Schmidt’s [2004] studies on the impact of environmental factors on risk perception. The validation exercises began by selecting a diverse group of road users. We took a series of bench-mark measures using the hybrid questionnaire. This provided a ‘snap-shot’ of existing attitudes to driver

4
behavior and road safety. For example, one question asked the subjects to rate ‘How safe do you feel in terms of the likelihood that you could be injured in a road traffic accident?’ on a scale from 1 “safe” to 10 “unsafe”. Another question asked them ‘how much influence do your actions have on whether or not you are involved in a road accident?’ A similar ten-point scale was also used to respond to this question. Each of the participants was then encouraged to browse one of the national road safety sites, mentioned in the previous section. They were then asked the same questions to assess whether this aggregate information had any impact on their expressed attitudes. As might be expected, there were only marginal changes in the results to these psychometric questions. We then repeated the experimental procedure with a balanced group of subjects to determine the impact of using our localised information system rather than the national web site. The subjects were asked about the likelihood that they would be involved in an accident before using our localised accident information system and afterwards. They were also asked about their driving behaviour. The hypothesis was that a bigger impact would be observed on expressed attitudes than could be seen from using the national site. Figure 3 provides an example of the results that were obtained from this preliminary study. Brevity prevents a complete analysis of the results. Our findings showed that although the hypothesis was demonstrated to a limited extent, the differences were not statistically significant. Following this initial study, we endeavored to identify other metrics to support the validation of our localized approach to the provision of accident information. In particular, we looked for techniques that might both demonstrate the utility of the approach to sponsoring organizations and which would produce results to drive subsequent iterations in the development cycle of our driver information systems.
1
2
34
56
78
9
10
1=sa
fe, 1
0=un
safe
1 2 3 4 5 6 7 8
Participants
Before
After
a) Effects of National Aggregate Data Source
123456789
10
1=sa
fe, 1
0=un
safe
1 2 3 4 5 6 7 8
Participants
Before
After
b) Effects of Localised Information Figure 3: How safe do you feel in terms of the likelihood that you could be injured in a road accident? As mentioned, our initial psychometric study provided inconclusive results. Subsequent debriefings of the study participants yielded a number of possible explanations. Many participants explained that they had never considered their responses to the psychometric questions before. They, therefore, found it correspondingly difficult to form a coherent response even after they had been provided with access to the national or localized accident information. There are further explanations. We had deliberately developed the initial evaluation to address as large a range of road users as possible. The study participants included many different age groups and

5
backgrounds. It also spanned several different categories of road users. It can be argued that many of the preoccupations that motivate research into psychometric risk perception are not shared by many of the road users in this broad sample. A further consequence of using a broad sample population was that we did not tie the study into any particular task that might have been performed by the road users. This paper, therefore, reports on a subsequent study that addressed these potential limitations with the previous validation of localized road accident information systems. The first version of the tool enabled users to zoom into particular streets and areas. Individual accidents were shown as colored dots on the surface of the map. The focus groups and de-brief sessions after the first validation exercise revealed a number of different ways in which the system could be enhanced. For example, route-planning systems enable users to compare statistical information about different journeys. This information includes average journey times, distance over alternate routes, average fuel consumption for different types of vehicle and so on. Users of these systems can also choose routes that avoid particular types of roads, such as motorways. It is interesting to note that none of the existing systems seem to provide drives with road safety information.
Figure 4: Route Planner on AA’s website (Acknowledgement: www.theAA.com)
Figure 4 illustrates the web-based interface to the UK Automobile Association’s route planning system. Drivers can enter the start and end points of a journey to obtain detailed instructions for several different routes. Users can specify whether they would prefer to have competing routes ranked by distance, cost etc. It seemed clear to several of the potential end-users of our original prototype that our system might be integrated with such an application to also provide drivers and other road users with information about the relative safety record of different routes. Experiment Design
The insights obtained form our initial validation led us to design an experiment focusing on the route choices that drivers make rather than their perception of risk. We, therefore, asked drivers to rank a number of alternate routes by order of preference. In the first condition, the subjects were only provided with information that is similar to a conventional route planner. This included an indication of the average time taken to complete each section of the journey. A second condition asked them to repeat the same task over a

6
different journey except that this time they were also provided with information about previous accidents on each stage of the various competing routes. We chose to provide information about the total number of accidents over a five-year window rather than accident rates calculated against, for instance, traffic frequency. This decision was justified by a pilot study that indicated many drivers have problems in comparing cumulative frequencies for multi-stage journeys where the accident rates are very low. As we shall see, however, further work is required to validate this decision. We chose to adopt a within subject design and decided to focus on taxi drivers. This decision was justified by the observation that this group have an extremely high-risk exposure and hence have both a commercial and personal motivation to consider localised accident information systems. The decision to focus on this user group introduced a number of additional complications into our experimental design. In particular, we were forced to consider the other types of local knowledge that might help to shape the taxi driver’s route planning. We were concerned that their experience of delays on certain routes or particular environmental issues including road layout might have a greater impact on route selection than any information about average journey times or even localised accident information. We, therefore, decided to repeat the test using two different route-planning tasks. One was based in the centre of Glasgow and hence was familiar to the drivers. The other was set in central Manchester. We ensured that none of the participants had ever driven in this area before starting the evaluation. This method was, therefore, intended to support two different but complementary hypotheses: Hypothesis 1: Drivers’ preferences between several different routes would be affected by the provision of accident information on routes that they are familiar with. Hypothesis 2: Drivers’ preferences between several different routes would be affected by the provision of accident information on routes that they are unfamiliar with. The independent variable for this experiment was the ranking of the candidate routes by the driver. The dependent variable was the provision of road accident information for familiar areas (hypothesis 1) and the provision of road accident information for areas that the driver had no experience of (hypothesis 2). Measurement and tests It is difficult to argue that drivers’ route preferences will be normally distributed. We, therefore, could not rely on a t-test and instead decided to use a non-parametric sign test. The general procedure is as followed. 1. Inspect the difference between each pair of scores. Put a plus sign (+) next to the differences in one
direction, and a minus sign (-) next to the differences in the other direction. In this case, we would award a + if a particular route was ranked more highly in one condition than in the next. A – would be assigned if that route fell in the rankings, for example after a taxi driver had access to local accident information.
2. Find the total number of either + or –, whichever occurs less frequently. Let this number be x. 3. Find the critical value of x for the desired level of significance using a standard table. This value will
depend upon (1) N, the total number of pairs, and (2) whether the prediction is directional. 4. If x is less than or equal to the critical value, reject the null hypothesis in favor of the alternate
hypothesis that the independent variable has had an effect on behavior.

7
If a pair of scores are equal they should be dropped from the analysis, and the value of N reduced accordingly. Results and Analysis Our initial experiment focussed on 10 taxi drivers working in the centre of Glasgow, the largest city in Scotland. Table 1 presents the results that were obtained when these potential users were asked to rank different routes across the city where they worked. The left-hand section of the table documents the order of preference for routes before accident information was provided. For instance, the row labelled S1 represents the first subject’s preference for route R5 above R7, which was preferred over R4 and so on. The right of Table 1 illustrates the changes in preference after the subjects were provided with the map that included information about previous accidents on those routes.
Route Ranking (no accident information)
Route Ranking (local accident information)
1 2 3 4 5 6 7 1 2 3 4 5 6 7 S1 R5 R7 R4 R6 R3 R2 R1 R7 R5 R1 R3 R4 R2 R6 S2 R5 R6 R7 R4 R3 R2 R1 R5 R6 R7 R4 R3 R2 R1 S3 R5 R6 R7 R1 R2 R3 R4 R7 R5 R1 R4 R3 R2 R6 S4 R5 R6 R7 R4 R3 R2 R1 R7 R5 R1 R3 R4 R2 R6 S5 R5 R7 R6 R3 R4 R2 R1 R7 R5 R4 R3 R6 R1 R2 S6 R5 R6 R7 R4 R3 R2 R1 R7 R5 R1 R4 R6 R3 R2 S7 R5 R7 R6 R4 R3 R2 R1 R7 R5 R4 R1 R3 R6 R2 S8 R5 R7 R6 R3 R4 R2 R1 R7 R5 R4 R3 R6 R1 R2 S9 R5 R7 R6 R4 R3 R2 R1 R7 R5 R1 R3 R4 R6 R2 S10 R5 R6 R7 R4 R3 R2 R1 R7 R5 R1 R4 R3 R2 R6
Table 1: Preferences for the Glasgow route finding task
Number of ‘ ’s
Number of ‘ ’s
Number unchanged
P value
R1 9 0 1 0.00391 R2 0 6 4 0.0313 R3 4 1 5 0.375 R4 4 3 3 1 R5 0 9 1 0.00391 R6 0 9 1 0.00391 R7 9 0 1 0.00391
Table 2: Sign test result for the Glasgow route finding task Table 2 provides the results obtained from applying the Sign test in the manner described in previous sections. The results show that the provision of local road accident information did affect the rankings of all routes. If we choose the 0.05 level of significance then the P-values obtained from a two-tailed sign test show that the provision of this information had a significant impact on the ranking for routes R1, R2, R5,
8
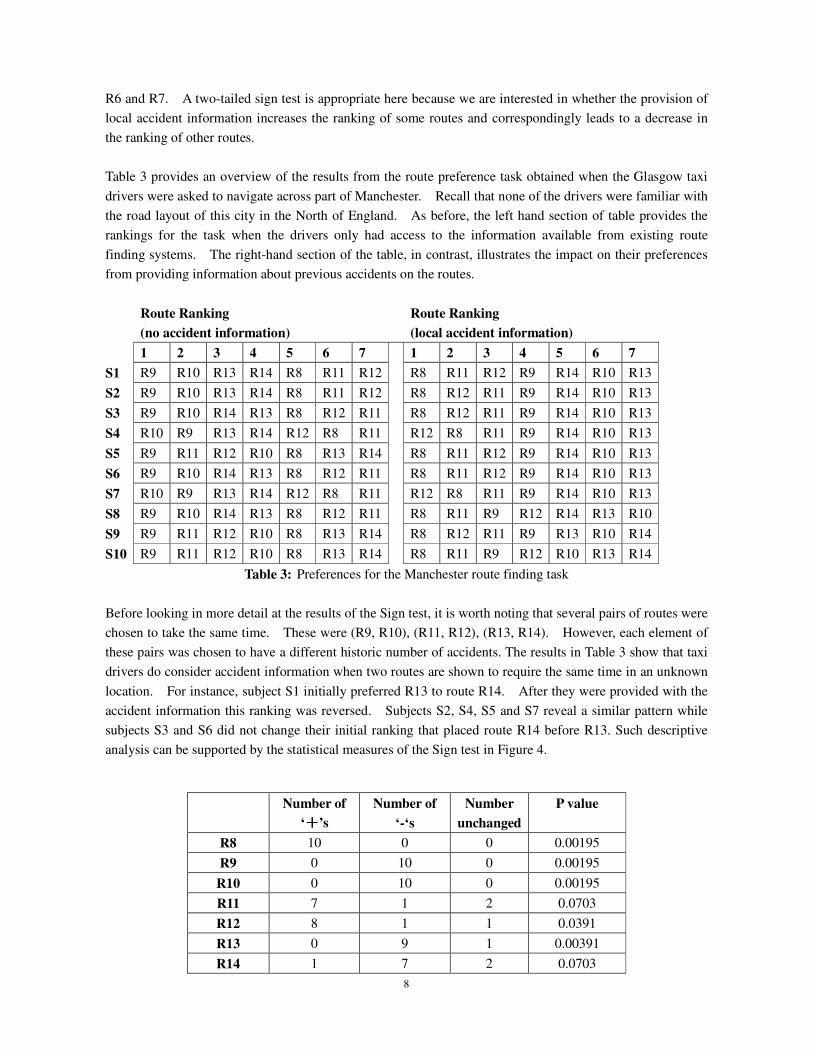
R6 and R7. A two-tailed sign test is appropriate here because we are interested in whether the provision of local accident information increases the ranking of some routes and correspondingly leads to a decrease in the ranking of other routes. Table 3 provides an overview of the results from the route preference task obtained when the Glasgow taxi drivers were asked to navigate across part of Manchester. Recall that none of the drivers were familiar with the road layout of this city in the North of England. As before, the left hand section of table provides the rankings for the task when the drivers only had access to the information available from existing route finding systems. The right-hand section of the table, in contrast, illustrates the impact on their preferences from providing information about previous accidents on the routes.
Route Ranking (no accident information)
Route Ranking (local accident information)
1 2 3 4 5 6 7 1 2 3 4 5 6 7 S1 R9 R10 R13 R14 R8 R11 R12 R8 R11 R12 R9 R14 R10 R13 S2 R9 R10 R13 R14 R8 R11 R12 R8 R12 R11 R9 R14 R10 R13 S3 R9 R10 R14 R13 R8 R12 R11 R8 R12 R11 R9 R14 R10 R13 S4 R10 R9 R13 R14 R12 R8 R11 R12 R8 R11 R9 R14 R10 R13 S5 R9 R11 R12 R10 R8 R13 R14 R8 R11 R12 R9 R14 R10 R13 S6 R9 R10 R14 R13 R8 R12 R11 R8 R11 R12 R9 R14 R10 R13 S7 R10 R9 R13 R14 R12 R8 R11 R12 R8 R11 R9 R14 R10 R13 S8 R9 R10 R14 R13 R8 R12 R11 R8 R11 R9 R12 R14 R13 R10 S9 R9 R11 R12 R10 R8 R13 R14 R8 R12 R11 R9 R13 R10 R14 S10 R9 R11 R12 R10 R8 R13 R14 R8 R11 R9 R12 R10 R13 R14
Table 3: Preferences for the Manchester route finding task
Before looking in more detail at the results of the Sign test, it is worth noting that several pairs of routes were chosen to take the same time. These were (R9, R10), (R11, R12), (R13, R14). However, each element of these pairs was chosen to have a different historic number of accidents. The results in Table 3 show that taxi drivers do consider accident information when two routes are shown to require the same time in an unknown location. For instance, subject S1 initially preferred R13 to route R14. After they were provided with the accident information this ranking was reversed. Subjects S2, S4, S5 and S7 reveal a similar pattern while subjects S3 and S6 did not change their initial ranking that placed route R14 before R13. Such descriptive analysis can be supported by the statistical measures of the Sign test in Figure 4.
Number of ‘ ’s
Number of ‘-‘s
Number unchanged
P value
R8 10 0 0 0.00195 R9 0 10 0 0.00195
R10 0 10 0 0.00195 R11 7 1 2 0.0703 R12 8 1 1 0.0391 R13 0 9 1 0.00391 R14 1 7 2 0.0703

9
Table 4: Sign test result for the Manchester route finding task
Table 4 summarises the results of the Sign test for the Manchester route finding task. As before, the provision of local accident information has an effect on the ranking of all routes. However, the P-values indicate that the effects on the position of routes R8, R9, R10, R12 and R13 were statistically significant. We cannot conclude that the change in ranking of R11 and R14 were due to the provision of accident information and may simply have been due to change experimental effects. It seems clear that both hypothesis 1 and hypothesis 2 are supported by the results that are summarised in Tables 3 and 4. The provision of local accident information did have an effect on the ranking of routes for a town that was not well known to the taxi drivers. Access to this information also had an impact on the rankings associated with routes across a city that were used by the taxi drivers every day of their working lives. Our results showed significant differences for the rankings associated with five of the seven routes in both experimental conditions. This raised questions about the nature of those routes that were unaffected by the provision of information. One possibility is that these were routes that were never actively considered by the drivers, they appeared to be so undesirable that the provision of accident information was largely irrelevant. Debriefing sessions also raised further concerns about the conduct of this initial run. We used a prepared script to ensure that all of the taxi drivers received the same set of instructions. These asked them to “Please rank the following seven routes by order of preference. (From 1, which you think is the best route, to 7 which is your least favorite).” A small number of the drivers in this study were confused by this instruction and asked whether they were being asked to base their selection on speed or cost. We deliberately did not want to bias the criteria that they might use in their ranking. We, therefore, decided to conduct a second study using the same method but with ten more taxi drivers. The experimental instructions were changed to “From the point of view of your work as a taxi driver, please rank the following routes in order of preference from 1 to 7 where the first is the route that you would definitely use and the last is the route that you would be least likely to use.” We also decided to simplify the experiment slightly by marking the total time and cumulative number of accidents next to each route. Table 5 illustrates the results for this second cohort of taxi drivers on the routes across Glasgow city centre. Table 6 presents the results from the Sign test applied to this second set of route preferences in an area that is already familiar to the drivers.

10
Route Ranking (no accident information)
Route Ranking (local accident information)
1 2 3 4 5 6 7 1 2 3 4 5 6 7 S11 R5 R6 R7 R3 R4 R2 R1 R7 R5 R4 R6 R3 R1 R2 S12 R5 R6 R7 R3 R4 R2 R1 R7 R5 R6 R4 R3 R2 R1 S13 R5 R6 R7 R4 R3 R2 R1 R7 R5 R4 R6 R3 R1 R2 S14 R5 R6 R7 R4 R3 R2 R1 R7 R5 R4 R6 R3 R1 R2 S15 R5 R7 R6 R4 R3 R2 R1 R7 R5 R4 R1 R3 R6 R2 S16 R5 R6 R7 R3 R4 R2 R1 R7 R5 R6 R4 R3 R2 R1 S17 R5 R6 R7 R4 R3 R2 R1 R7 R5 R4 R6 R3 R1 R2 S18 R5 R7 R6 R3 R4 R2 R1 R7 R5 R6 R4 R3 R1 R2 S19 R5 R7 R6 R4 R3 R2 R1 R7 R5 R6 R4 R3 R1 R2 S20 R5 R6 R7 R3 R4 R2 R1 R7 R5 R4 R6 R3 R1 R2 Table 5: Second Cohort of Taxi Drivers’ Preferences on Glasgow route finding task
Number of ‘ ’s
Number of ‘ ’s
Number unchanged
P value
R1 8 0 2 0.00781 R2 0 8 2 0.00781 R3 0 5 5 0.0625 R4 9 0 1 0.00391 R5 0 10 0 0.00195 R6 0 8 2 0.00781 R7 10 0 0 0.00195
Table 6: Sign test result for the Second Cohort’s Glasgow route finding task As can be seen, the addition of localised accident information had a statistically significant impact on the ranking of all routes except for R3. It can be argued that by clarifying the experimental briefing and by providing cumulative totals for expected delays and raw accident frequencies, the provision of this additional safety information has had a strong effect on the taxi drivers’ rankings for the routes across the roads of a city where they work. Table 7 goes on to summarise the rankings associated with the Manchester routes for this second cohort of taxi drivers.

11
Route Ranking (no accident information)
Route Ranking (local accident information)
1 2 3 4 5 6 7 1 2 3 4 5 6 7 S11 R9 R10 R13 R14 R8 R11 R12 R8 R12 R9 R11 R14 R10 R13 S12 R9 R10 R13 R14 R8 R11 R12 R8 R12 R9 R11 R10 R14 R13 S13 R9 R10 R14 R13 R8 R11 R12 R8 R12 R11 R9 R14 R10 R13 S14 R10 R9 R13 R14 R12 R8 R11 R8 R12 R9 R11 R10 R14 R13 S15 R9 R10 R14 R13 R8 R11 R12 R8 R12 R9 R11 R10 R14 R13 S16 R9 R10 R14 R13 R8 R11 R12 R8 R12 R9 R11 R14 R10 R13 S17 R10 R9 R13 R14 R12 R8 R11 R8 R12 R9 R11 R10 R14 R13 S18 R9 R10 R14 R13 R8 R11 R12 R8 R12 R9 R11 R10 R14 R13 S19 R9 R10 R14 R13 R8 R12 R11 R8 R12 R11 R9 R14 R10 R13 S20 R9 R10 R13 R14 R8 R11 R12 R8 R12 R11 R9 R10 R13 R14 Table 7: Second Cohort’s Preferences on Manchester route finding task Table 8 presents the results of the Sign test on this second cohort of preferences from the Manchester study. As can be seen, the provision of localised accident information had a significant impact on the rankings associated with every route across this ‘unfamiliar’ road system. It is important to stress that the sign test does not provide a quantitative assessment of the strength of any effect. If a particular route were to be downgraded from first to seventh place then this would be registered as a single ‘-‘ value in the Sign test. However, the unequivocal results from this stage of our study in Table 8 illustrate the impact of localised accident information on the taxi drivers in our study.
Number of ‘ ’s
Number of ‘ ’s
Number unchanged
P value
R8 10 0 0 0.00195 R9 0 10 0 0.00195 R10 0 10 0 0.00195 R11 10 0 0 0.00195 R12 10 0 0 0.00195 R13 0 10 0 0.00195 R14 0 10 0 0.00195
Table 8: Sign test result for the Second Cohort’s Manchester route finding task The results from this second cohort show that the rankings for six of the seven Glasgow routes support hypothesis 1. In other words, the ten taxi drivers changed their initial route preferences once they had been provided with information about previous accidents on those routes. In the case of the Manchester routes, that were not previously familiar to the taxi drivers, all of the route preferences changed as a result of the accident information. Of course, neither of these findings implies any consequent change in behaviour. There is no guarantee that the taxi drivers will use the accident information during their work, just as there is no guarantee that a driver will follow the fastest or cheapest route recommended by conventional planning

12
software. Route planning depends on the knowledge and skill of the navigator. Our studies have, however, shown that the provision of localised accident information can have an impact on these complex, problem solving tasks. It is important to acknowledge, however, that our results do not provide anything like a complete theoretical understanding of the cognitive processes that are involved in the exploitation of local, historical accident information. For instance, some drivers may rate safety information more highly than their peers. Only driver S2 from the first cohort of the Glasgow users did not change any of his rankings after being presented with the accident information summarised in Table 9. As mentioned, however, this may have been due to the way in which the task was presented. However, further studies are required to determine whether the revised procedure with the second cohort would entirely eliminate this observed behaviour or whether S2 is typical of a persistent group of road users who would not be influenced by the previous number of accidents over the routes that they use every day. Identifier Nodes Total estimate time
(seconds) Cumulative number of accidents
R1 ABEKNO 204 42 R2 ABEKLNO 198 52 R3 ACEKLNO 234 34 R4 ACEKNO 240 24 R5 ACFMO 144 25 R6 ADFMO 186 28 R7 ADJMO 204 12
Table 9: Summary of Routes in the Glasgow Map Table 9 summarises the routes from the Glasgow map that was used in both cohorts of this study. As mentioned, there were 20 taxi drivers in both cohorts. If accident related information had been the main determinant in route planning then we might have expected that most would have chosen the order R7, R4, R5, R6, R3, R1 and R2. However, none of the drivers in the first or second cohorts chose this ordering. Instead, five chose a single permutation of R5 and R4. In other words, they chose: R7, R5, R4, R6, R3, R1 and R2. This apparent inconsistency can be explained in terms of the similarity between R4, with 24 accidents, and R5 with 25. It seems likely that they were trading the single additional accident against a larger time saving with R5’s estimated 144 seconds being preferred to R4’s 240 seconds. At one level it can be argued that the taxi drivers were employing a relatively simple form of satisficing. In other words, they were willing to trade a certain degree of speed against a higher number of accidents and vice versa. For example, R6 (28) has had more accidents than R4 (24). However, R6 has an estimate journey time of only 186 seconds compared to 240 seconds for R4. In the second cohort, four drivers ranked R6 above R4. Six taxi drivers rated R4 above R6. It might, therefore, be argued that such differences illustrate a degree of risk preference and aversion when faced with similar routes. However, there is also evidence of more complex forms of constraint satisfaction that go beyond simple trade-offs between time and safety. R1 was the least preferred route on the Glasgow map even though it was not the route with the highest average journey time. 19 out of the 20 drivers put it in last place in their ranking. This would seem to indicate that the drivers relied upon outside knowledge that was not fully being captured in the simple timings that we presented. However, when additional information was provided about the number

13
of local accidents most drivers revised their choice. Recall that R2 had 52 accidents compared to 42 for R1 and that the difference in estimated journey time was only six seconds. In consequence, thirteen of the twenty drivers revised their ranking to put R2 in last place. Identifier Nodes Total estimate time
(seconds) Cumulative number of accidents
R8 ABCDEO 660 20 R9 ABJDEO 540 24
R10 AHJDEO 540 34 R11 AHIFEO 720 23 R12 AHIFGO 720 21 R13 AHJFEO 600 34 R14 AHJFGO 600 32
Table 10: Summary of Routes in the Manchester Map
Table 10 provides a summary of the cumulative accident frequencies and estimated journey times for the Manchester routes, which were not familiar to either cohort of taxi drivers. The pattern of results for both individual subjects and for particular routes is broadly similar to that for the Glasgow journeys. There are, however, some important differences. Unlike the local route-planning task, there is no individual who retained his or her original preference list after being shown the accident information. This tends to confirm our suggestion that the individual from the first cohort of the Glasgow study may have shown an inelastic preferences for routes with which they were very familiar. However, that same individual appears more willing to revise their preferences for routes that they do not drive every day. This is an important finding because it implies that there will be some value added from the provision of accident information given that individuals are less likely to use route-planning software for routes that they already know very well. However, as mentioned in previous paragraphs, further work is required to support this additional hypothesis. If taxi drivers’ preferences were being determined by the number of accidents alone then one might have expected most participants to opt for the sequence R8, R12, R11, R9, R14, R10, R13. As with the Glasgow study, things were not this straightforward. Only four of the taxi drivers chose this ranking after being presented with the accident information. The remaining drivers seemed to exhibit the same satisficing behaviour that was observed in the previous paragraphs. Trade-offs are being made between journey time and accidents. It can, however, be argued that the interpretation of these results is simpler because the drivers did not have any previous experience of navigating in Manchester city centre. Conclusions From the experiment, we have gathered support for our two hypotheses. Firstly, the provision of local accident information does have an impact on the routes that drivers select in areas that they are already familiar with. Secondly, this effect can also be seen when drivers have access to information about towns that they are less familiar with. Our results were obtained from studies with two cohorts of taxi drivers because these users typically have the greatest exposure to risk, illustrated by correspondingly high insurance

14
premiums. Much work remains to be done. It is important to stress that this paper has focussed on the underlying research that is necessary to demonstrate that accident information will have an impact of route selection. A parallel strand of research has focussed more directly on application development. As mentioned, we have already developed a web-based system for presenting localised accident information. As we developed this tool to provide route-planning functionality, a number of additional problems have arisen. Many of these were not directly considered within our study. In particular, the journeys in our system are over relatively short distances within two city centres. Hence, we have a relatively low number of accidents for each route within our data set and it is possible to provide the drivers with raw accident frequencies over a five or ten year window. As we expand the length of a route then these frequencies become increasingly problematic, as there may be several thousand accidents on a journey of an hour or more over busy local roads. Previous sections have also argued that raw cumulative accident frequencies ignore the different traffic volumes that pass over each route. It is relatively straightforward to factor traffic flows into the calculation of accident rates rather than frequencies. However, it can be difficult to explain the resulting cumulative rates to a broad group of end users. For example, comparable risk exposures can be derived from a prolonged period of driving on a road with a medium accident rate or from a short period driving on a road with a high accident rate followed by a longer period driving on a ‘low risk’ road. If we are to move from raw accident frequencies to consider issues of risk exposure then there seems to be considerable scope for the development of appropriate interfaces that might mask some of the underlying complexity from end-users, such as our taxi drivers, who have a significant interest in using this data. We are currently experimenting with extensions to existing route planning systems. These already offer users planning criteria such as ‘avoid motorways’ or ‘avoid toll roads and congestion charging’. Our prototype system offers additional check boxes, such as ‘avoid high accidents area’. Further work is required to determine whether this supports the more complex trade-offs between time and risk that seem to be emerging from our study of route planning behaviour by the two cohorts of taxi drivers. In particular, there may be other forms of mixed opportunity or collaborative interaction between in-car systems and their drivers that would provide more appropriate support for ad hoc navigation tasks [McCall, Achler, Trivedi, Haué, Fastrez, Forster, Hollan and Boer, 2004].
A natural extension of many of the ideas in this paper would be to integrate local accident information into an in-car GPS navigation system. This would be relatively straightforward with accident frequency updates being supplied with each map upgrade. The existing web-based accident information system draws its updates directly from the national accident records supplied indirectly to the public by regional police forces. Local accident information might be used by in-car systems in the manner described above for more conventional route planning software. The provision of GPS also enables the use of visual or audio warnings to inform drivers when they enter an accident ‘hotspot’. It is important not to underestimate the importance of such potential applications. We have already conducted preliminary discussions with insurance companies. They have plans to extend Electronic Road Pricing and offer drivers an insurance premium that is directly based on their risk exposure rather than an annual aggregated insurance premium [Hashimoto, Hayakawa and Miyazaki, 1998]. Under this proposal, satellite-tracking systems would monitor the time that each motorist spends at particular locations throughout the road network. The longer the time

15
that a motorist spends driving on higher-risk roads then the higher their premium will be. In order to benefit from such a scheme, more careful drivers must be able to use local accident information when they begin to plan their routes. References K. Chung, C.L. Davis, C.Fee, R. Grammer, D. Brown, J.Dalton and R.Wilson, Facilitating Public Safety Analysis Through Enhanced Information Sharing. In M.H. Jones, S.D. Patek and B.E. Tawney (eds), Systems and Information Engineering Design Symposium, IEEE Press, 2004. UK Department of Transport, Think! Website. http://www.thinkroadsafety.gov.uk/index.htm, July 2005. H. Hashimoto, K. Hayakawa and Y. Miyazaki, Multi-lane Electronic Road Pricing System in Singapore, International Conference on Transportation into the Next Millennium, 9 - 11 September 1998, Singapore. J. McCall, O. Achler, M. Trivedi, J.-B. Haué, P. Fastrez, D. Forster, J. Hollan and E. Boer, A Collaborative Approach for Human-Centered Driver Assistance Systems, ITSC2004, Washington, USA. Y.I. Noy, Ergonomics and Safety of Intelligent Driver Interfaces, Lawrence Erlbaum Associates, New Jersey, USA, 1997. Scottish Road Safety Campaign. http://www.srsc.org.uk/, July 2005. T. Rundmo, H. Iversen, Risk perception and Driving Behavior among Adolescents in two Norwegian Counties before and after a Traffic Safety Campaign, Safety Science, (42)1:1-21, January 2004. P. Ulleberg and T. Rundmo, Personality, attitudes and risk perception as predictors of risky driving behaviour among young drivers, Safety Science, (41)5:427-443. June 2003. M.R. Schmidt, Questionnaire on Risk Perception regarding Environment, Agriculture and Health, Institute of Risk Research, University of Vienna, Austria, 2004. Y. Zheng and C.W. Johnson, Swimming Pools on the Moon: Using Psychometric Techniques to Assess the Impact of National and Localized Road Safety Information, Reliability Engineering and System Safety, Accepted and to appear, 2005.