loans in the formal credit accessibility to credit from
TRANSCRIPT

Repayment of Short TermLoans in the Formal CreditMarket: The Role ofAccessibility to Credit fromInformal Sources
Manojit BhattacharjeeMeenakshi Rajeev

ISBN 978-81-7791-129-9
© 2011, Copyright ReservedThe Institute for Social and Economic Change,Bangalore
Institute for Social and Economic Change (ISEC) is engaged in interdisciplinary researchin analytical and applied areas of the social sciences, encompassing diverse aspects ofdevelopment. ISEC works with central, state and local governments as well as internationalagencies by undertaking systematic studies of resource potential, identifying factorsinfluencing growth and examining measures for reducing poverty. The thrust areas ofresearch include state and local economic policies, issues relating to sociological anddemographic transition, environmental issues and fiscal, administrative and politicaldecentralization and governance. It pursues fruitful contacts with other institutions andscholars devoted to social science research through collaborative research programmes,seminars, etc.
The Working Paper Series provides an opportunity for ISEC faculty, visiting fellows andPhD scholars to discuss their ideas and research work before publication and to getfeedback from their peer group. Papers selected for publication in the series presentempirical analyses and generally deal with wider issues of public policy at a sectoral,regional or national level. These working papers undergo review but typically do notpresent final research results, and constitute works in progress.

REPAYMENT OF SHORT TERM LOANS IN THE FORMAL CREDIT MARKET:
THE ROLE OF ACCESSIBILITY TO CREDIT FROM INFORMAL SOURCES
Manojit Bhattacharjee and Meenakshi Rajeev*
Abstract
This paper is an attempt to link the problem of non-repayment in the formal credit market with
the accessibility to credit from informal sources. In many developing countries a well established
network of informal lenders continues to prevail in spite of various formal lending programmes
implemented by the government. Scholars often dealt with how the poorer households become
the victim of usurious rates of interest charged by informal lenders and lose their valuable
properties. We however show that more unfavourable the terms of loan from a moneylender
compared to that of a formal lending agency, better is the chance of a borrower making timely
repayment and get the benefit of formal loan on a recurring basis, which is not available in case
of default. After establishing the conditions theoretically, the paper using National Sample
Survey Organisation (NSSO, India) database, empirically tries to examine such an impact in the
case of short term formal loans. The empirical analysis reveals the positive and significant impact
of informal interest rates on repayment of formal loans.
Key Words: Repayment, Formal Lending Agency, Informal Lending Agency
JEL Classification O1, G0, G2
Introduction
One of the main constraints faced by households of developing countries is inadequate access to
financial resources. Majority of households being either self-employed in agriculture or small business
need credit to sustain their livelihood. The formal banking sector extends financial support to the poor
but most of these credit institutions are also faced with serious problems of monitoring and non-
repayment. Default in repayment in any credit market is the result of a genuine inability to repay due to
crop failures or other such setbacks or a wilful move by the borrower if penalty is not severe. In the
formal market, owing to interventions from the local political bodies, penalty in the form of transfer of
property rights is almost absent (see Besley, 1994). Penalty in the form of discontinuation of future
credit services exist but a well established network in the informal sector provides an alternative source
of credit in the event of default.
The informal lenders, due to their proximity to the borrower and power in the local market,
accept collateral from a borrower (such as future labour service) that is not accepted in the formal
credit market (Bhaduri, 1977, 2006; Basu, 1997). One can also observe higher repayment rates in the
informal sector even with unfavourable terms and conditions (see Basu, 1997). The question then
naturally arises, can the availability of loans from informal sources, such as village moneylenders or
* PhD Scholar and Faculty, Institute for Social and Economic Change, Bangalore, India. Email:

2
traders, influence a borrower to wilfully default in the repayment of formal credit? This is an important
question to explore both empirically and theoretically because the terms of informal lending are
unfavourable when compared with the formal sector. Amongst the usually discussed vices of the
informal credit market, this aspect has never been highlighted by the authors.
As far as previous studies are concerned, the problem of non-performing assets or non-
repayment of loans in the formal credit market has received attention across the globe (Rajaraman et
al, 1999; Rajaraman and Vasishtha, 2002, Hoff and Stiglitz, 1990; Besley, 1994). Studies focusing on
the link between the formal and informal credit markets have largely tried to explore the impact of
cheap credit from formal agencies on the terms and conditions of a loan in the informal credit market
(Hoff and Stiglitz, 1997; Bose, 1998). The existence of an opposite link between informal to formal
credit has not received due attention. On the repayment front studies have mainly investigated the
impact of group lending programmes on repayment of loans (Besley and Coate, 1995; Sharma and
Zeller, 1997; Bhat and Tang, 2002).
Our analysis brings out certain interesting results. With regard to the impact of informal
lending, scholars have always been critical of the usurious rates of intere st levied by the moneylenders.
We, however, show that more unfavourable the terms of loan from a moneylender, better is the chance
of a borrower making timely repayment and getting the benefits of formal loan on a recurring basis.
Thus lowering the interest rate in the formal sector (which makes informal sector interest rate
comparatively more unfavourable) influences a borrower to repay a loan. Apart from looking into the
impact of accessibility to credit from informal sources on the repayment of formal loans, this paper also
identifies and compares the factors that determine repayment of loans in the formal and informal credit
markets of India.
To test the hypothesis empirically, we have used 59th Round ‘All India Debt and Investment
Survey’ of the National Sample Survey Organisation (NSSO). The paper considers only short-term loans
(loans that are advanced for a period up to one year). Medium term (1-3 years) and long term loans
(more than 3 years) have not been considered because the repayment of medium and long term loans
is slow and therefore not captured adequately in the data provided by the NSSO. Moreover, medium
and long-term loans are not availed frequently in a household’s lifetime†. Since credit market features,
especially in the informal sector, differ across regions, three types of states (provinces) were considered
based on the level of development. The classification was based on the percentage of people living
below the poverty line and the per capita income of the states‡.
The rest of the paper unfolds through the following sections. The next section provides an
overview of nature of repayment of loans across different credit agencies. This is followed by the
†In this context one should note that the studies discussed in this section are mostly free of the type of loan.
However, our analysis will confine only to short term loans. Thus the results obtained from the current study are
contingent upon short-term loans, apart from the states selected for the analysis. ‡ More precisely, the following states were selected: Punjab and Haryana, considered as developed states; West
Bengal and Karnataka, considered as middle performing states and Chattisgarh, Madhya Pradesh and Bihar
considered as less developed states.
3
theoretical model. The fourth section provides an empirical analysis and is followed by the concluding
section.
Nature of Repayment of loans across different agencies
In this section we have mainly tried to understand the overall repayment pattern across different types
of lending agencies. We first have computed certain indicators of repayment. We start with the ratio of
incidence of repayment and incidence of borrowing. The incidence of repayment in a given year is
defined by the percentage of households that have partly or fully repaid loans, while incidence of
borrowing is defined as the percentage of households that have availed loans in the year. A higher
value of the ratio implies better repayment. However, one should note that the repayment figures may
sometime exceed hundred as incidence of repayment may consist of repayment of loans availed earlier
(the year considered while computing IOB) plus repayment of fresh loan. One should also note that a
low value of the ratio does not necessarily imply default since households may also be late in making
repayments.
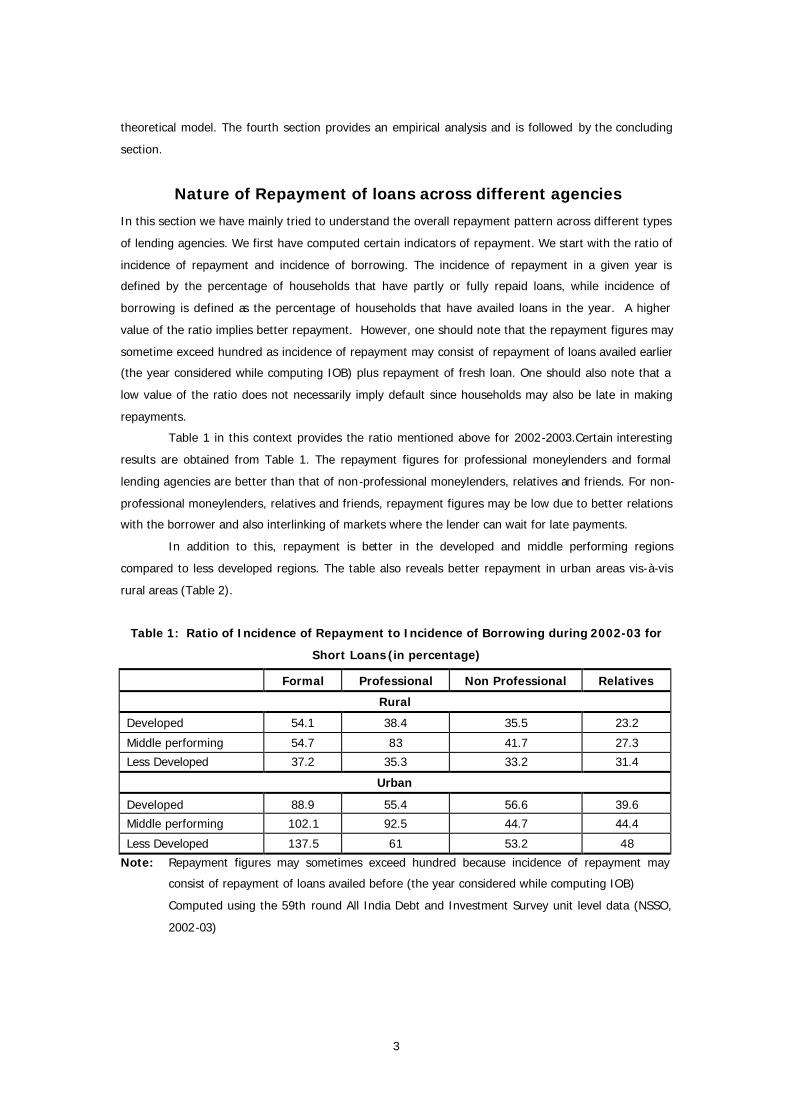
Table 1 in this context provides the ratio mentioned above for 2002-2003.Certain interesting
results are obtained from Table 1. The repayment figures for professional moneylenders and formal
lending agencies are better than that of non-professional moneylenders, relatives and friends. For non-
professional moneylenders, relatives and friends, repayment figures may be low due to better relations
with the borrower and also interlinking of markets where the lender can wait for late payments.
In addition to this, repayment is better in the developed and middle performing regions
compared to less developed regions. The table also reveals better repayment in urban areas vis-à-vis
rural areas (Table 2).
Table 1: Ratio of Incidence of Repayment to Incidence of Borrowing during 2002-03 for
Short Loans (in percentage)
Formal Professional Non Professional Relatives
Rural
Developed 54.1 38.4 35.5 23.2
Middle performing 54.7 83 41.7 27.3
Less Developed 37.2 35.3 33.2 31.4
Urban
Developed 88.9 55.4 56.6 39.6
Middle performing 102.1 92.5 44.7 44.4
Less Developed 137.5 61 53.2 48
Note: Repayment figures may sometimes exceed hundred because incidence of repayment may
consist of repayment of loans availed before (the year considered while computing IOB)
Computed using the 59th round All India Debt and Investment Survey unit level data (NSSO,
2002-03)
4
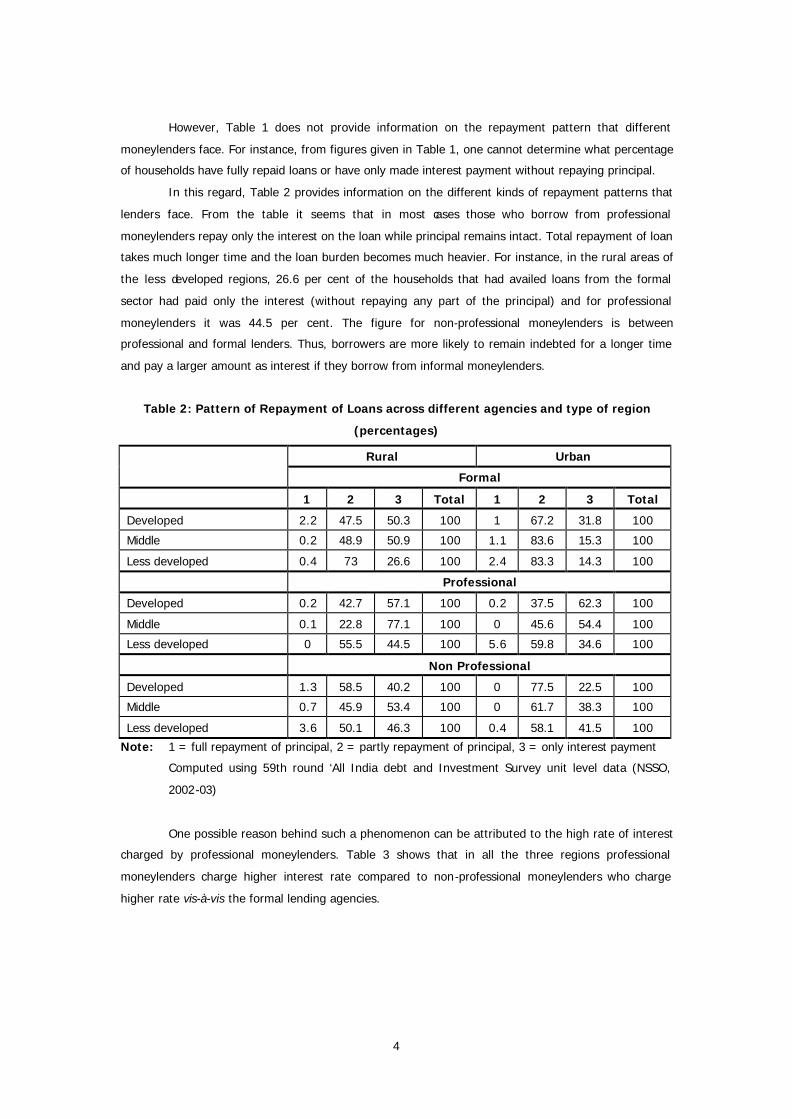
However, Table 1 does not provide information on the repayment pattern that different
moneylenders face. For instance, from figures given in Table 1, one cannot determine what percentage
of households have fully repaid loans or have only made interest payment without repaying principal.
In this regard, Table 2 provides information on the different kinds of repayment patterns that
lenders face. From the table it seems that in most cases those who borrow from professional
moneylenders repay only the interest on the loan while principal remains intact. Total repayment of loan
takes much longer time and the loan burden becomes much heavier. For instance, in the rural areas of
the less developed regions, 26.6 per cent of the households that had availed loans from the formal
sector had paid only the interest (without repaying any part of the principal) and for professional
moneylenders it was 44.5 per cent. The figure for non-professional moneylenders is between
professional and formal lenders. Thus, borrowers are more likely to remain indebted for a longer time
and pay a larger amount as interest if they borrow from informal moneylenders.
Table 2: Pattern of Repayment of Loans across different agencies and type of region
(percentages)
Rural Urban
Formal
1 2 3 Total 1 2 3 Total
Developed 2.2 47.5 50.3 100 1 67.2 31.8 100
Middle 0.2 48.9 50.9 100 1.1 83.6 15.3 100
Less developed 0.4 73 26.6 100 2.4 83.3 14.3 100
Professional
Developed 0.2 42.7 57.1 100 0.2 37.5 62.3 100
Middle 0.1 22.8 77.1 100 0 45.6 54.4 100
Less developed 0 55.5 44.5 100 5.6 59.8 34.6 100
Non Professional
Developed 1.3 58.5 40.2 100 0 77.5 22.5 100
Middle 0.7 45.9 53.4 100 0 61.7 38.3 100
Less developed 3.6 50.1 46.3 100 0.4 58.1 41.5 100
Note: 1 = full repayment of principal, 2 = partly repayment of principal, 3 = only interest payment
Computed using 59th round ‘All India debt and Investment Survey unit level data (NSSO,
2002-03)
One possible reason behind such a phenomenon can be attributed to the high rate of interest
charged by professional moneylenders. Table 3 shows that in all the three regions professional
moneylenders charge higher interest rate compared to non-professional moneylenders who charge
higher rate vis-à-vis the formal lending agencies.

5
Table 3: Annual Average rate of interest charged by lenders of different kinds
Lenders
Rural Urban
Developed Middle Less Developed
Developed Middle Less Developed
Professional 27.96 47.94 43.18 29.17 54.32 41.15
Non Professional 24.6 27.73 37.54 21.53 17.64 25.21
Formal 12.83 12.4 13.23 11.75 11.16 11.14
Computed using 59th round All India debt and Investment Survey unit level data (NSSO, 2002-03)
Thus, those who borrow from professional moneylenders tend to remain indebted for a longer
time. Consequently, an important question that arises is what factors determine non-repayment and
perpetual indebtedness? We next identify the factors that influence repayment of loans of different
agencies. We address the issue both theoretically and empirically. The theoretical model addresses the
repayment issue only for the formal sector, which faces information asymmetry. Informal credit is not
segregated as professional or non professional. It is assumed that in informal market perfect
information exists.
Theoretical Model
We first constructed a theoretical model to examine the problem of repayment in the formal sector,
which is then empirically tested. A particular case is considered where a representative household
requires loan to generate income§. Keeping the Indian scenario in mind, especially the agricultural
sector, the model assumed the presence of a well-developed informal credit market and the possible
announcement of a loan waiver by the government**. The main assumptions of the model are as
follows:
1. Assumptions
Suppose that the earning cycle of a household consists of two periods. In the first period, the household
puts effort (which is temporally constant) and other inputs financed by a fixed loan of size L, it produces
an output y in period 2. It is assumed that due to natural reasons, such as a good monsoon or drought,
the borrower realizes a high value output yhv L with probability p and a low value ylv L with probability
(1-p), where dyj/dL > 0 and d2yj/dL2 < 0, j = l,h. For tractability we assume this particular form of yj =
ylv L. The loan can be availed from the formal or informal sector and has to be repaid in the second
period. In addition to this, in both the periods, the household has a fixed income w, generated from
animal husbandry or other non-farm sources. Thus, the income of the borrower is composed of two
components, a certain component, w, which is same in all periods and a random component, y, which
provides utility to the household denoted by the utility function 'u'. For simplicity we assumed the utility
function to be additive in its arguments. The income of the household is assumed to be independently
§ The result would not vary a great deal if one incorporates consumption loans. ** In this regard, one should note that the Government of India had announced loan waiver schemes in 1991 and
2007 to give relief to farmers.

6
and identically distributed from one borrowing period to another. The borrower can repay loan to the
formal sector only if a higher output is realised. In other words, we assumed that rate of interest in
formal sector (denoted by i) satisfied the following condition: (yhvL vL+w -L)/L < i < (y lvL vL+w -L)/L
A borrower can be a genuine defaulter or can wilfully default if it is optimal to do so. In the
event of a default in the formal sector, the household enjoys the full value of the output, but the formal
lender stops future credit disbursement until a loan waiver is announced by the government. We
assume that the probability of a loan waiver is a in a particular earning cycle††. As regards informal
lenders, it is assumed that they do not face the problem of information asymmetry regarding the
borrower and wilful default is zero. In case of genuine default, informal lenders take possession of the
collateral of the borrower and subsequently future credit is provided in the informal sector. The interest
rate of informal lenders is denoted by r. In the model, the rate of discount from one period to the other
is denoted by ß < 1.
a. The Model
From the assumptions, it is clear that the expected lifetime utility of a borrower will change depending
upon the borrowing and repayment decision. The borrower has three possible choices. First, the
borrower can avail a formal loan and opt to repay. In such case in all the subsequent periods, the
borrower can avail loans from the formal sector, unless there is insolvency due to production failure.
Using Bellman’s equation in dynamic programming, the expected lifetime utility for the borrower in
absence of wilful default (denoted by VFR) can be written as
? ? ? �? �? ?? ? ? �? �? �?? ?? ? ? ? ? ? ?? �? ?? ?? ? ??? ? �? �? ? ? �? ? � ? �?? ? ? ??? ?? ? ? ?? ? ? �? ? �? �? ? ? �? �? �?? ? �? ?�? ??
.……….. (1) ����������? ��?? �?? ? �? �? �? �?? �?? ? ? ? ? ? ?�– �? �?? �?? ? ???? �? �? �?? ? ? ?�?? �?? ? ? ?? ? ? �?����������������? �?? ? ? ?�? ???�?�?? ? �? ? ? �? ? ? ? �? ? �? �? ? ?�
The expected discounted lifetime utility function in Equation (1) shows that in the first period,
the household derives utility from its fixed income, w. In the second period, the household discounts its
utility by ß and if a higher output is realised (which occurs with probability p), it repays the loan and in
the subsequent earning cycle, the household gets formal loan and therefore an expected lifetime utility
of VFR continues to accrue. However, if a lower value of output is realised (which occurs with
probability 1-p), the household cannot repay the loan and in subsequent earning cycles, it has to
borrow from informal sources, until a loan waiver is announced by the government. Thus, in case of
lower output, the household gets lifetime utility of VFR with a probability a in subsequent periods and
with probability (1- a) it borrows from informal sources. In Equation 1, VI denotes the expected lifetime
welfare if the household borrows from informal sources.
†† In reality, ‘a’ may be time dependent. As our primary focus here is not ‘loan waiver’, for computational
convenience we keep a as constant

7
The second possible choice in front of the household is to borrow from formal sources and then wilfully
default. In such circumstances the household has to avail loan from informal sources in subsequent
periods, except under loan waiver. If there is a loan waiver, which occurs with probability a, the
household gets back the formal loan along with an expected lifetime utility of VFD. The expected
lifetime utility in the presence of wilful default, to be dented by VFD, can be written as
�? ? ? �? �? �?? ? ? �? ? ?? ?? ? ? ? ? ? ? ? �? ? ? ? ? �? �? �?? ? �? ?? ?? ? �? �?? ? ? ??? ?? ? ? ?? ? ? ? ��? ? ? ? ? �? �? �?? ? �? ?? ??
.……….. (2) ? ? ? ? ? ? ? ?? ?? ? ? ? �? ?? ?? ? ? ? ? ? ?? ? ? ?? ? ? ??? ?? ? ? ?? ? ?? ? ? ? ?? ? ? ?? ????? ? �? �? ? ?
Equation 2 shows that in the first period, akin to the no wilful default case, the household
derives utility from its fixed income, w. In the second period, the household does not repay and
therefore enjoys the full value of output (high or low output). In the subsequent periods, with
probability a, the household gets a lifetime utility of VFD and with probability (1- a) it borrows from
informal sources.
Apart from these two choices, a third choice for a household is to borrow from informal
sources in all periods. The household cannot default wilfully. In case of genuine default (due to
realisation of lower output), it has to transfer a collateral of value C to the moneylender. For simplicity
we have assumed C= L (1+r).Since the moneylender does not face any loss, the borrower can borrow
from informal sources in all the subsequent periods. The expected lifetime utility of borrowing from
informal sources, denoted by VI is
? ?�? �? ?? ? ? �? �? �?? ?? ? ? ? ? ? ?? ? ? ?? ?? ? ??? ? ? ? ?? ? ? ?? ? ? ??? ?? ? ? ?? ? ? ? ? ? ?? �?? ? ??? ? ? �? ??
.……….. (3) ? ?�? �?? ?? ? �? �? �? �?? ?? ? ? ? ? ? ?? �? �? �?? ? ? ?�?? ?? ? ? ?? ? ??�? � ? �? �?? �?? ? ? ???�?? ? ? ? ?�
2. Condition for Wilful Default in the Formal Sector
It is clear that a household would find it optimal to default in the formal sector if expected lifetime utility
by defaulting is greater than expected lifetime utility by repaying loan. Stated otherwise, a household
would wilfully default if
VFD > VFR
or, ?? ?? ? ? ? �? ?? ?? ? ? ? ? ? ?? ? ? ?? ? ? ??? ?? ? ? ?? ? ?? ? ? ? ?? ? �? ?? ???�?? ? �? �? ? �? > �?? ?? ? �? �? ? ?? ?? ? ? ? ? ? ?�– ? ?? �?? ? ???? ? .……….. (4) ? ?? ? ? ??? ?? ? ? ?? ? ? ? ? �?? ? �? ?�? ?????? ? �? ? ? �? �? ? �? �? ? �? �? ? ?

8
Inserting the value of VI, from 3, one obtains ? ? ? �? �?? �?? ? ??? �? �? ? ? �? �?? ?? ? ??? �? �? ? �?? �?? ? ??? �? ? �? ? �? �?? �?? ? ??? .……….. (5)
Equation 5 indicates that for every rate of interest in the informal sector there is an interest
rate in the formal sector that prevents the borrower from defaulting. This leads us to the following
proposition
Proposition1: If i and r are the interest rate in the formal and informal credit markets respectively,
an r* such that if r>r*, it is optimal for a borrower to repay in the formal market
The next important question that arises is how does the critical rate of interest r* in the informal sector
relate to i — more specifically how does it respond to a decrease in the interest rat e in the formal credit
market.
Observation 1:
The critical interest rate in the informal sector satisfies (see 5)
? ? �? �?? �?? ? ? ????? ? �?? ? �? ?? ? �? �?? �?? ? ????? ? ? ? ? ? .……….. (6)
Given the fixed scale of finance norms in the formal sector it is reasonable to assume that
dL/di = 0. Now differentiating both sides of (6) we get ? ? ? ?�?? �?? ? ? ? ??G? G? ? ? ?? ? ? �?? ? �?? ? �? ?? ? �? ?�?? �?? ? ????? ? ? ? ? ??
.……….. (7)
Or, ? ? ? ?? ? ? ? ?? ?�?? �?? ? ????? ? ? ? ? ????? ? ? ??? �?? ? ? ? ??G?? ? �?? ? �? ??? ? ?
Since by assumption u’(.) > 0 and (0 < α, β, p < 1), we get, ? ? ?? ? > 0 ∀ i and r* .……….. (8) Suppose now formal sector interest rate falls from i to i1. The corresponding values of r
satisfying (7) are say r and r1*. From 8, it is clear that r1*< r*. Thus as i falls to i1, all borrowers who
are facing (either potentially or actually) informal sector rate of interest r, r1*? r < r* would also find it
optimal to repay loan in the formal credit market. Thus there is an increase in the number of borrowers
in the formal credit market who do not default.
This observation is of critical importance given the policy of the Indian Government — for
prompt repayment the borrower gets a benefit of 2 per cent interest rate subvention. The situation can
be diagrammatically represented as follows.
9
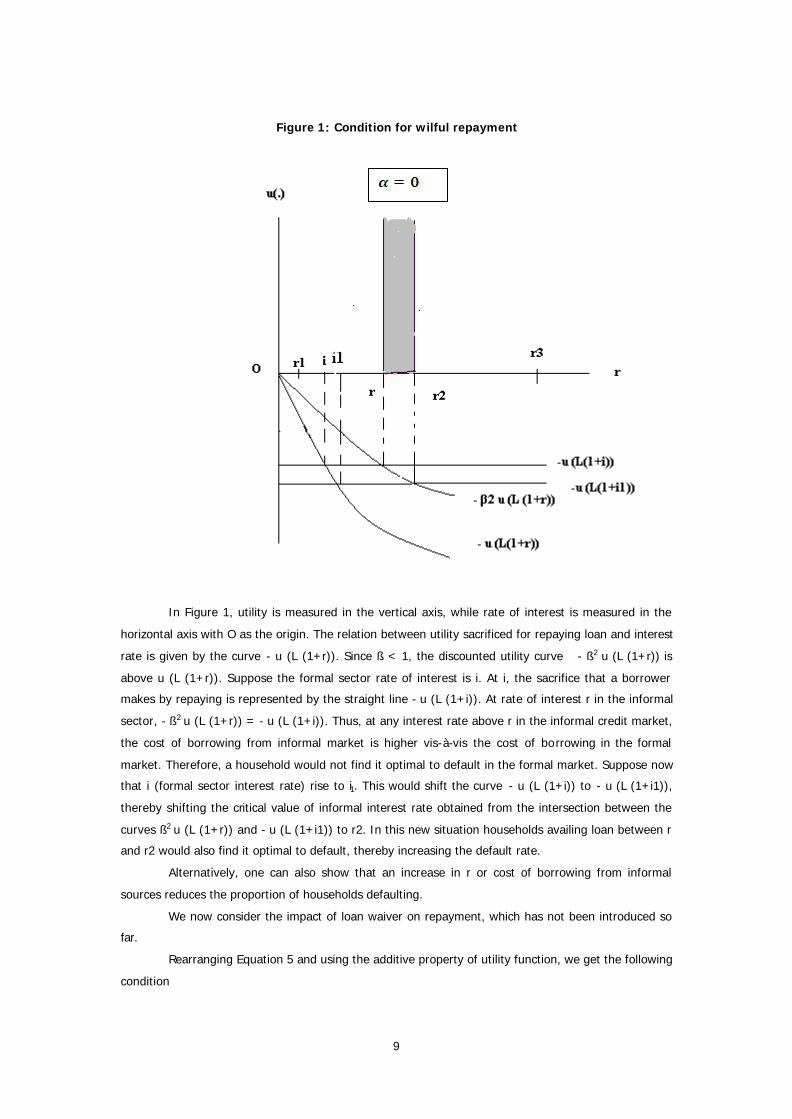
Figure 1: Condition for wilful repayment
In Figure 1, utility is measured in the vertical axis, while rate of interest is measured in the
horizontal axis with O as the origin. The relation between utility sacrificed for repaying loan and interest
rate is given by the curve - u (L (1+r)). Since ß < 1, the discounted utility curve - ß2 u (L (1+r)) is
above u (L (1+r)). Suppose the formal sector rate of interest is i. At i, the sacrifice that a borrower
makes by repaying is represented by the straight line - u (L (1+i)). At rate of interest r in the informal
sector, - ß2 u (L (1+r)) = - u (L (1+i)). Thus, at any interest rate above r in the informal credit market,
the cost of borrowing from informal market is higher vis-à-vis the cost of borrowing in the formal
market. Therefore, a household would not find it optimal to default in the formal market. Suppose now
that i (formal sector interest rate) rise to i1. This would shift the curve - u (L (1+i)) to - u (L (1+i1)),
thereby shifting the critical value of informal interest rate obtained from the intersection between the
curves ß2 u (L (1+r)) and - u (L (1+i1)) to r2. In this new situation households availing loan between r
and r2 would also find it optimal to default, thereby increasing the default rate.
Alternatively, one can also show that an increase in r or cost of borrowing from informal
sources reduces the proportion of households defaulting.
We now consider the impact of loan waiver on repayment, which has not been introduced so
far.
Rearranging Equation 5 and using the additive property of utility function, we get the following
condition

10
? �? ? �? �?? ? ? ?? ? ? ? ? �? ?? �?? ? ??? ? �? ? ?? ?? ? ??? .……….. (9)
The second component on the left hand side of Equation 9 (i.e. aß2u(L(r-i)), henceforth
denoted by P) measures the net impact of probability of loan getting waived on cost of borrowing from
informal sources while the right hand side is the cost of borrowing from formal sources. It is to be noted
that P is negatively related to cost of borrowing from informal sources. In other words an increase in P
reduces the cost of borrowing. This leads to the following two corollaries‡‡
Corollary 1: If r > i, presence of loan waiver has a negative impact on repayment of loans
Corollary 2: Higher the differences between the informal and formal sector rate of interest, higher is
the negative impact of loan waiver on repayment.
One can get this by differentiating Equation 9 with respect to a and (r-i). Since dP/da > 0 and
dP/d(r-i) > 0, it implies that an increase in a or (r-i), reduces cost of borrowing from informal sector
corresponding to each formal sector rate of interest. This in turn shifts the critical rate of interest of the
informal sector (required for repayment in formal market) upwards, thereby increasing the number of
borrowers willing to default. We next proceed to test these propositions empirically.
Empirical Analysis
We have established theoretically that usurious rates of interest in the informal market may force a
borrower to make prompt repayment in the formal sector and take advantage of the favourable terms
and conditions of the formal credit market. While this result is interesting it is also necessary to
empirically test it. To do so we used the data from the 59th round of the NSSO on debt and investment
in India, which provides substantial information regarding household debt and investment for about 1,
43,285 households in India, covering both rural and urban areas§§. Apart from testing the theoretical
proposition, the empirical part also identified and compared the factors that determine repayment of
loans in the formal and informal credit markets of India. Thus two separate regressions, one for formal
and the other for informal lending agency were carried out.
‡‡ The case of i > r, regardless of the value of a, it is always economically beneficial for the household to default. §§ This data was collected through a two stages of the stratified random sampling procedure, where rural villages and
urban units form the first stage units and households are the second stage units. The survey period of this data
was from January to December 2003. The data was collected from the same sample households during two visits.
The information collected in the second visit was considerably less compared to the first. The survey period of the
first visit was eight months and that of the second was four months. In this paper we concentrated only on the
select states, viz., Punjab, Haryana, Chattisgarh, Madhya Pradesh, Karnataka, West Bengal and Bihar. We have
information on 3,975 households in Punjab, 2,630 in Haryana, 2,637 in Chattisgarh, 6,586 in Madhya Pradesh,
6260 in Karnataka, 11,120 in West Bengal and 8185 in Bihar.
11
1. Variable Selected For the Analysis
The dependent variable which captures repayment is formed by dividing repayment (completed till date
of survey) of each loan by the corresponding loan amount***. The dependent variable is considered as a
ratio since it would reduce the heteroscedasticity problem, which is prevalent in the data.
The amount of loan is computed by adding the amount of loan repaid before the survey date and
amount due on the date of the survey. Fully repaid loans were assigned the value 1. As mentioned
above, only short -term loans availed during July 2002 to June 2003 were considered. Data before July
2002 was not considered because information was only available for loans outstanding on 30.06.2002.
Explanatory variables
A household may default, if one of the following possibilities occurs. First, if the maximum utility
achievable by defaulting is greater than the maximum utility attainable by repaying (Srinivasan, 1989).
This is generally viewed in literature (Stiglitz, 1987) as a problem of incentives†††. Secondly, default
may occur if a household does not have enough money at the time of repayment. This can be termed
as the insolvency factor. Apart from the insolvency and incentive factors, institutions‡‡‡ may play a
major role in repayment by influencing the above two factors (see Udry, 1990).
Generally, the need for loans in future, the presence of alternative sources of credit and loss of
collateral in the event of default influence the incentives to repay loans. On the contrary, the returns
from loan, cost of availing it, size of the loan along with income and assets of the household determine
insolvency. Institutional factors are expected to change with region and lending agencies.
In the regression analysis the impact of each factor is captured by appropriately choosing
variables.
Factors Influencing Incentives to Repay
Households that require loans on a regular basis are expected to have higher incentives to
repay loans (see Coate, 1993; Haugen, 2005; Rajeev et al., 2006; Shivappa, 2005; Hatai et al., 2005)
because a default generally stops future credit. Thus, one can expect self-employed households that
require loans on a regular basis for running business to have a better repayment record than wage
labourers or regular salaried households. The regression analysis captures this aspect by a dummy
variable.
The economic condition of the household may well influence repayment. For instance, a
household having higher income is expected to have lesser incentive to repay a loan because in the
*** Amount of loan is considered since it considers both amount borrowed and interest paid. Thus, households
perpetually indebted by paying only rate of interest would get captured in the analysis as having lower repayment
rates.
††† In this context, one should note that economic aspects might not necessarily influence the welfare function of
the borrower. Indeed, the welfare function of the borrower may also consist of non-economic social components
such as relationship with the lender.
‡‡‡ ‘Institutions are social rules, conventions, and other elements of the structural framework of social interaction’
(Bardhan, 1989).
12
event of default by one lender it can avail loan from some other sources by providing collateral. On the
contrary, poorer households with fewer sources of credit would have higher incentives to repay the loan
(see Dev and Rajeev, 2007). In our analysis, the monthly per capita consumption expenditure (MPCE)
of the household is considered as a proxy of the economic status of the household. Since there are
three kinds of regions (which differ in terms of features), we have considered three interactive variables
with MPCE and type of region instead of a single MPCE variable.
Apart from the economic status of the household, the interest rate in the informal sector may
affect the incentive to repay the loan in the formal sector. This is evident from the propositions obtained
in the previous section. However, the potential interest rate faced by each household in the informal
market is not available. Information on interest rate in the informal market is only available for
households that have availed informal loans. To address this issue we have formed an explanatory
variable at the district level. Using information on the rate of interest for households that have availed
informal loans we have calculated the percentage of households (belonging to the same MPCE group)§§§
in the district availing loan at rates higher than the highest rate of interest in the formal sector. If a
larger percentage of households in the district avails loan at a rate of interest higher than that of the
formal sector, one can expect repayment to increase.
The presence of security may also act as an incentive for repaying loans. In case of a default,
it may lead to loss of assets (see Barro, 1976; Bester, 1987).
Factors Influencing Insolvency of Loan
In addition to incentives, a household may default if it does not have enough money at the
time of repayment. Generally three factors determine insolvency — the size of the loan, the cost of
availing the loan and income or assets of the household. The following variables were conceived to
capture these factors. Firstly, we used the ratio of loan size and asset of a household as a variable. If
this ratio is very high, a household may face difficulty in repaying the loan. Secondly, to capture the
income status, we used two variables, namely, MPCE of the household and utilisation of loan.
Households with higher MPCE are expected to have a higher income. A second variable that can
influence insolvency is utilisation of loan. If the loan is utilised for income generating purposes, where
returns are relatively certain, a household would find it easier to repay the loan. Thus, one may find
repayment of loan to be more for working capital needs than for consumption or capital expenditure
purpose.
The cost of availing a loan mainly depends on the rate of interest. If the rate of interest is very
high, a borrower may find it difficult to repay the loan, leading to default and loss of collateral (see
Bhaduri, 1977)****.
§§§ The MPCE group is formed based on the division followed by Bhattacharjee and Rajeev (2009) using the same
data set.
**** In the formal credit market, interest rate tends to differ across schemes across lending agencies (such as
between cooperatives and commercial banks).

13
Institutional factors
In the analysis to follow, to capture the institutional differences existing between locations
(such as rural and urban), a location-specific dummy variable was incorporated. We also introduced a
variable to capture the level of economic development of a district. Generally, economic development
depends on per capita income and level of infrastructure development. Since information on per capita
income for each district was absent, we considered the average MPCE of households in a district to
capture development.
In addition to the above variables, a variable representing time of repayment was included to
control the differences in repayment owing to differences in time when availing the loan. This variable
was constructed in the following way. For loans that remained unpaid on the date of the survey, the
variable was computed by taking the difference between the time of the survey and the time when the
loan was borrowed. For fully repaid loans, the time variable was formed by taking the difference
between dates when the loan was repaid fully and when it was availed. In this context, one should note
that NSSO collects data through two visits and provides information on the repayment status of loans
on a quarterly basis.
Table 4 explains the variables used in the regression, while, Table 5 provides the mean value
and standard deviation of the variables.
Table 4: List of variables with notation used
Explanatory Variables Notations
Time (measured on a quarterly basis) Time
Developed region dummy (Developed Region =1, others = 0 ) Developed
Less developed region dummy (Less Developed Region =1, others = 0) Less Developed
Middle Performing Region dummy (Middle= 1, others = 0) Middle
Loans availed for working capital (Working capital =1, others =0) Working Capital
Rate of interest Interest Rate
Presence of security (security = 1, others = 0) Security
Professional money lender (Professional =1, others =0) Non Professional
Self-employed household (Self Employed =1, others =0 ) Self Employed
Monthly per capita consumption expenditure MPCE
Rural area Rural
Loan by asset ratio of household Loan by Asset
Average MPCE of a district Average MPCE
Education of the Household (Below Secondary level =1, others =0) Education Percentage of households availed loan in a district above formal sector rate of interest Percent above formal
Interactive dummies
Developed region * MPCE Dev MPCE
Less developed region * MPCE Less Dev MPCE
Middle Performing * MPCE Middle MPCE
Computed by Authors
14
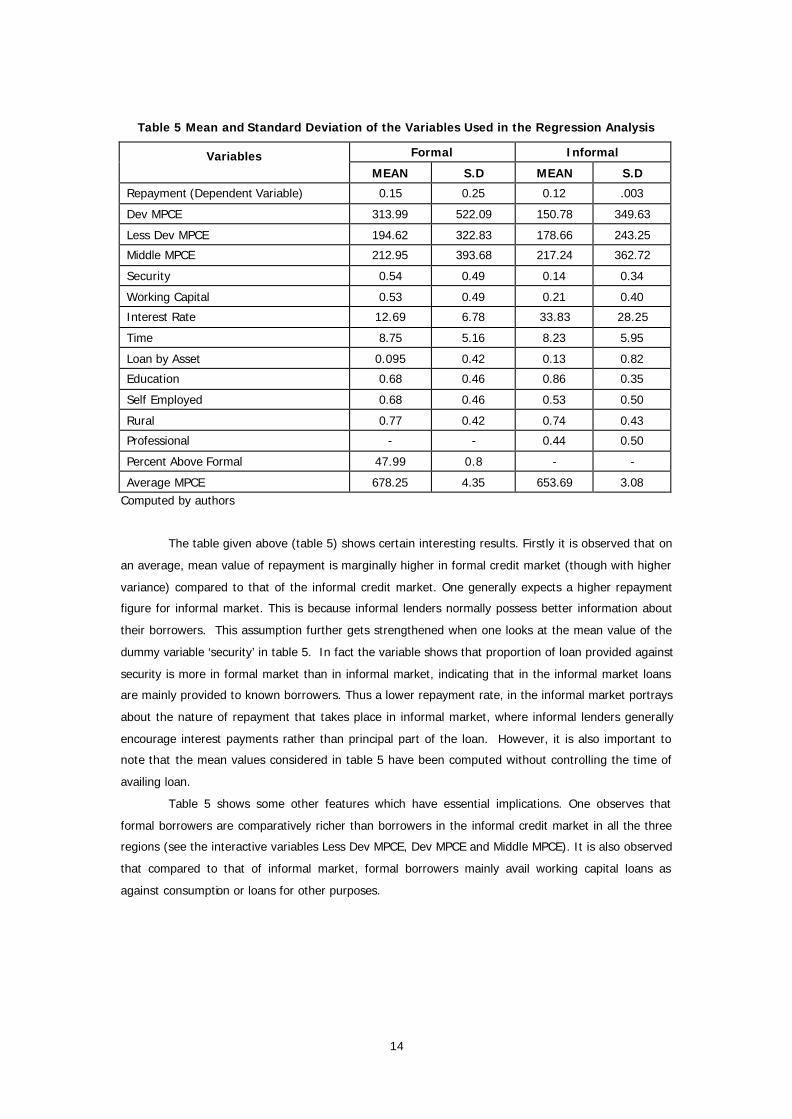
Table 5 Mean and Standard Deviation of the Variables Used in the Regression Analysis
Variables Formal Informal
MEAN S.D MEAN S.D
Repayment (Dependent Variable) 0.15 0.25 0.12 .003
Dev MPCE 313.99 522.09 150.78 349.63
Less Dev MPCE 194.62 322.83 178.66 243.25
Middle MPCE 212.95 393.68 217.24 362.72
Security 0.54 0.49 0.14 0.34
Working Capital 0.53 0.49 0.21 0.40
Interest Rate 12.69 6.78 33.83 28.25
Time 8.75 5.16 8.23 5.95
Loan by Asset 0.095 0.42 0.13 0.82
Education 0.68 0.46 0.86 0.35
Self Employed 0.68 0.46 0.53 0.50
Rural 0.77 0.42 0.74 0.43
Professional - - 0.44 0.50
Percent Above Formal 47.99 0.8 - -
Average MPCE 678.25 4.35 653.69 3.08 Computed by authors
The table given above (table 5) shows certain interesting results. Firstly it is observed that on
an average, mean value of repayment is marginally higher in formal credit market (though with higher
variance) compared to that of the informal credit market. One generally expects a higher repayment
figure for informal market. This is because informal lenders normally possess better information about
their borrowers. This assumption further gets strengthened when one looks at the mean value of the
dummy variable ‘security’ in table 5. In fact the variable shows that proportion of loan provided against
security is more in formal market than in informal market, indicating that in the informal market loans
are mainly provided to known borrowers. Thus a lower repayment rate, in the informal market portrays
about the nature of repayment that takes place in informal market, where informal lenders generally
encourage interest payments rather than principal part of the loan. However, it is also important to
note that the mean values considered in table 5 have been computed without controlling the time of
availing loan.
Table 5 shows some other features which have essential implications. One observes that
formal borrowers are comparatively richer than borrowers in the informal credit market in all the three
regions (see the interactive variables Less Dev MPCE, Dev MPCE and Middle MPCE). It is also observed
that compared to that of informal market, formal borrowers mainly avail working capital loans as
against consumption or loans for other purposes.

15
2. Econometric Specification
The dependent variable is a ratio, assuming two censored points, namely 0 and 1††††. In a censored
data, running ordinary least square (OLS) models leads to biased estimates. Therefore, we considered a
two-limit Tobit model that uses a maximum likelihood procedure to correct bias.
The Tobit model assumes that the actual dependent variable (Yi*) possesses a linear relation with the
explanatory variables.
Yi* = ßxi +ui …… (1)
However, it is latent for a large number of observations. For instance, in the present context,
the latent variable is observable when Yi* lies between zero and 1. Zero value is observed when (Yi* ?
0) or ßxi +ui ? 0. The value of 1 is observed when, (Yi* = 1) or ßxi +ui = 1.
Thus we have three sets of observations: Yi*? 0, 1 > Yi* > 0 and Yi*=1. The probability of Yi*
assuming a zero value can be written as F (-ßxi/s). On the other hand, the probability of Yi* assuming
the value 1, can be written as F (1-ßxi/s). For observations lying between zero and one, we can write
down the normal density function.
The maximum likelihood maximises the joint probability density functions of all the
observations. Since we have three sets of observations the likelihood function is given as follows:
Maximising the likelihood function with respect to ß and s yields the estimates.
Results
Tables 6 and 7 provide the regression results for the formal and informal sectors respectively. Two
separate regressions were carried out for formal and informal lending agencies on the assumption that
they face a different nature of repayment.
†††† In the present analysis, the observations are naturally censored at the point zero because the zero value may
not be actually zero. It may be possible that the repayment process has not started, for some households.
However, there is no natural censoring at point 1. For methodological purpose, we have assumed it (see also Clark
and Stanley, 1999; 2003).

16
Table 6: Regression Results (Tobit) for the Formal Lending Sector
Number of observations = 1717, F (13, 1704) = 22.50, P> F = 0.0000 Pseudo R2 = 0.0883
Explanatory Variables Coefficient t values
Dev MPCE 0.00009** 1.91
Less MPCE 0.00011 1.43
Mid MPCE 0.00009* 1.61
Percent above formal 0.00081* 1.76
Security 0.01856 0.57
Working Capital -0.12619*** -3.47
Interest Rate -0.00578** -1.94
Average MPCE 0.00041*** 3.58
Time 0.02097*** 7.28
Loan asset 0.05067** 1.86
Education dummy -0.07590** -2.15
Self-employed 0.00043 0.01
Rural -0.23305*** -5.18
Constant -0.37294*** -3.22
Sigma 0.53996**
Notes: *, ** and *** implies significance at the 10 %, 5 % and 1 % levels, respectively
Table 7: Regression Results (Tobit) for the Informal Lending Sector
Number of observations = 2978, F (13, 1704) = 23.36, P> F = 0.0000, Pseudo R2 = 0.
Explanatory Variables Coefficient t values
Less MPCE -0.0002*** -2.76
Dev MPCE -0.0002*** -2.89
Mid MPCE 0.0001* 1.68
Average MPCE 0.0003*** 3.84
Education dummy -0.0253 -0.7
Loan asset 0.0203 1.37
Time 0.0191*** 7.41
Security -0.0496 -1.36
Working Capital 0.0499* 1.57
Interest Rate 0.0024*** 5.42
Professional 0.0330 1.26
Self-employed 0.0529*** 1.94
Rural -0.1910** -6.24
Constant -0.5771*** -6.34
Sigma 0.5545
Notes: *, ** and *** implies significance at the 10 %, 5 % and 1 % levels, respectively

17
Let us first consider the variable (see the variable ‘percentage above formal’ in Table 6) that
helped us in testing the propositions obtained from the theoretical model. It is observed that districts
where a larger percentage of households availed loans at interest rates higher than the formal sector
rate of interest have higher repayment. Thus the empirical analysis also provides support for the
theoretical result obtained in Section 3. In other words, higher interest rate in the informal sector leads
to higher repayment in the formal sector.
Some common features were observed between formal and informal lending agencies. It
observed that both formal and informal lenders face a lower repayment in rural areas compared to
urban areas. It is further observed that repayment rate is higher in comparatively developed regions
(see variable Average MPCE in Tables 6 and 7) and improves with time.
The following differences were observed between the formal and informal credit markets.
While in the formal credit market, monthly per capita consumption expenditure (representing economic
status) positively influenced repayment of loans, in the informal credit market, for developed and less
developed states, MPCE possessed a negative relation with the dependent variable. Poorer borrowers
are expected to face higher insolvency and therefore expected to have lower repayment. However, an
opposite sign in informal market of developed and less developed states suggested that incentives to
repay loan outweighed the insolvency problem. This may happen if poorer borrowers in the informal
market possessed limited accessibility to credit, such that default would stop future credit. However,
this effect might not hold true for formal borrowers in general and informal borrowers of middle
performing regions, in particular, because of the following reasons. First, it was empirically observed
that borrowers in the formal market were economically better off than the borrowers in the informal
market. For instance, the data set used in our regression analysis revealed that the average MPCE of
formal and informal borrowers was Rs 722 and Rs 540 respectively (See also Table 5). Secondly, in the
middle performing regions poorer households possessed better accessibility to credit. For example, the
lender borrower ratio is higher in middle performing regions compared to that of developed and less
developed regions (See Table 8).
Table 8 Percentage of lender household, borrower household and their ratio
during 2002-03
Regions Lender Households (%)
Borrower Households (%)
Ratio (Lender/borrower) (%)
Developed 2.4 21.4 11.2
Middle 2.54 18.47 13.8
Less Developed 1.51 14.77 10.2
Computed by authors using 59th Round (AIDIS), NSSO
Apart from this, our analysis shows that education is having a positive relationship with
repayment of formal loans (Table 6). The coefficient of the variable is insignificant for repayment in the
informal sector (Table 7). It appears that educated borrowers avoid availing loan from informal lending
agencies. To avail formal loans on a continuous basis in future they make timely repayment of formal
loans. Table 9 below shows the education level of borrowers availing formal and informal loans. The

18
table shows that households that had members with higher level of education generally availed fewer
loans from informal lenders.
Another difference between formal and informal lending institution is regarding loans availed
for working capital needs. In general, working capital loans are expected to have better repayments.
However, in the regression analysis carried out for formal lending agencies, repayment is observed to
be less for loans availed for working capital needs. It seemed that due to loan waiver schemes of
government and the expectations of future waiver households defaulted in the formal sector.
It also observed that in formal agencies repayment is higher if interest rate is lower. On the
other hand, for informal lenders, repayment increased with increase in interest rate. The unanticipated
result for informal lenders primarily occurs due to undervaluation of collateral, which transfers the risk
from the lender to the borrower. According to previous studies (see Bhaduri, 1977, 2006) higher
interest in the informal market positively correlated with extent of undervaluation of collateral. This is
because in the event of default a lender earns more income by taking possession of the collateral. This
undervaluation at the same time leads to greater loss for the borrower and it provides the incentive for
the borrower to repay the loan.
Table 9: Distribution of loans in formal and informal credit markets classified by highest
education within the household
Highest Education of the Household Formal Informal
Not Literate 4.5 14.8 Literate without formal schooling 0.8 0.9
Below Primary 6.0 13.3
Middle 17.1 23.1
Secondary 19.2 20.2
Higher secondary 20.1 13.6
Diploma/certificate course 16.4 7.7
Graduate 2.3 0.5
Post-graduate 10.0 4.5
Above Post Graduate 3.7 1.3
Total 100 100
Computed using unit level data of the 59th round of the All India Debt and Investment Survey (NSSO,
2002-03)
Note: In the table only short loans of July 2002-2003 was considered
Conclusions
In this paper we establish theoretically and empirically that more unfavourable the terms of credit from
a moneylender compared to a formal lending agency, better are the chances of a borrower making
timely repayment. Thus lowering the interest rate in the formal sector (which makes informal sector
interest rate comparatively more unfavourable) influences a borrower to repay loans. This observation is
of critical importance given the policy of the Indian government, that prompt repayment is rewarded
with the benefit of 2 per cent interest rate subvention from government.

19
Apart from testing the proposition obtained from the theoretical model, the empirical part of
this paper portrays some of the differences in repayment of loans across formal and informal credit
markets. It is observed that while in the formal sector, higher interest rate reduces repayment; in the
informal sector it improves repayment. To provide an explanation for this we have considered the
justification given by previous studies. Existing theoretical studies (see Bhaduri, 2006) explain such
results for informal lenders in terms of the undervaluation of collateral in the informal market, which
transfers the risk from lender to the borrower. According to previous studies (see Bhaduri, 1977, 2006)
higher interest in informal market is positively correlated with extent of undervaluation of collateral. This
is because in the event of default a lender earns bigger income by taking possession of the collateral.
Since this undervaluation at the same time leads to greater loss for the borrower, it provides incentive
to the borrower to repay. Another difference between formal and informal lending institutions is
regarding repayment of loans availed for working capital needs. In general working capital loans are
expected to have better repayments. But in the regression analysis carried out for formal lending
agencies, repayment was less for loans availed for working capital needs possibly due to the moral
hazard problem arising out of the loan waiver schemes of the government that mainly exempts working
capital loans. The paper also shows the positive relation between education and repayment of formal
loans.
From the results of our analysis, it is has been inferred that the education level of the
borrowers and regulation of interest rate are the two most important variables that lead to better
repayment in the formal credit market.
References
Bardhan, P (1989). Alternative Approaches to the Theory of Institutions. In P Bardhan (ed), The
Economic Theory of Agrarian Institutions. Oxford: Clarendon Press, pp. 3–17
Barro, R J (1976). The Loan Market, Collateral, and Rates of Interest. Journal of Money, Credit and
Banking, 8 (4): 439-56.
Basu, K (1997). Analytical Development Economics: The Less Developed Economy Revisited.
Cambridge: MIT Press.
Besley, T (1994). How Do Market Failures Justify Interventions in Rural Credit Markets. World Bank Res
Observer, 9 (1): 27-47.
Besley T and S Coate (1995). Group Lending, Repayment Incentives, and Social Collateral. Journal of
Development Economics, 46 (1): 1-18.
Bester, H (1987). The Role of Collateral in Credit Markets with Imperfect Information. European
Economic Review, 31 (4): 887-99.
Bhaduri, A (1977). On the Formation of Usurious Interest Rates in Backward Agriculture. Cambridge
Journal of Economics, 1(4): 341-52.
Bhaduri, A (2006). Provision of Rural Financial Services: Some Important Considerations. In
Employment and Development: Essays from an Unorthodox Perspective. New Delhi: Oxford
University Press.

20
Bhatt, N and S Tang (2002). Determinants of Repayment in Microcredit: Evidence from Programs in the
United States. International Journal of Urban and Regional Research, 26 (2): 360-76.
Bhattacharjee M and M Rajeev (2009). Asymmetry in Information and Varying Rates of Interest: A
Study of the Informal Credit Market in West Bengal. Margin: The Journal of Applied Economic
Research, 3 (4): 339-64.
Bose, P (1998). Formal-informal sector interaction in rural credit markets. Journal of Development
Economics, 56: 265-80
Coate, S (1993). Reciprocity without Commitment : Characteristics and Performance of Informal
Insurance Arrangements. Journal of Development Economics, 40 (1): 1-24.
Deb, S and M Rajeev (2007). Banking on Baniyas for Credit . Economic and Political Weekly, January 27,
2007. 42 (4): 280-83.
Hatai, L D, H P Singh, C Sen, R S Dixit (2005). An Economic Analysis of Agricultural Credit and
Overdues in Different Regions of Uttar Pradesh. Indian Journal of Agricultural Economics, 60
(3): 364-364.
Haugen (2005). The Informal Credit Market: A Study of Default and Informal Lending in Nepal.
http://www.cmi.no/publications/file/?1937=the-informal-credit -market. Accessed on 10.11.07
Hoff, Karla and J E Stiglitz (1990). Imperfect Information and Rural Credit Markets--Puzzles and Policy
Perspectives. World Bank Economic Review, Oxford University Press, 4 (3): 235-50.
Hoff, Karla & J E Stiglitz, (1997). Moneylenders And Bankers: Price-Increasing Subsidies In A
Monopolistically Competitive Market. Journal of Development Economics, Elsevier, 52 (2): 429-
62.
Sharma, M and M Zeller (1997). Repayment Performance in Group Based Credit Programmes in
Bangladesh. World Development, 25 (10): 1731-42.
Rajaraman, I and G Vasistha (2002). Non-Performing Loans of PSU Banks: Some Panel Results.
Economic and Political Weekly, 37 (5): 429-35.
Rajaraman, I, S Bhaumik, N Bhatia (1999). NPA Variations across Indian Commercial Banks: Some
Findings. Economic and Political Weekly, 34 (3and 4): 16-23.
Rajeev, M, S Deb, R Ranade (2006). Why do Poor Farmers Default Less?: Case of Indian informal credit
market A game theoretic exploration.
http://mpra.ub.unimuenchen.de/768/01/MPRA_paper_768.pdf. posted: 17 November 2006.
Shivappa, H (2005). Agricultural Credit Utilization Pattern and its Repayment Performance of Borrowers’
of Regional Rural Banks in Karnataka – A Case Study of Chitradurga Gramina Bank. Indian
Journal of Agricultural Economics, 60 (3): 366-366.
Srinivasan, T N (1989). On Choice among Creditors and Bonded Labour Contracts. In Bardhan (ed), The
Economic Theory of Agrarian Institutions. Oxford: Clarendon Press. pp. 147–65.
Stiglitz J E (1987). The Principal and the Agent. The New Palgrave: A dictionary of Economics.
Udry, C (1990). Credit Markets in Northern Nigeria: Credit as Insurance in Rural Economy. World Bank
Economic Review, 4 (3): 251-70.

213 Spatio-Temporal Analysis of ForestsUnder Different Management RegimesUsing Landsat and IRS ImagesSunil Nautiyal
214 Traditional Knowledge System(Medicine): A Case Study of ArakalgudTaluk, Karnataka, IndiaB K Harish, K Lenin Babu
215 Tribal Movement in Orissa: A StruggleAgainst Modernisation?Patibandla Srikant
216 Technological Progress, Scale Effect andTotal Factor Productivity Growth inIndian Cement Industry: PanelEstimation of Stochastic ProductionFrontierSabuj Kumar Mandal and S Madheswaran
217 Fisheries and Livelihoods in TungabhadraBasin, India: Current Status and FuturePossibilitiesManasi S, Latha N and K V Raju
218 Economics of Shrimp Farming: AComparative Study of Traditional Vs.Scientific Shrimp Farming in West BengalPoulomi Bhattacharya
219 Output and Input Efficiency ofManufacturing Firms in India: A Case ofthe Indian Pharmaceutical SectorMainak Mazumdar, Meenakshi Rajeevand Subhash C Ray
220 Panchayats, Hariyali Guidelines andWatershed Development: Lessons fromKarnatakaN Sivanna
221 Gender Differential in Disease Burden: It’sRole to Explain Gender Differential inMortalityBiplab Dhak and Mutharayappa R
222 Sanitation Strategies in Karnataka: AReviewVeerashekharappa and Shashanka Bhide
223 A Comparative Analysis of Efficiency andproductivity of the Indian PharmaceuticalFirms: A Malmquist-Meta-FrontierApproachMainak Mazumdar and Meenakshi Rajeev
224 Local Governance, Patronage andAccountability in Karnataka and KeralaAnand Inbanathan
225 Downward Dividends of GroundwaterIrrigation in Hard Rock Areas of SouthernPeninsular IndiaAnantha K H
226 Trends and Patterns of Private Investmentin IndiaJagannath Mallick
227 Environmental Efficiency of the IndianCement Industry: An Interstate AnalysisSabuj Kumar Mandal and S Madheswaran
228 Determinants of Living Arrangements ofElderly in Orissa: An AnalysisAkshaya Kumar Panigrahi
229 Fiscal Empowerment of Panchayats inIndia: Real or Rhetoric?M Devendra Babu
230 Energy Use Efficiency in Indian CementIndustry: Application of DataEnvelopment Analysis and DirectionalDistance FunctionSabuj Kumar Mandaland S Madheswaran
231 Ethnicity, Caste and Community in aDisaster Prone Area of OrissaPriya Gupta
232 Koodankulam Anti-Nuclear Movement: AStruggle for Alternative Development?Patibandla Srikant
233 History Revisited: Narratives on Politicaland Constitutional Changes in Kashmir(1947-1990)Khalid Wasim Hassan
234 Spatial Heterogeneity and PopulationMobility in IndiaJajati Keshari Parida and S Madheswaran
235 Measuring Energy Use Efficiency inPresence of Undesirable Output: AnApplication of Data Envelopment Analysis(DEA) to Indian Cement IndustrySabuj Kumar Mandaland S Madheswaran
236 Increasing trend in Caesarean SectionDelivery in India: Role of Medicalisationof Maternal HealthSancheetha Ghosh
237 Migration of Kashmiri Pandits:Kashmiriyat Challenged?Khalid Wasim Hassan
238 Causality Between Energy Consumptionand Output Growth in Indian CementIndustry: An Application of Panel VectorError Correction ModelSabuj Kumar Mandal and S Madheswaran
239 Conflict Over Worship:A Study of the SriGuru Dattatreya Swami BababudhanDargah in South IndiaSudha Sitharaman
240 Living Arrangement Preferences of theElderly in Orissa, IndiaAkshaya Kumar Panigrahi
241 Challenges and Pospects in theMeasurement of Trade in ServicesKrushna Mohan Pattanaik
242 Dalit Movement and Emergence of theBahujan Samaj Party in Uttar Pradesh:Politics and PrioritiesShyam Singh
243 Globalisation, DemocraticDecentralisation and Social Secutiry inIndiaS N Sangita and T K Jyothi
244 Health, Labour Supply and Wages: ACritical Review of LiteratureAmrita Ghatak
245 Is Young Maternal Age A Risk Factor forSexually Transmitted Diseases andAnemia in India? An Examination inUrban and Rural AreasKavitha N
Recent Working Papers
246 Patterns and Determinants of FemaleMigration in India: Insights from CensusSandhya Rani Mahapatro
247 Spillover Effects from MultinationalCorporations: Evidence From West BengalEngineering IndustriesRajdeep Singha and K Gayithri
248 Effectiveness of SEZs Over EPZsStructure: The Performance at AggregateLevelMalini L Tantri
249 Income, Income Inequality and MortalityAn empirical investigation of therelationship in India, 1971-2003K S James and T S Syamala
250 Institutions and their Interactions:An Economic Analysis of IrrigationInstitutions in the Malaprabha DamProject Area, Karnataka, IndiaDurba Biswas and L Venkatachalam
251 Performance of Indian SEZs: ADisaggregated Level AnalysisMalini L Tantri
252 Banking Sector Reforms and NPA:A study of Indian Commercial BanksMeenakshi Rajeev and H P Mahesh
253 Government Policy and Performance: AStudy of Indian Engineering IndustryRajdeep Singha and K Gayithri
254 Reproduction of Institutions throughPeople’s Practices: Evidences from aGram Panchayat in KeralaRajesh K
255 Survival and Resilience of Two VillageCommunities in Coastal Orissa: AComparative Study of Coping withDisastersPriya Gupta
256 Engineering Industry, CorporateOwnership and Development: Are IndianFirms Catching up with the GlobalStandard?Rajdeep Singha and K Gayithri
257 Scheduled Castes, Legitimacy and LocalGovernance: Continuing Social Exclusionin PanchayatsAnand Inbanathan and N Sivanna
258 Plant-Biodiversity Conservation inAcademic Institutions: An EfficientApproach for Conserving BiodiversityAcross Ecological Regions in IndiaSunil Nautiyal
259 WTO and Agricultural Policy in KarnatakaMalini L Tantri and R S Deshpande
260 Tibetans in Bylakuppe: Political and LegalStatus and Settlement ExperiencesTunga Tarodi
261 Trajectories of China’s Integration withthe World Economy through SEZs: AStudy on Shenzhen SEZMalnil L Tantri
262 Governance Reforms in Power Sector:Initiatives and Outcomes in OrissaBikash Chandra Dash and S N Sangita
263 Conflicting Truths and ContrastingRealities: Are Official Statistics onAgrarian Change Reliable?V Anil Kumar
264 Food Security in Maharashtra: RegionalDimensionsNitin Tagade
265 Total Factor Productivity Growth and ItsDeterminants in Karnataka AgricultureElumalai Kannan
266 Revisiting Home: Tibetan Refugees,Perceptions of Home (Land) and Politicsof ReturnTarodi Tunga
267 Nature and Dimension of Farmers’Indebtedness in India and KarnatakaMeenakshi Rajeev and B P Vani
268 Civil Society Organisations andElementary Education Delivery in MadhyaPradeshReetika Syal
269 Burden of Income Loss due to Ailment inIndia: Evidence from NSS DataAmrita Ghatak and S Madheswaran
270 Progressive Lending as a DynamicIncentive Mechanism in MicrofinanceGroup Lending Programmes: EmpiricalEvidence from IndiaNaveen Kumar K and Veerashekharappa
271 Decentralisation and Interventions inHealth Sector: A Critical Inquiry into theExperience of Local Self Governments inKeralM Benson Thomas and K Rajesh
272 Determinants of Migration andRemittance in India: Empirical EvidenceJajati Keshari Parida and S MadheswaranManojit Bhattacharjee and Meenkashi Rajeev
Price: Rs. 30.00 ISBN 978-81-7791-129-9
INSTITUTE FOR SOCIAL AND ECONOMIC CHANGEDr V K R V Rao Road, Nagarabhavi P.O., Bangalore - 560 072, India
Phone: 0091-80-23215468, 23215519, 23215592; Fax: 0091-80-23217008E-mail: [email protected]; Web: www.isec.ac.in