load-carrying capacity test of a long-span timber truss · ditional timber roof structures...
TRANSCRIPT
Load-carrying capacity test of along-span timber trussJorge M. Branco PhDAssistant Professor, ISISE, Department of Civil Engineering, University ofMinho, Guimarães, Portugal (corresponding author: [email protected])
Humberto Varum PhDFull Professor, CONSTRUCT-LESE, Faculty of Engineering (FEUP), Universityof Porto, Porto, Portugal
Vitor Ramisote MScEngineer, Department of Civil Engineering, University of Aveiro, Aveiro,Portugal
Aníbal Costa PhDFull Professor, Department of Civil Engineering, University of Aveiro,Aveiro, Portugal
The aim of this work was to study the behaviour of existing timber trusses in order to improve the knowledge that
may support engineers in the definition of more adequate restoration interventions in old buildings, particularly of
long-span timber structures, as industrial or monumental constructions. For this purpose, a cyclic load-carrying test
was carried out on a full-scale timber planar truss rescued from an old industrial roof structure. Before the tests, an
accurate geometrical characterisation was performed and the biological condition of the timber elements was
evaluated by non-destructive tests to determine their effective cross-section. The results of the destructive load-
carrying test were used to calibrate a numerical model with the aim of assessing the effect of the effective cross-
sections of the truss components and the axial stiffness of the joints on the overall response observed during loading.
The full-scale test performed proved the importance of this type of testing in assessing the behaviour of existing
timber trusses. It is essential to assess the damage of the joints and to model correctly their behaviour so as to
numerically reproduce the overall behaviour of timber trusses.
NotationAheel strap cross-sectional area of heel strapEsteel modulus of elasticity of steelEα wood elastic modulus in direction forming an angle
α with the fibreE0 modulus of elasticity in direction along fibresE90 modulus of elasticity in orthogonal direction of
fibresG shear moduluskax axial stiffness of jointskax,hs axial stiffness of tie beam–post connectionsL longitudinal directionL nominal notch length, where compression
deformation occurredlheel strap length of heel strapR radial directionS nominal notch areaT transversal directionδ maximum vertical displacement of trussυ Poisson ratio
1. IntroductionThe assessment of existing timber structures requires, andrelies upon, the determination of the mechanical properties ofthe individual timber members, as well as the behaviour ofjoints and structural system effects (Cruz et al., 2015; Dietschand Kreuzinger, 2011; Frühwald, 2011; Uzielli, 2004).
In existing timber structures, the first step in safety assessmentis evaluation of the actual mechanical properties of thematerial (Riggio et al., 2013). Despite significant effort in thedevelopment of non-destructive testing, the strength of timbermembers can only be rigorously determined by destructivetests, which is often unacceptable in the case of historic build-ings and other existing timber structures (Calderoni et al.,2010; Kasal, 2010).
In practice, it is the lack of knowledge about the mechanicalproperties of these materials and their structural behaviourthat normally leads to the replacement of existing woodenstructures, instead of their retrofitting, to comply with thesafety and serviceability requirements proposed in recent codesand recommendations. Moreover, inaccurate characterisationof the behaviour of traditional timber roof structures can resultin adverse stress distribution estimates in the members, as aresult of inappropriate strengthening adopted in joints, interms of stiffness and/or strength (Descamps et al., 2014;Drdácký et al., 1999). Thus, laboratory tests on scaled or full-scale specimens of members, connections and trusses arerecognised as instruments that can provide valuable infor-mation for a better understanding of the behaviour of tra-ditional timber roof structures (Bertolini-Cestari et al., 2013;Del Senno and Piazza, 2003).
Portuguese traditional buildings are normally constituted bytimber roof systems, with the truss as the main structural
373
Structures and BuildingsVolume 169 Issue SB5
Load-carrying capacity test of a long-spantimber trussBranco, Varum, Ramisote and Costa
Proceedings of the Institution of Civil EngineersStructures and Buildings 169 May 2016 Issue SB5Pages 373–387 http://dx.doi.org/10.1680/jstbu.15.00006Paper 1500006Received 05/01/2015 Accepted 06/11/2015Published online 18/12/2015Keywords: maintenance & inspection/rehabilitation, reclamation& renovation/timber structures
ICE Publishing: All rights reserved
Downloaded by [] on [12/01/17]. Copyright © ICE Publishing, all rights reserved.
system for larger spans. Nowadays, a considerable number oftimber roofs require structural intervention as a consequenceof natural degradation of the material, improper maintenanceof the wood or of the structure itself, faulty design or construc-tion, or accidental actions. A precise assessment of the extentof degradation and its effects in the overall structural systemshould precede any retrofitting action, which can vary fromsimple works in the covering system to substitution of struc-tural members or strengthening of joints/elements.
The assessed truss was saved from the roof structure of anold factory which was demolished in Avanca, Portugal. Thetruss was transported as a whole to the laboratory in spite ofthe difficulties involved. The option of transporting the trussin parts was ruled out because the state of degradation of thewooden members would have hindered the reassembling ofthe truss.
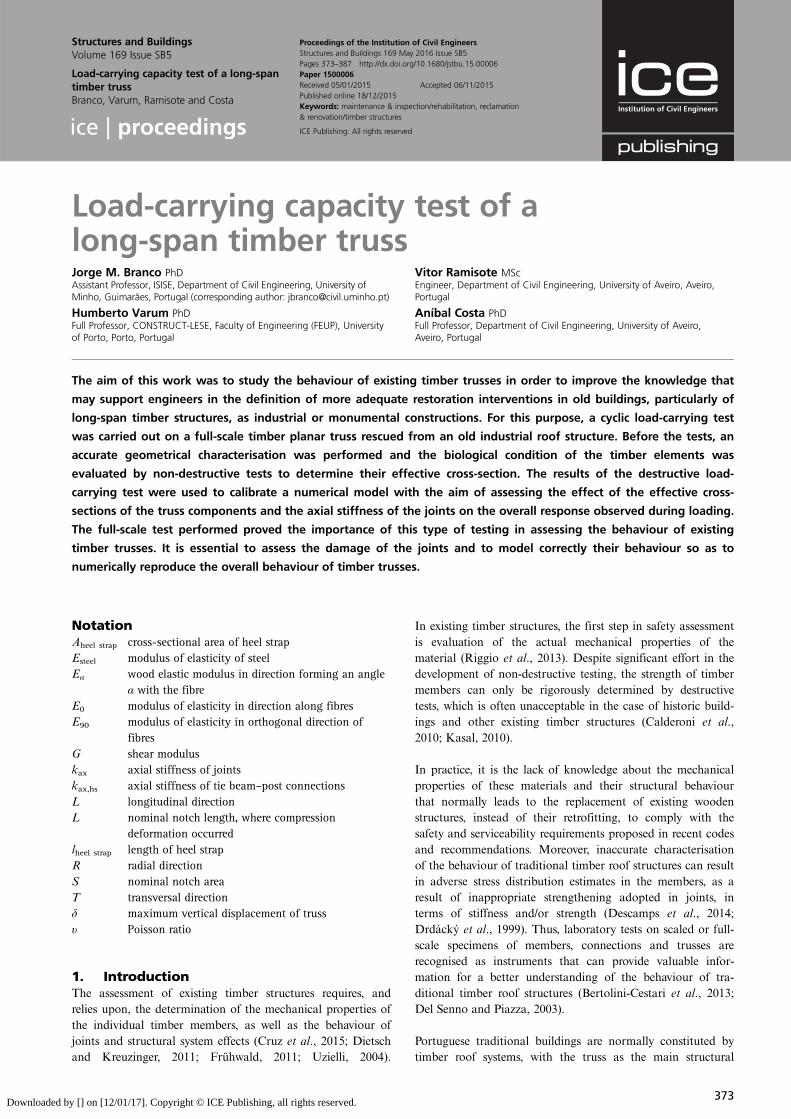
The roof was covered by ceramic tiles and its free span was12·7 m with a slope of 26°. The main structure was composedof 13 similar Howe trusses made of maritime pine (Pinuspinaster, Ait.) with an average spacing of 3·5 m. In Figure 1,the assessed Howe timber truss is presented along with theaverage cross-section of each element and details of the maincarpentry joints. The actual age of the truss structure is notprecisely known, but the factory has been known to exist since1920 (Santos, 2009).
2. Visual inspectionA detailed visual inspection should be the starting point forany analysis of traditional timber structures. The visual inspec-tion enables detection of external wood decay, as well as anyvisible mechanical damage. Moreover, it can be used to detectadverse climatic conditions in the past or present, as evidencedby moisture stains on exposed surfaces (Branco et al., 2010).
The visual inspection undertaken for the studied truss compre-hended its geometric assessment and the state of conservation.A detailed inspection of each truss component was performed,while the dimensions of representative cross-sections of eachelement were measured.
During the visual inspection, it was evident that one side ofthe truss presented a more pronounced degradation. This ismainly a consequence of the cutting process of the timberelements that compose the truss. In fact, all of the timberelements present an eccentricity of the pith in relation to thecross-section, resulting in different durability of the timberelement faces. According to EN 350-2 (CEN, 1994) andFICHA M2 (1997), this wood species is moderately to slightlyresistant to fungi but susceptible to beetles, termites andmarine borers, with the heartwood being extremely difficult totreat, whereas the sapwood is easy to treat. However, for theservice class corresponding to an industrial roof under coverand not exposed to the weather, practice shows that, in the
Princess post120 × 85
Queen post150 × 90
King post200 × 100
Struts (1)180 × 100
Tie beam 220 × 100
Rafter180 × 110
Struts (2)150 × 953·
44
2·26 2·17 2·11 2·11 2·17 2·26
13·07
D1
D3
D2
D4
Detail D1 Detail D2 Detail D3 Detail D4
0·31 0·42
0·22
0·02 0·02
0·02
0·03
4°
0·02
0·15
0·18
0·02 0·22 0·02
Figure 1. Timber truss studied (dimensions in metres and cross-
sections in millimetres)
374
Structures and BuildingsVolume 169 Issue SB5
Load-carrying capacity test of a long-spantimber trussBranco, Varum, Ramisote and Costa
Downloaded by [] on [12/01/17]. Copyright © ICE Publishing, all rights reserved.
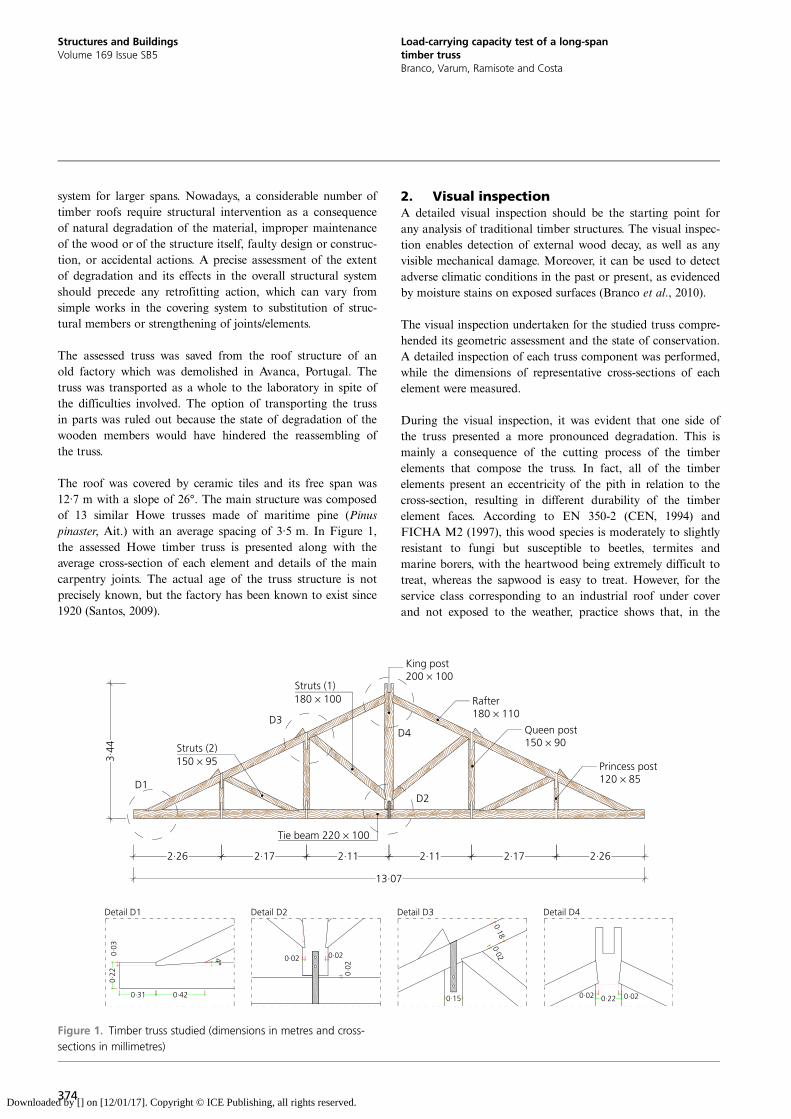
case of the maritime pine (Pinus pinaster, Ait.), the heartwoodcan be assumed to be durable to biological and insect attacks,whereas the sapwood is not (FICHA M2, 1997). Figure 2shows examples of cross-sections where the eccentricity of thepith is visible and the degradation is concentrated in thesapwood.
Visual inspection was also fundamental to perform a detailedgeometric assessment of the various components of the truss,including the joints. In terms of joints, all are carpentry jointswithout tenons or pegs and most of them have a single
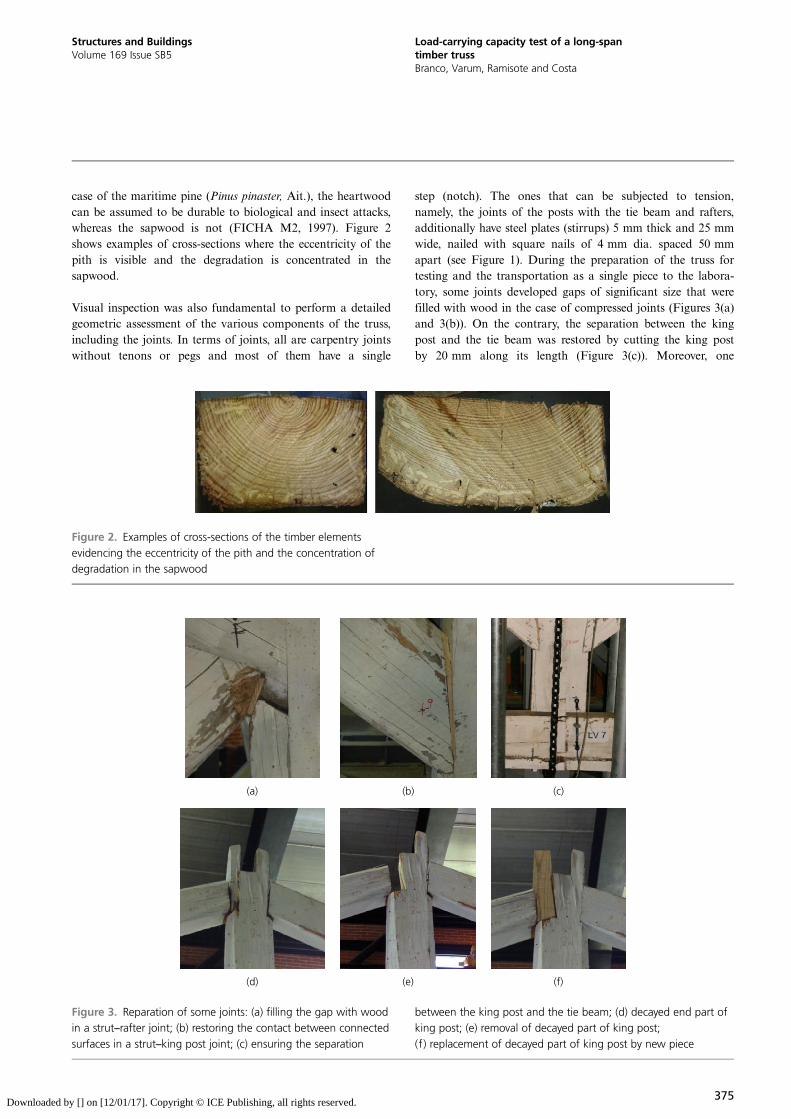
step (notch). The ones that can be subjected to tension,namely, the joints of the posts with the tie beam and rafters,additionally have steel plates (stirrups) 5 mm thick and 25 mmwide, nailed with square nails of 4 mm dia. spaced 50 mmapart (see Figure 1). During the preparation of the truss fortesting and the transportation as a single piece to the labora-tory, some joints developed gaps of significant size that werefilled with wood in the case of compressed joints (Figures 3(a)and 3(b)). On the contrary, the separation between the kingpost and the tie beam was restored by cutting the king postby 20 mm along its length (Figure 3(c)). Moreover, one
Figure 2. Examples of cross-sections of the timber elements
evidencing the eccentricity of the pith and the concentration of
degradation in the sapwood
(a) (b) (c)
(d) (e) (f)
Figure 3. Reparation of some joints: (a) filling the gap with wood
in a strut–rafter joint; (b) restoring the contact between connected
surfaces in a strut–king post joint; (c) ensuring the separation
between the king post and the tie beam; (d) decayed end part of
king post; (e) removal of decayed part of king post;
(f) replacement of decayed part of king post by new piece
375
Structures and BuildingsVolume 169 Issue SB5
Load-carrying capacity test of a long-spantimber trussBranco, Varum, Ramisote and Costa
Downloaded by [] on [12/01/17]. Copyright © ICE Publishing, all rights reserved.
joint between the king post and one rafter was partiallyrebuilt as a result of degradation in the king post. The decayedpart was replaced by a piece of the same wood species(Figures 3(d)–3(f)).
Visual inspection also allowed the abnormalities of thematerial to be identified – wane, twist, bow and grain slope –
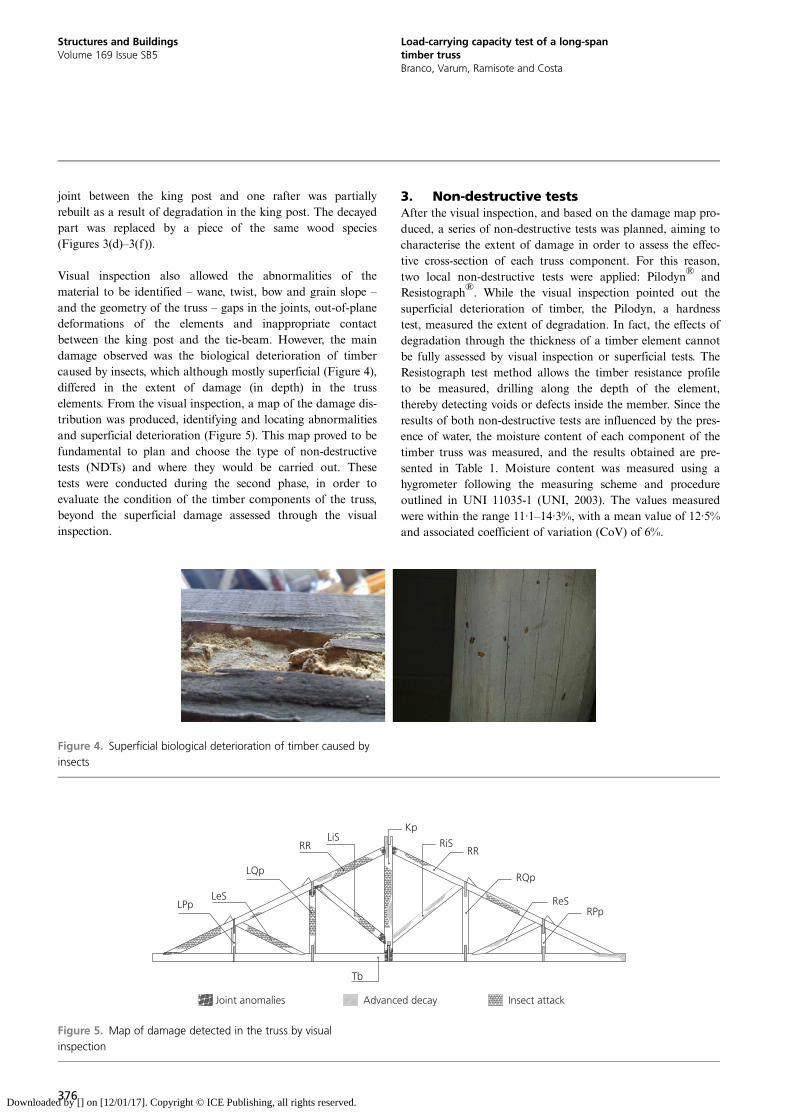
and the geometry of the truss – gaps in the joints, out-of-planedeformations of the elements and inappropriate contactbetween the king post and the tie-beam. However, the maindamage observed was the biological deterioration of timbercaused by insects, which although mostly superficial (Figure 4),differed in the extent of damage (in depth) in the trusselements. From the visual inspection, a map of the damage dis-tribution was produced, identifying and locating abnormalitiesand superficial deterioration (Figure 5). This map proved to befundamental to plan and choose the type of non-destructivetests (NDTs) and where they would be carried out. Thesetests were conducted during the second phase, in order toevaluate the condition of the timber components of the truss,beyond the superficial damage assessed through the visualinspection.
3. Non-destructive testsAfter the visual inspection, and based on the damage map pro-duced, a series of non-destructive tests was planned, aiming tocharacterise the extent of damage in order to assess the effec-tive cross-section of each truss component. For this reason,two local non-destructive tests were applied: Pilodyn® andResistograph®. While the visual inspection pointed out thesuperficial deterioration of timber, the Pilodyn, a hardnesstest, measured the extent of degradation. In fact, the effects ofdegradation through the thickness of a timber element cannotbe fully assessed by visual inspection or superficial tests. TheResistograph test method allows the timber resistance profileto be measured, drilling along the depth of the element,thereby detecting voids or defects inside the member. Since theresults of both non-destructive tests are influenced by the pres-ence of water, the moisture content of each component of thetimber truss was measured, and the results obtained are pre-sented in Table 1. Moisture content was measured using ahygrometer following the measuring scheme and procedureoutlined in UNI 11035-1 (UNI, 2003). The values measuredwere within the range 11·1–14·3%, with a mean value of 12·5%and associated coefficient of variation (CoV) of 6%.
Figure 4. Superficial biological deterioration of timber caused by
insects
LPpLeS
LQp
RRLiS
Kp
RiSRR
RQp
ReSRPp
Tb
Joint anomalies Advanced decay Insect attack
Figure 5. Map of damage detected in the truss by visual
inspection
376
Structures and BuildingsVolume 169 Issue SB5
Load-carrying capacity test of a long-spantimber trussBranco, Varum, Ramisote and Costa
Downloaded by [] on [12/01/17]. Copyright © ICE Publishing, all rights reserved.
3.1 PilodynPilodyn is a non-destructive test that evaluates the superficialstate of a wood structural member (superficial density, resist-ance and decay) through a penetration depth parameter.Pilodyn measurements can be used for the estimation of par-ameters such as density, mechanical properties and degra-dation. Unfortunately, in the case of decayed or damagedtimber, the method encounters limitations associated with itssuperficial assessment essence.
The principle of operation is based on penetration (maximumof 40 mm) of a pin (diameter of 2·5 mm) in the wood elementby means of a dynamic impact. The test output is the pen-etration depth.
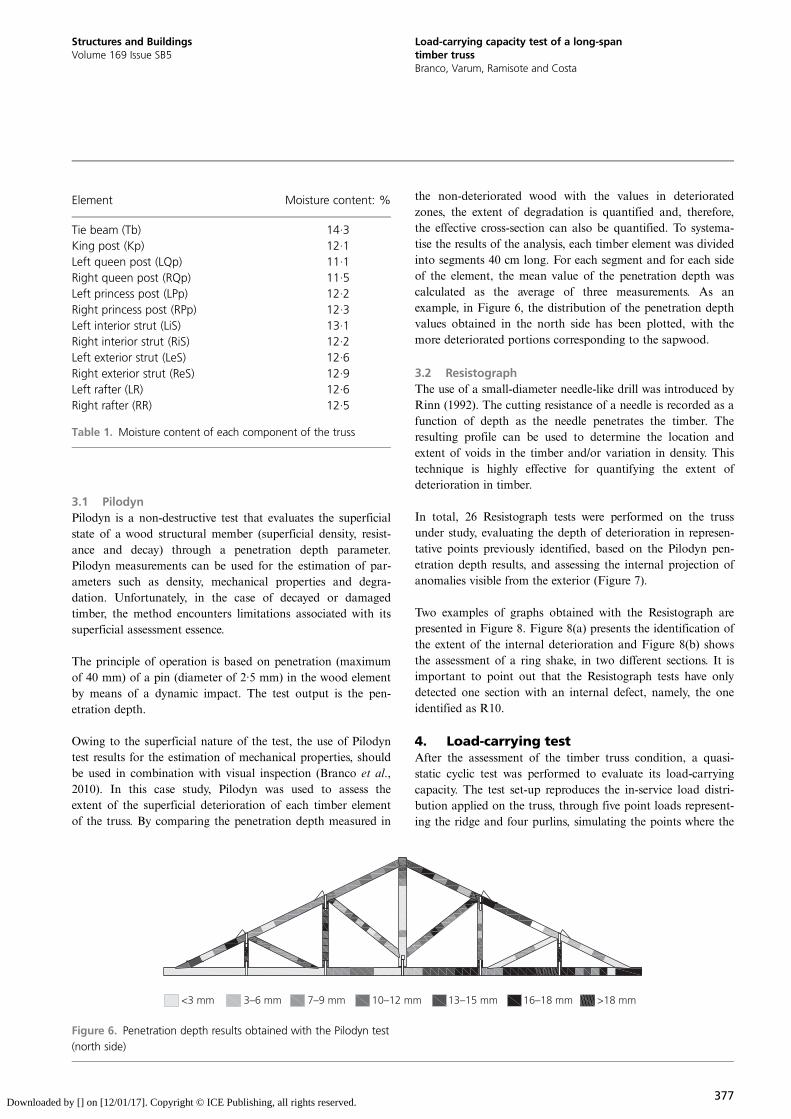
Owing to the superficial nature of the test, the use of Pilodyntest results for the estimation of mechanical properties, shouldbe used in combination with visual inspection (Branco et al.,2010). In this case study, Pilodyn was used to assess theextent of the superficial deterioration of each timber elementof the truss. By comparing the penetration depth measured in
the non-deteriorated wood with the values in deterioratedzones, the extent of degradation is quantified and, therefore,the effective cross-section can also be quantified. To systema-tise the results of the analysis, each timber element was dividedinto segments 40 cm long. For each segment and for each sideof the element, the mean value of the penetration depth wascalculated as the average of three measurements. As anexample, in Figure 6, the distribution of the penetration depthvalues obtained in the north side has been plotted, with themore deteriorated portions corresponding to the sapwood.
3.2 ResistographThe use of a small-diameter needle-like drill was introduced byRinn (1992). The cutting resistance of a needle is recorded as afunction of depth as the needle penetrates the timber. Theresulting profile can be used to determine the location andextent of voids in the timber and/or variation in density. Thistechnique is highly effective for quantifying the extent ofdeterioration in timber.
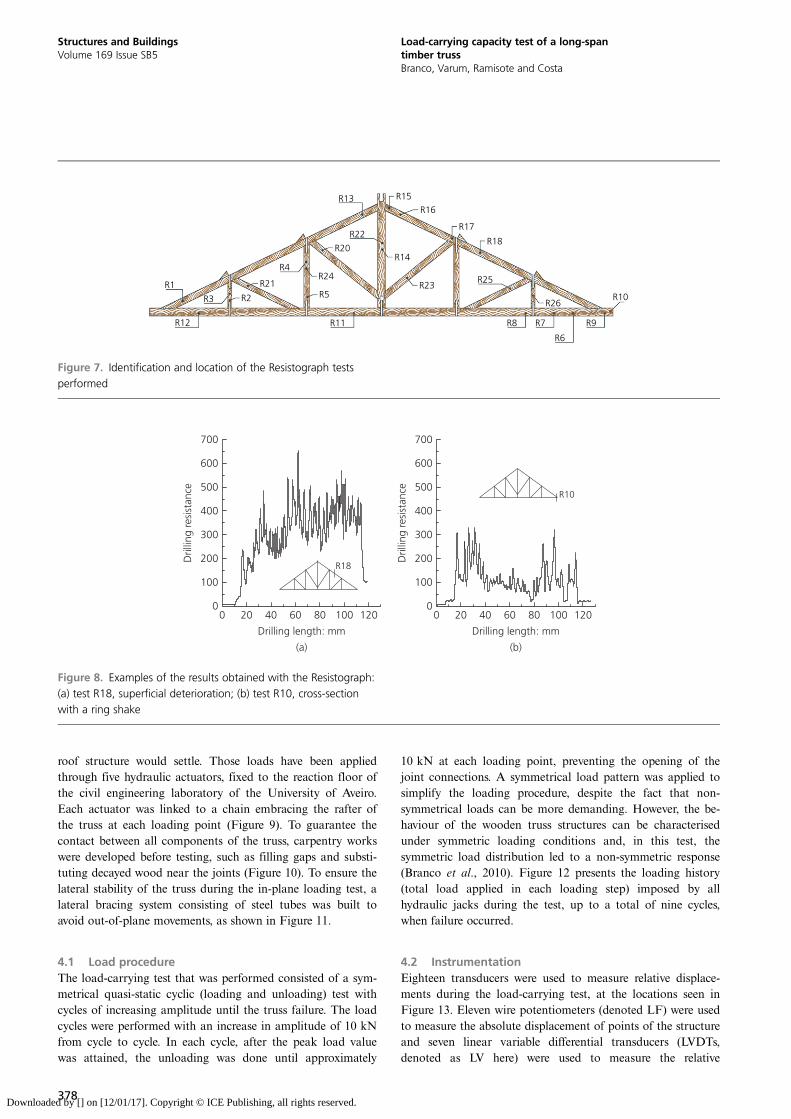
In total, 26 Resistograph tests were performed on the trussunder study, evaluating the depth of deterioration in represen-tative points previously identified, based on the Pilodyn pen-etration depth results, and assessing the internal projection ofanomalies visible from the exterior (Figure 7).
Two examples of graphs obtained with the Resistograph arepresented in Figure 8. Figure 8(a) presents the identification ofthe extent of the internal deterioration and Figure 8(b) showsthe assessment of a ring shake, in two different sections. It isimportant to point out that the Resistograph tests have onlydetected one section with an internal defect, namely, the oneidentified as R10.
4. Load-carrying testAfter the assessment of the timber truss condition, a quasi-static cyclic test was performed to evaluate its load-carryingcapacity. The test set-up reproduces the in-service load distri-bution applied on the truss, through five point loads represent-ing the ridge and four purlins, simulating the points where the
Element Moisture content: %
Tie beam (Tb) 14·3King post (Kp) 12·1Left queen post (LQp) 11·1Right queen post (RQp) 11·5Left princess post (LPp) 12·2Right princess post (RPp) 12·3Left interior strut (LiS) 13·1Right interior strut (RiS) 12·2Left exterior strut (LeS) 12·6Right exterior strut (ReS) 12·9Left rafter (LR) 12·6Right rafter (RR) 12·5
Table 1. Moisture content of each component of the truss
<3 mm 3–6 mm 7–9 mm 10–12 mm 13–15 mm 16–18 mm >18 mm
Figure 6. Penetration depth results obtained with the Pilodyn test
(north side)
377
Structures and BuildingsVolume 169 Issue SB5
Load-carrying capacity test of a long-spantimber trussBranco, Varum, Ramisote and Costa
Downloaded by [] on [12/01/17]. Copyright © ICE Publishing, all rights reserved.
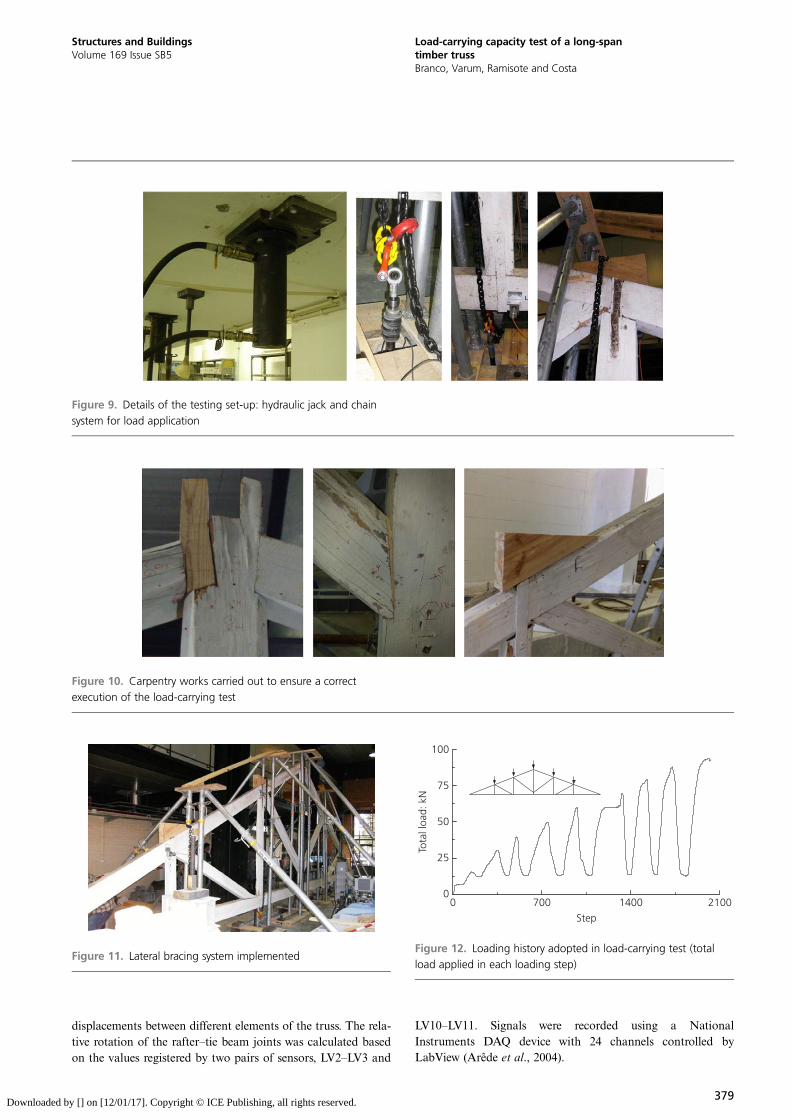
roof structure would settle. Those loads have been appliedthrough five hydraulic actuators, fixed to the reaction floor ofthe civil engineering laboratory of the University of Aveiro.Each actuator was linked to a chain embracing the rafter ofthe truss at each loading point (Figure 9). To guarantee thecontact between all components of the truss, carpentry workswere developed before testing, such as filling gaps and substi-tuting decayed wood near the joints (Figure 10). To ensure thelateral stability of the truss during the in-plane loading test, alateral bracing system consisting of steel tubes was built toavoid out-of-plane movements, as shown in Figure 11.
4.1 Load procedureThe load-carrying test that was performed consisted of a sym-metrical quasi-static cyclic (loading and unloading) test withcycles of increasing amplitude until the truss failure. The loadcycles were performed with an increase in amplitude of 10 kNfrom cycle to cycle. In each cycle, after the peak load valuewas attained, the unloading was done until approximately
10 kN at each loading point, preventing the opening of thejoint connections. A symmetrical load pattern was applied tosimplify the loading procedure, despite the fact that non-symmetrical loads can be more demanding. However, the be-haviour of the wooden truss structures can be characterisedunder symmetric loading conditions and, in this test, thesymmetric load distribution led to a non-symmetric response(Branco et al., 2010). Figure 12 presents the loading history(total load applied in each loading step) imposed by allhydraulic jacks during the test, up to a total of nine cycles,when failure occurred.
4.2 InstrumentationEighteen transducers were used to measure relative displace-ments during the load-carrying test, at the locations seen inFigure 13. Eleven wire potentiometers (denoted LF) were usedto measure the absolute displacement of points of the structureand seven linear variable differential transducers (LVDTs,denoted as LV here) were used to measure the relative
R13 R15
R16
R17
R18
R1
R3 R2
R12
R21
R4R24
R5
R11
R20
R22
R14
R23R25
R26
R7R8 R9
R6
R10
Figure 7. Identification and location of the Resistograph tests
performed
700
600
500
400
300
200
100
00 20 40 60
Drilling length: mm
80 100 120
Dril
ling
resi
stan
ce
R18
700
600
500
400
300
200
100
00 20 40 60
Drilling length: mm
80 100 120
Dril
ling
resi
stan
ce R10
(a) (b)
Figure 8. Examples of the results obtained with the Resistograph:
(a) test R18, superficial deterioration; (b) test R10, cross-section
with a ring shake
378
Structures and BuildingsVolume 169 Issue SB5
Load-carrying capacity test of a long-spantimber trussBranco, Varum, Ramisote and Costa
Downloaded by [] on [12/01/17]. Copyright © ICE Publishing, all rights reserved.
displacements between different elements of the truss. The rela-tive rotation of the rafter–tie beam joints was calculated basedon the values registered by two pairs of sensors, LV2–LV3 and
LV10–LV11. Signals were recorded using a NationalInstruments DAQ device with 24 channels controlled byLabView (Arêde et al., 2004).
Figure 9. Details of the testing set-up: hydraulic jack and chain
system for load application
Figure 10. Carpentry works carried out to ensure a correct
execution of the load-carrying test
Figure 11. Lateral bracing system implemented
100
Tota
l loa
d: k
N
75
50
25
00 700
Step
1400 2100
Figure 12. Loading history adopted in load-carrying test (total
load applied in each loading step)
379
Structures and BuildingsVolume 169 Issue SB5
Load-carrying capacity test of a long-spantimber trussBranco, Varum, Ramisote and Costa
Downloaded by [] on [12/01/17]. Copyright © ICE Publishing, all rights reserved.
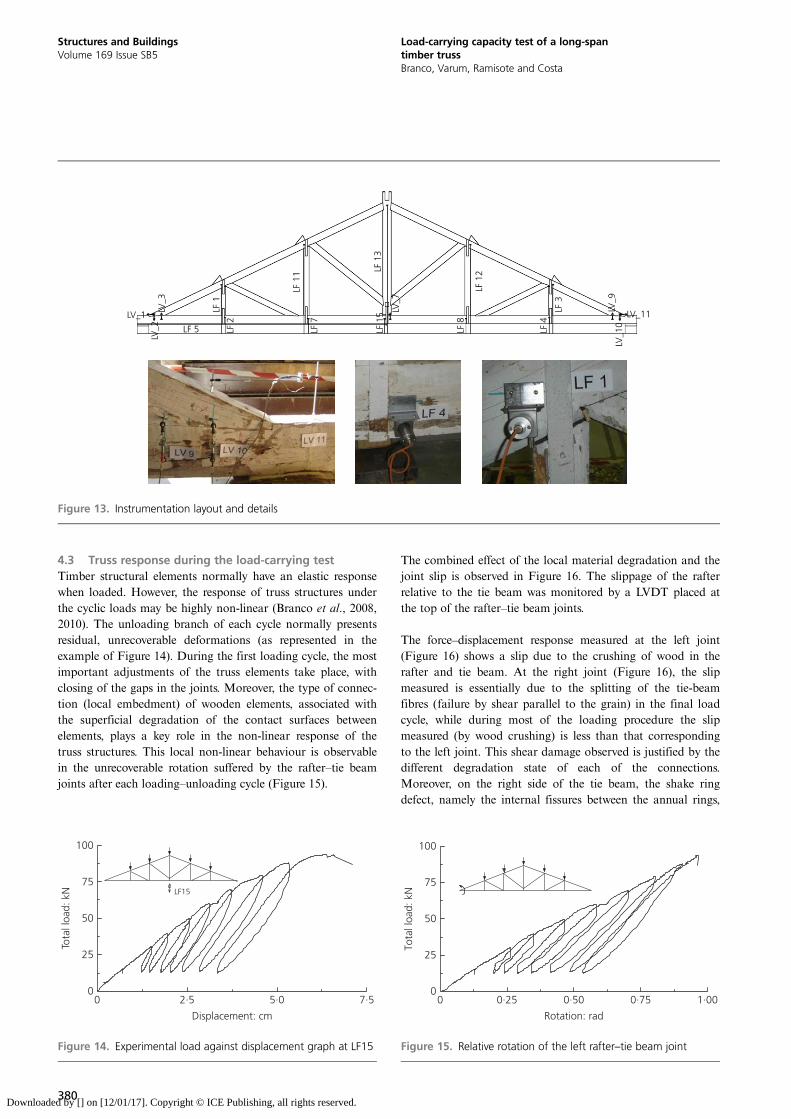
4.3 Truss response during the load-carrying testTimber structural elements normally have an elastic responsewhen loaded. However, the response of truss structures underthe cyclic loads may be highly non-linear (Branco et al., 2008,2010). The unloading branch of each cycle normally presentsresidual, unrecoverable deformations (as represented in theexample of Figure 14). During the first loading cycle, the mostimportant adjustments of the truss elements take place, withclosing of the gaps in the joints. Moreover, the type of connec-tion (local embedment) of wooden elements, associated withthe superficial degradation of the contact surfaces betweenelements, plays a key role in the non-linear response of thetruss structures. This local non-linear behaviour is observablein the unrecoverable rotation suffered by the rafter–tie beamjoints after each loading–unloading cycle (Figure 15).
The combined effect of the local material degradation and thejoint slip is observed in Figure 16. The slippage of the rafterrelative to the tie beam was monitored by a LVDT placed atthe top of the rafter–tie beam joints.
The force–displacement response measured at the left joint(Figure 16) shows a slip due to the crushing of wood in therafter and tie beam. At the right joint (Figure 16), the slipmeasured is essentially due to the splitting of the tie-beamfibres (failure by shear parallel to the grain) in the final loadcycle, while during most of the loading procedure the slipmeasured (by wood crushing) is less than that correspondingto the left joint. This shear damage observed is justified by thedifferent degradation state of each of the connections.Moreover, on the right side of the tie beam, the shake ringdefect, namely the internal fissures between the annual rings,
LV_1 LV_11LV_9
LF 3
LF 1
2LF 1
3
LF 5 LF 2
LF 7
LF 8
LF 4
LF 1
5
LV_2
LV_3
LF 1
LV_7
LV_1
0
LF 1
1
Figure 13. Instrumentation layout and details
100
75
50
25
00 2·5 5·0 7·5
Tota
l loa
d: k
N
Displacement: cm
LF15
Figure 14. Experimental load against displacement graph at LF15
0 0·25 0·50 0·75 1·000
25
50
75
100
Tota
l loa
d: k
N
Rotation: rad
Figure 15. Relative rotation of the left rafter–tie beam joint
380
Structures and BuildingsVolume 169 Issue SB5
Load-carrying capacity test of a long-spantimber trussBranco, Varum, Ramisote and Costa
Downloaded by [] on [12/01/17]. Copyright © ICE Publishing, all rights reserved.
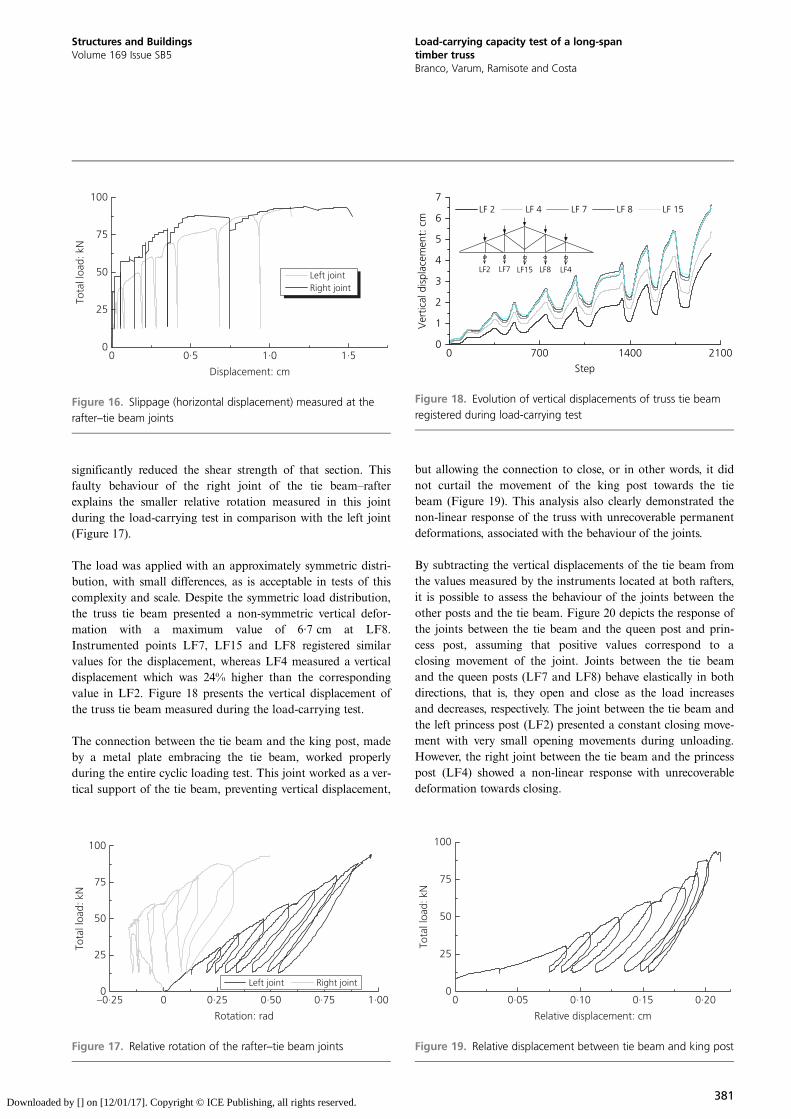
significantly reduced the shear strength of that section. Thisfaulty behaviour of the right joint of the tie beam–rafterexplains the smaller relative rotation measured in this jointduring the load-carrying test in comparison with the left joint(Figure 17).
The load was applied with an approximately symmetric distri-bution, with small differences, as is acceptable in tests of thiscomplexity and scale. Despite the symmetric load distribution,the truss tie beam presented a non-symmetric vertical defor-mation with a maximum value of 6·7 cm at LF8.Instrumented points LF7, LF15 and LF8 registered similarvalues for the displacement, whereas LF4 measured a verticaldisplacement which was 24% higher than the correspondingvalue in LF2. Figure 18 presents the vertical displacement ofthe truss tie beam measured during the load-carrying test.
The connection between the tie beam and the king post, madeby a metal plate embracing the tie beam, worked properlyduring the entire cyclic loading test. This joint worked as a ver-tical support of the tie beam, preventing vertical displacement,
but allowing the connection to close, or in other words, it didnot curtail the movement of the king post towards the tiebeam (Figure 19). This analysis also clearly demonstrated thenon-linear response of the truss with unrecoverable permanentdeformations, associated with the behaviour of the joints.
By subtracting the vertical displacements of the tie beam fromthe values measured by the instruments located at both rafters,it is possible to assess the behaviour of the joints between theother posts and the tie beam. Figure 20 depicts the response ofthe joints between the tie beam and the queen post and prin-cess post, assuming that positive values correspond to aclosing movement of the joint. Joints between the tie beamand the queen posts (LF7 and LF8) behave elastically in bothdirections, that is, they open and close as the load increasesand decreases, respectively. The joint between the tie beam andthe left princess post (LF2) presented a constant closing move-ment with very small opening movements during unloading.However, the right joint between the tie beam and the princesspost (LF4) showed a non-linear response with unrecoverabledeformation towards closing.
0 0·5 1·0 1·50
25
50
75
100
Tota
l loa
d: k
N
Displacement: cm
Left jointRight joint
Figure 16. Slippage (horizontal displacement) measured at the
rafter–tie beam joints
–0·25 0 0·25 0·50 0·75 1·000
25
50
75
100
Tota
l loa
d: k
N
Rotation: rad
Left joint Right joint
Figure 17. Relative rotation of the rafter–tie beam joints
0 700 1400 21000
1
2
3
4
5
6
7
Ver
tical
dis
plac
emen
t: c
m
Step
LF 2 LF 4 LF 7 LF 8 LF 15
LF2 LF7 LF4LF15 LF8
Figure 18. Evolution of vertical displacements of truss tie beam
registered during load-carrying testTo
tal l
oad:
kN
0 0·05 0·10 0·15 0·200
25
50
75
100
Relative displacement: cm
Figure 19. Relative displacement between tie beam and king post
381
Structures and BuildingsVolume 169 Issue SB5
Load-carrying capacity test of a long-spantimber trussBranco, Varum, Ramisote and Costa
Downloaded by [] on [12/01/17]. Copyright © ICE Publishing, all rights reserved.
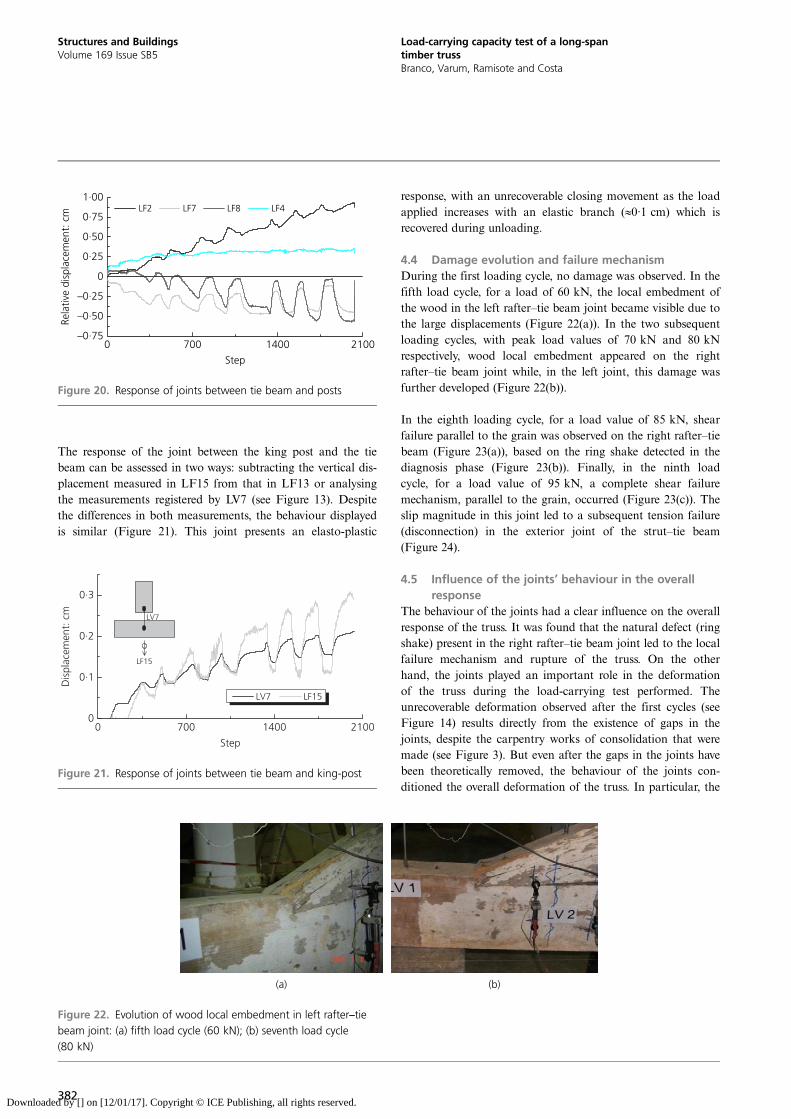
The response of the joint between the king post and the tiebeam can be assessed in two ways: subtracting the vertical dis-placement measured in LF15 from that in LF13 or analysingthe measurements registered by LV7 (see Figure 13). Despitethe differences in both measurements, the behaviour displayedis similar (Figure 21). This joint presents an elasto-plastic
response, with an unrecoverable closing movement as the loadapplied increases with an elastic branch (≈0·1 cm) which isrecovered during unloading.
4.4 Damage evolution and failure mechanismDuring the first loading cycle, no damage was observed. In thefifth load cycle, for a load of 60 kN, the local embedment ofthe wood in the left rafter–tie beam joint became visible due tothe large displacements (Figure 22(a)). In the two subsequentloading cycles, with peak load values of 70 kN and 80 kNrespectively, wood local embedment appeared on the rightrafter–tie beam joint while, in the left joint, this damage wasfurther developed (Figure 22(b)).
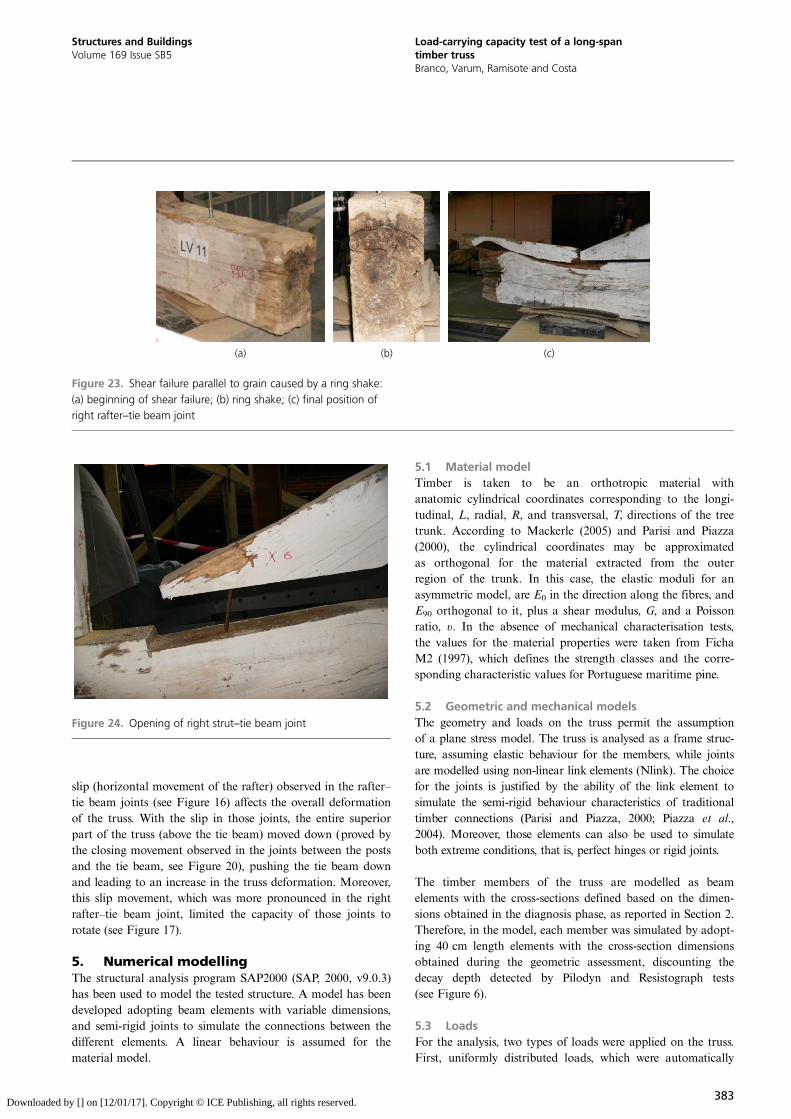
In the eighth loading cycle, for a load value of 85 kN, shearfailure parallel to the grain was observed on the right rafter–tiebeam (Figure 23(a)), based on the ring shake detected in thediagnosis phase (Figure 23(b)). Finally, in the ninth loadcycle, for a load value of 95 kN, a complete shear failuremechanism, parallel to the grain, occurred (Figure 23(c)). Theslip magnitude in this joint led to a subsequent tension failure(disconnection) in the exterior joint of the strut–tie beam(Figure 24).
4.5 Influence of the joints’ behaviour in the overallresponse
The behaviour of the joints had a clear influence on the overallresponse of the truss. It was found that the natural defect (ringshake) present in the right rafter–tie beam joint led to the localfailure mechanism and rupture of the truss. On the otherhand, the joints played an important role in the deformationof the truss during the load-carrying test performed. Theunrecoverable deformation observed after the first cycles (seeFigure 14) results directly from the existence of gaps in thejoints, despite the carpentry works of consolidation that weremade (see Figure 3). But even after the gaps in the joints havebeen theoretically removed, the behaviour of the joints con-ditioned the overall deformation of the truss. In particular, the
0 700 1400 2100–0·75
–0·50
–0·25
0
0·25
0·50
0·75
1·00
Step
Rela
tive
disp
lace
men
t: c
m LF2 LF7 LF8 LF4
Figure 20. Response of joints between tie beam and posts
0
0·3
0·2
0·1
0700 1400 2100
Step
Dis
plac
emen
t: c
m LV7
LF15
LV7 LF15
Figure 21. Response of joints between tie beam and king-post
(a) (b)
Figure 22. Evolution of wood local embedment in left rafter–tie
beam joint: (a) fifth load cycle (60 kN); (b) seventh load cycle
(80 kN)
382
Structures and BuildingsVolume 169 Issue SB5
Load-carrying capacity test of a long-spantimber trussBranco, Varum, Ramisote and Costa
Downloaded by [] on [12/01/17]. Copyright © ICE Publishing, all rights reserved.
slip (horizontal movement of the rafter) observed in the rafter–tie beam joints (see Figure 16) affects the overall deformationof the truss. With the slip in those joints, the entire superiorpart of the truss (above the tie beam) moved down (proved bythe closing movement observed in the joints between the postsand the tie beam, see Figure 20), pushing the tie beam downand leading to an increase in the truss deformation. Moreover,this slip movement, which was more pronounced in the rightrafter–tie beam joint, limited the capacity of those joints torotate (see Figure 17).
5. Numerical modellingThe structural analysis program SAP2000 (SAP, 2000, v9.0.3)has been used to model the tested structure. A model has beendeveloped adopting beam elements with variable dimensions,and semi-rigid joints to simulate the connections between thedifferent elements. A linear behaviour is assumed for thematerial model.
5.1 Material modelTimber is taken to be an orthotropic material withanatomic cylindrical coordinates corresponding to the longi-tudinal, L, radial, R, and transversal, T, directions of the treetrunk. According to Mackerle (2005) and Parisi and Piazza(2000), the cylindrical coordinates may be approximatedas orthogonal for the material extracted from the outerregion of the trunk. In this case, the elastic moduli for anasymmetric model, are E0 in the direction along the fibres, andE90 orthogonal to it, plus a shear modulus, G, and a Poissonratio, υ. In the absence of mechanical characterisation tests,the values for the material properties were taken from FichaM2 (1997), which defines the strength classes and the corre-sponding characteristic values for Portuguese maritime pine.
5.2 Geometric and mechanical modelsThe geometry and loads on the truss permit the assumptionof a plane stress model. The truss is analysed as a frame struc-ture, assuming elastic behaviour for the members, while jointsare modelled using non-linear link elements (Nlink). The choicefor the joints is justified by the ability of the link element tosimulate the semi-rigid behaviour characteristics of traditionaltimber connections (Parisi and Piazza, 2000; Piazza et al.,2004). Moreover, those elements can also be used to simulateboth extreme conditions, that is, perfect hinges or rigid joints.
The timber members of the truss are modelled as beamelements with the cross-sections defined based on the dimen-sions obtained in the diagnosis phase, as reported in Section 2.Therefore, in the model, each member was simulated by adopt-ing 40 cm length elements with the cross-section dimensionsobtained during the geometric assessment, discounting thedecay depth detected by Pilodyn and Resistograph tests(see Figure 6).
5.3 LoadsFor the analysis, two types of loads were applied on the truss.First, uniformly distributed loads, which were automatically
(a) (b) (c)
Figure 23. Shear failure parallel to grain caused by a ring shake:
(a) beginning of shear failure; (b) ring shake; (c) final position of
right rafter–tie beam joint
Figure 24. Opening of right strut–tie beam joint
383
Structures and BuildingsVolume 169 Issue SB5
Load-carrying capacity test of a long-spantimber trussBranco, Varum, Ramisote and Costa
Downloaded by [] on [12/01/17]. Copyright © ICE Publishing, all rights reserved.
computed, were imposed on the elements to represent the self-weight of the truss members. Subsequently, cyclic verticalloads were applied at the joints, simulating the loading historyadopted in the load-carrying test.
5.4 Semi-rigid modelling of connectionsTraditional timber joints, even without any kind ofstrengthening, usually have a significant moment capacity(Branco et al., 2011; Candelpergher and Piazza, 2001; Parisiand Piazza, 2000). Common constraint models, such as hingesor full restraint connections, cannot satisfactorily describethe real behaviour of these joints. However, in the case of theload-carrying test performed with symmetric loading, therotational stiffness of connections has a trivial influence onthe overall behaviour of the tested truss (Branco et al.,2008, 2010). However, the axial stiffness of the connectionsis crucial in the truss response (deformation and stressdistribution).
The axial stiffness (kax) depends on the mechanical propertiesof the lumber, the geometric proportions of the connectedelements and the connection angle (skew angle) (Piazza et al.,2004)
1: kax ¼ EαSl
where, applying the Hankinson Equation 2
2: Eα ¼ E0
cos2αþ ðE0=E90Þsin2α
represents the wood elastic modulus in the direction formingan angle α with the fibre
3: l ¼ h2 sinα
represents the nominal notch length, where compression defor-mation occurred, and
4: S ¼ Arafter
sinα
represents the nominal notch area, where stress was assumedto be transmitted.
The axial stiffness of the tie beam–post connections (kax,hs) hasbeen formulated taking into account the axial stiffness of theheel strap
5: kax;hs ¼ EsteelAheel strap
lheel strap
where Esteel is the modulus of elasticity of steel, Aheel strap andlheel strap are the cross-section and the length of the heel strap,respectively.
A detailed explanation of the above expressions and the par-ameters involved can be found in previous works such asPiazza et al. (2004) and Candelpergher and Piazza (2001),which are related to the numerical modelling of testing resultsof full-scale carpentry joints.
6. Numerical compared with experimentalresults
The first simulations were aimed at evaluating the reliability ofthe numerical model. The numerical analysis started with aninvestigation of the influence of stiffness of the joints. Resultsof a model with joints simulated as hinges were compared witha similar model but with rigid joints. In both models, thecross-sections measured in the visual inspection, withouttaking into account the degradation depth (effective cross-section of the truss members), were assumed. Despite thedifferences between displacement levels, rigid joints led tosmaller values of vertical displacements. Neither model wasable to represent the asymmetric response of the truss observed(see Figure 18).
The asymmetric response was reproduced only for the modelswhere the cross-section of the beam elements had taken intoaccount the wood deterioration. This outcome emphasises,once again, the importance of the diagnosis phase – in particu-lar, the adequate assessment of the effective cross-sections ofthe timber members – for a reliable study of the behaviour oftimber trusses in old constructions.
After the validation of the options taken in terms of the modelfor the joints (axial stiffness) and for the timber elements(beam elements with an effective cross-section measured foreach 40 cm length), the results of the numerical model werecompared with those recorded during the load-carrying test.Comparing the results of the maximum vertical displacementof the truss measured during the load-carrying test and thoseobtained from the numerical model assuming the theoreticalvalues for the joints’ axial stiffness, the latter values are only28% of the former (see Table 2). From this, it was clear thatthe theoretical values for the axial stiffness of the joints weretoo large. The overall wood decay, especially at areas of higherstress concentration ( joints), and the visible joint gaps, signifi-cantly reduced the initial axial stiffness of the joint. Despitethe joint gaps identified in the visual inspection being filledwith wood (Figure 3), the joint axial stiffness was not restored.So, a calibration process of the model was undertaken by redu-cing the axial stiffness values assumed for the joints.Numerically, adopting this simple model but reducing theaxial stiffness of the joints, it is possible to simulate theresponse of the joints during the load-carrying tests described
384
Structures and BuildingsVolume 169 Issue SB5
Load-carrying capacity test of a long-spantimber trussBranco, Varum, Ramisote and Costa
Downloaded by [] on [12/01/17]. Copyright © ICE Publishing, all rights reserved.
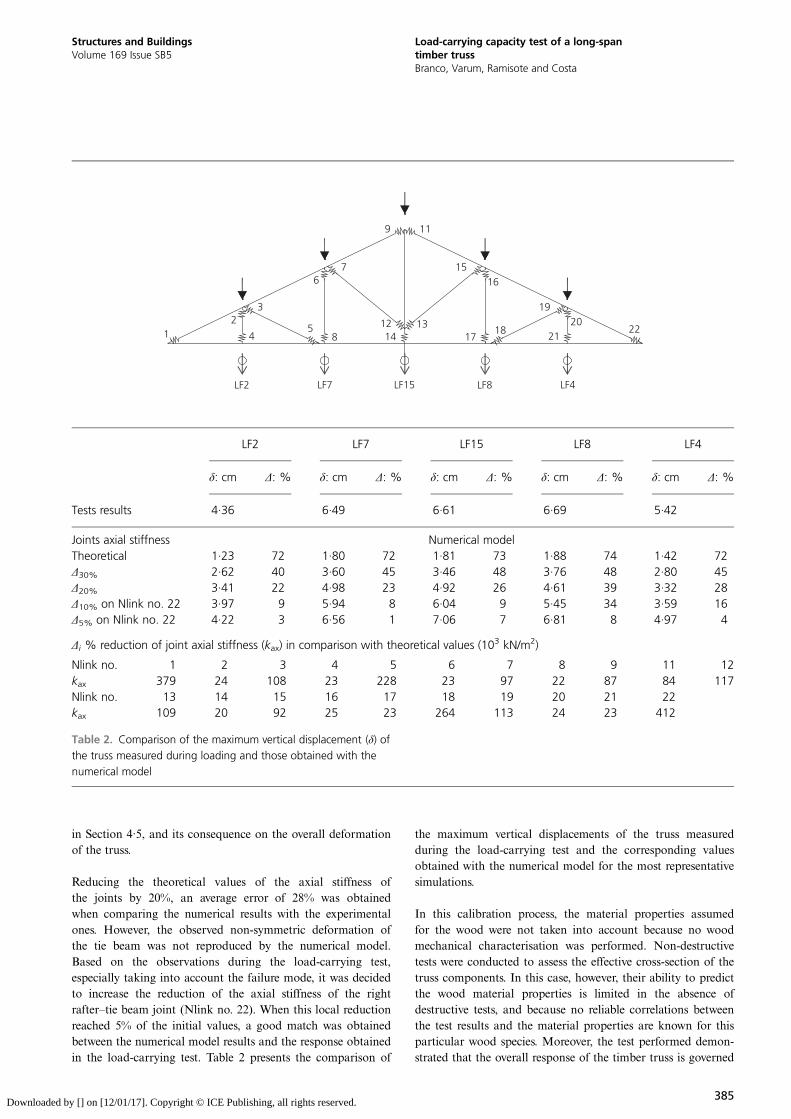
in Section 4·5, and its consequence on the overall deformationof the truss.
Reducing the theoretical values of the axial stiffness ofthe joints by 20%, an average error of 28% was obtainedwhen comparing the numerical results with the experimentalones. However, the observed non-symmetric deformation ofthe tie beam was not reproduced by the numerical model.Based on the observations during the load-carrying test,especially taking into account the failure mode, it was decidedto increase the reduction of the axial stiffness of the rightrafter–tie beam joint (Nlink no. 22). When this local reductionreached 5% of the initial values, a good match was obtainedbetween the numerical model results and the response obtainedin the load-carrying test. Table 2 presents the comparison of
the maximum vertical displacements of the truss measuredduring the load-carrying test and the corresponding valuesobtained with the numerical model for the most representativesimulations.
In this calibration process, the material properties assumedfor the wood were not taken into account because no woodmechanical characterisation was performed. Non-destructivetests were conducted to assess the effective cross-section of thetruss components. In this case, however, their ability to predictthe wood material properties is limited in the absence ofdestructive tests, and because no reliable correlations betweenthe test results and the material properties are known for thisparticular wood species. Moreover, the test performed demon-strated that the overall response of the timber truss is governed
LF2 LF7 LF15 LF8 LF4
12
4
3
58
67
1412
9
2220
21
19
1817
1615
13
11
Tests results
LF2 LF7 LF15 LF8 LF4
δ: cm Δ: % δ: cm Δ: % δ: cm Δ: % δ: cm Δ: % δ: cm Δ: %
4·36 6·49 6·61 6·69 5·42
Joints axial stiffness Numerical modelTheoretical 1·23 72 1·80 72 1·81 73 1·88 74 1·42 72Δ30% 2·62 40 3·60 45 3·46 48 3·76 48 2·80 45Δ20% 3·41 22 4·98 23 4·92 26 4·61 39 3·32 28Δ10% on Nlink no. 22 3·97 9 5·94 8 6·04 9 5·45 34 3·59 16Δ5% on Nlink no. 22 4·22 3 6·56 1 7·06 7 6·81 8 4·97 4
Δi % reduction of joint axial stiffness (kax) in comparison with theoretical values (103 kN/m2)
Nlink no. 1 2 3 4 5 6 7 8 9 11 12kax 379 24 108 23 228 23 97 22 87 84 117Nlink no. 13 14 15 16 17 18 19 20 21 22kax 109 20 92 25 23 264 113 24 23 412
Table 2. Comparison of the maximum vertical displacement (δ) of
the truss measured during loading and those obtained with the
numerical model
385
Structures and BuildingsVolume 169 Issue SB5
Load-carrying capacity test of a long-spantimber trussBranco, Varum, Ramisote and Costa
Downloaded by [] on [12/01/17]. Copyright © ICE Publishing, all rights reserved.

by the behaviour of the joints, in particular, by their axial stiff-ness, and by the existence of defects detected by visualinspection.
7. ConclusionsThe full-scale test conducted proved to be an importantmethod to assess the overall performance of traditional timbertrusses, and was able to point out the localised behaviour ofjoints. The experimental programme yielded information anddata that would be difficult to assess using a differentapproach. The reasons why such tests are not particularlycommon are related to the scale of the experimental campaign,in terms of the equipment and human resources that arerequired.
The test conducted demonstrated that, after minor interven-tions aiming to recover the original joint mechanisms’ behav-iour, the overall original behaviour of timber trusses can berestored. The response is linear elastic with the non-linear be-haviour concentrated at the joints. In fact, the joints are thekey elements in the overall behaviour of the truss. The trussthat was tested presented localised damage at the joint betweenthe rafters and the tie beam, which conditioned the failuremode of the system. Those joints are critical for the overall be-haviour of this kind of timber truss and, at same time, they arethe ones more susceptible to degradation. Therefore, assess-ment of the wood material, pointing out local defects ordamage, is crucial for an accurate interpretation and analysisof the global behaviour of existing timber trusses. The trussfailed due to local damage detected previously, during visualinspection of the truss.
A simple numerical model was implemented to reproduce thetest carried out. This again proved that the diagnosis phasewas crucial to define the effective cross-sections of the trussmembers. The non-symmetrical response observed during theload-carrying test was simulated only when the correct effec-tive cross-sections of the truss elements, taking into accountthe degradation depth measured by the NDTs performed, wasconsidered in the beam elements of the model. Then, as theloading procedure is symmetric, it is the joint axial stiffnessthat plays a crucial role in the response of the numericalmodel. The following simulations demonstrated that reducingthe joint axial stiffness, in order to take into account the exist-ence of gaps and local degradation of joints, significantlyincreases the accuracy of the numerical model. The trial-and-error process followed during modelling emphasises the needfor defining a scientific procedure for the reduction of jointaxial stiffness.
Another source of discrepancy in the numerical results can beattributed to the material properties assumed for the wood.However, in practice, designers adopt the material propertiesvalues contained in the literature without considering thepossibility of carrying out a structural assessment based on
reliability methods, as desired. Therefore, the authors chose toretain the material properties assumed in the numericalmodels.
As a final conclusion, it is suggested that a methodologyshould be developed to define how the gaps and initialdamage and/or decay observed at the joints during the prelimi-nary visual inspection can be taken into account in the jointaxial stiffness reduction. There is detailed information availableon the definition of the effective cross-section of timberelements, their material properties and the expression of thejoint axial stiffness, but no information exists on how this stiff-ness is influenced by gaps and degradation. Full-scale tests, asthe one presented here, represent the best methodology toassess how the damage observed on the joints reflects itself inthe overall behaviour of existing timber trusses. Therefore, suchtests should be performed at every opportunity.
AcknowledgementsThe authors would like to acknowledge the cooperation ofAdico in allowing the rescue of the timber truss during restor-ation works at their facilities.
REFERENCES
Arêde A, Noites L and Costa A (2004) Sistemas deMonitorização de Ensaios de Estruturas de EngenhariaCivil em Laboratório. NI Days, LNEC, Lisbon, Portugal(in Portuguese).
Bertolini-Cestari C, Invernizzi S, Marzi T and Rolla S (2013)Preservation of the large timber roof of the Porta Nuovarailway station in Torino. Advanced Materials Research778(9): 951–958.
Branco JM, Cruz PJS, Piazza M and Varum H (2008) Fieldtests of a timber queen-post truss and numericalanalysis. Proceedings of SAHC 2008 – StructuralAnalysis of Historical Constructions, Bath, UK,pp. 507–513.
Branco JM, Piazza M and Cruz PJS (2010) Structural analysis oftwo king-post timber trusses. Nondestructive evaluationand load-carrying tests. Construction and BuildingMaterials 24(3): 371–383.
Branco JM, Piazza M and Cruz PJS (2011) Experimentalevaluation of different strengthening techniques oftraditional timber connections. Engineering Structures33(8): 2259–2270.
Calderoni C, De Matteis G, Giubileo C and Mazzolani FM (2010)Experimental correlations between destructive andnon-destructive tests on ancient timber elements.Engineering Structures 32(2): 442–448.
Candelpergher L and Piazza M (2001) Mechanics of traditionalconnections with metal devices in timber roof structures.Proceedings of the 7th International ConferenceSTREMAH, Bologna, Italy, pp. 415–424.
386
Structures and BuildingsVolume 169 Issue SB5
Load-carrying capacity test of a long-spantimber trussBranco, Varum, Ramisote and Costa
Downloaded by [] on [12/01/17]. Copyright © ICE Publishing, all rights reserved.
CEN (European Committee for Standardization) (1994)EN 350-2: Durability of wood and wood-basedproducts – Natural durability of solid wood – part 2: guideto natural durability and treatability of selected woodspecies of importance in Europe. European Committee forStandardization (CEN), Brussels, Belgium.
Cruz H, Yeomans D, Tsakanika E et al. (2015) Guidelines for theon-site assessment of historic timber structures. InternationalJournal of Architectural Heritage 9(3): 277–289.
Del Senno M and Piazza M (2003) Behaviour and rehabilitationof queen post timber trusses. A case study. Proceedings ofSTREMAH 2003: Structural Studies, Repairs andMaintenance of Heritage Architecture VIII,Halkidiki, Greece.
Descamps T, Léoskool L, Laplume D, Van Parys L and Aira JR
(2014) Sensitivity of timber hyperstatic frames to thestiffness of step and ridge joints. Proceedings of WorldConference on Timber Engineering, Quebec, Canada.
Dietsch P and Kreuzinger H (2011) Guideline on the assessmentof timber structures: summary. Engineering Structures33(11): 2983–2986.
Drdácký M, Wald F and Sokol Z (1999) Sensitivity of historictimber structures to their joint response. Proceedings of40th Anniversary Congress of the IASS, Madrid, Spain.
Ficha M2 (1997) Timber for Structures – Maritime Pinefor Structures. LNEC National Laboratory of CivilEngineering. LNEC, Instituto Português da Qualidade,Portugal (in Portuguese).
Frühwald E (2011) Analysis of structural failures in timberstructures: typical causes for failure and failure modes.Engineering Structures 33(11): 2978–2982.
Kasal B (2011) In Situ Assessment of Structural Timber – Stateof the Art Report of the RILEM Technical Committee215-AST (Kasal B and Tannert T (eds)). Springer, theNetherlands.
Mackerle J (2005) Finite element analyses in woodresearch: a bibliography. Wood Science and Technology39(7): 579–600.
Parisi MA and Piazza M (2000) Mechanics of plainand retrofitted traditional timber connections.Journal of Structural Engineering, ASCE 126(12):1395–1403.
Piazza M, Brentari G and Riggio MP (2004) Strengthening andcontrol methods for old timber trusses: the queen-posttruss of the Trento theatre. Proceedings of SAHC 2004:Structural Analysis of Historical Constructions, Padova,Italy, vol. II, pp. 957–965.
Riggio M, Anthony RW, Augelli F et al. (2013) In situassessment of structural timber using non-destructivetechniques. Materials and Structures 47(5): 749–766.
Rinn F (1992) Chancen und grenzen bei der untersuchung vonkonstruk-tionsholzern mit der bohrwiderstandsmethode.Bauen mit Holz 9: 745–748.
Santos VDR (2009) Evaluation of the Behavior of Large OldTimber Trusses. Master thesis, Department of CivilEngineering, University of Aveiro, Aveiro, Portugal(in Portuguese).
SAP (Structural Analysis Program) (2000) Static and DynamicFinite Element Analysis of Structures. Structural AnalysisProgram, Computers and Structures, Inc., Advanced 9.03,Berkeley, CA, USA.
UNI (Ente Nazionale Italiano di Unificazione) (2003) UNI11035-1: Structural timber – visual strength gradingfor Italian structural timbers: terminology andmeasurement of features. Ente Nazionale Italiano diUnificazione, Milano, Italy.
Uzielli L (2004) Il Manuale del Legno Strutturale, Vol IV –
Interventi Sulle Strutture. Mancosu, Rome, Italy(in Italian).
WHAT DO YOU THINK?
To discuss this paper, please email up to 500 words to theeditor at [email protected]. Your contribution will beforwarded to the author(s) for a reply and, if consideredappropriate by the editorial panel, will be published asdiscussion in a future issue of the journal.
Proceedings journals rely entirely on contributions sent inby civil engineering professionals, academics and stu-dents. Papers should be 2000–5000 words long (briefingpapers should be 1000–2000 words long), with adequateillustrations and references. You can submit your paperonline via www.icevirtuallibrary.com/content/journals,where you will also find detailed author guidelines.
387
Structures and BuildingsVolume 169 Issue SB5
Load-carrying capacity test of a long-spantimber trussBranco, Varum, Ramisote and Costa
Downloaded by [] on [12/01/17]. Copyright © ICE Publishing, all rights reserved.