load and renewable forecast in grid operations and planning: ercot experiences€¦ · ·...
TRANSCRIPT

IEEE T&D 2014
Load and Renewable Forecast in Grid Operations and
Planning
April 15 , 2014
Load and Renewable Forecast in
Grid Operations and Planning:
ERCOT Experiences

2
Table of Contents
– Load and Wind resources in ERCOT
– Mid-term Load Forecast
– Short-term Wind Potential Forecast and ERCOT Large Ramp
Alert System
– Conclusions and Future Work
• Acronyms for this presentation:
– WGR: Wind-powered Generation Resource
– AS: Ancillary Service
– STWPF: Short-term Wind Power Forecast
– COP: Current Operating Plan
– RUC: Reliability Unit Commitment
– ELRAS: ERCOT Large Ramp Alert System
April 15, 2014

3
Annual Energy & Peak Demand (2003-2012)
April 15, 2014

4
Installed Wind Generation in ERCOT
April 15, 2014

5
Wind Resource
April 15, 2014

6
Correlation between Wind and Load
April 15, 2014
0
2000
4000
6000
8000
10000
12000
0
10000
20000
30000
40000
50000
60000
70000
80000
load wind
7
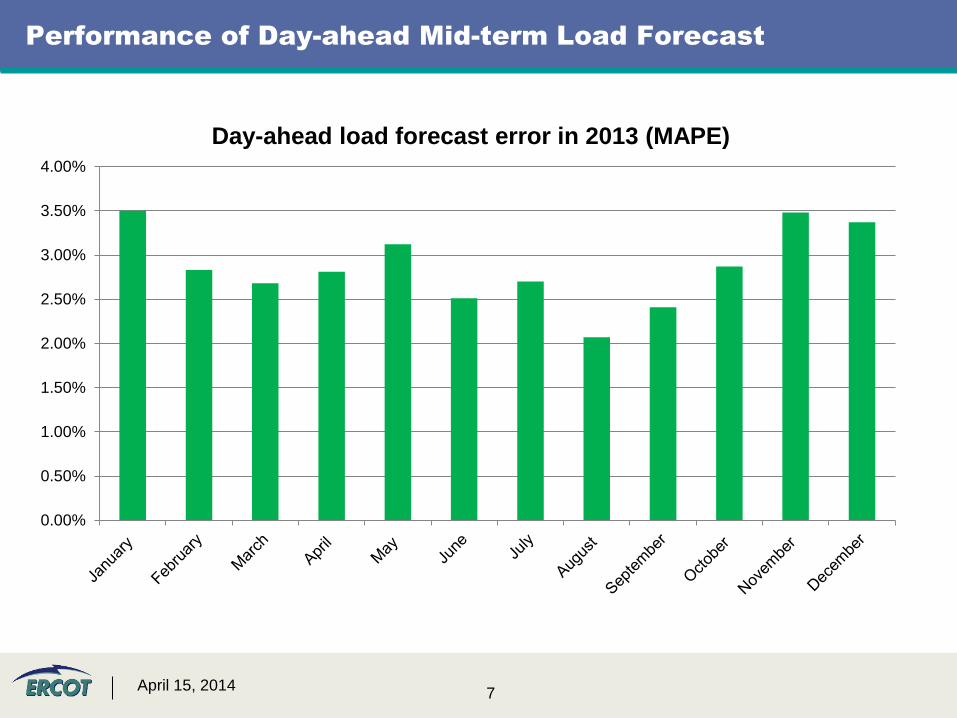
Performance of Day-ahead Mid-term Load Forecast
April 15, 2014
0.00%
0.50%
1.00%
1.50%
2.00%
2.50%
3.00%
3.50%
4.00%
Day-ahead load forecast error in 2013 (MAPE)

8
Importance of Wind Forecast
“the seamless integration of wind plant output forecasting – into both
power market operations and utility control room operations – is a
critical next step in accommodating large penetrations of wind energy in
power systems”
• DOE, 20% Wind Energy by 2030 (Washington, DC: DOE, 2008),
http://www.20percentwind.org/20p.aspx?page=Report.
April 15, 2014

9
Challenges in Wind Forecast
• Relatively concentrated geographic region for wind installation (lack
of spatial diversity)
• Texas weather can change rapidly
• Severe changes in wind generation output caused by different
types of extreme weather (large wind ramps)
• Frontal system, trough, or dry line/Thunderstorms/Low-level jets/Weakening
pressure gradients/Strengthening pressure gradients
• There is an approximation of hypothetical wind speed-power curve
to the real one
Hypothetical
Power Curve Actual Wind Farm
Power
The steep part of the power curve from 4-12 m/s is where power increases strongly
with speed.
April 15, 2014

10
ERCOT Short-term Wind Power Forecast
April 15, 2014
11
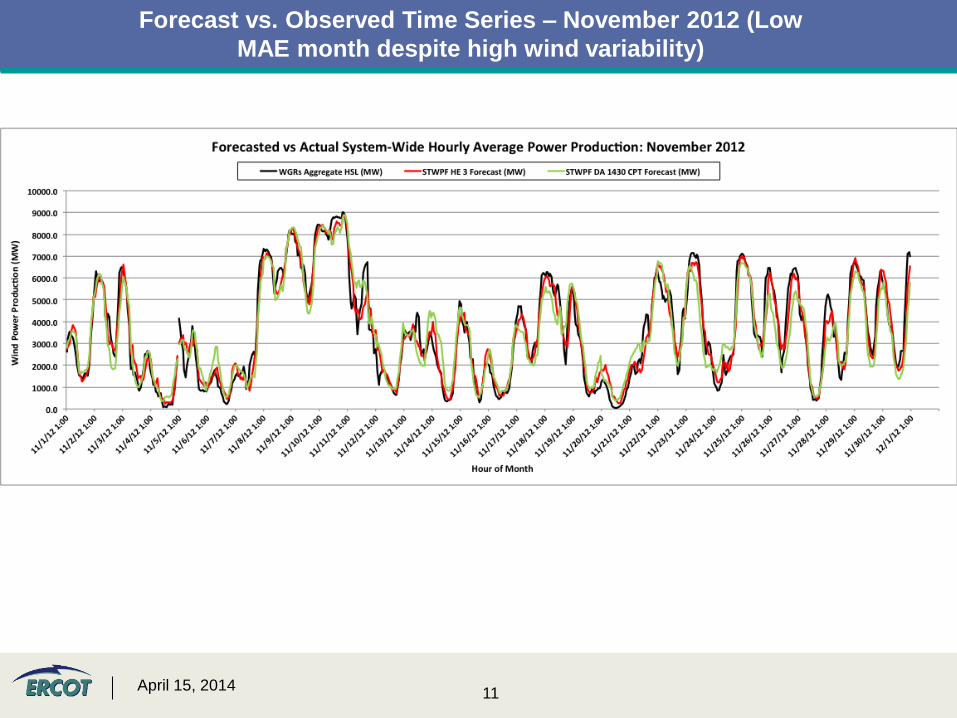
Forecast vs. Observed Time Series – November 2012 (Low
MAE month despite high wind variability)
April 15, 2014

12
Performance of Day-ahead Wind Forecast
0.0%
2.0%
4.0%
6.0%
8.0%
10.0%
12.0%
Jan-13 Feb-13 Mar-13 Apr-13 May-13 Jun-13 Jul-13 Aug-13 Sep-13 Oct-13 Nov-13 Dec-13
Mean Absolute Percent Error (MAPE) of Installed Capacity (day-ahead wind forecast)
2013
Annual
MAPE for
day-ahead
wind
forecast
=8.3%
April 15, 2014

13
Performance of Hour-ahead Wind Forecast
0.0%
1.0%
2.0%
3.0%
4.0%
5.0%
6.0%
7.0%
8.0%
Jan-13 Feb-13 Mar-13 Apr-13 May-13 Jun-13 Jul-13 Aug-13 Sep-13 Oct-13 Nov-13 Dec-13
Mean Absolute Percent Error (MAPE) of Installed Capacity (hour-ahead wind forecast)
2013
Annual
MAPE for
hour-ahead
wind
forecast
=5.3%
April 15, 2014
14
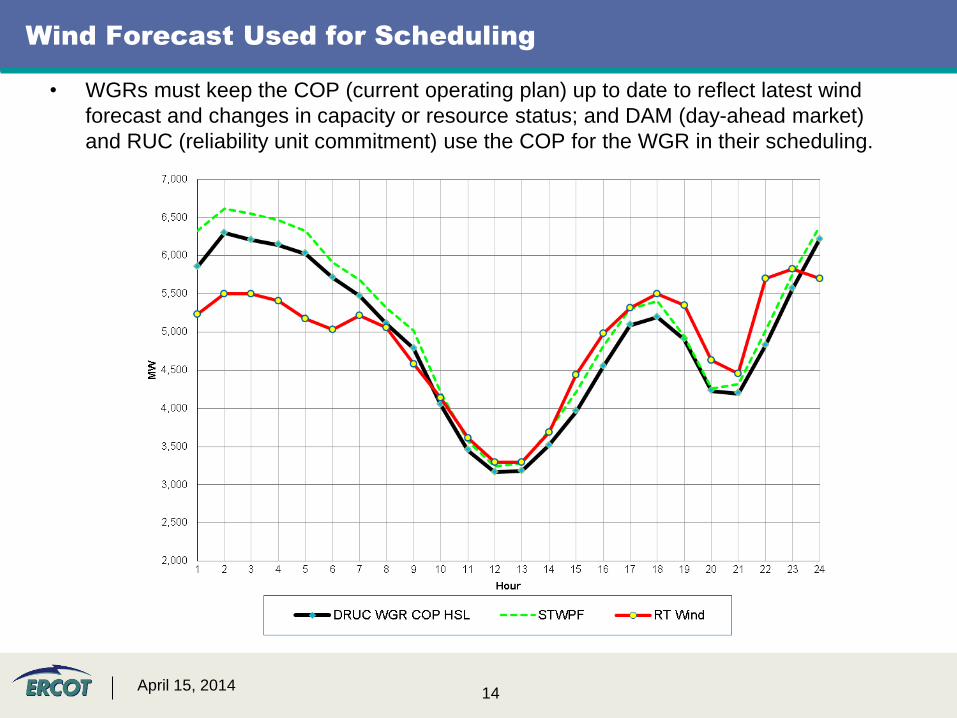
Wind Forecast Used for Scheduling
• WGRs must keep the COP (current operating plan) up to date to reflect latest wind
forecast and changes in capacity or resource status; and DAM (day-ahead market)
and RUC (reliability unit commitment) use the COP for the WGR in their scheduling.
April 15, 2014

15
ERCOT Large Ramp Alert System

16
ERCOT Large Ramp Alert System
• The main focus of ELRAS is to provide the probabilities of Wind
Power ramp events of various MW changes over various time frames
– The far right graph shows that there is a 30% chance of the wind output
changing by 2000 MW or more between 18:00 and 21:00
– Information is provided for both the system and region levels
U
P
April 15, 2014

17
• As the Operators enter the Operating Day, they are able to execute
hourly RUC studies
– The Operators would like to wait as close to real-time as possible to commit a
Resource
• The Operator is also able to begin using the ERCOT Large Ramp Alert
System (ELRAS)
– ELRAS provides probabilistic forecast information for the next 6 hours
– The displays include animated graphics of weather conditions
Market and Operations
April 15, 2014

18
Conclusions and Future Work
• Continue to improve the performance of load forecast by a better
understanding of drivers behind the energy consumption
• With ERCOT’s improved capability to perform Hourly RUC
studies and more easily commit Resources within the Operating
Day, the ISO and Market Participants will likely put more focus on
shorter-term wind power forecasting (1-6 hours out)
– It is generally best to wait closer to real-time in order to have a more
accurate picture of system conditions before committing Resources
• Probabilistic forecast information will very likely play a key role in
Grid Operations in the near future
– There is still work to be done in the incorporation of the probabilistic
forecasts in the control room
April 15, 2014

19
Questions
Pengwei Du
Senior Operation Engineer-Renewable
Integration, Ph.D.
The Electric Reliability Council of Texas
(o) 512-248-6453
(c) 510-366-1875
April 15, 2014