lncs 8691 - blind deblurring using internal patch...
TRANSCRIPT

Blind Deblurring Using Internal Patch Recurrence
Tomer Michaeli and Michal Irani
Dept. of Computer Science and Applied MathematicsWeizmann Institute of Science, Israel
Abstract. Recurrence of small image patches across different scales of a naturalimage has been previously used for solving ill-posed problems (e.g., super-resolution from a single image). In this paper we show how this multi-scale prop-erty can also be used for “blind-deblurring”, namely, removal of an unknown blurfrom a blurry image. While patches repeat ‘as is’ across scales in a sharp naturalimage, this cross-scale recurrence significantly diminishes in blurry images. Weexploit these deviations from ideal patch recurrence as a cue for recovering the un-derlying (unknown) blur kernel. More specifically, we look for the blur kernel k,such that if its effect is “undone” (if the blurry image is deconvolved with k), thepatch similarity across scales of the image will be maximized. We report extensiveexperimental evaluations, which indicate that our approach compares favorably tostate-of-the-art blind deblurring methods, and in particular, is more robust thanthem.
Keywords: Blind deblurring, blind deconvolution, blur kernel estimation, inter-nal patch recurrence, fractal property, statistics of natural images.
1 Introduction
Photos often come out blurry due to camera shake, defocus or low-grade optics. Undo-ing this undesired effect has attracted significant research efforts over the last decade.In cases in which the blur is uniform (same across the entire image), the blurry image yis often modeled as having been obtained from the desired sharp image x as
y = k ∗ x+ n, (1)
where ∗ denotes convolution, k is some blur kernel and n is noise.Since both the blur k and the sharp image x are unknown, and since many differ-
ent pairs of x and k may result in the same blurry image y, blind deblurring heavilyrelies on the availability of prior knowledge on x. Most existing algorithms rely, eitherexplicitly or implicitly, on the fact that images contain enough step edges. This assump-tion is formulated in various ways. Some studies assume simple parametric probabilitymodels, which promote sparsity of image gradients [5,17,12,13,10]. Others assume aparametric form for the spectrum of the image [8], which decays polynomially withfrequency (corresponding to the Fourier transform of step edges). Finally, many ap-proaches employ heuristic methods for detecting and/or enhancing edges in the blurryimage. These range from setting a threshold on the image gradients [9] to shock andbilateral filtering [1,19,2].
D. Fleet et al. (Eds.): ECCV 2014, Part III, LNCS 8691, pp. 783–798, 2014.c© Springer International Publishing Switzerland 2014

784 T. Michaeli and M. Irani
Gradient priors model interactions between pairs of pixels. In recent years, the ad-vantage of using priors over larger neighborhoods (patches) has been recognized. Patchpriors model more complex structures and dependencies in larger neighborhoods. Suchpriors have led to state-of-the-art results in various inverse problems [16] including non-blind deblurring [3,22,4] (namely, deblurring with a known blur kernel). Recently, Sunet al. [18] used a patch prior learned from an external collection of sharp natural imagesfor blind deblurring (unknown blur kernel). This resulted in a significant improvementin performance over all the previous blind deblurring methods [13,10,1,19,2].
In this paper, we present an approach for blind-deblurring, which is based on theinternal patch recurrence property within a single natural image. It was empiricallyshown by [7,20] that almost any small image patch in a natural image (5× 5 or 7 × 7)re-appears “as is” (without shrinking the patch) in smaller scaled-down versions ofthe image (Fig. 1(a)). This observation was successfully used for various non-blindinverse problems (where the degradation process is known), including single-imagesuper-resolution [7,6] and image-denoising [21].
The cross-scale recurrence property was also recently used in [14] for blind Super-Resolution (SR). While, superficially, blind-deblurring can be thought of as a specialcase of blind-SR with a magnification factor α = 1, there is a conceptual differencebetween the two. The goal in blind-SR [14] is to recover an α-times larger image,whose blur is α-times narrower than in the input image (thus imitating an optical zoom-in). Consequently, as opposed to blind-deblurring, the optimal SR blur kernel kSR isnot the point spread function (PSF) of the camera. Rather, as shown in [14], it is givenin the Fourier domain by the following PSF ratio: KSR(ω) = PSF(ω)/PSF(ω/α),where α is the SR magnification factor. Thus, for a magnification factor α = 1, theoptimal SR blur kernel of [14] reduces to KSR(ω) ≡ 1, namely, a delta function inthe spatial domain. This is regardless of the blur in the input image. Therefore, theblind-SR algorithm of [14] cannot be used for blind deblurring. Put differently, in blind-deblurring we seek to recover the PSF, and not the ratio between two PSFs as in blind-SR. Nevertheless, we show that the cross-scale patch recurrence property can still serveas a strong prior for blind-deblurring, but requires a different strategy.
Our approach is conceptually simple. While patches repeat across scales in a sharpnatural image (Fig. 1(a)), this cross-scale recurrence significantly diminishes in blurryimages (Fig. 1(b)). We exploit these deviations from ideal patch recurrence as a cuefor recovering the underlying (unknown) blur kernel. This is done by seeking a blurkernel k, such that if its effect is undone (if y is deconvolved by k), the patch similarityacross scales will be maximized. Moreover, while the blur is strong in the originalscale, the blur decreases at coarser scales of the image. Thus, sharper image patches“naturally emerge” in coarser scales of the blurry image (e.g., Fig. 1(b)). The patchesin coarser image scales can thus serve as a good patch prior (sharper examples) fordeblurring the input scale. This allows recovery of the unknown blur kernel. We showthat blind deblurring based on the internal patch recurrence prior compares favorablyto all previous blind-deblurring approaches. We further show that this is a very stableprior, in the sense that it rarely diverges on any input image (unlike other priors).
The rest of this paper is organized as follows. Section 2 provides an overview of ourapproach and explains the intuition underlying the optimization process. Section 3 is

Blind Deblurring Using Internal Patch Recurrence 785
Fig. 1. The cross-scale patch recurrence is strong in sharp images and weak in blurry images.(a) Small patches (e.g., 5 × 5, 7 × 7) tend to recur across scales in an “ideal” (sharp) naturalimage x. Namely, if we down-scale x by a factor of α, then for most patches in x, there existalmost identical patches in the down-scaled image xα. (b) In contrast, in a blurry image y = x∗k,this is no longer true. The similarity between patches in y and in its down-scaled version yα issignificantly reduced. Patches in the down-scaled version yα tend to be α-times sharper than theircorresponding patches in y. Thus, down-scaling generates a pool of sharper patches, which canbe used as a prior for removing the blur in y.
devoted to an in-depth explanation of our algorithm. Finally, in Section 4, we demon-strate and compare the performance of our algorithm to other state-of-the art methods.
2 Overview of the Approach
We start with a high-level overview of our approach, focusing on the intuition behindthe proposed method. We defer the detailed definitions and derivations to Section 3.
While patches repeat across scales in a sharp natural image under ideal downscal-ing (Fig. 1(a)), this cross-scale recurrence significantly diminishes in blurry images(Fig. 1(b)). We thus seek a blur kernel k, such that if its effect is undone (if y is decon-volved by k), the patch similarity across scales will be maximized. More specifically,we look for an image x and a blur kernel k such that on the one hand, x satisfies thepatch recurrence property (namely, strong similarity between patches across scales ofx), and, on the other hand, k ∗ x is close to the blurry image y. This is done by solvingthe optimization problem
argminx,k
‖y − k ∗ x‖2︸ ︷︷ ︸
data term
+λ1 ρ(x, xα)
︸ ︷︷ ︸
image prior
+λ2 ‖k‖2︸︷︷︸
kernelprior
, (2)
where xα is an α-times smaller version of x. The second term ρ(x, xα) measures thedegree of dissimilarity between patches in x and their Nearest Neighbor patches (NNs)in xα. The third term is a regularizer on the kernel k.

786 T. Michaeli and M. Irani
Note that as opposed to blind-SR [14], where the optimal SR kernel is the one whichmaximizes patch similarity across scales of the input image, here we seek a differentkernel – the kernel k that (when undone) maximizes patch similarity across scales ofthe unknown output image.
Our optimization problem (2) may be interpreted as a joint MAP estimation of xand k (coined MAPx,k in [12]), which was shown by [12] to lead to wrong (trivial)results. However, as opposed to the simple prior used in [12], under which the MAPx,k
strategy indeed favors blurry reconstructions, our prior ρ(x, xα) avoids such solutions.This is because small patches in a sharp x, have similar patches (NNs) in its down-scaled version xα (see Fig. 1(a)). Therefore, for a sharp x, the penalty ρ(x, xα) is small.On the other hand, patches in a blurry x, are less similar to patches in its down-scaledxα (Fig. 1(b)). Therefore, for a blurry image x, the penalty ρ(x, xα) is large.
The objective (2) is not convex (see the definition of ρ(x, xα) in Sec. 3.2), and has noclosed-form solution. We solve it using an alternating iterative minimization procedurecomprising of three steps in each iteration, as described in Algorithm 1 below. Theiterative process is initialized with the blur kernel k being a delta function, and x isinitially the blurry input image y.
Input: Blurry image yOutput: Blur kernel kInitialize k = δ and x = y;for t = 1, . . . , T do
1. Image Prior Update: Down-scale image x by a factor of α to obtain xα (Sec. 3.1).2. Deblurring: Minimize (2) w.r.t x, holding k and xα fixed (Sec. 3.2).3. Kernel Update: Minimize (2) w.r.t k, holding x and xα fixed (Sec. 3.3).
end
Algorithm 1. Kernel estimation
At first sight, our iterative approach may seem similar to other methods, such as[1,19,18], which iterate between an x-step (updating x with k fixed) and a k-step (updat-ing k with x fixed). However, close inspection reveals that our x-step is fundamentallydifferent. Rather than using a fixed generic prior on natural images, we use an evolvingimage-specific prior based on patches extracted from the down-scaled (sharper) versionof the previous image extimate x. Since our estimate x gets sharper from iteration toiteration, the prior also changes from iteration to iteration.
Step 1: The purpose of Step 1 of the algorithm is to produce an image xα, which servesas a pool of sharper patches. Intuitively, if we shrink a blurry image x by a factor of α,then the result xα contains α-times less the amount of blur. For example, if we scale-down x by a factor of α = 2, then an edge smeared over 10 pixels in x would appearsmeared over only 5 pixels in xα. However, the image xα is also α-times smaller. InSection 3.1 we prove that, despite the fact that xα is smaller, the pool of small patches(e.g., 5×5) extracted from xα is roughly the same as the pool of small patches extractedfrom the larger image x, only α-times sharper. This is due to the recurrence of smallpatterns at various sizes in the continuous scene (see Section 3.1).

Blind Deblurring Using Internal Patch Recurrence 787
Fig. 2. Enforcing the cross-scale patch prior in each iteration. (a) A small pattern recurs in thecontinuous scene at multiple sizes (blur stars). (b) At the �-th iteration, the image estimate x�
corresponds to the convolution of the scene with the kernel estimate k�. Thus the two patterns inthe scene appear as two blurry patches q and r in the image x�. (c) In the down-scaled versionxα� , the child patch of r contains the same structure as the patch q in x�, only α-times sharper.
(d) We construct a sharper image x�+1 such that each of its patches is constrained to be similarto its sharper version in xα
� (e.g., the new version of q in x�+1 should be similar to the sharperpatch rα in xα
� ).
Step 2: Step 1 resulted in an image xα, which provides a pool of patches that areα-times sharper than those in the image estimate x. These patches are used in Step 2 asexamples for how patches in x should look like if we were to sharpen them by a factorof α. To construct a new α-times sharper x, we minimize (2) with respect to x whileholding k and xα fixed. Disregarding the last term in (2), which does not depend on x,this amounts to solving
argminx
‖y − k ∗ x‖2 + λ1ρ(x, xα). (3)
This is in fact the deblurring of y by the current kernel estimate k, where the prior isrepresented by the patches in xα. In practice, this step tries to assemble a new sharper xfrom the sharper patches in xα, as shown in Fig. 2(d). For example, in the first iteration(in which k = δ), this process results in an image x, which is close to y, but at the sametime its patches are similar to the α-times sharper patches in xα. Therefore, intuitively,the image x1 recovered in the first iteration contains α-times less the amount of blurthan y. At the second iteration, the image x2 is α-times sharper than x1, and thus α2-times sharper than y. The image x� at the �-th iteration is α� times sharper than y, andintuitively tends to x for large �.
Step 3: Finally, we update the kernel estimate k, by computing the blur between thecurrent deblurred estimate x and the input image y. Thus, in the �-th iteration, we re-cover the kernel k� such that y = k� ∗ x�. Since for large enough �, x� converges to x,the kernel estimate k� converges to k. This is the final output of our algorithm.

788 T. Michaeli and M. Irani
To speed up the convergence, as well as to avoid getting stuck in a local minimum,the above process is performed coarse-to-fine in a pyramid data structure.
3 Detailed Description of the Algorithm
We now explain in detail each step of Alg. 1.
3.1 Step 1: Generating Sharper Patches by Down-Scaling by a Factor α
The purpose of Step 1 of Alg. 1 is to produce from the current image estimate, x, a poolof patches that are less blurry. We now formally explain why shrinking a blurry image yby a factor of α, generates an α-times smaller image yα, which contains approximatelythe same pool of patches as in (the larger) image y, only α-times sharper.
Glasner et al. [7] showed that most patches in a sharp natural image, recur mul-tiple times in its scaled-down version1. As further noted in [14], the source of thispatch recurrence is the repetitions of small patterns at various sizes in the continuousscene. Consider a small pattern f(ξ) in the continuous scene which recurs elsewhere asf(ξ/α), i.e., α times larger (represented by blue stars in Fig 2(a)). Ignoring samplingissues for the moment, these two patterns are convolved with the blur of the camerak(ξ), and appear in the observed image as the patches q and r (Fig. 2(b)):
q(ξ) = k(ξ) ∗ f(ξ), r(ξ) = k(ξ) ∗ f(
ξ
α
)
. (4)
Now, if we shrink the blurry image by a factor of α, then the patch r becomes
rα(ξ) = r(αξ) = α · k(αξ) ∗ f(ξ). (5)
In other words, rα(ξ) corresponds to the same continuous structure, f(ξ), but convolvedwith the α-times narrower kernel α · k(αξ), rather than with k(ξ). This implies that thepatch rα in the smaller image is exactly an α-times sharper version of the patch q in theoriginal blurry image, as visualized in Fig 2(c).
The above shows that shrinking an image by a factor of α produces a pool of patchesof the same size that are α-times sharper. In Step 2 of the algorithm we use this pool ofsharper patches as a nonparametric prior for the purpose of sharpening the blurry imageby a factor of α (see Sec. 3.2). Thus, at the first iteration of the algorithm, we recover animage of the scene blurred with the narrower kernel α · k(αξ). In the second iteration,we further reduce the blur to α2 ·k(α2ξ), and so on. As visualized in Fig. 3(a) by the redsolid curves, the residual blur in the sequence of recovered images becomes narrowerand narrower and eventually converges to lim�→∞ α� · k(α�ξ) = δ(ξ).
However, the analysis so far assumed continuous signals, whereas in practice wework with discrete images. Had the image x� recovered in the �-th iteration corre-sponded to point-wise samples of α� · k(α�ξ) ∗ f(ξ), we would eventually tend to
1 For example, according to [7], approximately 90% of the 5 × 5 patches in a sharp naturalimage, recur “as is” 10 or more times in the image scaled-down to 3/4 of the size (α = 4/3).
Blind Deblurring Using Internal Patch Recurrence 789
0
0.5
1
−5 0 5−1
0
1
2
0
0.5
1
−5 0 5−1
0
1
2
0
0.5
1
−5 0 5−1
0
1
2
0
0.5
1
−5 0 5−1
0
1
2
−π 0 π −π 0 π −π 0 π −π 0 π
K(ω) K(ω/α) K(ω/α2) K(ω/α3)
k(ξ) α k(αξ) α2 k(α2ξ) α3 k(α3ξ)(a) Spatial Domain:
(b) Frequency Domain:
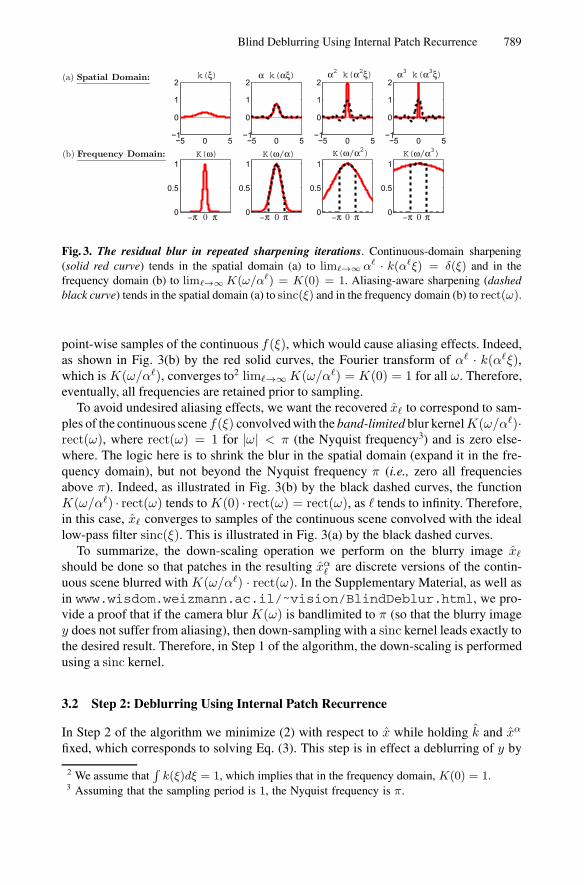
Fig. 3. The residual blur in repeated sharpening iterations. Continuous-domain sharpening(solid red curve) tends in the spatial domain (a) to lim�→∞ α� · k(α�ξ) = δ(ξ) and in thefrequency domain (b) to lim�→∞ K(ω/α�) = K(0) = 1. Aliasing-aware sharpening (dashedblack curve) tends in the spatial domain (a) to sinc(ξ) and in the frequency domain (b) to rect(ω).
point-wise samples of the continuous f(ξ), which would cause aliasing effects. Indeed,as shown in Fig. 3(b) by the red solid curves, the Fourier transform of α� · k(α�ξ),which is K(ω/α�), converges to2 lim�→∞ K(ω/α�) = K(0) = 1 for all ω. Therefore,eventually, all frequencies are retained prior to sampling.
To avoid undesired aliasing effects, we want the recovered x� to correspond to sam-ples of the continuous scene f(ξ) convolved with the band-limited blur kernelK(ω/α�)·rect(ω), where rect(ω) = 1 for |ω| < π (the Nyquist frequency3) and is zero else-where. The logic here is to shrink the blur in the spatial domain (expand it in the fre-quency domain), but not beyond the Nyquist frequency π (i.e., zero all frequenciesabove π). Indeed, as illustrated in Fig. 3(b) by the black dashed curves, the functionK(ω/α�) · rect(ω) tends to K(0) · rect(ω) = rect(ω), as � tends to infinity. Therefore,in this case, x� converges to samples of the continuous scene convolved with the ideallow-pass filter sinc(ξ). This is illustrated in Fig. 3(a) by the black dashed curves.
To summarize, the down-scaling operation we perform on the blurry image x�
should be done so that patches in the resulting xα� are discrete versions of the contin-
uous scene blurred with K(ω/α�) · rect(ω). In the Supplementary Material, as well asin www.wisdom.weizmann.ac.il/˜vision/BlindDeblur.html, we pro-vide a proof that if the camera blur K(ω) is bandlimited to π (so that the blurry imagey does not suffer from aliasing), then down-sampling with a sinc kernel leads exactly tothe desired result. Therefore, in Step 1 of the algorithm, the down-scaling is performedusing a sinc kernel.
3.2 Step 2: Deblurring Using Internal Patch Recurrence
In Step 2 of the algorithm we minimize (2) with respect to x while holding k and xα
fixed, which corresponds to solving Eq. (3). This step is in effect a deblurring of y by
2 We assume that∫k(ξ)dξ = 1, which implies that in the frequency domain, K(0) = 1.
3 Assuming that the sampling period is 1, the Nyquist frequency is π.

790 T. Michaeli and M. Irani
the current kernel estimate, k. Note that k may still be far from the correct k, so thatthe deblurred x we seek to construct is not yet a sharp image. This is in contrast tostandard non-blind deblurring methods, which rely on priors for sharp natural imagesand seek to recover a sharp deconvolved image. Our deconvolved image x, which isstill partially blurry is obtained in (3) by using patches from the smaller image xα as aprior. These patches contain “just the right” amount of residual blur, and therefore serveas a good nonparametric prior for the current deblurring step.
Our approach for solving the “partial” deblurring problem (3) is very similar to thenon-blind deblurring method of Zoran and Weiss [22]. However, instead of using theirnatural image prior (which was learned from an external database of sharp patches), ourprior is learned from the patches in xα. Problem (3) can be written in vector form as
argminx
‖y − Kx‖2 + λ1ρ(x, xα), (6)
where K is a matrix that corresponds to convolution with k. We start by giving a formaldefinition of the function ρ(x, xα). As in [22], we define ρ(x, xα) as minus the expectedlog likelihood (EPLL) of patches in x. Namely, ρ(x, xα) = −∑j log p(Qj x), whereQj is a matrix that extracts the j-th patch from x. However, as opposed to [22], herewe learn the probability p(Qj x) from the patches in xα. Specifically, letting Ri de-note the matrix which extracts the i-th patch from xα, we approximate p(Qj x) usingnonparametric density kernel estimation as
p(Qj x) = c∑
i
exp
{
− 1
2h2‖Qj x−Rix
α‖2}
, (7)
where h is a bandwidth parameter and c is a constant independent of x. This results inthe prior term
ρ(x, xα) = −∑
j
log
(
∑
i
exp
{
− 1
2h2‖Qj x−Rix
α‖2})
. (8)
Having defined ρ(x, xα), we now proceed to derive an algorithm for minimizingthe objective (6). In Appendix B, we show that substituting (8) into (6) and setting thegradient to zero, leads to the requirement that
(
KTK + βI
)
x = KTy + βz. (9)
Here, I is the identity matrix and β = λ1M2/h2, where M is the patch size. z is
an image constructed by replacing each patch in x by a weighted average of its near-est neighbor (NN) patches in xα (for full expressions see Appendix B). Equation (9)cannot be solved in closed form since z depends nonlinearly on x. Instead, we alternatea few times between solving for x (using (9)) and for z (using (14)–(16) in Appendix B).
What this process boils down to is the following: In the first phase, we replace eachpatch in the current image x by a weighted average of its NNs (using L2 distance) from

Blind Deblurring Using Internal Patch Recurrence 791
the (sharper) image xα (see Fig. 2(d)). This phase actually enforces our prior, which isthat patches in the recovered image should be similar to patches in xα. The resultingimage z, however, does not necessarily conform to the data fidelity term, which requiresthat when the reconstruction is blurred with k, it should be similar to y. Thus, in thesecond phase, we plug z back into (9) and update x. We then repeat the NN search forthe patches in the updated x, generate an updated z, etc. Alternating these phases a fewtimes, leads to an image x which satisfies both requirements. Namely, the patches of xare similar to those in xα, and its blurry version x ∗ k resembles y.
3.3 Step 3: Kernel Update
Step 3 in Alg. 1 corresponds to updating the kernel k, given the current estimate of theimage x. Disregarding the second term in (2), which does not depend on k, and requiringthat the kernel entries be nonnegative, our optimization problem can be written in vectorform as
argmink≥0
‖y − Xk‖2 + λ2‖k‖2, (10)
where X is a matrix that corresponds to convolution with our current image estimate x.As explained above, the residual blur in the �-th iteration, is intuitively K(ω/α�)
in the Fourier domain. Consequently, the kernel recovered in the �-th iteration, shouldapproximately correspond to K(ω)/K(ω/α�). For large �, we have that K(ω/α�) ≈ 1and the recovered kernel becomes close to the correct K(ω). However, for small �, thekernel K(ω)/K(ω/α�) may still be very different from K(ω) and, in particular, it canhave negative values in the spatial domain. Consequently, we impose the nonnegativityconstraint in (10) only during the last few iterations of Algorithm 1.
3.4 Implementation Details
To speed up the convergence of the algorithm we work in a coarse-to-fine manner. Thatis, we apply Alg. 1 on each of the levels of an image pyramid constructed from theblurry input image y. The recovered x and k at each pyramid level are interpolated toconstitute an initial guess for the next pyramid level. The pyramid is constructed withscale-gaps of α = 4/3 using down-scaling with a sinc. The number of pyramid levelsis chosen such that, at the coarsest level, the blur is smaller than the size of the patchesused in the deblurring stage (5 × 5 patches in our implementation). Additional speedup is obtained by using the fast approximate NN search of [15] in the deblurring step,working with a single NN per patch.
For computational efficiency, we solve the large linear system of equations (9) in the
Fourier domain. Specifically, it is easy to verify that the matrix KT
appearing in (9)corresponds to convolution with a mirrored version of k, which is equivalent to multi-plication by K∗(ω) in the frequency domain. It thus follows that solving for x whilefixing z can be implemented as
X(ω) =K∗(ω)Y (ω) + βZ(ω)
|K(ω)|2 + β. (11)

792 T. Michaeli and M. Irani
15.6 7.0 11.5 3.5 Blurry Input Ours Sun et al. Xu&Jia Levin et al.
4.3 6.5 17.0 20.3
10.5 10.3 9.7 1.9
Fig. 4. Example deblurring results. The left column shows the blurry input image and the ground-truth blur kernel. The other columns show the deblurring results obtained with the kernels esti-mated by each of the tested methods. The recovered kernel is shown at the top-right corner of eachrecovered image. The number on each image is its error ratio r. Please zoom-in on screen to seethe differences (see www.wisdom.weizmann.ac.il/˜vision/BlindDeblur.htmlfor full sized images and more results).
We use FFTs with proper padding to avoid undesired border effects. This formulationis about 50 times faster than e.g., using conjugate gradients to solve this least-squaresproblem, as done in [22].
In our current implementation we apply 8 iterations of Alg. 1 per pyramid level. Weenforce the nonnegativity constraint in (10) starting from the 5th iteration. For gray-values in the range [0, 255], we use β = 0.4 in the deblurring step (9) and λ2 = 7.52 inthe kernel update step (10).
4 Experiments
We tested our algorithm on the large database introduced by Sun et al. [18]. Thisdatabase comprises 640 large natural images of diverse scenes (typically 1024× 768),which were obtained by synthetically blurring 80 high-quality images with the 8 blurkernels from [12] and adding 1% white Gaussian noise. The kernels range in sizefrom 13 × 13 to 27 × 27. We present qualitative and quantitative comparisons to theblind deblurring algorithms of [1,19,13,2,10,18]. Specifically, we follow the protocolof [18], which used the kernel recovered by each method4 to perform deblurring with the
4 For [18], we report results with the “natural” patch prior, which performs slightly better thantheir “synthetic” patch prior. For all other algorithms, we used the results posted by [18] (seetheir paper for additional details).

Blind Deblurring Using Internal Patch Recurrence 793
0 5 10 15 20 250
0.2
0.4
0.6
0.8
1
Error Ratio
PortionofIm
ages
OurSun et al.Xu & JiaLevin et al.Cho & LeeKrishnan et al.Cho et al.Blurry input
r =9.2max r =23.2max
Fig. 5. Cumulative distribution of error ratios
state-of-the-art non-blind deblurring method of [22]. Since the blur kernel can only berecovered up to a global translation, we align the deblurred image with the ground-truthimage in order to compute the error. Following the setting of Sun et al. [18], we do notassume that the size of the kernel is known and thus always recover a 51× 51 kernel.5
We measure the quality of a recovered blur kernel k, using the error ratio measure(proposed in [12] and commonly used by others):
r =‖x− x
k‖2‖x− xk‖2 , (12)
where xk corresponds to deblurring with the recovered kernel k, and xk corresponds to
deblurring with the ground-truth kernel k. The smaller r is, the better the reconstruction.In principle, if r = 1, we achieve “ground-truth performance” (i.e., performance ofnonblind deblurring with the ground-truth kernel). However, we empirically observethat the deblurring results are still visually pleasing for error-ratios r ≤ 5, when usingthe non-blind deblurring of [22] (see Appendix A for a more detailed explanation).
Fig. 4 shows a few visual examples of the kernel estimates, the deblurring results, andtheir corresponding error ratios r, obtained by us and by the best competing methods[13,19,18] on several images from the database of [18] (all deblurred using the methodof [22]). Complex textures with strong edges, such as the sea in the second row, arebetter represented by the internal image-specific patch prior, than by any of the othermore generic priors (please zoom-in on screen to see fine image details). For example,it seems that the sea regions do not conform to the assumption of sparsity of imagegradients of Levin et al.[13], and that patches within them do not find good NNs in theexternal patch prior of Sun et al.[18]. The sea region, therefore, distracts most blinddeblurring methods, and leads to inaccurate kernel estimates. In contrast, the sea isself-similar within the image, at least across small scale-gaps. Therefore, the internalpatch recurrence prior used by our method manages to produce more accurate kernelestimates in such difficult cases.
5 When we provide our algorithm the correct kernel size, our results significantly improve.

794 T. Michaeli and M. Irani
Table 1. Quantitative comparison of all methods over the entire database (640 blurry images)
Average performance Worst-case performance Success rate(mean error ratio) (highest error-ratio) (percent of images
with error ratio < 5)Our 2.6 9.2 95.9%
Sun et al.[18] 2.4 23.2 93.4%Xu & Jia [19] 3.6 65.7 86.1%
Levin et al.[13] 6.6 41.2 46.7%Cho & Lee [1] 8.7 112.6 65.6%
Krishnan et al.[10] 11.6 133.7 25.1%Cho et al.[2] 28.1 165.6 11.9%
The graph in Fig. 5 shows the cumulative distribution of error-ratios over the entiredatabase. The statistics indicate that our algorithm and the algorithm of Sun et al.[18],which are the only patch-based methods, outperform all other approaches by a largegap. The method of [18] is slightly more accurate than ours at very low error ratios.Nevertheless, empirical inspection shows that the visual differences between resultswith error-ratios smaller than 3 (when using the deblurring of [22]) are often indistin-guishable. As can be seen, our method is more robust than all competing approaches, inthe sense that it rarely fails to recover the kernel with reasonable accuracy (low rmax).In fact, as we show in Fig. 6, even our worst result over the entire database (namely, therecovered image with the highest error-ratio, rmax = 9.2), is still slightly better than theinput blurry image, both visually and in terms of error. In contrast, the worst results ofthe other methods obtain high errors and are significantly worse than the blurry inputs.
Table 1 further compares the performance of the various blind deblurring methodsusing three quantitative measures: (i) the average performance, (ii) the worst-case per-formance, and (iii) the success rate. The average performance corresponds to the meanof the error-ratios attained for all images in the database6. As can be seen, our averageerror-ratio is close to that of Sun et al.[18] and lower than the rest of the competingmethods. Interestingly, only three methods attain an average error-ratio smaller than 5(which can be considered as a threshold for good deblurring; see Appendix A): ourmethod, Sun et al. [18], Xu and Jia [19]. This suggests that the visual quality of theremaining methods [1,13,2,10] is unsatisfactory on average.
The worst-case performance is the highest error-ratio over the entire database. Itmeasures the robustness of the methods. As can be seen in Table 1, our method is morerobust than all competing approaches, in the sense that it rarely fails to recover thekernel with reasonable accuracy.
The success rate is the percent of images which obtained good-quality deblurring(i.e., an error ratio below 5). As can be seen in Table 1, our method attains an error ratiolarger than 5 only 4.1% of the times, which correspond to 26 out of the 640 images inthe database. The worst of these 26 ‘failure cases’ can be seen in Fig. 6.
6 Note that the geometric mean used by Sun et al.[18] is not sensitive to a small number ofsevere failures, which is why we prefer the standard (arithmetic) mean.

Blind Deblurring Using Internal Patch Recurrence 795
23.2
65.7
41.2 C
ho &
Lee
165.6
Kris
hnan
et a
l. 133.7
112.6
Cho
et a
l.
Sun
et a
l.
Xu
& Ji
a Le
vin
et a
l Blurry Input Image Recovered Image Blurry Input Image Recovered Image
Our
e RecooReco
9.2 red ImaaIma
0.9
8.9
9.6
8.7
48.9
66 37.2
d Imageemage30.4
Fig. 6. Worst results. For each algorithm, the result with the highest error-ratio is shown alongwith the recovered kernel and the corresponding error-ratio (number in yellow). The number inblue is the ratio between the error of the deblurred (output) image and the error of the blurry(input) image. Values below and above 1 indicate, respectively, improvement or degradation inquality. As can be seen, our worst-case result is still better than the blurry input image while theworst-case results of the competing methods are significantly worse than their input images. Seewww.wisdom.weizmann.ac.il/˜vision/BlindDeblur.html for full sized images.
5 Summary
In this paper we presented a blind deblurring method, which uses internal patch re-currence as a cue for estimation of the blur kernel. Our key observation is that patchrecurrence across scales is strong in sharp images, but weak in blurry images. We seeka blur kernel k, such that if “undone” (if the blurry image is deconvolved with k), thepatch similarity across scales will be maximized. Extensive empirical evaluations con-firm that the internal patch recurrence property is a strong prior for image deblurring,and exhibits higher robustness than other priors. We attribute this to the fact that eachimage uses its own image-specific patch prior.
Acknowledgments. Thanks to Shahar Kovalski, Yuval Bahat and Maria Zontak. Fundedin part by the Israel Science Foundation, Israel Ministry of Science, Citigroup Foundationand a Viterbi Fellowship (Technion).

796 T. Michaeli and M. Irani
A What Is “Good” Blind Deblurring?
The error-ratio measure r in Eq. (12) depends on the type of non-blind deblurringmethod used. We use the state-of-the-art non-blind deblurring method of [22] (whichwas also the setting used in [18]). We empirically observe that images recovered withan error-ratio smaller than 5 are usually visually pleasing, while error-ratios above 5 areoften associated with distracting artifacts. Levin et al. [13] reported a threshold of 3 be-tween good and bad visual results. However, their error ratios were computed with thenon-blind deblurring of [11]. Using a simulation study (see the Supplementary Materialand www.wisdom.weizmann.ac.il/˜vision/BlindDeblur.html for de-tails), we computed the best linear fit between the two types of error ratios, and foundthat an error ratio of 3 with [11] indeed corresponds to an error-ratio of approximately 5with [22]. Thus, based on our observations and those of Levin et al. [13], we regard 5as a threshold for good-quality deblurring when using the non-blind deblurring of [22].
B Derivation of Equation (9)
Assuming the patches are M ×M , substituting (8) into (6) and setting the gradient tozero, leads to the requirement that
⎛
⎝KTK + β
1
M2
∑
j
QTj Qj
⎞
⎠ x = KTy + βz, (13)
were β = λ1M2/h2 and
z =1
M2
∑
j
QTj zj , (14)
withzj =
∑
i
wi,jRixα (15)
and
wi,j =exp
{− 12h2 ‖Qj x−Rix
α‖2}∑
m exp{− 1
2h2 ‖Qj x−Rmxα‖2} . (16)
It is easy to verify that, up to border effects, multiplying a column-stacked image by∑
j QTj Qj is equivalent to multiplying all pixels of the image by M2, or, in other
words, that∑
j QTj Qj = M2I . Substituting this term into (13) leads to (9).
Note that zj in (15) can be interpreted as an approximation of the patch Qj x, whichuses the patches {Rix
α} from the small image xα as examples. In practice, most ofthe weights wi,j are very small, so that each patch in x is actually approximated by avery small number of its NNs in xα (for efficiency, we often use only a single NN –see Section 3.4). The matrix QT
j takes a patch and places it at location j in an image.Therefore, the image z in (14) can be thought of as an approximation of the image x,where the prior is learned from the patches in xα.
Blind Deblurring Using Internal Patch Recurrence 797
References
1. Cho, S., Lee, S.: Fast motion deblurring. ACM Transactions on Graphics (TOG) 28, 145(2009)
2. Cho, T.S., Paris, S., Horn, B.K., Freeman, W.T.: Blur kernel estimation using the Radontransform. In: IEEE Conference on Computer Vision and Pattern Recognition (CVPR), pp.241–248 (2011)
3. Dabov, K., Foi, A., Katkovnik, V., Egiazarian, K.: Image restoration by sparse 3D transform-domain collaborative filtering. In: SPIE Electronic Imaging, vol. 6812
4. Danielyan, A., Katkovnik, V., Egiazarian, K.: BM3D frames and variational image deblur-ring. IEEE Transactions on Image Processing 21(4), 1715–1728 (2012)
5. Fergus, R., Singh, B., Hertzmann, A., Roweis, S.T., Freeman, W.T.: Removing camera shakefrom a single photograph. ACM Transactions on Graphics (TOG) 25, 787–794 (2006)
6. Freedman, G., Fattal, R.: Image and video upscaling from local self-examples. ACM Trans-actions on Graphics (TOG) 30(2), 12 (2011)
7. Glasner, D., Bagon, S., Irani, M.: Super-resolution from a single image. In: IEEE Interna-tional Conference on Computer Vision (ICCV) (2009)
8. Goldstein, A., Fattal, R.: Blur-kernel estimation from spectral irregularities. In: Fitzgibbon,A., Lazebnik, S., Perona, P., Sato, Y., Schmid, C. (eds.) ECCV 2012, Part V. LNCS, vol. 7576,pp. 622–635. Springer, Heidelberg (2012)
9. Joshi, N., Szeliski, R., Kriegman, D.: PSF estimation using sharp edge prediction. In: IEEEConference on Computer Vision and Pattern Recognition (CVPR), pp. 1–8 (2008)
10. Krishnan, D., Tay, T., Fergus, R.: Blind deconvolution using a normalized sparsity measure.In: IEEE Conference on Computer Vision and Pattern Recognition (CVPR), pp. 233–240(2011)
11. Levin, A., Fergus, R., Durand, F., Freeman, W.T.: Image and depth from a conventionalcamera with a coded aperture. ACM Transactions on Graphics (TOG) 26(3), 70 (2007)
12. Levin, A., Weiss, Y., Durand, F., Freeman, W.T.: Understanding and evaluating blind de-convolution algorithms. In: IEEE Conference on Computer Vision and Pattern Recognition(CVPR), pp. 1964–1971 (2009)
13. Levin, A., Weiss, Y., Durand, F., Freeman, W.T.: Efficient marginal likelihood optimizationin blind deconvolution. In: IEEE Conference on Computer Vision and Pattern Recognition(CVPR), pp. 2657–2664 (2011)
14. Michaeli, T., Irani, M.: Nonparametric blind super-resolution. In: IEEE International Con-ference on Computer Vision (ICCV) (December 2013)
15. Olonetsky, I., Avidan, S.: TreeCANN–K-D tree coherence approximate nearest neighbor al-gorithm. In: Fitzgibbon, A., Lazebnik, S., Perona, P., Sato, Y., Schmid, C. (eds.) ECCV 2012,Part IV. LNCS, vol. 7575, pp. 602–615. Springer, Heidelberg (2012)
16. Roth, S., Black, M.J.: Fields of experts. International Journal of Computer Vision 82(2),205–229 (2009)
17. Shan, Q., Jia, J., Agarwala, A.: High-quality motion deblurring from a single image. ACMTransactions on Graphics (TOG) 27, 73 (2008)
18. Sun, L., Cho, S., Wang, J., Hays, J.: Edge-based blur kernel estimation using patchpriors. In: IEEE International Conference on Computational Photography (ICCP), pp. 1–8(2013)
19. Xu, L., Jia, J.: Two-phase kernel estimation for robust motion deblurring. In: Daniilidis,K., Maragos, P., Paragios, N. (eds.) ECCV 2010, Part I. LNCS, vol. 6311, pp. 157–170.Springer, Heidelberg (2010)

798 T. Michaeli and M. Irani
20. Zontak, M., Irani, M.: Internal statistics of a single natural image. In: IEEE Conference onComputer Vision and Pattern Recognition, CVPR (2011)
21. Zontak, M., Mosseri, I., Irani, M.: Separating signal from noise using patch recurrence acrossscales. In: IEEE Conference on Computer Vision and Pattern Recognition (CVPR), pp.1195–1202 (2013)
22. Zoran, D., Weiss, Y.: From learning models of natural image patches to whole image restora-tion. In: IEEE International Conference on Computer Vision (ICCV), pp. 479–486 (2011)