lncs 4717 - an 'object-use fingerprint': the use of electronic
TRANSCRIPT

An ‘Object-Use Fingerprint’:The Use of Electronic Sensors for Human
Identification
Mark R. Hodges and Martha E. Pollack
Computer Science and EngineeringUniversity of Michigan, Ann Arbor, MI, USA
{hodgesm,pollackm}@umich.edu
Abstract. We describe an experiment in using sensor-based data toidentify individuals as they perform a simple activity of daily living(making coffee). The goal is to determine whether people have regu-lar and recognizable patterns of interaction with objects as they performsuch activities. We describe the use of a machine-learning algorithm toinduce decision-trees that classify interaction patterns according to thesubject who exhibited them; we consider which features of the sensordata have the most effect on classification accuracy; and we considerways of reducing the computational complexity introduced by the mostimportant feature type. Although our experiment is preliminary, the re-sults are encouraging: we are able to do identification with an overallaccuracy rate of 97%, including correctly recognizing each individual inat least 9 of 10 trials.
1 Introduction
A body of recent work has focused on the use of sensors to recognize the per-formance of particular human activities [1,2,3,4,5,6]. This paper describes workthat also uses sensors to monitor human activity, but towards a different end: ourgoal is to identify individuals from their behavior. More specifically, we seek todetermine whether individual people have regular and recognizable patterns ofinteraction with the objects they use in performing daily activities and whetherthese patterns create an “object-use fingerprint” that can be used for humanidentification.
The primary motivation for this work is a scientific one: it is interesting inits own right to know whether people interact in regular ways with objectsand, if so, what these regularities are. However, there are also potential praticalimplications of the work. As one example, imagine wanting to gather informationabout the use of various devices (a new model refridgerator or a newly designedcopy machine, for instance). One way to do this would be to place the device inan open area (an office kitchen or mailroom) and gather data as multiple peopleinteract with the device. If people indeed have “object-use fingerprints,” then itshould be possible to distinguish amongst different users in the collected datawithout having to actually identify who those users are.
J. Krumm et al. (Eds.): UbiComp 2007, LNCS 4717, pp. 289–303, 2007.c© Springer-Verlag Berlin Heidelberg 2007

290 M.R. Hodges and M.E. Pollack
A second motivation for this work comes from our long-term goal of employ-ing sensor-based activity monitoring to track the performance of individuals atrisk for cognitive decline, so as to detect changes that may indicate a change incognitive status. As a preliminary step, we sought to determine the degree towhich people behave in regular and predictable ways while performing commonactivities. Of course, the existence of identifiable patterns of object use by indi-viduals is by itself neither necessary nor sufficient for our larger goal. However,we feel that establishing that individuals have some degree of regularity in theirobject-use patterns makes it more likely that one can observe trends of deviationfrom those regularities, and in turn, learn deviations that may indicate cognitivedecline.
To test our hypothesis–that individuals have “object-use fingerprints,” mak-ing it possible to identify them on the basis of the way in which they interactwith objects during the performance of routine daily activities–we conducteda series of experiments in a controlled laboratory setting. Specifically, we hadindividuals wear an RFID reader affixed to a glove while they made coffee in akitchen in which objects were instrumented with RFID tags. We then appliedmachine-learning techniques to classify interaction patterns. Key research ques-tions included determining the features of the activity that were most predictiveof an individual’s identity, analyzing the computational time required for thelearning algorithm to process each type of feature, and developing strategies forreducing reliance on the most computationally expensive features. This was aninitial investigation with a number of simplifying assumptions that we describein section 3.4. Our results are therefore preliminary but encouraging nonetheless.
The next section briefly reviews prior work on sensor-based activity recog-nition. Section 3 discusses the methodology of our experiment, including theselection of the task, selection of the sensing technology, the experimental setup,and the limitations of the experiment. Section 4 describes the machine-learningtechniques used to analyze the collected data. Section 5 presents the experimen-tal results, which are then discussed in Section 6, which also presents avenuesfor future research.
2 Background
Automated activity recognition encompasses techniques using different types ofsensors that detect activities at a wide range of granularity. One approach isto use a few extremely data-rich sensors such as video cameras or microphones.For example, Ben-Arie, et al. employ video cameras to distinguish among eightbasic actions including jumping, walking, and picking an object up [7]. For manypotential applications, however, data-rich sensors, and especially video cameras,may be problematic, in part because they have been shown to provoke strongprivacy concerns [8].
A contrasting approach is to use a large number of very basic sensors that eachcapture only limited information. Accelerometers and other related sensors thatare worn by individuals may be used to differentiate actions. For instance, Bao

An ‘Object-Use Fingerprint’: The Use of Electronic Sensors 291
and Intille used five biaxial accelerometers, positioned at key places on subjects’bodies, to identify with high accuracy an activity from among twenty typesof activities including vacuuming, reading, and watching TV. Their descriptionof this work also provide a good overview of past work in activity recognitionusing accelerometers [9]. Wren and Tapia use motion detectors and hierarchicallearning to recognize actions in a work environment such as walking in straightline, turning, and “joining” (coming into the same geographic region as anotherperson) [6]. Liao et al. take an different approach and use GPS and RelationalMarkov Networks to recognize the locations of activities such as “home,” “work,”and “shop” [2,10].
The use of RFID readers as a device for recgonizing activities has also becomepopular. What is intersting about this approach is that it focuses on recognizingthe objects with which a person interacts, rather than on monitoring the person’smovements directly. Thus, Philipose and his colleagues have subjects wear aglove or bracelet with an attached RFID reader, which can sense objects inthe environment that have RFID tags affixed to them [3,4,8]. Their sensingtechnology–an RFID reader worn on the hand–served as the inspiration for theRFID glove used in this paper. Tapia et al. also use RFID technology and naiveBayesian classifiers to perform in-home activity recognition [5].
The work just described has all addressed the question of identifying an ac-tivity, not of identifying a person. To the best of our knowledge, there has notbeen work done on identifying individuals based on their object-interaction pat-terns. However, prior work has been done on identification of individuals usingother biometrics. Keystroke dynamics have been studied as a way to provideadditional computer security, with a particular focus on using keystroke dynam-ics to harden password security. Peacock provides a good overview of the workin this area [11]. Vision-based identification techniques have also garnered sig-nificant interest to supplement the physical security of environments such asairports and banks. These efforts have focused mainly on gait recognition, whichuses patterns of movement for identification [12], as well as on automatic facerecognition using a photograph or a series of photographs to identify individuals[13].
3 Methodology
3.1 Selection of Task
Several criteria were used in the selection of a task for subjects to perform. Mostobviously, we sought a task that was an activity of daily living, and was onethat that is performed by many people on a regular basis. In addition, an idealtask would be relatively constrained in terms of the ways in which it might beperformed, but would also have some natural variance in performance (not asbroad as “prepare dinner,” but not so narrow as “pour a glass of milk”). Finally,it should be possible to perform the task in an instrumented laboratory. The taskof making a cup of coffee was chosen for this experiment since it is an excellentfit for all of these criteria.

292 M.R. Hodges and M.E. Pollack
3.2 Selection of Technology
As noted earlier, Radio Frequency Identifier (RFID) technology has been usedsuccessfully in several activity recognition projects and we thus chose to use ithere as well. RFID equipment consists of tags, which can be placed throughoutan environment, and readers which detect nearby tags. A key advantage of thistype of sensing is that RFID has a 0% false positive rate. In addition, tags areinexpensive (less than US$0.20) and small in size (approximately the size of apostage stamp). There are two types of RFID tags, active and passive. Activetags are extremely accurate but require a power source. Passive tags, on theother hand, are not detected as reliably, but do not require a power source,instead harvesting energy from the reader to sense and communicate [14]. Forthis reason, they can be placed throughout an environment without a need forcords or batteries that will need to be replaced.
In earlier work done at Intel laboratories, an RFID reader placed on a gloveor bracelet was used to detect detect tags that are in close proximity to thehand (within 10cm) [15,3,4,8,16]; detected objects are assumed to be ones withwhich the user is interacting. This form factor also has added value with regardsto privacy. If a user wishes to prevent the system from observing her, she maysimply remove the glove or bracelet containing the RFID reader. In addition,the short range of the reader makes it possible to observe fine-grained patternsin the way the object is held, i.e. whether an object is held from the side or fromthe bottom. This information is potentially valuable in identifying people fromthe object interactions. Because Intel’s wireless iBracelet was not available intime for use in this study, a wired system was used, consisting of an off-the-shelfRFID reader and tags created by Phidgets, Inc. R©.
The sensor glove is depicted in Fig. 1 (l), while one of the tagged objects-acoffee grinder-is shown in Fig. 1 (r). Obviously, the glove as used in the exper-iment would not be appropriate for actual use in a home setting–and not onlybecause of the attached wire! Nonetheless, it was satisfactory for collecting thedata we needed for these experiments.
Fig. 1. (l) The glove with an RFID reader attached. (r) The coffee grinder with severalRFID tags attached.

An ‘Object-Use Fingerprint’: The Use of Electronic Sensors 293
3.3 Experimental Setup
Ten subjects were recruited to participate in the experiments. For each trial, thesubject was instructed to make a cup of coffee as if about to drink it, includingadding sugar and creamer as preferred. Subjects wore a glove outfitted withan RFID reader on their right hand, but were told to ignore it as best theycould and use both hands as they typically would. Each subject participatedin ten trials, spaced out with generally at most one per day, so that the trialswould reflect normal patterns of use, rather than artificial patterns created byperforming trials repeatedly one after another1.
Subjects were given a brief tour of the instrumented lab before their first trial,and those who did not know how to make coffee were given basic instructions.These instructions were as general as possible. For example, subjects were toldto “put water in the reservoir at the back of the coffee-maker,” rather thanindicating exactly how the water should be put there, so they would choose forthemselves whether to use the coffee cup or coffee carafe to transport the waterfrom the sink. No physical demonstration of the coffee-making process was given.
The experimental set-up consisted of a coffee maker, one cup, one spoon, acoffee bean grinder, and a cabinet containing a bag of filters, a bag of coffeegrounds, a bag of coffee beans, and a canister each of cream and sugar. Eachitem was tagged with multiple RFID tags and before each trial was put in thesame place, facing the same direction. (The bag of filters did not have an obviousfront and thus may have been reversed between trials).
3.4 Experimental Limitations
This study is an initial investigation and, as such, had a number of design sim-plifications. Possibly most significantly, the task was performed in a controlledsetting–our laboratory–rather than in a naturally occurring environment. Theenvironment was very regular, so that each time a subject began a task, all theobjects he or she might use were in the same location and aligned in the samedirection, without the natural variation that would occur in a real-world setting,especially in an environment shared by several users. The users performed onlya single task–making coffee–and this task was not interleaved with other tasksnor was it interrupted by outside influences or distractions such as a ringingtelephone. Finally, the problem of segmenting tasks was avoided by starting thetrial immediately before the task began and stopping it immediately after thetask was finished.
There is no question that these limitations may affect the generality of theresults. Nonetheless, we believe that the results of our preliminary study, aspresented below, are encouraging enough to support follow-on work that woulddetermine their generality.
1 In some cases, the availability of the subject required more than one trial per day;five subjects performed two trials on the same day at least once and one of thoseperformed six trials on the last day of the subject’s availability.

294 M.R. Hodges and M.E. Pollack
4 Machine Learning Approach
The data collected by the sensors during each subject’s performance of the coffee-making task was input to a machine-learning algorithm for classification. Weused a decision-tree induction algorithm for this purpose, primarily because itis the simplest form of classification algorithm and thus provided a reasonablestarting point for our investigation. A decision tree is a classifier, taking a setof properties as input and outputting a “decision” by following paths on a tree,starting at the root and working to a leaf node. Internal nodes in this tree area test of the value of a property, and the branches from that node represent thepossible values of the test. The leaf node is the decision reached by the tree. Inour study, we used the C4.5 decision-tree induction system, which is based onthe ID3 algorithm. C4.5 particularly attempts to avoid overfitting, the conditionwhere an overly complex tree is created that is less accurate than a simpler onewould be [17].
A key question then is what features of the sensor data should be used asinput to the classifier. We investigated two types of features for sensor data:observation granularity and interaction measure.
Observation granularity has to do with how abstract our observations are: dowe need to provide information to the machine learning algorithm about the factthat a subject touched the coffeepot or the fact that she touched the left side ofthe lid (or both)? Many of the objects used in the study had multiple tags affixedto them, and we thus considered observations of interactions at three layers ofabstraction:
1. Tag: Detected interaction with an individual tag affixed to an object;2. Group: Detected interaction with any of a group of tags that are equivalent
except for the orientation of the object (e.g., the tag on the left side of thecoffee grounds and the tag on the right); and
3. Object: Detected interaction with an object (e.g., with any of the tags thatare affixed to the coffeepot).
Table 1 shows the objects we used, and the tag groups associated with eachobject. Note that for some objects, like the mug, there is only one tag, so thetag, group, and object are all the same.
Independent of the level of abstraction, there are also different ways in whichwe can measure interactions; we explored five types of features that measureinteractions, applying them to each of the levels of granularity:
1. Detected: A binary feature that is positive iff there was any interaction witha tag, group, or object.
2. Count: A scalar feature that records the number of interactions with a tag,group, or object.
3. Total Duration: A scalar feature that records the total amount of time ofinteraction with a tag, group, or object.

An ‘Object-Use Fingerprint’: The Use of Electronic Sensors 295
Table 1. List of Tag Groups and Objects
Objects GroupsCoffee Maker Lid, power switchCarafe CarafeMug MugSpoon SpoonCoffee Grinder Top row of tags, middle row, bottom rowLeft Cabinet Door Left cabinet doorRight Cabinet Door Right cabinet doorCoffee Grounds Top tags on front and back, bottom tags on front and back,
tag on bottom, tags on sidesCoffee Beans Top tags on front and back, bottom tags on front and back,
tag on bottom, tags on sidesFilters Tags on sides, tag on bottomCreamer Tags on top row, tags on bottom rowSugar Tags on top row, tags on bottom rowFaucet Faucet
4. Average Duration: A scalar feature representing the average time of interac-tion with a tag, group, or object: this is a computed feature, equal to TotalDuration divided by Count.
5. Order: A binary feature that is positive iff an arbitrary two- or three-tag,group, or object ordering is observed.
The order feature deserves a little more explanation. It determines whether aspecific ordering of interactions is observed in a trial. This ordering may consistof two or three tags, groups, or objects, but within a specific ordering only onelevel of granularity is used. Because there are 70 tags, 25 groups, and 13 objectsin the experiment, over 300,000 possible orderings exist. As a result, consideringall possible orderings of tags comes at a significant cost in performance. Thisperformance cost will be discussed further in Sections 5 and 6.
Although the RFID reader and tag system provides accurate and generallyreliable results, an individual tag is sometimes found and lost in quick succes-sion, either when it is near the maximum distance from the reader at which itcan be sensed, or if the reader moves rapidly. In order to smooth the data, apre-processing step can be performed on each trial prior to analysis. The pre-processing step looks for consecutive accesses of the same tag, group, or objectwithin 0.5 seconds. When this is found, the records of the two accesses are mergedinto one, hopefully providing a more accurate model of the subject’s actual be-havior. This means that when a subject quickly draws her hand away from a tagand then puts her hand back on the tag, the action will be interpreted as onecontinuous interaction, and that when a subject moves her hand over severaltags on the same object, the action will be interpreted as one continuous inter-action at the object level (analysis on the tag feature level will not be impactedin this case). In Section 5.5 we describe the effect of this pre-processing.

296 M.R. Hodges and M.E. Pollack
We performed one additional type of pre-processing on the collected data.The task of making coffee was selected in part due to the natural variation inhow people perform the task. Although more obvious indicators, such as whetherpeople put cream or sugar in their coffee, might be considered valid differencesin behavior, it is a more interesting question to ask if an individual can bedetermined without that information. For that reason, in most of our analyses,we removed from the data all information about cream and sugar tags. (Weindicate places where this is not true.) Similarly, a subject’s choice of grindingwhole beans verses using grounds can be used to distinguish amongst subjects.Because removing information from the tags for the grounds, beans, and grinderfrom the trial would remove one-fifth of the data collected, we simply note thatonly one user used whole beans, and that user used whole beans in every trial.For that reason, one of the ten users can be distinguished very easily from theothers.
By using ten subjects who each perform ten trials, we obtained 100 cases foranalysis. We used a ten-fold cross-validation process, repeatedly using 90 of thetrials as training data for C4.5 and reserving the remaining 10 trails as test data.In each iteration, the training data contained 9 trials for each subject, with thetenth reserved for testing data; however, our learning system did not use theinformation that there is exactly one trial per subject during the classificationprocess.
5 Results
5.1 Full Feature Set
We begin by describing the results obtained when C4.5 is run using the full set of15 features (5 feature types, applied to each of the three layers of abstraction) andincluding the cream and sugar information. In this case, the system is extremelyaccurate, correctly recognizing the subject in 97 of the 100 trials (again, undera 10-fold cross validation experiment). Two of the incorrectly-recognized trialswere performed by the same subject, meaning that the system correctly identifiedat least 8 of each user’s 10 trials. 8 of the 10 users were identified accurately inall 10 of their trials, with the remaining participant correctly identified in 9 ofthe 10 trials. Table 2 shows the confusion matrix for this feature set.
The ten decision trees produced here have an average of 10.8 internal nodesand an average maximum depth of 7.3. Well over half the internal nodes considerorder features and every observation granularity appears in at least one tree,while count is the only interaction measure that does not appear in any of thetrees. Figure 2 shows one of the trees produced. In this case, all but one of theten internal nodes use order.
Perhaps surprisingly, the system has the same accuracy when using the fullset of 15 features, but now ignoring the use of cream and sugar, with the subjectsagain being correctly identified in 97 of the 100 trials. In this case, all three ofthe incorrectly identified trials were from different users, meaning three userswere each recognized correctly in 9 of their 10 trials, and the other seven were

An ‘Object-Use Fingerprint’: The Use of Electronic Sensors 297
Table 2. Confusion matrix of full feature set using cream and sugar
Inferred IdentityTruth A B C D E F G H I J
A 10B 10C 10D 10E 1 9F 1 1 8G 10H 10I 10J 10
Fig. 2. One of the decision trees produced with the full feature set using cream andsugar
recognized in all of their trials. The confusion matrix for this feature set isgiven in Table 3. We hypothesize that the sugar and cream did not improveperformance because of a ceiling effect: classification was so high (97%) evenwithout the specific information about sugar and cream that there was no roomfor improvement.
The ten trees produced here are slightly larger and slightly deeper than thoseproduced when cream and sugar is considered. They have an average of 12.2internal nodes and an average maximum depth of 7.8. Again, well over half theinternal nodes consider order features, and in this case every type of interactionmeasure is used in at least one tree as is every observation granularity.

298 M.R. Hodges and M.E. Pollack
Table 3. Confusion matrix of full feature set without cream and sugar
Inferred IdentityTruth A B C D E F G H I J
A 10B 10C 10D 10E 9 1F 1 9G 10H 1 9I 10J 10
Although the system is very accurate when using the full feature set, perfor-mance is not ideal. With the cream and sugar data deleted, the system takes anaverage of 8 minutes to compute the features and learn one tree, then performsubject identification for ten trials. Including the cream and sugar data degradesperformance significantly, requiring an average of 40 minutes for the same task.Since performing identification is still very quick, taking less than one second,this performance may be considered acceptable. However, as we describe furtherin section 5.4, even learning time must be bounded; moreover, the performanceproblems are likely to be exacerbated by more complex environments.
5.2 Influence of Observation Granularity
Next, we consider the system’s success when only certain subsets of the featuresare used in the identification process. There are three reasons for doing this.First, as noted above, the performance of the system is relatively slow, and soit is important to determine whether it can be improved by using fewer featureswithout sacrificing accuracy. In particular, there are a huge number of orderfeatures, so it is valuable to understand their impact on performance. Second,it is useful to know if the number of tags in the environment can be reduced,both for aesthetic reasons and so that we can anticipate the effects of tags fallingoff during use. Third, the time spent identifying groups and objects may not benecessary if performance does not degrade when only tag-level features are used.
To begin, we consider the influence of features at different layers of abstraction;the results are shown in Table 4, which provides the accuracy of the system inperforming subject identification when using only tag-level observations, group-level observations, and object-level observations. In this analysis we make use ofall interaction measures, and we delete the cream and sugar data.
As can be seen, when we restrict the algorithm to object-level data, accuracyis essentially unchanged from that using the full feature set, but it degradesnoticeably when using only tag or group level observations. Interestingly, thisis due primarily to the inability of the system to classify a particular subject

An ‘Object-Use Fingerprint’: The Use of Electronic Sensors 299
Table 4. Comparison of feature levels
Observation Granularity AccuracyTag 87%
Group 88%Object 97%
(subject F). Using only interactions at the tag level, the system correctly identi-fies that subject only once, while using interaction at the group level it correctlyidentifies the same subject just twice. That subject’s other trials at the tag andgroup level are all misidentified as subject D, indicating that those two maybe very difficult to distinguish (although subject D is never misidentified). Theaccuracy of both feature sets on the other subjects remains very high at 95.6%.
5.3 Influence of Interaction Measure
We next consider the importance of each of the types of interaction measures;again, in all our analyses here, we omit the cream and sugar data. Table 5gives the results, showing both the overall accuracy when using only a singleinteraction measure, and a list of subjects who were correctly identified in 5 orfewer of their 10 trials.
Table 5. Comparison of individual features
Interaction Measure Accuracy Subjects Correctly Identified in ≤ 5 TrialsAccuracy Detected 73% A, C, E, J
# of Times Detected 75% A, C, ETotal Duration 85% F
Average Duration 72% E, F, HOrder 93%
Most single interaction measures result in difficulty in identifying some sub-jects, but no problems in identifying others. Subject F, the one consistentlymisidentified in the tag and group feature sets, is never identified correctly inthe Total Duration feature set, and only once in the Average Duration featureset. However, the same subject is correctly identified 9 of 10 times in the # ofTimes Detected feature set, 8 of 10 times in the Detected feature set, and everytime in the Order feature set.
5.4 “All But Order”
As described in section 5.1, the time to learn one tree and perform subject identi-fication for ten trials can take up to forty minutes. Because the actual identifica-tion is still performed in under one second, this performance may be considered
300 M.R. Hodges and M.E. Pollack
acceptable since computing the features and learning the tree would not need tohappen in real time. However, even learning time must be bounded; moreover,the performance problems are likely to be exacerbated by more complex envi-ronments. Observing subjects performing larger and more complex tasks mayrequire several times as many sensors as were used in this experiment. Addi-tionally, allowing a user to interleave actions from multiple tasks may preventa system from simplifying the learning process by only considering the sensorsrelevant to a single task.
While the number of features computed for other interaction measures growlinearly, order undergoes cubic growth since using order involves generating andconsidering a large number of possible two- and three-step sequences. We thusrepeated the analysis, using the full feature set except for the order features.This analysis is also important to answering the question of what features areimportant in performing identification.
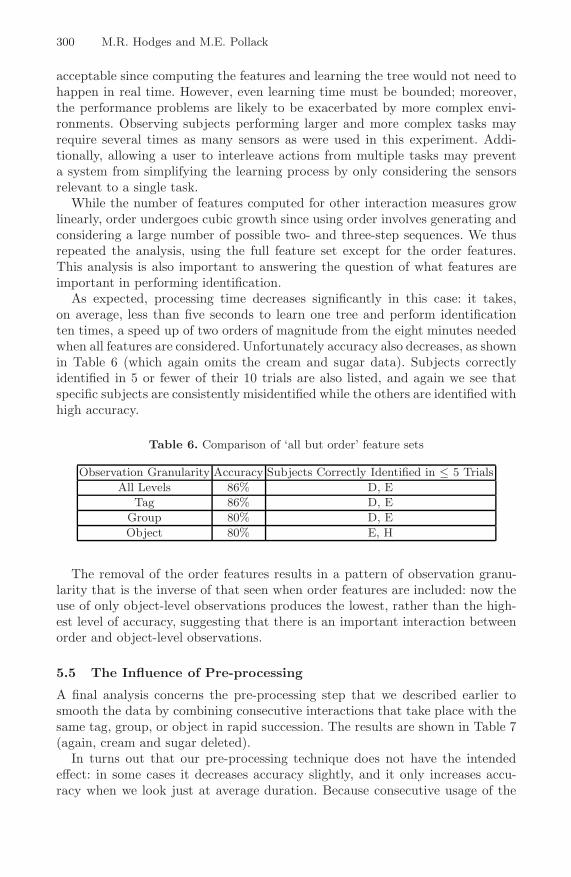
As expected, processing time decreases significantly in this case: it takes,on average, less than five seconds to learn one tree and perform identificationten times, a speed up of two orders of magnitude from the eight minutes neededwhen all features are considered. Unfortunately accuracy also decreases, as shownin Table 6 (which again omits the cream and sugar data). Subjects correctlyidentified in 5 or fewer of their 10 trials are also listed, and again we see thatspecific subjects are consistently misidentified while the others are identified withhigh accuracy.
Table 6. Comparison of ‘all but order’ feature sets
Observation Granularity Accuracy Subjects Correctly Identified in ≤ 5 TrialsAll Levels 86% D, E
Tag 86% D, EGroup 80% D, EObject 80% E, H
The removal of the order features results in a pattern of observation granu-larity that is the inverse of that seen when order features are included: now theuse of only object-level observations produces the lowest, rather than the high-est level of accuracy, suggesting that there is an important interaction betweenorder and object-level observations.
5.5 The Influence of Pre-processing
A final analysis concerns the pre-processing step that we described earlier tosmooth the data by combining consecutive interactions that take place with thesame tag, group, or object in rapid succession. The results are shown in Table 7(again, cream and sugar deleted).
In turns out that our pre-processing technique does not have the intendedeffect: in some cases it decreases accuracy slightly, and it only increases accu-racy when we look just at average duration. Because consecutive usage of the

An ‘Object-Use Fingerprint’: The Use of Electronic Sensors 301
Table 7. Effects of pre-processing
Interaction Measure Accuracy Before Pre-Processing Accuracy After Pre-ProcessingAll Features 97% 95%
Detected 73% 73%# of Times Detected 75% 76%
Total Duration 85% 81%Average Duration 72% 81%
Order 93% 93%
same item should not affect the Detected or Order features, their accuracy, bydefinition, remains unchanged. The increased accuracy of average duration isexpected because it is the feature most affected by the rapid finding and losingof a tag. The decreased accuracy of total duration is a surprise, however, sinceusing pre-processing should increase how accurately duration is measured byfilling gaps in detected usage that are probably not gaps in actual usage. We areuncertain at this time as to how to explain that result.
6 Discussion
The motivation for this work was to determine whether individuals have pre-dictable object-use patterns as they carry out activities of daily living, and todetermine whether these patterns could be used for identification. Although theexperiment presented here is preliminary, in that it only involves 10 subjectsand the performance of a single type of task in a controlled environment, it isnonetheless promising in suggesting the existence of such regularities. There areno subjects that the machine learning algorithm has trouble identifying with thebest-performing feature sets. Additionally, there are no trials that are misidenti-fied by all four of the best feature sets. However, when the computationally costlyorder features are omitted, the level of accuracy varies with subjects. Thus, achallenge for future research is to automatically learn which features sets arebest at identifying the regularities of a given individual’s behavior.
One way to address this challenge would be to reduce the number of orderfeatures required. In general, the number of possible orderings grows quickly withthe number of items (tags, groups, or objects), (O(n3)). However, only a smallsubset of these orderings are important to subject identification. Thus, ratherthan include all or none of the possible orderings as input to the machine-learningalgorithm, the application of domain-specific knowledge to identify interestingorderings may be viable. In the trials run with every feature at every feature leveland ignoring cream and sugar, order was used an average of 8.4 times per tree(84 times total). Several orderings were used multiple times, though, includingone that was used 9 different times and there were only 35 unique orderings used.If one were able to identify most of these “relevant” orderings, then classificationtime could be significantly reduced without a penalty in accuracy.

302 M.R. Hodges and M.E. Pollack
Finally, we note that the use of object-level observations provided the highestaccuracy of the three layers of abstractions, but every individual interaction mea-sure except order performed better using tag-level observations. This suggeststhe added resolution of using a large number of short-range tags may be morebeneficial than placing a smaller number of longer-range tags on each object. Italso implies much of the benefit of using order can be gained by just consider-ing order at the object-level, and this may also greatly reduce the computationalcosts of processing. In addition, the process of identifying relevant orderings maybe simplified by focusing on those that occur at the object level.
A key area for future work involves replicating the experiment described hereon more and different types of subjects, on a broader range of activities, and innaturalistic settings, so as to validate the generality of our preliminary results.
References
1. Barger, T., Alwan, M., Kell, S., Turner, B., Wood, S., Naidu, A.: Objective re-mote assessment of activities of daily living: Analysis of meal preparation patterns(poster presentation)
2. Liao, L., Fox, D., Kautz, H.: Location-based activity recognition. In: Weiss, Y.,Scholkopf, B., Platt, J. (eds.) Advances in Neural Information Processing Systems18, pp. 787–794. MIT Press, Cambridge, MA (2006)
3. Patterson, D.J., Fox, D., Kautz, H., Philipose, M.: Fine-grained activity recognitionby aggregating abstract object usage. In: Gil, Y., Motta, E., Benjamins, V.R.,Musen, M.A. (eds.) ISWC 2005. LNCS, vol. 3729, pp. 44–51. Springer, Heidelberg(2005)
4. Philipose, M., Fishkin, K.P., Perkowitz, M., Patterson, D.J., Fox, D., Kautz, H.,Hahnel, D.: Inferring activities from interactions with objects. IEEE PervasiveComputing 3(4), 50–57 (2004)
5. Tapia, E.M., Intille, S.S., Larson, K.: Activity recognition in the home using simpleand ubiquitous sensors. In: Ferscha, A., Mattern, F. (eds.) PERVASIVE 2004.LNCS, vol. 3001, pp. 158–175. Springer, Heidelberg (2004)
6. Wren, C.R., Tapia, E.M.: Toward scalable activity recognition for sensor networks.In: Hazas, M., Krumm, J., Strang, T. (eds.) LoCA 2006. LNCS, vol. 3987, pp.168–185. Springer, Heidelberg (2006)
7. Ben-Arie, J., Wang, Z., Pandit, P., Rajaram, S.: Human activity recognition usingmultidimensional indexing. IEEE Trans. Pattern Anal. Mach. Intell. 24(8), 1091–1104 (2002)
8. Fishkin, K.P., Philipose, M., Rea, A.: Hands-on rfid: Wireless wearables for de-tecting use of objects. In: ISWC 2005, pp. 38–43. IEEE Computer Society, LosAlamitos (2005)
9. Bao, L., Intille, S.S.: Activity recognition from user-annotated acceleration data.In: Ferscha, A., Mattern, F. (eds.) PERVASIVE 2004. LNCS, vol. 3001, pp. 1–17.Springer, Heidelberg (2004)
10. Patterson, D.J., Liao, L., Gajos, K., Collier, M., Livic, N., Olson, K., Wang, S.,Fox, D., Kautz, H.A.: Opportunity knocks: A system to provide cognitive assistancewith transportation services. In: Davies, N., Mynatt, E.D., Siio, I. (eds.) UbiComp2004. LNCS, vol. 3205, pp. 433–450. Springer, Heidelberg (2004)
11. Peacock, A., Ke, X., Wilkerson, M.: Typing patterns: A key to user identification.IEEE Security and Privacy 2(5), 40–47 (2004)

An ‘Object-Use Fingerprint’: The Use of Electronic Sensors 303
12. Wang, L., Tan, T., Ning, H., Hu, W.: Silhouette analysis-based gait recognition forhuman identification. IEEE Trans. Pattern Anal. Mach. Intell. 25(12), 1505–1518(2003)
13. Arandjelovic, O., Shakhnarovich, G., Fisher, J., Cipolla, R., Darrell, T.: Face recog-nition with image sets using manifold density divergence. In: CVPR ’05: Proceed-ings of the 2005 IEEE Computer Society Conference on Computer Vision and Pat-tern Recognition (CVPR’05), vol. 1, pp. 581–588. IEEE Computer Society Press,Washington (2005)
14. Finkenzeller, K.: RFID Handbook: Fundamentals and Applications in ContactlessSmart Cards and Identification. John Wiley & Sons, Inc., New York, NY, USA(2003)
15. Fishkin, K.P., Jiang, B., Philipose, M., Roy, S.: I sense a disturbance in the force:Unobtrusive detection of interactions with rfid-tagged objects. In: Davies, N., My-natt, E.D., Siio, I. (eds.) UbiComp 2004. LNCS, vol. 3205, pp. 268–282. Springer,Heidelberg (2004)
16. Smith, J.R., Fishkin, K.P., Jiang, B., Mamishev, A., Philipose, M., Rea, A.D.,Roy, S., Sundara-Rajan, K.: Rfid-based techniques for human-activity detection.Commun. ACM 48(9), 39–44 (2005)
17. Quinlan, J.R.: C4.5: Programs for Machine Learning. Morgan Kaufmann, San Fran-cisco (1993)