lmi - green jobs rr draft - labormarketinfo.edd.ca.gov · in may 2009, the michigan department of...
TRANSCRIPT
Michigan Green Jobs Report: A Regional Analysis
OCCUPATIONS & EMPLOYMENT IN THE NEW GREEN ECONOMY
Michigan Department of Energy, Labor & Economic Growth
Bureau of Labor Market Information & Strategic Initiatives
JULY 2010
Prepared By:
Bureau of Labor Market Information & Strategic Initiatives
Richard Waclawek Director
Bruce Weaver
Project Manager
Rhea Acuna James Astalos
Leonidas Murembya Jason Palmer Mark Reffitt
Stephen Woods
For Further Information, Please Contact:
Bureau of Labor Market Information and Strategic Initiatives Labor Market Analysis Section
3032 W. Grand Boulevard, Suite 9‐100 Detroit, MI 48202 (313) 456‐3100
1

Table of Contents Executive Summary.......................................................................................................................3 Introduction ..................................................................................................................................7
Section I: Cross‐Region Comparative Analysis ..............................................................................8 Figure 1: Direct Green Jobs as a Share of Total Private Jobs............................................................... 8 Figure 2: Direct Green Jobs by Region by Core Area ........................................................................... 9 Figure 3: Core Area Green Jobs by Region......................................................................................... 10 Figure 4: Regional Distribution of Green Jobs by Industry ................................................................ 12 Figure 5: Regional Distribution of Green Jobs by Occupation........................................................... 13 Figure 6: Percent of Employers Expecting Recruiting Difficulties for Green Jobs ............................ 14 Figure 7: Percent of Employers Highlighting Unique Skills Required for Green Projects................. 15 Figure 8: Share of Employers Expecting Green Jobs Gains by 2011 ................................................. 16 Figure 9: Anticipated Training Demand by Region: Formal vs. Informal .......................................... 18 Section II: Michigan Regional Green Job Profiles ........................................................................19 Southeast Michigan ............................................................................................................................ 20 Southwest Michigan ........................................................................................................................... 29 West Michigan .................................................................................................................................... 37 Mid‐Michigan ...................................................................................................................................... 45 Northern Michigan.............................................................................................................................. 53 Appendix 1: Michigan Regions ....................................................................................................63
2

Executive Summary
This report is a companion to the Michigan Green Jobs Report 2009, which was the first in‐depth research report measuring the number and characteristics of green jobs in Michigan. The report Michigan Green Jobs: A Regional Analysis presents for the first time green jobs data for five regions in Michigan.1,2 The five regions are Southeast Michigan, Southwest Michigan, Mid‐Michigan, West Michigan, and Northern Michigan.
Key Findings• Green jobs accounted for about 2‐4 percent of total private jobs across Michigan regions. • The auto industry is a significant source of green jobs in several Michigan regions, and
particularly in Southeast Michigan. • Concentrations of green jobs can be identified in each region, such as renewable energy jobs in
Mid‐Michigan, natural resource positions in Northern Michigan, energy efficiency jobs in Southwest Michigan, and environmental cleanup jobs in West Michigan.
• Green jobs by occupation differ across regions, but engineering, construction, production, and installation and repair occupations were reported as “green” by employers in all regions.
Green Jobs by Region
Notable green job levels exist in each region of the state. Green job levels were analyzed by region in two ways: (1) by comparing the number of green jobs by region; and (2) by calculating the concentration of total private jobs in a region that are considered “green.”
Michigan boasts a total of 104,000 green jobs. The largest numbers of green jobs were in Southeast Michigan. Northern Michigan, Southwest Michigan, and West Michigan were in the second, third, and fourth positions, respectively. Mid‐Michigan was the region to report the fewest number of green jobs.
Statewide, 3.3 percent of total private jobs were considered “green.” The region with the largest concentration of green jobs was Northern Michigan, with 4.3 percent. Mid‐Michigan and West Michigan reported the lowest concentration of green jobs with 1.8 percent and 2.0 percent, respectively.
Southest Michigan 65.1%
Mid‐Michigan 6.3% West
Michigan 9.4%
Southwest Michigan 9.5%
Northern Michigan 9.7%
Green Jobs by Core Area
The Michigan Green Jobs Report classified green jobs in one of five core areas: Clean Transportation and Fuels; Increasing Energy Efficiency; Pollution Prevention and Environmental Cleanup; Agriculture and Natural Resources Conservation; and Producing Renewable Energy. 1 This regional report includes additional survey data beyond what was reflected in the Michigan Green Jobs Report. As a
result, the estimated number of direct green jobs in Michigan has been revised upward to 104,000.
3
TP
2 The Michigan Green Jobs Report can be found on the DELEG Bureau of Labor Market Information and Strategic Initiatives website, at www.michigan.gov/lmi under “Publications”.

4
Southeast Michigan, due to its large size, is home to the majority of green jobs in all five core areas. Nevertheless, the core area of Clean Transportation and Fuels accounted for over half of all green jobs in Southeast Michigan. This is primarily due to the many green jobs created by the automotive industry and auto suppliers.
A high regional concentration of green jobs in particular core areas may suggest that regional specialization exists in different types of green products and services. Indeed, each of the state’s five regions reported a higher‐than‐average concentration of green jobs in a particular core area when compared to the statewide averages.
For example, Southwest Michigan contains a good share of Michigan employment in Increasing Energy Efficiency while West Michigan recorded positive statewide job shares in Agriculture and Natural Resource Conservation and Pollution Prevention & Environmental Cleanup. Mid‐Michigan reported 16 percent of Michigan jobs in Producing Renewable Energy and Northern Michigan boasted 20 percent of statewide jobs in Agriculture and Natural Resource Conservation.
Green Jobs by Industry and Occupation
Regional green jobs were found in a cross‐section of industries and occupations. As expected, there were several green industries and green occupations that were found commonly across all regions. The table on this page gives a few examples of common and region‐specific sectors producing green jobs.
The majority of green jobs in Southeast Michigan were predictably concentrated in two industries: transportation equipment manufacturing and professional, scientific and technical services. Other major sources of green jobs were construction, administrative and support services, and waste management and remediation services.
Common Green Industries(Across Regions)
Professional, Scientific, and Technical Services Specialty Trade Contractors Construction of Buildings
Crop Production
Unique Green Industries (Region Specific)
Transportation Equipment Manufacturing Waste Management and Remediation Services
Wood Products Manufacturing Green Wholesaling
Chemical Manufacturing Primary Metal Manufacturing
Among the occupations reporting significant green employment in Southeast Michigan were architecture and engineering occupations, production occupations, installation, maintenance, and repair occupations, and construction and extraction occupations.
The mix of green industries and green occupations in Southeast Michigan reflect the region’s large auto‐related economy. Significant numbers of engineers, technicians, production staff and others in the auto sector are increasingly focused on research, design, and production of fuel‐efficient vehicles and new green auto technologies.
In Southwest Michigan, construction, professional, scientific, and technical services, and crop production were among the industries providing the most green jobs. Occupational employment was concentrated in farming, fishing, and forestry occupations, production occupations, construction occupations, architecture and engineering occupations, and installation, maintenance, and repair occupations.
The mix of green industries and occupations in Southwest Michigan represent the wide range of knowledge, skills, and abilities that can be applied to green jobs. Green employment in Southwest Michigan ranges from moderate‐

5
skill jobs in farming and production to highly skilled jobs in professional services.
Industries posting significant green job counts in West Michigan included construction‐related industries, transportation equipment manufacturing, and waste management and remediation. Above average job levels were recorded in construction occupations, production occupations, and installation, maintenance, and repair occupations.
These industries and occupations reflect the diverse nature of the West Michigan economy. While the automotive industry is certainly important in West Michigan, other industries have flourished there, making it a region with a diverse range of green‐related businesses.
Green jobs in Mid‐Michigan were found in professional, scientific, and technical services and specialty trade contractors. In Mid‐Michigan, green employment was concentrated in production and architecture & engineering occupations. Significant job levels also were reported in construction and life, physical, and social science occupations.
While Mid‐Michigan green jobs are a modest share of total employment, the region has attracted new investment in green technology. The region’s significant employment in green‐related production occupations reflect the production of more fuel‐efficient motor vehicles and parts as well as the manufacturing of products for clean and renewable energy production, such as solar panel components and wind turbines and related components.
Many of the green jobs in Northern Michigan were concentrated in construction, professional services, and agricultural and natural resource industries. Large green occupations included construction and extraction occupations, architecture and engineering occupations, and production occupations.
Green employment in Northern Michigan is fairly diversified. The landscape of Northern Michigan ensures adequate opportunities for
agriculture and natural resource‐related green business, yet there are opportunities for other businesses in green building and alternative fuels.
Green Job Characteristics and Employer Expectations
The Michigan Green Jobs Report: A Regional Analysis also summarizes the responses of regional green employers to five additional survey questions. These survey questions covered topics such as: potential recruiting difficulties when trying to fill specific green occupations; the existence of unique skills for regional workers on green projects; employer expectations for short‐term green job growth; and the likely use of formal versus informal training for future green‐related workers.
Statewide, 16 percent of employers expected recruiting difficulties for green jobs. Green businesses in Mid‐Michigan expect the most difficulty recruiting for green jobs, as nearly a quarter of employers anticipate some issues recruiting. In contrast, just one in ten green businesses in West Michigan expect recruiting difficulties.
In Michigan, 64 percent of employers indicate that unique skills are required of workers who work on green projects. This measure varies significantly between the regions. In Mid‐Michigan, a large 82 percent of green employers indicate that unique skills are required for green jobs compared to Southwest Michigan, where just 44 percent of respondents indicated unique skills are required.
The skills required for green positions can be obtained through either formal or informal training. Typically, employers indicate that informal training may be the most frequently used option. Statewide, employers reported about 68 percent of training will be in an informal setting, versus 32 percent of training in formal programs. There was little regional divergence from these statewide results.

6
In general, green businesses were cautiously optimistic in 2009 about short‐term job gains. While the long‐run outlook for green employment is likely to be positive, only 30 percent of green employers indicated they expected to add green jobs by 2011.
Northern Michigan had the most optimistic expectations; as 36 percent of green employers in that region indicated green job gains by 2011. The least optimistic employers were in Mid‐Michigan, where just 16 percent of businesses expected to add green jobs in the short‐term.
Michigan Green Jobs Report: A Regional Analysis Introduction In May 2009, the Michigan Department of Energy, Labor, & Economic Growth (DELEG), Bureau
of Labor Market Information and Strategic Initiatives published the Michigan Green Jobs Report
2009. This study was the first direct survey of Michigan employers used to define and measure
green job totals by occupation and industry.
Green jobs were defined as “jobs directly or indirectly involved in generating a firm’s green‐
related products or services”. The state’s green economy was defined as being comprised of
those industries that provide products or services in five broad areas: Agriculture and Natural
Resource Conservation, Clean Transportation and Fuels, Increased Energy Efficiency, Pollution
Prevention or Environmental Cleanup, and Renewable Energy Production.
A survey was sent to thousands of employers to measure the current number of green jobs in
Michigan. It was found that Michigan boasted approximately 109,000 total green jobs— both
direct and indirect— among private sector employers. There were 96,767 direct green jobs and
12,300 indirect green jobs.3
This report supplements the content of the Michigan Green Jobs Report 2009 to evaluate the
distribution of these jobs across several state regions. Michigan was divided into five regions:
Northern Michigan, West Michigan, Mid‐Michigan, Southwest Michigan, and Southeast
Michigan.4 This regional analysis is divided into two sections. The first section is a comparative
cross‐regional analysis, while the second section presents the characteristics of green jobs
specific to each region.
3 With additional survey data collection since the report publication, the estimated number of direct green jobs in Michigan has been revised upward to 104,000. 4 A map showing the counties included in each region can be found in Appendix 1 of this report.
7

Section I: Cross‐Region Comparative Analysis • According to the Michigan Green Jobs
Survey, the state contains approximately 104,000 direct green jobs. The overwhelming majority of these jobs (65 percent) were in Southeast Michigan – the most populated region in the state.
Regional Distribution of Green Jobs
West Michigan,
9.4%
Southwest Michigan, 9.5%
Northern Michigan,
9.7%
Mid‐Michigan,
6.3%
Southeast Michigan, 65.1%
• Southwest Michigan, West Michigan, and
Northern Michigan each reported roughly 10 percent of the state’s green jobs.
• Interestingly, Mid‐Michigan, while home
to 12 percent of Michigan’s total jobs, reported a disproportionately low 6.3 percent of the state’s green jobs.
Figure 1: Direct Green Jobs as a Share of Total Private Jobs
Region Total Private Jobs Total Green Jobs Green Jobs as Share of
Total Private Jobs
Michigan 3,185,406 104,003 3.3%
Northern Michigan 228,329 9,811 4.3%
Southeast Michigan 1,686,322 65,733 3.9%
Southwest Michigan 317,851 9,545 3.0%
West Michigan 475,353 9,509 2.0%
Mid‐Michigan 361,940 6,369 1.8%
Source: Michigan Department of Energy, Labor & Economic Growth • Another revealing perspective is the share of a region’s total private employment that is
“green‐related.” Overall, just 3.3 percent of total employment in the private sector was comprised of green jobs.
• One reason for the relatively low share of green jobs is the natural life‐cycle of businesses in
the green economy. The green economy is still emerging in Michigan. In fact, the Michigan Green Jobs Report 2009 evaluated job trends using tax data on more than 350 green‐related Michigan firms, and one‐fifth of the firms appeared to be newly created since 2005.
8

Figure 2: Direct Green Jobs by Region by Core Area
Source: Michigan Department of Energy, Labor & Economic Growth
• Figures 1 and 2 display the green‐related share of total private jobs by region, ranging from
a high of 4.3 percent in Northern Michigan to a low of 1.8 percent in Mid‐Michigan. The pie charts in Figure 2 also display the distribution of green jobs by core area by region.
9

• Northern and Southwest Michigan possessed a similar number of green jobs, more than 9,500. In addition, the structure of jobs in their regional green economies exhibited similar patterns. Increasing Energy Efficiency was the leading core area for both regions. Employment in Clean Transportation and Fuels was minimal, accounting for only 2.4 percent of total green jobs in each region.
• Green employment in Southeast Michigan was concentrated in the top two core areas,
Clean Transportation and Fuels and Increasing Energy Efficiency. These two core areas comprised roughly 80 percent of green jobs in the region.
• Mid‐Michigan had the most diversified green economy with no core area accounting for
more than 30 percent of green jobs. The share of green jobs in each core area ranged from 13.9 percent in Pollution Prevention and Environmental Cleanup to 29.4 percent in Clean Transportation and Fuels.
• Essentially, about three‐fourths of green jobs in West Michigan were evenly distributed
between three core areas: Increased Energy Efficiency (28.9 percent), Pollution Prevention and Environmental Cleanup (23.6 percent), and Agriculture and Natural Resource Conservation (23.3 percent).
Regional Distribution of Green Jobs by Core Area • Figure 3 illustrates the core areas from a different perspective. While the pie charts in
Figure 2 show the core area distribution of green jobs for each region, the following table reveals the concentration of jobs by region in each core area.
Figure 3: Core Area Green Jobs by Region
Clean Transportation &
Fuels
Increasing Energy
Efficiency
Pollution Prevention & Environmental
Cleanup
Agriculture & Natural Resources
Conservation
Producing Renewable Energy
Regions
# % # % # % # % # %
Michigan 39,658 100% 26,761 100% 13,796 100% 13,059 100% 8,223 100%
Southeast Michigan 35,925 90.6% 14,444 54.0% 6,038 43.8% 4,090 31.3% 3,364 40.9%
Northern Michigan 239 0.6% 3,098 11.6% 2,272 16.5% 2,562 19.6% 1,364 16.6%
Southwest Michigan 232 0.6% 4,816 18.0% 1,567 11.4% 1,982 15.2% 844 10.3%
West Michigan 1,010 2.6% 2,745 10.3% 2,241 16.2% 2,211 16.9% 1,141 13.9%
Mid‐Michigan 1,872 4.7% 1,187 4.4% 887 6.4% 994 7.6% 1,336 16.2% Source: Michigan Department of Energy, Labor & Economic Growth
10

• Southeast Michigan accounted for the largest share of green jobs in each individual core area. Green employment in Clean Transportation and Fuels was heavily concentrated in Southeast Michigan, with a staggering 90.6 percent of the core’s Michigan total employment. The Southeast Michigan share of green employment in Agriculture and Natural Resource Conservation (31.3 percent) was the smallest, reflecting the significant degree of urbanization in the Detroit metro area.
• Clean Transportation and Fuels was the leading core area in Michigan, accounting for
39,658 green jobs or 38.1 percent of total green jobs in the state. • Increasing Energy Efficiency was the second largest core area in the state with 26,761 green
jobs (25.7 percent). Southeast Michigan accounted for a little over half of the green employment in this core area, while Mid‐Michigan accounted for the smallest share with only 4.4 percent.
• Pollution Prevention and Environmental Cleanup and Agriculture and Natural Resource
Conservation each represented roughly 13 percent of total green jobs in the state. Northern Michigan, which consists of mostly rural areas, employed a notable number of jobs in these two core areas.
• Producing Renewable Energy was the smallest core area in the state with 8,223 green jobs,
or 7.9 percent of the state total. Northern and Mid‐Michigan each accounted for a little over 16 percent of employment in this core area. This number will most likely grow in the near future as a large share of the state’s new solar and wind investments are directed toward these two regions.
11

Regional Distribution of Green Jobs by Detailed Industry • The top three green industries in Michigan: (1) Transportation equipment manufacturing,
(2) Professional, scientific, and technical services, and (3) Specialty trade contractors were heavily concentrated in Southeast Michigan.
Figure 4: Regional Distribution of Green Jobs by Industry
Region NAICS
Industry Title Southeast
Michigan Northern Michigan
Southwest Michigan
West Michigan
Mid‐ Michigan
336 Transportation Equipment Manufacturing 22,752 * * 1,027 *
541 Professional, Scientific, & Technical Services 18,216 1,684 1,144 648 973
238 Specialty Trade Contractors 5,678 2,318 1,538 1,974 460
236 Construction of Buildings 1,222 1,400 1,096 1,120 *
111 Crop Production 884 229 1,029 656 *
321 Wood Product Manufacturing * 138 90 343 * * Data confidential or does not meet criteria for publication
Source: Michigan Department of Energy, Labor & Economic Growth • With the anticipation of future high oil prices, a main activity in Michigan’s green economy
is the design and production of more fuel‐efficient vehicles. With a significant share of the auto workforce contributing to efficiency gains, the Transportation equipment manufacturing sector contributed a high number of Michigan green jobs. Accordingly, the center of the automotive industry — Southeast Michigan — exhibited the largest share of “green” jobs in the Transportation equipment manufacturing industry.
• Although Professional, scientific, and technical services is a multifaceted industry, the
majority of the green jobs in this sector were associated with laboratory testing and research and development.
• Specialty trade contractors was one of the leading providers of green jobs for each of the
five regions. It was the largest industry sector, in terms of the number of green jobs, for three regions: Northern, West, and Southwest Michigan.
• Another industry associated with construction, Construction of buildings, accounted for a
sizable share (4.8 percent) of green jobs in Michigan. Each of the regions, with the exception of Mid‐Michigan, contributed roughly 1,100 to 1,400 green jobs in this industry.
12

Regional Distribution of Green Jobs by Occupational Group • Michigan’s top five occupational groups accounted for nearly 80 percent of total green jobs.
For each of these occupations, Southeast Michigan accounted for the largest share of the workforce. The regional disparity was especially prominent for the top two occupations, Architecture and engineering and Production.
Figure 5: Regional Distribution of Green Jobs by Occupation
Region SOC
Occupations Southeast
Michigan Northern Michigan
Southwest Michigan
West Michigan
Mid‐ Michigan
17‐0000 Architecture & Engineering 22,391 1,383 1,189 691 1,238
51‐0000 Production 19,812 1,355 1,625 1,664 2,016
47‐0000 Construction & Extraction 5,370 2,668 1,561 2,037 740
49‐0000 Installation, Maintenance, & Repair 5,923 1,063 1,046 1,643 455
11‐0000 Management 1,957 941 1,009 709 182
45‐0000 Farming, Fishing, & Forestry 1,014 458 1,815 887 *
53‐0000 Transportation & Material Moving 2,320 402 246 249 275
19‐0000 Life, Physical, & Social Science 1,471 379 405 328 546
41‐0000 Sales & Related 1,912 387 * 519 * Data confidential or does not meet criteria for publication
*
Source: Michigan Department of Energy, Labor & Economic Growth • The occupational groups in Michigan generating high numbers of green jobs were mixed in
terms of educational requirements, ranging from mid‐skilled Construction and extraction and Production occupations to high‐skilled occupations, such as Architecture and engineering.
• Engineering and Production occupations are commonly found in the automotive, wind
turbine, and solar panel manufacturing industries. These occupations represented 64 percent of total green jobs in Southeast Michigan and a little over half (52 percent) of total green employment in Michigan.
13

Recruiting Difficulties
• A major requirement for a successful green economy is the availability of a well‐qualified labor pool to competently work in green jobs. If this labor pool is present, employers will have an incentive to locate in Michigan, and specifically in a particular region, to tap that able labor market. In contrast, if employers perceive the labor market to be unqualified or excessively small, they may have a disincentive to locate in a particular region.
Figure 6: Percent of Employers Expecting Recruiting Difficulties for Green Jobs*
9.6%
12.0%
15.9%
16.2%
18.9%
24.4%
0% 10% 20% 30%
West Michigan
Northern Michigan
Michigan
Southeast Michigan
Southwest Michigan
Mid‐Michigan
* Across all green job titles with a response to this survey question Source: Michigan Department of Energy, Labor & Economic Growth
• In the Michigan Green Jobs Report, employers indicated the green occupations in which they anticipated potential difficulty in filling future job vacancies. In general, employers in all regions were relatively optimistic about recruiting trends for green jobs. Across all green occupations, employers reported only modest rates of recruiting difficulty, ranging from just 10 percent of observations in West Michigan to under 25 percent in Mid‐Michigan.
• Employers anticipated the most hiring difficulty in occupations such as Architecture and engineering, Construction and extraction, and Production. Recruiting issues can reflect a shortage of qualified applicants, or the fact that unique skills (discussed below) are at times required for a position when working on “green projects.” Regardless of the reason, employers will need a well‐qualified pool of workers – especially in hard‐to‐fill occupations – to ensure the green economy can thrive in Michigan regions.
14

Unique Skills • The concept of unique skills is important. If an occupation requires unique skills for “green
projects”, this suggests that a worker may have difficulty shifting from a traditional work assignment to a green project without first gaining some specialized skills, knowledge, or work abilities. Information on skills is especially important for educators – to develop curriculum – and for workers – to manage expectations, and in many cases to motivate retraining.
• Regional differences were observed when analyzing the need for unique skills for “green
projects.” Interestingly, employers in Mid‐Michigan and Southeast Michigan, regions that have traditionally been heavily reliant on automotive jobs, indicated that between 70 to 80 percent of designated green occupations require unique skills. This was in contrast with identification of unique skills by a lower share of roughly 45 to 55 percent of employers in Southwest Michigan and West Michigan. Southwest Michigan and West Michigan each have a diversified manufacturing base, and a significant share of green jobs in Energy Efficiency combined with a small green job share in Clean Transportation and Fuels.
Figure 7: Percent of Employers Highlighting Unique Skills Required for Green Projects*
43.5%
54.3%
64.0%
64.1%
71.2%
82.0%
0% 10% 20% 30% 40% 50% 60% 70% 80% 90%
Southwest Michigan
West Michigan
Northern Michigan
Michigan
Southeast Michigan
Mid‐Michigan
* Across all green job titles with a response to this survey question Source: Michigan Department of Energy, Labor & Economic Growth
15

• According to employers, several occupations require unique skills when working on “green projects.” Among the most common occupational categories that require unique skills were Management; Life, physical, and social science; Architecture and engineering; and Installation, maintenance, and repair.
• Interestingly, surveyed employers indicated that certain Production occupations also
require unique skills when working on “green projects.” This further demonstrates the point that the existing blue‐collar workforce may need additional skills – beyond those commonly associated with traditional manufacturing jobs– to successfully compete for blue‐collar jobs in the green economy.
Expectations for Job Growth • Employers in the Michigan Green Jobs Survey also reported their expectations for job levels
in the next two years for each green occupation they identified. Across all green occupations, employers expected job gains ranging from 16.4 percent of observations in Mid‐Michigan to 35.6 percent in Northern Michigan. Several factors influence the potential short‐term regional climate for green job growth, such as the current industry base of the region, the region’s desire and ability to transition into a more green economy, and the availability of qualified workers to fill green job openings.
Figure 8: Share of Employers Expecting Green Job Gains by 2011*
16.4%
27.2%
29.9%
30.5%
31.4%
35.6%
0% 10% 20% 30% 40%
Mid‐Michigan
West Michigan
Michigan
Southwest Michigan
Southeast Michigan
Northern Michigan
* Across all green job titles with a response to this survey question Source: Michigan Department of Energy, Labor & Economic Growth
16

• Mid‐Michigan employers reported the least optimistic job growth expectations among Michigan regions. Nevertheless, Construction and extraction, Installation, maintenance, and repair, and Production occupations may see near‐average growth in the region. This probably reflects optimism among area businesses that demand will increase for green‐related building projects and that the region’s current infrastructure can be used to attract and retain green manufacturers.
• It is important to note that Mid‐Michigan includes several communities that are
disproportionately reliant on automotive‐related jobs including Lansing, Saginaw, Bay City, and the Thumb. Each of these regions may find opportunities by transitioning their existing capital stock and labor force from traditional manufacturing to green manufacturing.
• Near‐average expectations were reported in West Michigan, Southwest Michigan, and
Southeast Michigan; where about 30 percent of employers expected to see green job growth. Businesses were most optimistic about Construction and extraction, Life, physical and social science, and Architecture and engineering occupations.
• The highest share of expected green job gains was reported in Northern Michigan. Among
the occupational categories expected to see growth were Architecture and engineering, Life, physical, and social science, and Agriculture and Construction positions. The first two categories reflect the research and design stage of the product life‐cycle, indicating that businesses expect to grow these operations in Northern Michigan. The last two categories reflect the potential for the “greening” of two major industry sources of jobs in this region.
17
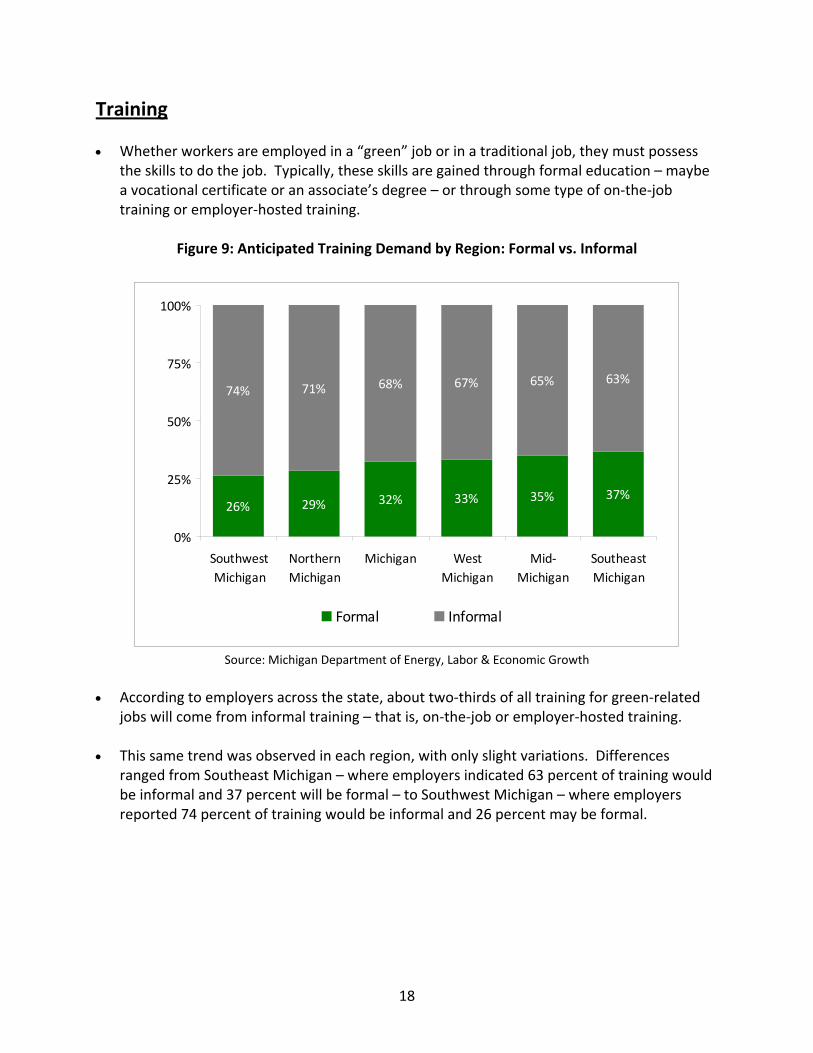
Training • Whether workers are employed in a “green” job or in a traditional job, they must possess
the skills to do the job. Typically, these skills are gained through formal education – maybe a vocational certificate or an associate’s degree – or through some type of on‐the‐job training or employer‐hosted training.
Figure 9: Anticipated Training Demand by Region: Formal vs. Informal
26% 29% 32% 33% 35% 37%
74% 71% 68% 67% 65% 63%
0%
25%
50%
75%
100%
SouthwestMichigan
NorthernMichigan
Michigan WestMichigan
Mid‐Michigan
SoutheastMichigan
Formal Informal
Source: Michigan Department of Energy, Labor & Economic Growth
• According to employers across the state, about two‐thirds of all training for green‐related
jobs will come from informal training – that is, on‐the‐job or employer‐hosted training. • This same trend was observed in each region, with only slight variations. Differences
ranged from Southeast Michigan – where employers indicated 63 percent of training would be informal and 37 percent will be formal – to Southwest Michigan – where employers reported 74 percent of training would be informal and 26 percent may be formal.
18
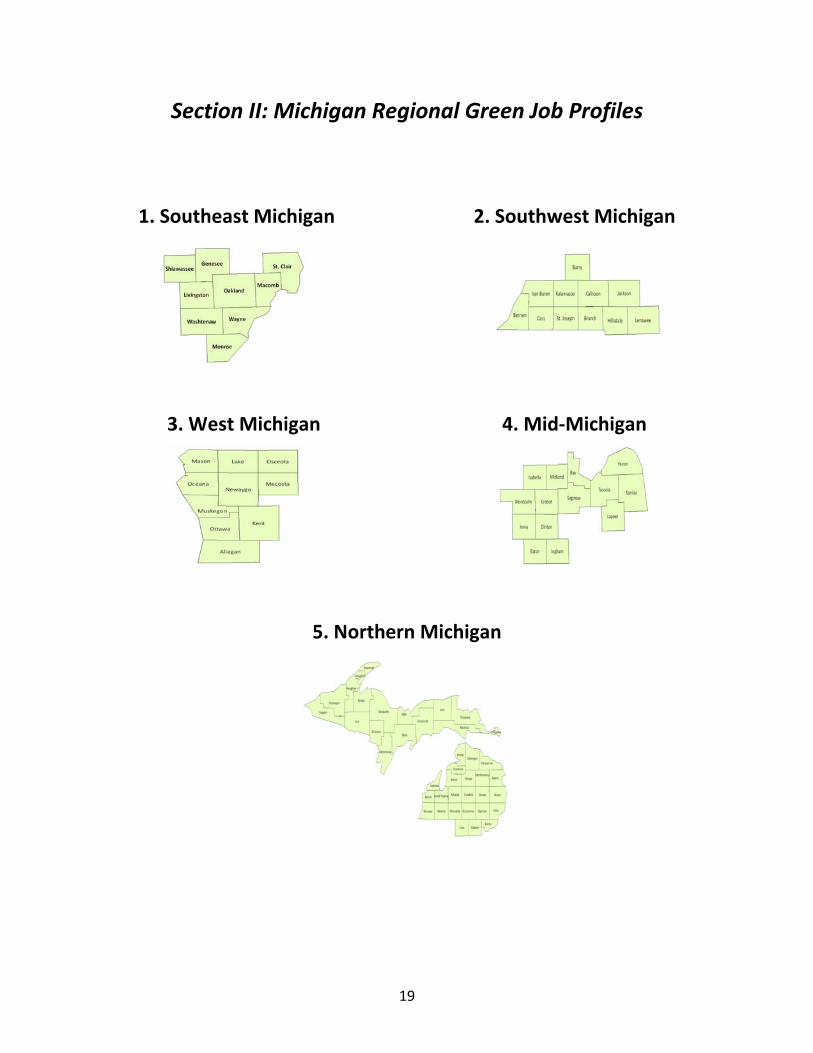
Section II: Michigan Regional Green Job Profiles
1. Southeast Michigan 2. Southwest Michigan
3. West Michigan 4. Mid‐Michigan
5. Northern Michigan
19

Southeast Michigan Regional Green Jobs Survey Results
Direct Green Jobs as a Share of Total Private
Jobs
3.9%3.3%
0.0%
1.0%
2.0%
3.0%
4.0%
SoutheastMichigan
Michigan
Quick Profile
Population — 2009 5,307,769
Labor Force — 2009 2,551,486
Jobless Rate — 2009 14.5 %
Total Private Payroll Jobs – 2nd Qtr. 20091,686,322
Total Direct Green Jobs 65,733
Regional Green Jobs Highlights in Southeast Michigan • Green jobs account for 3.9 percent of total industry employment in the region. This is
slightly above the state’s average 3.3 percent concentration of green jobs. The Southeast Michigan region accounts for more than 63 percent of all green jobs in Michigan.
• The largest green core area in the region is
Clean Transportation and Fuels, with over 54 percent of all area green jobs.
• Several industries contributed a significant
number of jobs to the area’s total green job count including Transportation equipment manufacturing (22,800), Professional, scientific and technical services (18,200) and Specialty trade contractors (5,700).
20

Distribution of Green Jobs by Core Area • In the Michigan Green Jobs Report, five green‐related core areas were identified and
defined. These included: (1) Clean Transportation and Fuels, (2) Increasing Energy Efficiency, (3) Pollution Prevention and Environmental Cleanup, (4) Agriculture and Natural Resources, and (5) Producing Renewable Energy.
Figure 1: Distribution of Green Jobs by Core Area for Michigan and Southeast Michigan
Michigan
Clean Transportation & Fuels, 38%
Unspecified, 2%
Increasing Energy
Efficiency, 26%
Pollution Prevention & Environmental Cleanup, 13%
Agriculture & Natural Resource
Conservation, 13%
Producing Renewable Energy, 8%
Southeast Michigan
Clean Transportation & Fuels, 55%
Unspecified, 3%
Increasing Energy
Efficiency, 22%
Pollution Prevention & Environmental Cleanup, 9%
Agriculture & Natural Resource
Conservation, 6%
Producing Renewable Energy, 5%
Source: Michigan Department of Energy, Labor & Economic Growth • Reflecting the overall importance of the auto industry in Southeast Michigan, the Clean
Transportation and Fuels core area accounted for the largest number of regional green jobs. Significant numbers of engineers, technicians, production staff and others in the auto sector are increasingly focused on research, design, and production of fuel‐efficient vehicles and new green auto technologies.
• Statewide, 38 percent of all green jobs were in Clean Transportation and Fuels, while more
than one‐half, or nearly 36,000 green jobs in Southeast Michigan were in this core area. Over 90 percent of all statewide green jobs in the Clean Transportation and Fuels core area were located in Southeast Michigan.
• About one‐quarter of green jobs in the state and the region were attributed to the
Increasing Energy Efficiency core area, with the majority of these jobs in the construction industry.
• One major difference between the region and state is seen in Agriculture and Natural
Resource Conservation, which shows the percentage of green jobs in Southeast Michigan at one‐half the share statewide.
21

Figure 2: Summary of Southeast Michigan Green Jobs by Core Area
Core Area Total
Green Jobs Percent Share of Total
Green Jobs
Total Green Jobs 65,733 100.0%
Clean Transportation and Fuels 35,925 54.7%
Increasing Energy Efficiency 14,444 22.0%
Pollution Prevention and Environmental Cleanup 6,038 9.2%
Agriculture and Natural Resource Conservation 4,090 6.2%
Producing Renewable Energy 3,364 5.1%
Green Jobs Not Assigned to a Core Area 1,872 2.8%
Source: Michigan Department of Energy, Labor & Economic Growth
Green Jobs by Industry • Figure 3 identifies the detailed industries with the largest number of green jobs in Southeast
Michigan. The top ten industries in the table provide over 56,000 green jobs or 85 percent of the regional total.
Figure 3: Industries Generating Significant Green Job Levels ‐ Southeast Michigan
Green Jobs as % of Industry Employment
NAICS Industry Total Green Jobs
Total Industry Employment
336 Transportation Equipment Manufacturing 22,752 81,360 28.0%
541 Professional, Scientific, and Technical Services 18,216 155,934 11.7%
238 Specialty Trade Contractors 5,678 41,901 13.6%
561 Administrative and Support Services 2,297 118,124 1.9%
562 Waste Management and Remediation Services 1,617 4,903 33.0%
423 Merchant Wholesalers, Durable Goods 1,429 48,288 3.0%
333 Machinery Manufacturing 1,376 26,137 5.3%
236 Construction of Buildings 1,222 11,148 11.0%
111 Crop Production 884 2,569 34.4%
551 Management of Companies and Enterprises 598 37,243 1.6%
332 Fabricated Metal Product Manufacturing 574 25,718 2.2%
326 Plastics and Rubber Products Manufacturing 118 8,071 Source: Michigan Department of Energy, Labor & Economic Growth
1.5%
22

• As expected, firms in the automotive sector were the primary source of green jobs in Southeast Michigan. Transportation equipment manufacturing provided nearly 23,000 direct green jobs to the Michigan economy. In addition, more than 2,000 green jobs exist in related sectors such as Machinery manufacturing, Fabricated metal product manufacturing, and Plastics and rubber products manufacturing.
• Professional, scientific, and technical services was the second largest source of green jobs in
the region with over 18,000 positions, providing nearly 28 percent of all green jobs in Southeast Michigan. This industry contains a variety of architecture, engineering and scientific firms that provide consulting services on clean energy technologies.
• Additionally, three other service‐based industrial sectors, Administrative and support
services, Waste management and remediation services and Management of companies and enterprises recorded a combined 4,500 green jobs. Landscaping and groundskeeping workers, environmental science and protection technicians, water treatment plant operators, and engineering managers are examples of green jobs in these three sectors.
• As indicated in Figure 4, Crop production in Southeast Michigan has the largest share of
green jobs to total jobs of any sector (34 percent). In this industry, green jobs were reported among workers that manage farm, ranch and agricultural operations as well as farmworkers and laborers who actually plant, cultivate and harvest farm products.
Figure 4: Green Jobs as a Share of Total Industry Employment – Southeast Michigan
2%
2%
2%
2%
3%
5%
11%
12%
14%
28%
33%
34%
0% 5% 10% 15% 20% 25% 30% 35% 40%
Plastics & Rubber Products Manufacturing
Management of Companies & Enterprises
Administrative & Support Services
Fabricated Metal Product Manufacturing
Merchant Wholesalers, Durable Goods
Machinery Manufacturing
Construction of Buildings
Professional, Scientific & Technical Services
Specialty Trade Contractors
Transportation Equipment Manufacturing
Waste Management & Remediation Services
Crop Production
Source: Michigan Department of Energy, Labor & Economic Growth
23
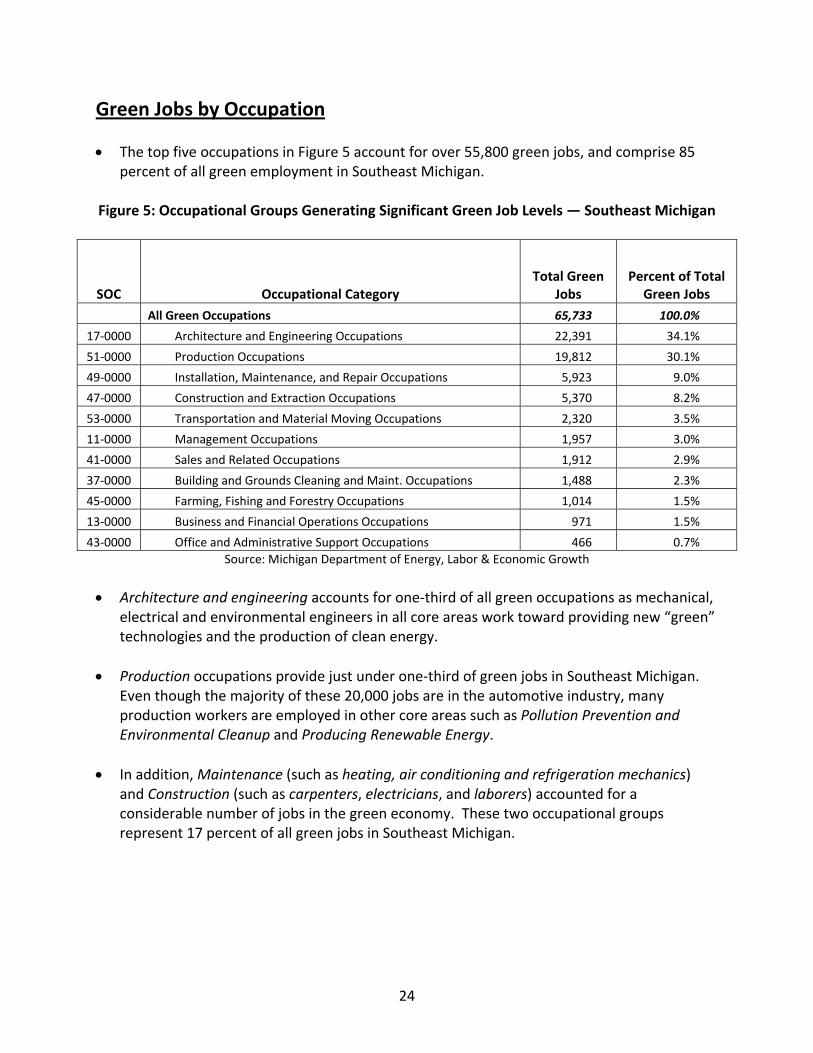
Green Jobs by Occupation • The top five occupations in Figure 5 account for over 55,800 green jobs, and comprise 85
percent of all green employment in Southeast Michigan. Figure 5: Occupational Groups Generating Significant Green Job Levels — Southeast Michigan
SOC Occupational Category Total Green
Jobs Percent of Total
Green Jobs
All Green Occupations 65,733 100.0%
17‐0000 Architecture and Engineering Occupations 22,391 34.1%
51‐0000 Production Occupations 19,812 30.1%
49‐0000 Installation, Maintenance, and Repair Occupations 5,923 9.0%
47‐0000 Construction and Extraction Occupations 5,370 8.2%
53‐0000 Transportation and Material Moving Occupations 2,320 3.5%
11‐0000 Management Occupations 1,957 3.0%
41‐0000 Sales and Related Occupations 1,912 2.9%
37‐0000 Building and Grounds Cleaning and Maint. Occupations 1,488 2.3%
45‐0000 Farming, Fishing and Forestry Occupations 1,014 1.5%
13‐0000 Business and Financial Operations Occupations 971 1.5%
43‐0000 Office and Administrative Support Occupations 466 0.7% Source: Michigan Department of Energy, Labor & Economic Growth
• Architecture and engineering accounts for one‐third of all green occupations as mechanical,
electrical and environmental engineers in all core areas work toward providing new “green” technologies and the production of clean energy.
• Production occupations provide just under one‐third of green jobs in Southeast Michigan.
Even though the majority of these 20,000 jobs are in the automotive industry, many production workers are employed in other core areas such as Pollution Prevention and Environmental Cleanup and Producing Renewable Energy.
• In addition, Maintenance (such as heating, air conditioning and refrigeration mechanics)
and Construction (such as carpenters, electricians, and laborers) accounted for a considerable number of jobs in the green economy. These two occupational groups represent 17 percent of all green jobs in Southeast Michigan.
24

Recruiting Difficulties • As indicated in Figure 6, employers anticipate that they will have varying degrees of
difficulty in recruiting green workers and filling future job needs.
Figure 6: Which Green Occupations Do Employers Expect Recruiting Difficulties? Southeast Michigan
SOC Occupational Category Share of Firms Expecting Recruiting Difficulty
41‐0000 Sales and Related Occupations 35.7%
37‐0000 Building and Grounds Cleaning and Maintenance Occupations 30.0%
13‐0000 Business and Financial Operations Occupations 23.8%
17‐0000 Architecture and Engineering Occupations 17.7%
49‐0000 Installation, Maintenance, and Repair Occupations 14.6%
27‐0000 Arts, Design, Entertainment, Sports, and Media Occupations 14.3%
51‐0000 Production Occupations 14.3%
53‐0000 Transportation and Material Moving Occupations 13.3%
11‐0000 Management Occupations 11.2%
47‐0000 Construction and Extraction Occupations 9.5%
19‐0000 Life, Physical, and Social Science Occupations 7.4% Source: Michigan Department of Energy, Labor & Economic Growth
• Job vacancies in Business and financial operations and Architecture and engineering occupations, due to the requirements of education, experience and specialized job skills, will be especially hard for employers to fill.
• Conversely, job openings in Production, Construction and extraction, and Transportation
and material moving occupations, which contain low‐to‐mid skill job titles which may require minimal on‐the‐job training, may be less difficult to fill.
Unique Skills • Can the new “green” economy create jobs that can be filled by the current regional
workforce, either by utilizing their existing skill sets or through retraining to obtain the requisite skills? The Michigan Green Jobs survey asked employers which occupations required unique skills when working on a “green‐related” project.
25

Figure 7: Occupations That Require Unique Skills for “Green Projects” – Southeast Michigan
62.5%
62.7%
63.6%
64.4%
64.8%
72.4%
75.6%
78.1%
80.6%
81.8%
84.6%
0% 20% 40% 60% 80% 100%
Transportation & Material Moving
Construction & Extraction
Business & Financial Operations
Management
Production
Sales & Related
Installation, Maintenance & Repair
Life, Physical, & Social Science
Architecture & Engineering
Building & Grounds Cleaning & Maintenance
Arts, Design, Entertainment, Sports & Media
Share of Firms Indicating Unique Skil ls Required
Source: Michigan Department of Energy, Labor & Economic Growth
• The data presented in Figure 7 are the occupational categories that the highest share of
employers identified as needing unique green skills. At least 63 percent of all survey respondents indicated that these occupational groups will require unique skills when working on “green” projects.
• Detailed job titles that employers identified as potentially requiring unique green skills
included industrial designers, landscaping workers, architects, civil engineers, mechanical engineers, and others.
26

Expectations for Job Growth
Figure 8: Share of Employers Expecting Green Job Gains by 2011 – Southeast Michigan
SOC Occupational Category
Percent of Employers Reporting Occupation is
Likely to Add Jobs
27‐0000 Arts, Design, Entertainment, Sports and Media Occupations 50.0%
37‐0000 Building and Grounds Cleaning and Maintenance Occupations 50.0%
41‐0000 Sales and Related Occupations 47.2%
49‐0000 Installation, Maintenance, and Repair Occupations 38.0%
47‐0000 Construction and Extraction Occupations 36.4%
13‐0000 Business and Financial Operations Occupations 35.7%
53‐0000 Transportation and Material Moving Occupations 35.3%
19‐0000 Life, Physical, and Social Science Occupations 33.3%
17‐0000 Architecture and Engineering Occupations 32.0%
51‐0000 Production Occupations 28.6%
45‐0000 Farming, Fishing and Forestry Occupations 23.1%
11‐0000 Management Occupations 18.9% Source: Michigan Department of Energy, Labor & Economic Growth
• The Michigan Green Jobs Report revealed that there are numerous firms related to the
green economy that experienced job gains from 2005‐2008, including some in Southeast Michigan.
• The top eight occupational categories in Figure 8 represent job titles in which one‐third to
one‐half of employers anticipate some green job growth through 2011. • About one‐half of all employers that report green jobs in Arts, design, entertainment, sports
and media; Building and grounds cleaning and maintenance; and Sales occupations anticipate possible green job gains over the next two years.
Training • In the original survey, an effort was made to measure the training needs of employers, in an
attempt to highlight the potential future green‐related training requirements of employers in the state.
27

Figure 9: Anticipated Training Demand — Formal vs. Informal Training Michigan vs. Southeast Michigan
Formal / Informal Training for Green Employment
37%
63%
32%
68%
0%
25%
50%
75%
100%
Formal Training Informal Training
Southeast Michigan
Michigan
Source: Michigan Department of Energy, Labor & Economic Growth
• The results were a mix of formal training, provided by community colleges or outside
training providers, or informal on‐the‐job training. • Michigan survey firms indicated an average potential use of both informal training methods
(68 percent) and formal training providers (32 percent) for their future green workforce. • Southeast Michigan employers reported very similar survey results, as informal on‐the‐job
training will account for 63 percent and formal sources will represent 37 percent of future green worker training.
28

Southwest Michigan Green Jobs Survey Results
Direct Green Jobs as a Share of Total Private
Jobs
3.0% 3.3%
0.0%
1.0%
2.0%
3.0%
4.0%
SouthwestMichigan
Michigan
Quick Profile
Population — 2009 1,142,856
Labor Force — 2009 570,000
Jobless Rate — 2009 12.4 %
Total Private Payroll Jobs – 2nd Qtr. 2009317,851
Total Direct Green Jobs 9,545
Regional Green Jobs Highlights in Southwest Michigan • Green jobs account for 3.0 percent of total industry employment in the region. This is
similar to the state’s average green job share of 3.3 percent. With an estimated pool of 9,545 green jobs in 2009, the Southwest Michigan region accounts for roughly nine percent of all green jobs in Michigan.
• Around half of the green jobs in Southwest
Michigan are concentrated in the Increasing Energy Efficiency core area.
• The construction industry is a major source of
regional green jobs. Specialty trade contractors and Construction of buildings are among the top regional industries in green job creation.
• Farming, fishing, and forestry, Production, and
Construction and extraction occupations were the three most commonly reported green occupational categories in Southwest Michigan.
29

Distribution of Green Jobs by Core Area • In the Michigan Green Jobs Report, five green‐related core areas were identified and
defined. These included: (1) Clean Transportation and Fuels, (2) Increasing Energy Efficiency, (3) Pollution Prevention and Environmental Cleanup, (4) Agriculture and Natural Resources, and (5) Producing Renewable Energy.
Figure 1: Distribution of Green Jobs by Core Area for Michigan and Southwest Michigan
Southwest MichiganClean
Transportation & Fuels, 2% Pollution
Prevention & Environmental Cleanup, 9%
Producing Renewable Energy, 16%
Agriculture & Natural Resource
Conservation, 21%
Unspecified, 1%
Increasing Energy
Efficiency, 51%
Michigan
Clean Transportation & Fuels, 38%
Unspecified, 2%
Increasing Energy
Efficiency, 26%
Pollution Prevention & Environmental Cleanup, 13%
Agriculture & Natural Resource
Conservation, 13%
Producing Renewable Energy, 8%
Source: Michigan Department of Energy, Labor & Economic Growth • Unlike the state, green jobs in Southwest Michigan are mainly concentrated in the
Increasing Energy Efficiency (50.5 percent) core area. Included in this core area are firms engaged in, for example, insulation of buildings; adopting green building design/LEED certification; producing a household appliance, such as a refrigerator or dryer, which delivers the same performance using less electricity; and providing engineering, consulting, or research services on operations, materials, or technologies that improve energy efficiency.
• Statewide, the highest share of green jobs is in Clean Transportation and Fuels. This reflects
the statewide importance of the automotive industry in general, and specifically highlights the significant number of auto engineers, technicians, and production jobs involved in improving auto fuel economy and developing advanced automotive technologies.
30

Figure 2: Summary of Southwest Michigan Green Jobs by Core Area
Core Area Total
Green Jobs Percent Share of Total
Green Jobs
Total Green Jobs 9,545 100.0%
Increasing Energy Efficiency 4,816 50.5%
Agriculture and Natural Resource Conservation 1,982 20.8%
Producing Renewable Energy 1,567 16.4%
Pollution Prevention and Environmental Cleanup 844 8.8%
Clean Transportation and Fuels 232 2.4%
Green Jobs Not Assigned to a Core Area 103 1.1% Source: Michigan Department of Energy, Labor & Economic Growth
• Agriculture and Natural Resource Conservation is another key component of the green
economy in Michigan and Southwest Michigan, accounting for 25.7 percent and 20.8 percent of green jobs, respectively. Some of the regional businesses reporting green jobs in this core area include floriculture production, landscaping services, zoos, nature parks, and farms. Specific green job titles in this core area included farmworkers, conservation scientists, landscaping workers, environmental scientists, and more.
Green Jobs by Industry
Figure 3: Industries Generating Significant Green Job Levels — Southwest Michigan
Green Jobs as % of Industry Employment
NAICS Industry Total Green Jobs
Total Industry Employment
238 Specialty Trade Contractors 1,538 8,259 18.6%
541 Professional, Scientific, and Technical Services 1,144 12,362 9.3%
236 Construction of Buildings 1,096 2,669 41.1%
111 Crop Production 1,029 4,544 22.6%
325 Chemical Manufacturing 189 4,675 4.0%
321 Wood Product Manufacturing 90 958 Source: Michigan Department of Energy, Labor & Economic Growth
9.4%
• Among detailed industries, the greatest number of green jobs in Southwest Michigan is
found in the Specialty trade contractors sector. This sector includes many green building contractors, and activities related to weatherproofing homes for energy efficiency.
31

• Green jobs as a share of total employment are highest in the Construction of buildings (both residential and commercial/industrial) sector at 41.1 percent. Crop production comes in second, with 22.6 percent of the industry’s jobs categorized as “green” (see Figure 4).
Figure 4: Green Jobs as a Share of Total Industry Employment — Southwest Michigan
4.0%
9.3%
9.4%
18.6%
22.6%
41.1%
0.0% 10.0% 20.0% 30.0% 40.0% 50.0%
Chemical Manufacturing
Professional, Scientific, & TechnicalServices
Wood Product Manufacturing
Specialty Trade Contractors
Crop Production
Construction of Buildings
Source: Michigan Department of Energy, Labor & Economic Growth
Green Jobs by Occupation Figure 5: Occupational Groups Generating Significant Green Job Levels — Southwest Michigan
SOC Occupational Category Total Green
Jobs Percent of Total
Green Jobs All Green Occupations 9,545 100.0%
45‐0000 Farming, Fishing, & Forestry Occupations 1,815 19.0%
51‐0000 Production Occupations 1,625 17.0%
47‐0000 Construction & Extraction Occupations 1,561 16.4%
17‐0000 Architecture & Engineering Occupations 1,189 12.5%
49‐0000 Installation, Maintenance, & Repair Occupations 1,046 11.0%
11‐0000 Management Occupations 1,009 10.6%
19‐0000 Life, Physical, & Social Science Occupations 405 4.2%
53‐0000 Transportation & Material Moving Occupations 246 2.6% Source: Michigan Department of Energy, Labor & Economic Growth
32

• The occupations generating the largest number of green jobs in Southwest Michigan reflect a wide range of skills; from mid‐skill occupations in farming and manufacturing to high‐skill professional occupations.
• Nineteen percent of green jobs in Southwest Michigan are in Farming, fishing, and forestry
occupations (just over 1,800 jobs in 2009). This occupational category comprises farm managers and workers in green agriculture, fishing and hunting, and forest, conservation, and logging.
• There were more than 1,600 jobs in green Production occupations in Southwest Michigan in
2009, including production supervisors, assemblers, machine operators, and others.
Recruiting Difficulties
Figure 6: Which Green Occupations Do Employers Expect Recruiting Difficulties? Southwest Michigan
SOC Occupational Category Share of Firms Expecting Recruiting Difficulty
17‐0000 Architecture and Engineering Occupations 41.7% 11‐0000 Management Occupations 23.7% 19‐0000 Life, Physical, and Social Science Occupations 21.4% 47‐0000 Construction and Extraction Occupations 16.7% 49‐0000 Installation, Maintenance, and Repair Occupations 14.3% 45‐0000 Farming, Fishing, and Forestry Occupations 9.1% 51‐0000 Production Occupations 8.3%
Source: Michigan Department of Energy, Labor & Economic Growth • During the survey, employers were asked to indicate which occupations they anticipate
facing hiring difficulties. • The greatest difficulties in recruitment were anticipated within occupations requiring higher
education levels, such as Architecture and engineering, and Management. Smaller shares of employers indicated potential recruitment issues with mid‐skill jobs such as Construction and Installation, maintenance, and repair.
33

Unique Skills • Employers were also asked to indicate which green occupations require unique skills. The
percentages for each occupation in Figure 7 are the shares of employers who indicated that specialized knowledge was necessary for that occupation when working on a green project.
Figure 7: Occupations That Require Unique Skills for “Green Projects”– Southwest Michigan
15.4%
24.3%
36.4%
47.5%
48.0%
56.0%
57.1%
66.7%
0% 20% 40% 60% 80% 100%
Transportation & Material Moving
Production
Farming, Fishing, & Forestry
Management
Construction & Extraction
Architecture & Engineering
Installation, Maintenance & Repair
Life, Physical, & Social Science
Share of Firms Indicating Unique Skil ls Required
Source: Michigan Department of Energy, Labor & Economic Growth
• For the Southwest Michigan region, the top six occupational groups in Figure 7 that may
require unique green skills are a mix in terms of educational requirements, ranging from mid‐skill Installation and repair and Production occupations to high‐skill occupations in the Life, physical and social sciences. Some of the job titles reported in the green survey in Life, physical and social sciences included environmental scientists and technicians, geoscientists, hydrologists, and more.
34

Expectations for Job Growth • Employers surveyed were asked to indicate the total number of workers they expected to
employ in two years (by year 2011) for each green occupation reported.
Figure 8: Share of Employers Expecting Green Job Gains by 2011 – Southwest Michigan
SOC Occupational Category
Percent of Employers Reporting Occupation is Likely to Add Jobs
19‐0000 Life, Physical, and Social Science Occupations 52.9% 45‐0000 Farming, Fishing, and Forestry Occupations 50.0% 51‐0000 Production Occupations 38.5% 17‐0000 Architecture and Engineering Occupations 33.3% 47‐0000 Construction and Extraction Occupations 25.8% 53‐0000 Transportation and Material Moving Occupations 23.1% 49‐0000 Installation, Maintenance, and Repair Occupations 22.2% 11‐0000 Management Occupations 6.8%
Source: Michigan Department of Energy, Labor & Economic Growth
• Around half of the surveyed employers expected additional green jobs in Life, physical, and social sciences, and in Farming, fishing, and forestry occupations.
• More than a third of the polled employers expected job gains in Production occupations,
and in Architecture and engineering.
35

Training
• As noted during the statewide green jobs study, many green jobs are a “re‐tooling” of current jobs. As a result, many future “green jobs” will simply evolve from existing positions in the regional economy, and may be filled by current workers who will need additional training.
Figure 9: Anticipated Training Demand — Formal vs. Informal Training — Michigan vs. Southwest Michigan
Formal / Informal Training for Green Employment
26%
74%
32%
68%
0%
25%
50%
75%
100%
Formal Training Informal Training
Southwest Michigan
Michigan
Source: Michigan Department of Energy, Labor & Economic Growth
• Employers in Southwest Michigan may make greater use of informal on‐the‐job training for green occupations, partly due to the greater than average share of green construction jobs in the area.
• Southwest Michigan employers who participated in the survey indicated that about 74 percent of their green‐related training would be on‐the‐job (as compared to 68 percent statewide).
• Several colleges and universities across Michigan are developing green degree programs in Engineering, Public Health, and Natural Resources & Environment studies. For example, in Public Health, degree programs range in topics from industrial hygiene to environmental health to toxicology. A course in Appropriate Technology and Sustainability at Western Michigan University is being expanded to include design of “green roofing” as an energy conservation technique. The Michigan Technical Education Center at Kalamazoo Valley Community College has a Wind Turbine Technician Academy, which provides graduates with skills needed in the construction, operation and maintenance of utility size wind turbines. The program can be completed in approximately six months.
36

West Michigan Green Jobs Survey Results
Direct Green Jobs as a Share of Total Private
Jobs
2.0%
3.3%
0.0%
1.0%
2.0%
3.0%
4.0%
West Michigan Michigan
Quick Profile
Population — 2009 1,337,976
Labor Force — 2009 671,700
Jobless Rate — 2009 12.3 %
Total Private Payroll Jobs – 2nd Qtr. 2009475,353
Total Direct Green Jobs 9,509
Regional Green Job Highlights in West Michigan • According to the green jobs survey, there were 9,509 green jobs in the West Michigan
region, representing 2.0 percent of regional private employment. Statewide, there were 104,003 green jobs, accounting for 3.3 percent of statewide private jobs.
• In West Michigan, the majority of green jobs are concentrated in three core areas,
including: Increasing Energy Efficiency, Pollution Prevention and Environment Clean‐Up, and Agriculture and Natural Resource Conservation.
• Three industries, Specialty trade
contractors, Construction of buildings, and Transportation equipment manufacturing, provided a large number of West Michigan’s green jobs. Workers in these industries ranged from carpenters on green building projects to assemblers working on energy efficient products.
• While West Michigan may see growth in
green jobs, employers indicate they expected difficulty recruiting qualified candidates for some green positions. Similarly, employers indicate that many green jobs require unique skills.
37

Distribution of Green Jobs by Core Area • In the Michigan Green Jobs Report, five green‐related core areas were identified and
defined. These included: (1) Clean Transportation and Fuels, (2) Increasing Energy Efficiency, (3) Pollution Prevention and Environmental Cleanup, (4) Agriculture and Natural Resources, and (5) Producing Renewable Energy.
Figure 1: Distribution of Green Jobs by Core Area (Michigan and West Michigan)
Michigan
Clean Transportation & Fuels, 38%
Unspecified, 2%
Increasing Energy
Efficiency, 26%
Pollution Prevention & Environmental Cleanup, 13%
Agriculture & Natural Resource
Conservation, 13%
Producing Renewable Energy, 8%
West Michigan
Increasing Energy
Efficiency, 29%
Unspecified, 2%
Pollution Prevention & Environmental Cleanup, 24%
Agriculture & Natural Resource
Conservation, 23%
Producing Renewable Energy, 12%
Clean Transportation & Fuels, 11%
Source: Michigan Department of Energy, Labor & Economic Growth
• West Michigan’s mix of green jobs by core area differs from the statewide shares. While Clean Transportation and Fuels provides the most green jobs in Michigan, Increasing Energy Efficiency is the dominant core area in West Michigan, with 29 percent of green jobs. This is partially a reflection of West Michigan’s diversified economy, with a lower share of jobs in the auto sector. The auto industry in Michigan is the primary source of green jobs in Clean Transportation and Fuels.
• A major difference also exists in Pollution Prevention and Environmental Cleanup, which
accounts for almost twice the share of green jobs in West Michigan than statewide. This is likely due, in part, to the large presence of professional and business service establishments in West Michigan.
• Another difference was seen in Agriculture and Natural Resource Conservation, which
comprised just 13 percent of green jobs in Michigan but 23 percent of green employment in West Michigan. Much of this may be due to the concentration of agricultural jobs in some West Michigan counties and the number of sustainable farming establishments in the region.
38

Figure 2: Summary of West Michigan Green Jobs by Core Area
Core Area Total Green Jobs Percent Share of Total Green Jobs
Total Green Jobs 9,509 100.0% Increasing Energy Efficiency 2,745 28.9% Pollution Prevention and Environmental Cleanup 2,241 23.6% Agriculture and Natural Resource Conservation 2,211 23.3% Producing Renewable Energy 1,141 12.0% Clean Transportation and Fuels 1,010 10.6% Green Jobs Not Assigned to a Core Area 162 1.7%
Source: Michigan Department of Energy, Labor & Economic Growth
Green Jobs by Industry • Looking at the specific industries in which green jobs are concentrated can be useful.
According to the green job survey, a concentration of green jobs is generated by the construction sector. In fact, Specialty trade contractors and Construction of buildings were the detailed industries with the highest green employment levels, with 1,974 and 1,120 green jobs, respectively (Figure 3).
• Transportation equipment manufacturing recorded 1,027 green jobs – representing 8
percent of total jobs in that industry. Other manufacturing industries with lesser numbers of green jobs included Wood product manufacturing, Electrical equipment, appliance, and component manufacturing, and Fabricated metal product manufacturing, reflecting the diversity of West Michigan’s manufacturing sector.
• The survey identified 650 green jobs in the Waste management and remediation services industry, or about 43 percent of total jobs in that sector. Many of the green jobs in this industry are related to traditional waste disposal services, such as trash removal and recycling. In addition, some of the green jobs in this industry are related to medical waste disposal, supporting the rapidly growing health industry in West Michigan.
• Professional, scientific, and technical services was the fourth largest green industry, with
just over 600 green jobs. Green employment in this industry was in a wide range of businesses, and included occupations ranging from environmental lawyers to landscape architects and from scientists to engineers. The majority of these jobs, however, were in environmental consulting services and in landscape architectural services.
39

Figure 3: Industries Generating Significant Green Job Levels — West Michigan
NAICS Industry Total Green
Jobs Total Industry Employment
Green Jobs as % of Industry Employment
238 Specialty Trade Contractors 1,974 14,916 13.2% 236 Construction of Buildings 1,120 4,388 25.5% 336 Transportation Equipment Mfg. 1,027 12,034 8.5% 111 Crop Production 656 6,318 10.4% 562 Waste Management and Remediation Services 650 1,507 43.1% 541 Professional, Scientific, and Technical Services 648 19,074 3.4% 321 Wood Product Mfg. 343 1,981 17.3% 221 Utilities 83 1,996 4.2% 335 Electrical Equipment, Appliance, and Component Mfg. 77 956 8.1% 332 Fabricated Metal Product Mfg. 58 12,795 0.5%
Source: Michigan Department of Energy, Labor & Economic Growth
• In West Michigan, Waste management and remediation was the greenest industry, as measured by the largest share of total industry jobs that were considered green. (Figure 4)
• Construction of buildings and Specialty trade contractors were the second and fourth
greenest industries in West Michigan. Many of the green jobs in these industries are related to new green building projects and retrofitting existing buildings to be more energy efficient.
Figure 4: Green Jobs as a Share of Total Industry Employment — West Michigan
0.5%
3.4%
4.2%
8.1%
8.5%
10.4%
13.2%
17.3%
25.5%
43.1%
0% 10% 20% 30% 40% 50%
Fabricated Metal Product Manufacturing
Professional, Scientific, and Technical Serv.
Util ities
Elect. Equip., Appliance, and Component Mfg.
Transportation Equipment Mfg.
Crop Production
Specialty Trade Contractors
Wood Product Mfg.
Construction of Buildings
Waste Management and Remediation Serv.
Source: Michigan Department of Energy, Labor & Economic Growth
40

Green Jobs by Occupation • With total green employment in West Michigan measuring 9,509, individuals in green
positions can be found in several different occupations. The largest green categories were Construction and extraction, Production, and Installation, maintenance, and repair occupations.
• These occupational categories were responsible for nearly 60 percent of total green
employment. Individuals in these occupations ranged from carpenters to team assemblers. • Management and Architectural and engineering occupations were also large green
categories with 709 green jobs and 519 green employees, respectively.
Figure 5: Occupational Groups Generating Significant Green Job Levels — West Michigan
SOC Occupational Category Total Green
Jobs
Percent of Total Green
Jobs All Green Occupations 9,509 100.0% 47‐0000 Construction and Extraction Occupations 2,037 21.4% 51‐0000 Production Occupations 1,664 17.5% 49‐0000 Installation, Maintenance, and Repair Occupations 1,643 17.3% 45‐0000 Farming, Fishing, and Forestry Occupations 887 9.3% 11‐0000 Management Occupations 709 7.5% 17‐0000 Architecture and Engineering Occupations 691 7.3% 41‐0000 Sales and Related Occupations 519 5.5% 19‐0000 Life, Physical, and Social Science Occupations 328 2.6% 53‐0000 Transportation and Material Moving Occupations 249 2.6%
Source: Michigan Department of Energy, Labor & Economic Growth
Recruiting Difficulties • Despite recessionary conditions, some employers expect to face difficulty when recruiting
for certain occupations. For instance, 20 percent of employers indicate that they expect difficulty recruiting qualified candidates for green Production occupations.
• Difficulty recruiting can encompass having a difficult time finding job candidates with the
requisite skills as well as finding job candidates with an interest or knowledge of the position. In both cases, recruiting difficulties can be mitigated by publicizing opportunities for green jobs and the skills that are required for those opportunities.
41

Figure 6: Which Green Occupations Do Employers Expect Recruiting Difficulties? West Michigan
SOC Occupational Category Share of Firms Expecting Recruiting Difficulty
51‐0000 Production Occupations 20.6% 17‐0000 Architecture and Engineering Occupations 17.1% 47‐0000 Construction and Extraction Occupations 11.4%
Source: Michigan Department of Energy, Labor & Economic Growth
Unique Skills • In some cases, job candidates applying to work on green‐related projects will need special
skills. Employers report that unique skills are required in a number of occupations ranging from production to management job titles.
Figure 7: Occupations That Require Unique Skills for “Green Projects” – West Michigan
25.0%
33.3%
51.2%
55.9%
66.7%
70.3%
72.7%
0% 10% 20% 30% 40% 50% 60% 70% 80%
Sales and Related
Installation, Maintenance, and Repair
Management
Construction and Extraction
Production
Architecture and Engineering
Life, Physical, and Social Science
Share of Firms Indicating Unique Skil ls Required
Source: Michigan Department of Energy, Labor & Economic Growth
• Life, physical, and social science occupations were the most commonly reported group with
73 percent of employers indicating that unique knowledge and skills were required to perform green job duties.
42

• Similarly, 70 percent of employers report that Architecture and engineering occupations require unique green skills. These occupations – in particular – will play a key role in the green economy as green architecture and green engineering will invent, design, and implement green technologies. These occupations are also employed in a variety of industries, including construction and manufacturing.
• Construction and extraction occupations and Installation, maintenance, and repair
occupations are among those that employers indicate require unique skills. Workers in these occupations will need to be familiar with green building and installation techniques, such as the selection of green building materials and the installation and repair of energy efficient production components.
Expectations for Job Growth • Michigan’s green economy is showing signs of growth. In West Michigan, some surveyed
employers were mildly optimistic about employment prospects. For example, 37 percent of employers with green Production occupations expect to add jobs in the next two years. Similarly, 33 percent of employers expected to add green‐related Construction and extraction jobs.
• In addition, 20 percent of employers with green Management positions and 28 percent with
green Architecture and engineering jobs expected higher job levels in these occupations in two years.
Figure 8: Share of Employers Expecting Green Job Gains by 2011 – West Michigan
SOC Occupational Category
Percent of Employers Reporting Occupation is
Likely to Add Jobs 51‐0000 Production Occupations 37.1% 47‐0000 Construction and Extraction Occupations 33.3% 19‐0000 Life, Physical, and Social Science Occupations 28.6% 17‐0000 Architecture and Engineering Occupations 27.9% 49‐0000 Installation, Maintenance, and Repair Occupations 27.3% 11‐0000 Management Occupations 20.8% 41‐0000 Sales and Related Occupations 20.0% 45‐0000 Farming, Fishing, and Forestry Occupations 7.1%
Source: Michigan Department of Energy, Labor & Economic Growth
43

Training • Statewide, employers indicated that 32 percent of training of green workers might take
place using formal sources of training such as community colleges while 68 percent of activity would be informal on‐the‐job training.
• West Michigan employers indicated a very similar potential distribution of formal (33
percent) versus informal (67 percent) training.
Figure 9: Anticipated Training Demand — Formal vs. Informal Training — West Michigan
Formal / Informal Training for Green Employment
33%
67%
32%
68%
0%
25%
50%
75%
100%
Formal Training Informal Training
West Michigan
Michigan
Source: Michigan Department of Energy, Labor & Economic Growth
44
Mid‐Michigan Green Jobs Survey Results
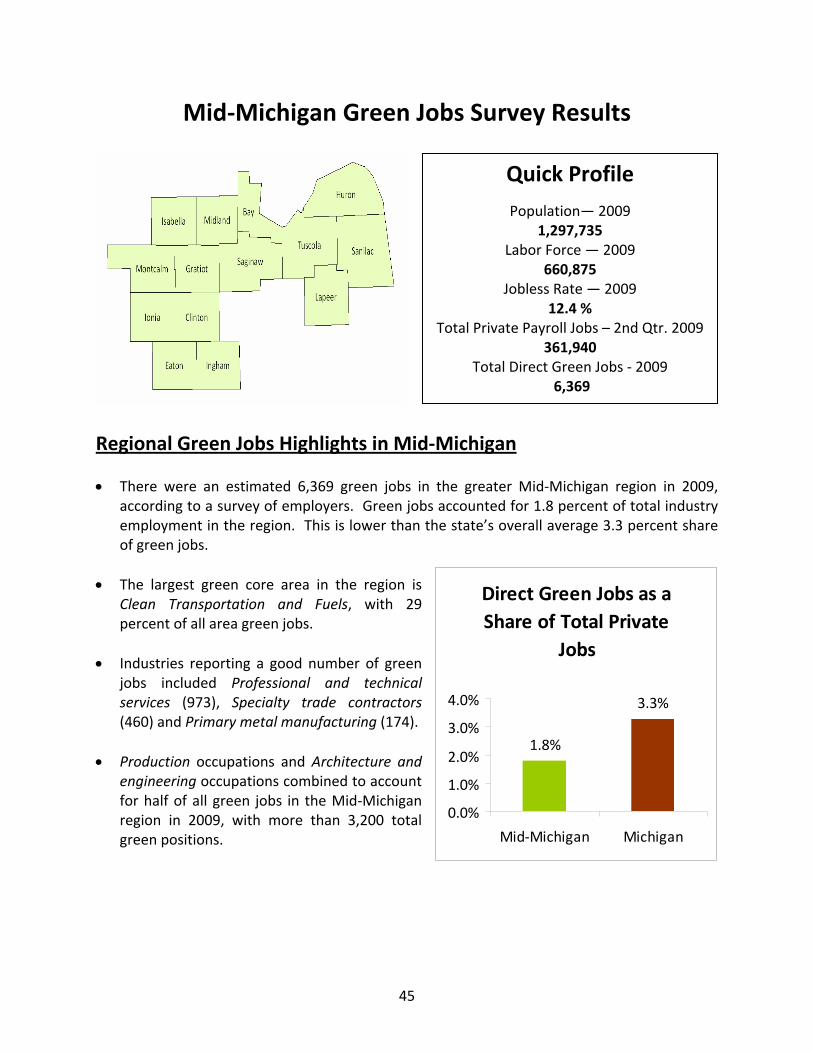
Quick Profile
Population— 2009 1,297,735
Labor Force — 2009 660,875
Jobless Rate — 2009 12.4 %
Total Private Payroll Jobs – 2nd Qtr. 2009361,940
Total Direct Green Jobs ‐ 2009 6,369
Regional Green Jobs Highlights in Mid‐Michigan • There were an estimated 6,369 green jobs in the greater Mid‐Michigan region in 2009,
according to a survey of employers. Green jobs accounted for 1.8 percent of total industry employment in the region. This is lower than the state’s overall average 3.3 percent share of green jobs.
Direct Green Jobs as a Share of Total Private
Jobs
1.8%
3.3%
0.0%
1.0%
2.0%
3.0%
4.0%
Mid‐Michigan Michigan
• The largest green core area in the region is Clean Transportation and Fuels, with 29 percent of all area green jobs.
• Industries reporting a good number of green
jobs included Professional and technical services (973), Specialty trade contractors (460) and Primary metal manufacturing (174).
• Production occupations and Architecture and
engineering occupations combined to account for half of all green jobs in the Mid‐Michigan region in 2009, with more than 3,200 total green positions.
45

Distribution of Green Jobs by Core Area • In the Michigan Green Jobs Report, five green‐related core areas were identified and
defined. These included: (1) Clean Transportation and Fuels, (2) Increasing Energy Efficiency, (3) Pollution Prevention and Environmental Cleanup, (4) Agriculture and Natural Resources, and (5) Producing Renewable Energy.
Figure 1: Distribution of Green Jobs by Core Area (Michigan and Mid‐Michigan)
Michigan
Clean Transportation & Fuels, 38%
Unspecified, 2%
Increasing Energy
Efficiency, 26%
Pollution Prevention & Environmental Cleanup, 13%
Agriculture & Natural Resource
Conservation, 13%
Producing Renewable Energy, 8%
Mid‐Michigan
Clean Transportation & Fuels, 29%
Unspecified, 1%
Producing Renewable Energy, 21%
Increasing Energy
Efficiency, 19%
Agriculture & Natural Resource
Conservation, 16%
Pollution Prevention & Environmental Cleanup, 14%
Source: Michigan Department of Energy, Labor & Economic Growth • The Mid‐Michigan shares of green jobs by core area differ somewhat from Michigan’s mix.
While Clean Transportation and Fuels dominates all green jobs for both areas, only 29 percent of green jobs in Mid‐Michigan fall under this category compared to 38 percent statewide. While the Mid‐Michigan region has contributed greatly to the state’s auto industry, the significant number of green jobs in this industry in Southeast Michigan produces the larger share in this core area observed statewide.
• The region also has a lower share of green jobs in the Increasing Energy Efficiency core area,
with only a 19 percent regional share of total green jobs versus 26 percent statewide. Nearly 1,200 jobs across the area are estimated to be involved in goods and services that aim to improve energy efficiency.
46

• The Mid‐Michigan region outpaces the state in the share of green jobs related to Renewable Energy. The state only has about 8 percent of total green jobs in this core area, while the greater Mid‐Michigan region generates one out of every five green jobs from this category. Initiatives ranging from the increased focus on wind energy in the Thumb Region to solar power equipment production in Montcalm County contribute to local green jobs in this core area.
Figure 2: Summary of Mid‐Michigan Green Jobs by Core Area
Core Area Total
Green Jobs Percent Share of Total
Green Jobs
Total Green Jobs 6,369 100.0%
Clean Transportation and Fuels 1,872 29.4%
Producing Renewable Energy 1,336 21.0%
Increasing Energy Efficiency 1,187 18.6%
Agriculture and Natural Resource Conservation 994 15.6%
Pollution Prevention and Environmental Cleanup 887 13.9%
Green Jobs Not Assigned to a Core Area 92
Source: Michigan Department of Energy, Labor & Economic Growth
1.4%
Green Jobs by Industry
Figure 3: Industries Generating Significant Green Job Levels – Mid‐Michigan
NAICS Industry Total Green
Jobs
Total Industry
Employment
Green Jobs as % of Industry
Employment
541 Professional, Scientific, and Technical Services 973 15,149 6.4%
238 Specialty Trade Contractors 460 10,109 4.6%
331 Primary Metal Manufacturing 174 1,881 9.3% Source: Michigan Department of Energy, Labor & Economic Growth
• Three industries producing significant numbers of green jobs in the Mid‐Michigan region are displayed in Figure 3 above. These three sectors alone accounted for a combined total of over 1,600 green jobs in the region, or about one out of every four total green positions.5
• Professional, scientific and technical services topped the list of publishable green industries in terms of total green jobs, accounting for nearly 1,000 such positions in 2009. Jobs in engineering, architecture, environmental consulting and scientific research and
5 Due to the limited number of reporting companies, not all industry sectors were publishable due to confidentiality and statistical criteria. In some cases, larger green industries may exist.
47

development all contributed to this sector’s standing among the top green industries in the region.
• Specialty trade contractors contributed almost 500 green jobs in the region in 2009, while Primary metal manufacturing chipped in roughly 200 additional jobs to the green economy. Combined, these two detailed industries accounted for one out of every 10 green jobs in the region.
• Not only do the industry sectors listed hold a good number of green jobs overall, but they
also have high concentrations of these positions relative to their overall employment. Green jobs make up anywhere from 4.6 to 9.3 percent of total employment within these industries, much higher than the 1.8 percent share of green jobs versus total private employment overall.
• Other key industry sectors that failed to meet publishability criteria for the table above
employ a large number of green workers in Mid‐Michigan and deserve mention. These include Wood product manufacturing, Nonmetallic mineral product manufacturing and Transportation equipment manufacturing. These industries combined accounted for roughly half of all green jobs in the area.
Green Jobs by Occupation
Figure 5: Occupational Groups Generating Significant Green Job Levels – Mid‐Michigan
SOC Occupational Category Total Green
Jobs Percent of Total
Green Jobs
All Green Occupations 6,369 100.0%
51‐0000 Production Occupations 2,016 31.7%
17‐0000 Architecture and Engineering Occupations 1,238 19.4%
47‐0000 Construction and Extraction Occupations 740 11.6%
19‐0000 Life, Physical, and Social Science Occupations 546 8.6%
49‐0000 Installation, Maintenance, and Repair Occupations 455 7.1%
53‐0000 Transportation and Material Moving Occupations 275 4.3%
11‐0000 Management Occupations 182 2.9% Source: Michigan Department of Energy, Labor & Economic Growth
• Production occupations generate the largest number of opportunities for green workers in
the region, with roughly 2,000 jobs or almost one‐third of total green jobs in the region. These jobs are likely to be involved in both the production of more fuel‐efficient motor vehicles or parts and the manufacturing of products for clean renewable energy production, such as solar panel components and wind turbines and related components.
48

• Architecture and engineering occupations will also play a key role in the green economy, as companies will look both to engineers in‐house and from outside consulting agencies for improvements in energy usage and in the production of renewable or clean energy. Engineers are expected to contribute substantially to newer, cleaner technologies in the auto industry as well.
Recruiting Difficulties
Figure 6: Which Green Occupations Do Employers Expect Recruiting Difficulties? – Mid‐Michigan
SOC Occupational Category Share of Firms Expecting Recruiting Difficulty
47‐0000 Construction and Extraction Occupations 36.4%
51‐0000 Production Occupations 36.0%
11‐0000 Management Occupations 25.0%
17‐0000 Architecture and Engineering Occupations 14.8% Source: Michigan Department of Energy, Labor & Economic Growth
• The concept of the green economy is a relatively new one and green knowledge and skills
are not common within the current available labor pool. Because of this, employers across several industries are anticipating at least some difficulty in recruiting qualified workers in green occupations.
• Construction and Production occupations tended to be the most commonly reported job
classifications that employers had concerns with recruiting difficulty in the Mid‐Michigan region. Over one third of employers that answered the recruiting question regarding green employment in each of these occupational groups expect to have some difficulty getting the right type of workers for these jobs. In construction, it is well known that certifications in green building concepts (such as LEED certification) can provide barriers to worker recruitment. With production occupations, it’s possible that at least some specific knowledge of unique components and/or materials may be required of workers in jobs that typically attract only minimally trained jobseekers.
• Green opportunities in Management occupations and Architecture and engineering
occupations also may be difficult to fill as well. Specific green knowledge and skills as well as the fact that these occupations have generally extensive education and training requirements (aside from just green concepts) are the likely reasons for this.
49

Unique Skills
Figure 7: Occupations That Require Unique Skills for “Green Projects” – Mid‐Michigan
79.2%
83.3%
88.5%
92.0%
0% 20% 40% 60% 80% 100%
Production
Construction andExtraction
Architecture andEngineering
Management
Share of Firms Indicating Unique Skil ls Required
Source: Michigan Department of Energy, Labor & Economic Growth
• Mid‐Michigan employers from several occupational groups answered affirmatively to
whether green jobs will require unique skills. Management occupations were the most commonly reported group with 92 percent of employers indicating that green managerial jobs require specific green knowledge and skills.
• Architecture and engineering occupations were nearly as likely (89 percent) to require
unique skills when applied to a green project. Because energy efficiency will be largely driven by products and processes that minimize material and energy usage, engineers and architects will have a key role in the green economy. Engineers will also be very important in clean transportation developments and technology, as well as renewable energy production, all of which will depend on very specific green knowledge and ideas.
• Construction occupations (83 percent reported as needing specific skills) and Production
occupations (79 percent) also are more likely to demand specific green skills compared to other green occupations. It’s clear from the survey that even these typically mid‐skill positions may require specific knowledge when working on green projects. This shows that green skill and knowledge sets will be important across the occupational spectrum, and not just in professional and technical occupations.
50

Expectations for Job Growth
Figure 8: Share of Employers Expecting Green Job Gains by 2011 – Mid‐Michigan
SOC Occupational Category Percentage of Employers Reporting Occupation is
Likely to Add Jobs
47‐0000 Construction and Extraction Occupations 33.3%
49‐0000 Installation, Maintenance, and Repair Occupations 30.0%
51‐0000 Production Occupations 20.7%
17‐0000 Architecture and Engineering Occupations 14.3%
53‐0000 Transportation and Material Moving Occupations 10.0%
11‐0000 Management Occupations 8.0% Source: Michigan Department of Energy, Labor & Economic Growth
• While the anticipated growth of the green economy is difficult to quantify, the survey
was able to pinpoint occupational groups that employers expected to see some job gains from 2009 to 2011.
• In spite of the fact that overall business and consumer expectations for the economy as
a whole are currently conservative at best, employers registered some optimism for green opportunities according to the Michigan Green Jobs survey. In Mid‐Michigan, roughly one out of every three employers that answered the survey question on employment expectations for Construction and Installation and maintenance occupations anticipate that green job levels within those categories will grow through 2011.
• One fifth of employers reporting future green Production positions expect to see growth
in these jobs during this period. This is at least partially due to the lowering demand for labor in the manufacturing of traditional products and the potential utilization of existing excess labor supply and production facilities to help support green technologies such as solar panels and wind turbines.
51

Training
Figure 9: Anticipated Training Demand — Formal vs. Informal Training Michigan vs. Mid‐Michigan
Formal / Informal Training for Green Employment
35%
65%
32%
68%
0%
25%
50%
75%
100%
Formal Training Informal Training
Mid‐Michigan
Michigan
Source: Michigan Department of Energy, Labor & Economic Growth
• There is essentially little difference between the Mid‐Michigan region and Michigan
overall in terms of the anticipated training of green workers. Employers statewide responded that roughly 32 percent of green training would take the shape of formal educational and vocational programs. Mid‐Michigan employers expect a slightly higher, though similar proportion (35 percent) of green training to be through formal programs designed specifically for the green economy.
• The vast majority of training in greater Mid‐Michigan in terms of specific green skills will
take place informally or on‐the‐job. Area employers expect that almost two‐thirds of green training will take place in this form, as is the case statewide.
52

Northern Michigan Green Jobs Survey Results
Quick Profile
Population — 2009 883,364
Labor Force — 2009 434,750
Jobless Rate — 2009 13.7 %
Total Private Payroll Jobs – 2nd Qtr. 2009228,329
Total Direct Green Jobs 9,811
Regional Green Jobs Highlights in Northern Michigan • Green jobs represent 4.3 percent of total industry employment in Northern Michigan. This
is one percent above the state’s average green job share of 3.3 percent. As might be expected due to the smaller share of the statewide population residing in Northern Michigan, the region only accounts for 9.4 percent of direct green jobs in Michigan.
• Considering the abundance of natural
resources in Northern Michigan, it is no surprise that more than 80 percent of green jobs in the region are concentrated in: Increasing Energy Efficiency (31.6 percent), Agriculture and Natural Resource Conservation (26.1 percent), and Pollution Prevention and Environmental Cleanup (23.2 percent).
Direct Green Jobs as a Share of Total Private
Jobs
4.3%3.3%
0.0%
2.0%
4.0%
6.0%
NorthernMichigan
Michigan
• Industries and occupations related to
construction contributed greatly to the local green economy. Construction has a large impact on the Increasing Energy Efficiency core area, as homeowners and businesses become more aware of energy efficient and environmentally‐sound building construction options.
53

Distribution of Green Jobs by Core Area • In the Michigan Green Jobs Report, five green‐related core areas were identified and
defined. These included: (1) Clean Transportation and Fuels, (2) Increasing Energy Efficiency, (3) Pollution Prevention and Environmental Cleanup, (4) Agriculture and Natural Resources, and (5) Producing Renewable Energy.
Figure 1: Distribution of Green Jobs by Core Area for Michigan and Northern Michigan
Michigan
Clean Transportation & Fuels, 38%
Unspecified, 2%
Increasing Energy
Efficiency, 26%
Pollution Prevention & Environmental Cleanup, 13%
Agriculture & Natural Resource
Conservation, 13%
Producing Renewable Energy, 8%
Northern Michigan
Unspecified, 3%
Producing Renewable Energy, 14%
Pollution Prevention & Environmental Cleanup, 23%
Agriculture & Natural Resource
Conservation, 26%
Clean Transportation & Fuels, 2%
Increasing Energy
Efficiency, 32%
Source: Michigan Department of Energy, Labor & Economic Growth • There are 9,811 total green jobs in Northern Michigan. Due to the distinct economic
structure of the region, the distribution of green jobs in the region is starkly different from statewide averages.
• With the dominance of the auto industry in Southeast Michigan, Clean Transportation and
Fuels was the largest core area in Michigan with 38.1 percent of green jobs. However, this core area accounts for just 2.4 percent of green jobs in Northern Michigan.
• Nearly one third of total green jobs in Northern Michigan were in the Increasing Energy
Efficiency core area. Due to high energy prices and the focus on climate change, firms producing products or services that enhance energy efficiency exist throughout the state. The Increasing Energy Efficiency core area boasts roughly 26,800 jobs in Michigan and was the state’s second largest core area.
54

Figure 2: Summary of Northern Michigan Green Jobs by Core Area
Core Area Total
Green Jobs Percent Share of Total Green
Jobs
Total Green Jobs 9,811 100.0%
Increasing Energy Efficiency 3,098 31.6%
Agriculture and Natural Resource Conservation 2,562 26.1%
Pollution Prevention and Environmental Cleanup 2,272 23.2%
Producing Renewable Energy 1,364 13.9%
Green Jobs Not Assigned to a Core Area 276 2.8%
Clean Transportation and Fuels 239 2.4% Source: Michigan Department of Energy, Labor & Economic Growth
Green Jobs by Industry
• The top three industries in Figure 3 provided about 55 percent of total regional green jobs. Several diverse sectors in the region contain green jobs.
Figure 3: Industries Generating Significant Green Job Levels — Northern Michigan
NAICS Industry Total Green
Jobs
Total Industry
Employment
Green Jobs as % of Industry Employment
238 Specialty Trade Contractors 2,318 7,697 30.1% 541 Professional, Scientific, and Technical Services 1,684 7,406 22.7% 236 Construction of Buildings 1,400 4,009 34.9% 423 Merchant Wholesalers, Durable Goods 267 2,789 9.6% 111 Crop Production 229 952 24.0% 813 Religious, Grantmaking, Civic, Prof., & Similar Organizations 217 4,064 5.4% 321 Wood Product Manufacturing 138 2,983 4.6% 115 Support Activities for Agriculture and Forestry 108 320 33.6%
Source: Michigan Department of Energy, Labor & Economic Growth
• The Construction industry provided a large share of the green jobs in Northern Michigan as the Specialty trade contractors and Construction of buildings sectors combined for more than 3,700 green jobs. There has been a movement towards “green buildings” as residents and businesses look for ways to cut utility costs and become more environmentally responsible.
• Professional, scientific, and technical services firms were also a prominent source of green jobs in Northern Michigan. This broad industrial category supplied 1,684 green jobs in the region. A majority of these jobs provided consulting or surveying services in various components of the green economy.
55

• Green jobs within the Religious and grant making sector were minimal, accounting for only
217 positions. Establishments in this industry are primarily small and interest‐specific.
Figure 4: Green Jobs as a Share of Total Industry Employment – Northern Michigan
4.6%
5.4%
9.6%
22.7%
24.0%
30.1%
33.6%
34.9%
0.0% 10.0% 20.0% 30.0% 40.0%
Wood Product Manufacturing
Religious, Grantmaking, Civic,Professional, & Similar Organizations
Merchant Wholesalers, Durable Goods
Professional, Scientific, & TechnicalServices
Crop Production
Specialty Trade Contractors
Support Activities for Agriculture &Forestry
Construction of Buildings
Source: Michigan Department of Energy, Labor & Economic Growth
• Not only does the Construction industry provide the largest number of green jobs in the
region, a significant share of construction jobs may be related to the green economy. Nearly 35 percent of total regional employment in the Construction of buildings sector was green. Specialty trade contractors also boast an impressive share of green jobs with 30 percent of local employment considered green.
• Relatively large shares of jobs in the Agricultural sector appear to be green‐related.
One out of every three jobs in the Support activities for agriculture and forestry sector was green‐related, while about a quarter of the industry employment in Crop production was engaged in green activities.
• Due to the wide scope of the Professional, scientific, and technical services sector, a
significant share of jobs in the sector are related to the green economy. Some specific examples of detailed industries providing regional green jobs were environmental consulting and architecture‐related services.
56

Green Jobs by Occupation
• The top five broad occupational groups supplied approximately three‐fourths of total green jobs in the region.
Figure 5: Occupational Groups Generating Significant Green Job Levels ‐ Northern Michigan
SOC Occupational Category Total Green
Jobs Percent of Total
Green Jobs
Total, All Green Occupations 9,811 100%
47‐0000 Construction and Extraction Occupations 2,668 27.2%
17‐0000 Architecture and Engineering Occupations 1,383 14.1%
51‐0000 Production Occupations 1,355 13.8%
49‐0000 Installation, Maintenance, and Repair Occupations 1,063 10.8%
11‐0000 Management Occupations 941 9.6%
45‐0000 Farming, Fishing, and Forestry Occupations 458 4.7%
53‐0000 Transportation and Material Moving Occupations 402 4.1%
41‐0000 Sales and Related Occupations 387 3.9%
19‐0000 Life, Physical, and Social Science Occupations 379 3.9% Source: Michigan Department of Energy, Labor & Economic Growth
• With the construction industry being one of the biggest employment providers of green
jobs, Construction and extraction occupations registered the largest number of green jobs in Northern Michigan, accounting for 27.2 percent (2,668) of regional green jobs.
• Occupations in Architecture and engineering (1,383), Production (1,355), and Installation,
maintenance, and repair (1,063), also generated a significant number of local green jobs. Many of the occupations in Production and Installation, maintenance, and repair are mid‐skill jobs that only require a short period of training.
57

Recruiting Difficulties
Figure 6: Which Green Occupations Do Employers Expect Recruiting Difficulties? Northern Michigan
SOC Occupational Category Share of Firms Expecting Recruiting Difficulty
45‐0000 Farming, Fishing, and Forestry Occupations 36.4%
17‐0000 Architecture and Engineering Occupations 24.0%
49‐0000 Installation, Maintenance, and Repair Occupations 23.1%
19‐0000 Life, Physical, and Social Science Occupations 13.3%
11‐0000 Management Occupations 7.7%
51‐0000 Production Occupations 3.6%
47‐0000 Construction and Extraction Occupations 2.2% Source: Michigan Department of Energy, Labor & Economic Growth
• Recruiting difficulties for future green jobs will encompass various levels of education and
training. • The green economy provides new opportunities for Architecture and engineering
occupations, and 24 percent of responding employers in Northern Michigan anticipate potential recruiting difficulty for these occupations. The majority of these are high skilled occupations that generally require at least a four‐year degree.
• A significant percentage of responding employers indicated that they expect to have
difficulties filling vacancies for Farming, fishing, and forestry (36.4 percent) and Installation, maintenance, and repair (23.1 percent) occupations. In contrast to occupations in Architecture and engineering, many of these jobs are in mid‐skill occupations, and workers may only need on‐the‐job preparation.
58

Unique Skills Figure 7: Occupations That Require Unique Skills for “Green Projects” – Northern Michigan
50.0%
55.0%
65.0%
66.0%
71.0%
79.0%
82.0%
0% 20% 40% 60% 80% 100%
Production
Farming, Fishing, and Forestry
Management
Construction and Extraction
Architecture and Engineering
Installation, Maintenance, and Repair
Life, Physical, and Social Science
Share of Firms Indicating Unique Skills Required
Source: Michigan Department of Energy, Labor & Economic Growth
• Employers were asked to identify occupations that required unique skills when working on
green‐related projects. In Northern Michigan, seven broad occupational categories had at least half of responding employers indicating unique skills were needed for green‐related projects.
• Occupations in Life, physical, and social science appear to require the most specialized skills
when working on green projects with 82 percent of responding employers indicating a need. This supports the statewide result, which had environmental scientist as the occupation with the largest share of responding employers requiring specialized skills for green projects.
• Responding employers in Northern Michigan signified Installation, maintenance, and repair
as one of the top broad occupational categories that would most likely have green specialization needs. In contrast, employers throughout the state did not identify specific occupations within this category as among the top occupations needing more specialized training.
59

Expectations for Job Growth
Figure 8: Share of Employers Expecting Green Job Gains by 2011 – Northern Michigan
SOC Occupational Category Percent of Employers Reporting Occupation is Likely to Add Jobs
17‐0000 Architecture and Engineering Occupations 50.0%
19‐0000 Life, Physical, and Social Science Occupations 47.4%
45‐0000 Farming, Fishing, and Forestry Occupations 40.0%
47‐0000 Construction and Extraction Occupations 40.0%
41‐0000 Sales and Related Occupations 35.7%
51‐0000 Production Occupations 34.2%
49‐0000 Installation, Maintenance, and Repair Occupations 29.4%
11‐0000 Management Occupations 22.2%
53‐0000 Transportation and Material Moving Occupations 10.0%
Source: Michigan Department of Energy, Labor & Economic Growth
• Employers in Michigan anticipate that Engineering and Construction occupations are among the most likely to add green‐related jobs in the near future and employers in Northern Michigan support this conclusion.
• In Northern Michigan, half of the responding employers with green Architecture and
engineering workers projected growth for this occupational category in the near future. The majority of occupations within this broad category require mid to high skill levels, such as civil engineers and surveying and mapping technicians.
• Even with the recent declines in the Construction Industry, 40 percent of Construction and
extraction employers in Northern Michigan expect some job gains in their green workforce through 2011.
• Only ten percent of regional employers anticipate job gains among Transportation and
material moving occupations in the green economy as the recession stifled consumer demand. Most of the jobs in this occupation are related to the movement of goods from producers to consumers.
60

Training
Figure 9: Anticipated Training Demand — Formal vs. Informal Training Michigan vs. Northern Michigan
Formal / Informal Training for Green Employment
29%
71%
32%
68%
0%
25%
50%
75%
100%
Formal Training Informal Training
Northern Michigan
Michigan
Source: Michigan Department of Energy, Labor & Economic Growth
• Firms were asked to estimate what percentage of their training needs for “green‐related” employees would be formal (provided by community colleges or outside training providers) or informal (on‐the‐job) training.
• The majority of the firms surveyed anticipate needing a mix of informal and formal
training for the future “green” workforce. However, a larger share of the training may be conducted on‐site.
• The statewide results were very similar to the results in Northern Michigan. In Northern
Michigan, 71 percent of future training needs for the local green economy may be conducted on‐the‐job. The statewide results were slightly lower, indicating 68 percent of the training may be informal.
• As part of the growing list of green jobs training providers in the state, Northwestern
Michigan College in Traverse City provides a unique training program combining both classroom and hands‐on experience. Two of their training programs are the Solar Photovoltaic (PV) Electric System and Residential Energy Assessment programs.
61

• Northwestern Michigan College is also committed to educating the public on ways to incorporate green activities in their daily lives. One of eight demonstration centers in Michigan is located at Northwestern Michigan College. These centers provide the public information and demonstrations on renewable energy, green building solutions, and other green‐related topics.
62

Appendix 1: Michigan Regions
Source: Michigan Department of Energy, Labor & Economic Growth
63