llqp examination report · llqp examination report prepared by: dr. edwin l. weinstein mr. travis...
TRANSCRIPT

LLQP Examination Report
Prepared By:
Dr. Edwin L. Weinstein Mr. Travis Taylor
May 2003
LLQP Examination Review The Brondesbury Group

Table of Contents
0.0 EXECUTIVE SUMMARY 3
1.0 INTRODUCTION 61.1 Overview of The Study 71.2 Methodology - SME Review 81.3 Methodology - Statistical Review 9
2.0 CONTENT REVIEW 112.1 Is The Intended Content Measured 132.2 Are Bloom Levels Hitting Their Target 152.3 Are The Scenarios Realistic 162.4 Is the Level of Item Difficulty Appropriate 172.5 How Effective Are The Distracters 192.6 Are Reading Levels Appropriate 20
3.0 STATISTICAL REVIEW 213.1 Are The Items & Scales Well Constructed 233.2 Is The Level of Item Difficulty Appropriate 283.3 Does Reading Affect Performance 303.4 What Is The Impact of the Bloom Level 323.5 How Does Test Form Affect Performance 333.6 How Can We Set Passing Scores 35
4.0 CONCLUSIONS & RECOMMENDATIONS 384.1 Conclusions - Six Major Questions 394.2 Conclusions - The Consultant View 404.3 Recommendations 41
LLQP Examination Review The Brondesbury Group Page 2

EXECUTIVESUMMARY
LLQP Examination Review The Brondesbury Group Page 3

0.0 EXECUTIVE SUMMARY
• To quote from the original Terms of Reference, this study is primarily designed “to ensure that the questions in the Life License Qualification Program (LLQP) examination are fair and reflect experiences that are likely to be encountered by a new life and/or accident and sickness (A&S) agent.”
• The report includes a Content Review that focuses on issues related to question content and draws on the opinions of ten Subject-Matter Experts (SMEs). Quite often we compare the opinions of the SMEs to the performance of examinees, in order to gain a better understand-ing of the appropriateness of content.
• We then move to a Statistical Review of the items on the examination using the responses of some 1350 examinees to provide the evidence we need.
• The Conclusions & Recommendations in chapter 4 will show that this is a well-constructed test, but that it will benefit from improvements to items in a number of areas. We also offer a number of recommenda-tions that will help ensure that examinees can perform on this test to the best of their capabilities.
Content Review
� Some 8 out of 10 SMEs agreed with the blueprint content classifica-tion, but each item touched on an average of 1.6 content areas. Crossing content domains is desirable for an exam that aims to test more advanced learning. Nonetheless, the multi-domain nature of the items should be recognized to ensure that the collection of items continues to faithfully represent the content proportions set out in the design blueprint.
• The biggest concern from the content analysis is the A&S exam. While there was good agreement that the A&S items did represent the content areas that the Blueprint intended them to represent, two-thirds of A&S items were found to touch on content from excluded content areas.
• SMEs are clearly having difficulty distinguishing between upper Bloom Levels. Effectively, SMEs only distinguish between two Bloom Levels: 3 and 4-6.
• On the whole, SMEs felt the scenarios were clear and had sufficient information for assessing insurance needs. Only 4 items from the full exam were rated as a bad fit by more than one-third of SMEs. Some 3 of the 4 poorly rated items are in the Needs Analysis & Risk Management module.
• A full 168 of the 196 items reviewed have an ineffective distracter, that is to say, a distracter chosen by 5% or fewer examinees. Some 50 of the 196 items have at least one competing distracter and 30 items have a competing distracter chosen more often than the correct answer.
• Exams are easier to read than industry contracts and materials, but the difference is not great. Since one can be expected to keep learn-ing once on the job, we conclude that the reading level of the exam is appropriate to the material that one would expect to find on the job. Both are relatively demanding.
Statistical Review
• The difficulty of the modules is well-balanced. There are no modules so extreme in their difficulty that they pose a significant problem. Correlations for the content modules and total exam score range from acceptable to excellent. The reliability of the modules ranges from acceptable to very good.
LLQP Examination Review The Brondesbury Group Page 4

• Differences in reliability coefficients for the Full exam versus the Part A exam (corrected for length differences) suggest that the group of examinees taking the Part A exam may be more varied in their background and language skills.
• Just under 10% of test performance can be attributed to reading speed. While three-quarters of examinees complete all of the test items, the performance of some of the remaining one-quarter of examinees is negatively affected by timing.
• Examinees on the Full exam get 60% correct versus 53% for examin-ees that solely take Part A. Matching questions exactly, those taking the Full exam also score 61% on the Part A items alone, establishing that the Part A items are no more difficult. Those taking the Full exam score higher than Part A examinees on every module. Differences in performance are pervasive.
• In selection processes like this, there are usually three potential major sources of difference: the exams, the training and the examinees. It is our sense that the likeliest source of difference is that different types of people are choosing to take the Part A exam and the Full exam. The likeliest differences are educational background and mother tongue.
• Using the original aim of 60% of items correct as a guide, 47% pass the Full exam and 21% pass the Part A exam. If you want the current exams (without alterations) to pass 60% of examinees, then you need to set a cutoff of 57 for the Full exam and a cutoff of 50 for Part A. A combined score of 50-51 passes 60% of examinees. Using this cutoff, about 80% of those attempting the Full exam will pass.
Conclusions & Recommendations
• Chapter 4 presents our key conclusions responding to the six major questions in the RFP and other issues that arose in the course of the research. For this executive summary, we will not repeat these conclusions but we will present our ten key conclusions in abbreviated form.
1. Each item should have four answer choices including one correct answer and three distracters.
2. Re-write distracters chosen more often than the correct answer.
3. Change the exam from a speed test to a power test.
4. Develop and introduce material on “How to take multiple choice tests”.
5. Maintain a common cutoff score for the Restricted and Full license exams.
6. A target of 60% of items correct is desirable to protect the integrity of the credential.
7. As an interim measure until the items are re-written, we suggest that you exclude the 13 items used on the Part A exam that have compet-ing distracters for examinees. If you do this, the average Part A score should rise to 58% correct. A cutoff of 55% correct should yield a 60% pass rate across the Full and Restricted exam.
8. Conduct a separate review of the A&S items using a group of special-ists from that industry, to ensure that the learning required to answer the A&S questions is not outside the scope of required competence.
9. Re-balance the proportion of content per domain on the exam recog-nizing that many items fall into multiple domains.
10. Treat items with Bloom levels 4-6 as a single group of ‘higher level’ items. Spread the higher level items more evenly across the content modules.
LLQP Examination Review The Brondesbury Group Page 5

CHAPTER 1INTRODUCTION
LLQP Examination Review The Brondesbury Group Page 6

1.0 INTRODUCTION
1.1 Overview of the Study
• To quote from the original Terms of Reference, this study is primarily designed “to ensure that the questions in the Life License Qualifica-tion Program (LLQP) examination are fair and reflect experiences that are likely to be encountered by a new life and/or accident and sickness (A&S) agent.”
• The Terms of Reference also identify six major questions that this study is designed to answer. 1. What is the reading level required to understand questions/
answers? 2. Does the response frequency distribution in the item analysis
confirm any ambiguity noted by industry experts? 3. Does the response frequency distribution in the item analysis
reveal additional problems? 4. Does the Bloom level of the question correspond to the
Bloom level of the measurable objective as stated in the LLQP design document?
5. Does the content of the questions and answer options accu-rately reflect the situations that are likely to be encountered by new life and A&S agents?
6. Are there any deficiencies in terms of generally accepted principles of test construction that would unnecessarily add to the difficulty of the questions?
• Since the original terms of reference, some additional questions have been raised. Most notable is the question of what should be the passing score on the examination. Related to this question are differences in performance between those taking the full examination and those completing Part A alone.
• We have organized the report to reflect both the nature of the ques-tions that are raised and the sources of information that are used to answer the questions.
• Our “Content Review” in chapter 2 focuses on issues related to question content and draws on the opinions of Subject-Matter Experts (SMEs) to address the issues. Quite often we compare the opinions of the SMEs to the performance of examinees, in order to gain a better understanding of the appropriateness of content. The content review is divided into six broad topics. 1. Does the content correspond to the design document; 2. Do the Bloom Levels of the items correspond to the LLQP
design document; 3. Does the content of the scenarios reflect realistic situations
for new life and A&S agents; 4. Are correct answers reasonably identifiable; 5. Are the distracters effective; and 6. Are reading levels appropriate for job demands.
• Next, we take a closer look at the items on the examination using the responses of some 1350 examinees to provide the evidence we need. Based on their responses we address six broad issues in the “Statisti-cal Review” in chapter 3. 1. Are the test items &scales well constructed; 2. Is the level of item difficulty appropriate; 3. Does reading affect performance; 4. What is the impact of Bloom Level on performance; 5. How does test form affect performance; and 6. How can we set passing scores.
• The final chapter (chapter 4) is our “Conclusions & Recommenda-tions”. This contains brief answers to the six questions in the Terms of Reference. This is followed by our overall conclusions and our recommendations for future changes to the exam. All detailed item analysis is presented in a separate volume that is not part of this report.
LLQP Examination Review The Brondesbury Group Page 7

1.2 Methodology – SME Review
• At the start-up meeting for the project, we discussed the qualifications and the number of subject-matter experts (SMEs) for evaluating the LLQP examination. Both industry and regulators agreed that ten reviewers would be ideal and they also agreed on their qualifications. ¾ A life insurance generalist with some specialized knowledge; ¾ Level 2 agents with at least five years experience; ¾ Expertise in one of life insurance, A&S, segregated funds, retire-
ment savings or group benefits; ¾ Not involved in exam development or pre-license training of
individuals who will take the LLQP; ¾ Direct contact with consumers preferred, but at minimum, some
experience as an agent;¾ Willing to commit five days of time over two weeks; and¾ Willing to sign and abide by a confidentiality agreement.
• Candidates were largely identified by the industry. Agreement on an individual’s suitability as a SME was shared between the CLHIA, the LLQP Integrity Committee and The Brondesbury Group.
• Ten SMEs were ultimately identified and participated in the examina-tion review. We would like to thank these individuals for their consid-erable time, goodwill and expertise:: ¾ Heather Brown-Neild, RBC Insurance; ¾ Jacques Denis, Standard Life; ¾ Gail Head, BMO Nesbitt-Burns; ¾ Rick Johnson, Cartier Partners Financial Services; ¾ Neil Paton, UnumProvident ; ¾ Ron Robin, Clarica; ¾ Gary Slippoy, TD Waterhouse Insurance Services; ¾ Douglas Weir, Great West-London Life; ¾ Glenn Williams, Primerica; and ¾ Christopher Winship, Winship Financial.
• The SME review of examination items was a strictly controlled exercise held in the offices of the Financial Services Commission of Ontario (FSCO). The first meeting for the SME team consisted of a briefing and training in the morning followed by active rating of examination items in the afternoon. The first day’s ratings were reviewed by an Industrial Psychologist/ educational expert from The Brondesbury Group. On the beginning of the second day of sessions, Dr. Weinstein spoke with each person about their ratings to ensure that they had the feedback they needed to properly complete the examination review according to a common standard. After this, the SME team was allowed to review the examination items at their own speed until the full set of items was completed.
• The morning briefing session was an important part of SME prepara-tion consisting of five activities: Signing confidentiality agreements; Overview of the project & the SME’s role; Training on rating ques-tions using examples to show how to evaluate content, Bloom level and quality of distracters; Independent rating of two questions by SMEs with subsequent discussion of ratings; Examination of selected problem items; and Independent ratings of additional items. At the end of the day, the consultant collected up the independent ratings. As mentioned, the second day’s session began with feedback on common problems and moved to one-on-one discussion of ratings. The con-sultants remained present in the sessions to answer any questions.
• Examination items were rated in randomly mixed blocks of ten questions. Different reviewers worked on different items at any one time. There was no discussion of ratings, since a basic aim of the review was to assess agreement on content by independent judges. This yielded ten independent ratings instead of one common rating.
LLQP Examination Review The Brondesbury Group Page 8

• For each examination item, the reviewers were asked to:
¾ Identify the correct answer(s); ¾ Comment on whether the wording of any of the distracters was
‘tricky’, ‘misleading’ or otherwise a problem; ¾ Provide suggestions for improving the content or wording of problem-
atic distracters; ¾ Rate the consistency of distracter format and language; ¾ Identify the Bloom Level of the item; ¾ Indicate the content area(s) that the item directly draws on; ¾ For each scenario, rate how clear and sufficient the information
presented is for assessing insurance (or A&S) needs; ¾ Provide comments justifying low ratings; and ¾ Identify any additional concerns they might have about the exam item.
• All of this material was collected for each of 179 questions for each of the ten SME reviewers generating nearly 1800 item reviews with 10-15 pieces of information collected per item. The resulting 20,000+ pieces of information were gathered and systematically analyzed using a mixture of Excel, SPSS and N6. SPSS is a statistical package for analyzing social sciences data like ratings. N6 is specialized software for analyzing verbatim comments and was used to systematically review the comments about the distracters in items identified as problems.
• A summary of the findings and our conclusions from the review are shown in Chapter 2. Often our findings are based on a comparison of SME ratings to the performance of examinees. As well, we some-times distinguish the responses of all the SME reviewers from those who are expert in the specific content being rated. Comments and ratings of specific items are reserved for the volume of appendices submitted solely to the regulators. Summary findings by Content module and Bloom Level are presented in chapter 2.
1.3 Methodology — Statistical Review
• The statistical review refers to the complex statistical analysis of exam items based on the performance of examinees. The review fundamentally assesses the quality of test construction, item difficulty, passing scores and a number of related issues. Its base is a file of some 1350 examinee records that show how each examinee an-swered each question on the exam they completed.
• Building the file for this analysis was probably the most difficult part of the study. With cooperation from the members of the Integrity Committee, we developed a common format for submitting informa-tion from all provinces. Exam performance information for 2003 examinees was submitted to us beginning in January and continuing until mid-April. Despite a common format, there was still much to do after receiving each file.
• Even within a province, there were often different versions of an exam. Not only did each version contain different items from the total pool we were evaluating, but sometimes the same item had the distracters and correct answer in a different position than in a former exam. So, while question 42 might appear on two exams, the right answer on the first exam might by option ‘A’ while a re-order set of choices on the second exam might put this same option in position ‘D’. Correctly dealing with all of these details was critical and time-consuming. The work was checked, double-checked and checked again to ensure that everything is in order and the exam items can be readily evaluated.
LLQP Examination Review The Brondesbury Group Page 9

• The statistical review mainly relied on analysis conducted using the SPSS package. Initial efforts to use the SPSS ‘Reliability’ analysis were eventually abandoned. The procedure was not suitable for a “speed” test like the LLQP, where not everyone completes all of the items on their examination form. As well, the vast number of Part A exams reduced the information available on some items dramatically.
• Of the 1350 exams we analyzed, you should note that 1050 were Part A, 1 was Part B, 45 were A&S exams and only 254 were full exams. With full exams providing the best and most complete information, this posed some limitations, but we were able to overcome most of these limitations using alternative statistical procedures.
• In the different parts of our analysis, including SME and examinee analysis, we often dealt with different numbers of exam items in our review depending upon the availability of information. Exhibit 1.3 presents a summary of the number of items reviewed. In this exhibit and in most others, the content module is used to organize and present the findings.
1.3 Number Of Items Reviewed
Content Module SME* Examinee-Distracters**
Item Statistics
Total Exam 179 196 201 (2) Individual Life Insurance (3) Individual DI + A&S (4) Group Insurance (5) Investment Products (6) Underwriting, Issues & Claims (7) Taxation (8) Retirement (9) Needs Analysis & Risk Mgmt (10-11) Law & Professional standards
29 31 29 19 17 8
18 16 12
32 24 28 30 21 8
19 22 12
33 27 28 30 21 8
20 22 12
* 6 items asked twice (239,221,153,242,65,38)
** Only includes items with N>50
• The statistical measures we used to review the examination items will be discussed in chapter 3. It is our sense that it is better to discuss them in the context of their usage, than to try to define them in isolation in this section. To give a sense of some of the methods we used for those with a statistical background, we analyzed:
¾ Item difficulty and variability using descriptive statistics, ¾ The ability of items to discriminate overall test performance using
correlation measures; ¾ The coherence of content modules using both maximum likelihood
factor analysis and reliability analysis (KR21); ¾ Differences in item success for different forms of the test (e.g.,
Part A, Full , A&S) using both t-tests and F-tests; and ¾ How to set ‘passing marks’ using z-scores.
• Other statistical measures, such as rater agreement or measures of concordance, may be found in chapter 2 and in the appendix volume. As well, statistical methods were typically used to define criteria for identifying problems with exam items on a variety of dimensions. Following industry practice, we often defined ‘problems’ or ‘outlying data’ using two (1.96) standard deviations from the mean as our basis.
• Now, let us look at the findings of the LLQP Examination Review, beginning with the Content Review in Chapter 2.
LLQP Examination Review The Brondesbury Group Page 10

CHAPTER 2CONTENT REVIEW
LLQP Examination Review The Brondesbury Group Page 11

2.0 CONTENT REVIEW
• The review of test content, including distracter effectiveness, Bloom Levels, item scenarios, content modules, and readability, is based on the analysis of both Subject Matter Experts (SME) and examinees from Alberta, British Columbia, and Ontario. All examinees with distracter information were used in this analysis. In total there were 10 SMEs (listed in Chapter 1), and 1048 examinees for which data was collected. Of this we had 742 restricted exams, 229 full exams, and 38 A&S exams.
• SMEs evaluated 179 questions from the 11 modules, however 6 questions were written twice, effectively meaning 173 items were reviewed. Examinee data was collected for 196 items from potential candidates who took the exam. Only items answered by more than 50 candidates were included.
• Some 8 out of 10 SMEs agreed with the blueprint content classifica-tion, but each item touched on an average of 1.6 content areas. Crossing content domains is desirable for an exam that aims to test more advanced learning. Nonetheless, the multi-domain nature of the items should be recognized to ensure that the collection of items continues to faithfully represent the content proportions set out in the design blueprint.
• The biggest concern from the content analysis is the A&S exam. While there was good agreement that the A&S items did represent the content areas that the Blueprint intended them to represent, two-thirds of A&S items were found to touch on content from excluded content areas. At the same time, we recognize that we only had one A&S specialist and that most of the SMEs know life insurance better. We believe that the responses merit a separate review of the A&S items by a group of specialists from that industry, to ensure that the learning required to answer the A&S questions is not outside the scope of required competence.
• There is 61% agreement with all Bloom Level 3 items, agreement falls as the item level increases. SMEs are clearly having difficulty distinguishing between upper Bloom Levels. Effectively, SMEs only distinguish between two Bloom Levels: 3 and 4-6.
• On the whole, SMEs felt the scenarios were clear and had sufficient information for assessing insurance needs (or A&S where appropri-ate). Only 4 items from the full exam were rated as a bad fit by more than one-third of SMEs. Some 3 of the 4 poorly rated items are in the Needs Analysis & Risk Management module. The Taxation module also merits attention with 4 out of 8 items earning “No/Neutral” ratings.
• A full 168 of the 196 items have an ineffective distracter, that is to say, a distracter chosen by 5% or fewer examinees. If the exam had four multiple-choice options rather than five, the effectiveness of the remaining distracters would not be altered. The combined effect of reducing the amount of reading and eliminating ineffective distracters would be quite beneficial for the overall quality of the exam.
• Overall, 50 of the 196 items have at least one competing distracter and 30 items have a competing distracter chosen more often than the correct answer. In every case where the competing distracter is chosen more often than the correct answer, we recommend that the distracter be re-written to be less confusing.
• Exams are easier to read than industry contracts and materials, but the difference is not great. Since one can be expected to keep learn-ing once on the job, we conclude that the reading level of the exam is appropriate to the material that one would expect to find on the job. Both are relatively demanding.
LLQP Examination Review The Brondesbury Group Page 12

2.1 Is the Intended Content Measured?
• To find the level of consensus among SMEs and the intended content areas we asked them to list which modules they felt each item covered. If they felt the item covered more than one module they could list up to three content modules. The results are shown in Exhibit 2.1a and 2.1b.
• Exhibit 2.1a describes two aspects of content ratings. The first, average agreement with blueprint, gives the average percent of SMEs indicating the same content module for an item as the master blue-print. The second lists the average number of content areas attrib-uted to an item, aggregated by module. On average, 79% of SMEs agreed with the blueprint content classification and each item touched on 1.6 content areas.
2.1a A greem ent w ith C ontent A llocation
SM E % Average Agreement w ith
B lueprint
Average Number of Content Areas
Listed per Items
Total Exam** 79 1.59 (2) Individual Life Insurance
(3) Individual DI + A&S
(4) Group Insurance
(5) Investm ent Products
(6) Underwriting, Issues & C laim s
(7) Taxation
(8) Retirem ent
(9) Needs Analysis & R isk M gmt
(10-11) Law & Professional standards
74 96 82 55 69 94 70 71 73
1.65 1.60 2.04 1.65 1.51 1.39 1.53 1.42 1.49
** Total Exam only includes those where information on distracters is available
• Two Modules have exceptionally high agreement, Individual Disability and Taxation, both with agreement from more than 90% of the SMEs. From the opposite view the Investment Products module has quite low agreement at 55%. Based on the low agreement and other findings presented in section 3.5, we suggest that particular attention should be given to re-assessing the content domains for Investment items on the Part A exam.
• All modules have items with content drawn from more than one domain. This is most evident for Group Insurance products, where the average item drew on two content domains. Only Taxation and Needs Analysis & Risk Management fall below 1.45 content modules attributed on average per item. The fact that many items cross content domains is desirable for an exam like this that aims to test more advanced learning skills. Nonetheless, the multi-domain nature of the items should be recognized to ensure that the collection of items continues to faithfully represent the proportion of items per content domain that is set out in the design blueprint.
LLQP Examination Review The Brondesbury Group Page 13

• Exhibit 2.1b looks at content agreement in its raw numbers for low • and high confirmation. Low content confirmation lists the number of items where SME agreement was below 50%. Alternatively high content confirmation lists the number of items with over 80% agree-ment among SMEs. Here we see that Investment products have a very high number of items with low confirmation while Indi-vidual disability and Taxation have none.
• With only 55% of SMEs agreeing with the content classification of items in the Investment Products module and 11 items with low content agreement, it is clear that upwards of 5-10 items need to be reclassified in the Investment Products module.
• Evidence from Exhibit 2.1a and 2.1b also suggests that most items on the test cover a greater breadth of knowledge than can be cap-tured in one module as would be expected in a representation of real life job experience.
• The biggest concern from the content analysis is the A&S exam. While there was good agreement that the A&S items did represent the content areas that the Blueprint intended them to represent, at least half of SMEs indicated that some items touched on content areas excluded from the A&S exam. In fact, two-thirds of A&S items were found to touch on content from excluded content areas.
• For the Individual Disability / A&S module, 12 out of 31 items were found to contain content from excluded areas as well as A&S. The most common areas were Needs Analysis (7 items), Taxation (4 items) and Individual life insurance (2 items). Some 11 out of 17 items in the Underwriting section were also deemed to have individual insurance content, as were four of the items from Law & professional standards.
While the A&S exam content is certainly reflective of A&S material, the ratings are cause for concern. At the same time, we recognize that we only had one A&S specialist and that most know life insur-ance better. We believe that the responses merit a separate review of the A&S items by a group of specialists from that industry, to ensure that the learning required to answer the A&S questions is not outside the scope of required compe-tence.
2.1b Confirmation of Content Allocation
SME Low Content Confirmation*
High Content Confirmation**
Total Items
Total Exam 31 96 179 (2) Individual Life Insurance
(3) Individual DI + A&S
(4) Group Insurance
(5) Investment Products
(6) Underwriting, Issues & Claims
(7) Taxation
(8) Retirement
(9) Needs Analysis & Risk Mgmt
(10-11) Law & Professional standards
4 0 3
11 3 0 2 4 4
18 30 15 4 6 7 5 7 4
29 31 29 19 17 8
18 16 12
* Less than 50% confirm
** 80% or more confirm
LLQP Examination Review The Brondesbury Group Page 14

2.2 Are Bloom Levels Hitting their Target?
• For each item SMEs were asked to give a Bloom rating based on the stem and question that was asked. Exhibit 2.2a and 2.2b help explain how well Bloom Levels are hitting their target. Exhibit 2.2a provides indicators of SME agreement with the test Blueprint, the average difference between the two, and the average Bloom Level according to the Blueprint. Also included are raw numbers counting items with a low agreement.
• The most obvious finding is that SMEs had difficulty in differentiating between upper end Bloom Levels. On the whole, as the average Bloom Level ratings for a module increase the agreement with the blueprint decreases. As a result, Needs Analysis & Risk Manage-ment has very low Bloom Level agreement as well as the highest average Bloom Level per module. As expected mod-ules, such as Needs Analysis, Taxation, Retirement, and Law & Professional Standards, with higher average Bloom Level Ratings have a greater number of items in with low Bloom Level agreement.
2.2a Bloom Averages By Module
%Average Average Average Bloom % Low Bloom Total No. SME Agreement with Difference in Level Rating** Level Agreement Items Rated
Blueprint Rated Level**
Total Exam
(2) Individual Life Insurance
(3) Individual DI + A&S
(4) Group Insurance
(5) Investment Products
(6) Underwriting, Issues & Claims
(7) Taxation
(8) Retirement
(9) Needs Analysis & Risk Mgmt
(10-11) Law & Professional standards
** SME items ONLY
49.9 -0.1 43.0 -0.02 3.65 15 29 55.7 0.26 3.14 14 31 64.5 0.36 3.00 6 29 50.1 -0.30 3.79 7 19 75.1 0.21 3.00 2 17 34.7 -0.15 4.00 6 8 37.0 -0.25 3.89 13 18 21.6 -0.48 4.75 14 16 50.5 -0.53 3.80 11 12
3.67 88 179
• Exhibit 2.2b shows the average agreement with Bloom Levels with the Bloom Level stated in the Blueprint as a guide. There is 61% agreement with all Bloom Level 3 items, while only 11% agreement for Level 6 items. On average SMEs are classifying Level 5 and Level 6 items as Level 4. Level 3 items are rated higher, while Level 4 items are rated lower.
• The difficulty SMEs are having distinguishing between upper Bloom Levels is more obvious from Exhibit 2.2b. Clearly SMEs only distinguish between two Bloom Levels and given the analysis in Chapter 3.4, the test design should use a single level for Bloom Levels 4-6.
• We also note that Bloom Levels are consistently higher in a few content modules and this makes them more difficult. While not a necessity, we suggest that items at higher Bloom Levels (4-6) should be distributed more evenly across content modules.
2.2b Bloom Level Ratings By Assigned Bloom Level
SME Ratings of Bloom Level % Average Agreement with
Blueprint
Average Difference in
Rated Level**
Bloom Level 3 Bloom Level 4 Bloom Level 5 Bloom Level 6
61 0.42 34 -0.69 18 -1.07 11 -1.93
** SME items ONLY
LLQP Examination Review The Brondesbury Group Page 15

2.3 Are the Scenarios Realistic?
• Based on a 1-5 scale, SMEs were asked to rate whether the informa-tion in each question was clear and had sufficient information, as would be expected in a real world situation. Exhibit 2.3 shows the average percent of SMEs that thought a scenario was a good fit (Yes=4,5), an acceptable fit (Neutral=3) or a bad fit (No=1,2).
• On the whole, SMEs felt the scenarios were clear and had sufficient information assessing insurance (or A&S) needs 84% of the time. Only 7% of SMEs rated an item as poor on average for the exam. Looking at items where A&S content was considered part of the questions, we find that on average item scenarios were rated highly 88% of the time. With most modules in the 80-100% range for clear scenarios, we view ratings as generally quite good.
• Two modules have lower than average scenario item ratings, Taxa-tion and Needs Analysis & Risk Management. On average 1 in 5 items were rated as lacking sufficient information or clarity.
• Only 4 items from the full exam were rated as a bad fit by more than one-third of SMEs. Some 3 of the 4 poorly rated items are in the Needs Analysis module while the other is in Individual Insurance. The Taxation module also merits attention with 4 out of 8 items earning “No/Neutral” ratings. The scenarios affecting the four “bad fit” items must be modified, and we suggest that attention also be given to the ‘mid-level’ items in the Taxation module. Suggestions for change appear in the appendix.
• None of the items on the A&S exam were rated as a “bad fit” for an A&S scenario. There were two questions that SMEs rated as A&S content where A&S scenario improvements are merited, but neither of these items appears on the A&S exam. These items do appear on the life insurance exams, but the scenarios are rated acceptably for that purpose
2.3 Scenario Agreement
% Rating as Appropriate Scenario Agreement* # of Items % No % Neutral % Yes Total Exam 179 7 9 84 (2) Individual Life Insurance 29 7 6 87 (3) Individual DI + A&S 31 6 7 87 (4) Group Insurance 29 2 4 94 (5) Investment Products 19 4 6 90 (6) Underwriting, Issues & Claims
17 4 3 92
(7) Taxation 8 13 17 71 (8) Retirement 18 8 10 83 (9) Needs Analysis & Risk Mgmt
16 18 15 67
(10-11) Law & Professional standards
12 5 9 85
Items with A&S content** 78 4 8 88
* Based on a 1-5 appropriateness scale with 1-2=No, 3=Neutral, 4-5=Yes ** Number of Items based on SME classification of items
LLQP Examination Review The Brondesbury Group Page 16

2.4 Is the Level of Item Difficulty Appropriate?
• In this chapter, item difficulty is best explored by comparing scores of SMEs and those of candidates. Exhibit 2.4a shows the average scores per module by SMEs and Examinees. SMEs score 11% higher than candidates on average.
• For SMEs, Group Insurance and Needs Analysis/ Risk Management are particularly difficult, while Underwriting, issues & claims, Taxation, Retirement, and Law & professional standards are far easier. For candidates, Individual Disability /A&S and Retirement are the most difficult, while Underwriting, issues & claims, and Taxation are less difficult.
2.4a Item Difficulty: SME versus Examinee
SME - correct % confirm
Examinee -% correct
Total Exam 67.0 56.2 (2) Individual Life Insurance 68.4 54.7 (3) Individual DI + A&S 62.0 48.4 (4) Group Insurance 56.8 58.2 (5) Investment Products 68.9 56.8 (6) Underwriting, Issues & Claims 83.8 69.7 (7) Taxation 73.4 64.7 (8) Retirement 70.1 49.7 (9) Needs Analysis & Risk Mgmt 56.0 52.5 (10-11) Law & Professional Standards 82.7 58.5
• SMEs do much better than examinees on two modules: Retirement and Law & Professional Standards. The Law & Professional Stan-dards module is less difficult than the average for both SMEs and candidates, but candidates perform poorly on the Retirement Module. This would indicate that this module requires a deeper understanding and experience with the material in the questions. Even though the content may have appeared easy to the SMEs, many new candidates lack the experience needed to answer many of these items correctly. As stated earlier the Retirement mod-ule requires 1-2 easier items.
• It is worth noting that candidates scored better on the Group Insur-ance Module than SMEs. In this Module the average Bloom Level was only 3, nonetheless SMEs thought that the items had at least two content areas on average. It is expected that items with more/less information than necessary to answer the questions caused SMEs to ‘over-analyze’ the questions.
• Exhibit 2.4b shows the distribution of scores among different difficulty levels as rated by the SMEs. Items are divided into a five point scale ranging from ‘very easy’ (over 90% correct) to ‘very difficult’ (less than 20% correct). The range of % correct for each category is shown in the exhibit.
• Categories are designed to echo a normal distribution, but the ‘aver-age’ category has been ‘thinned’ in favor of the categories on both sides. Overall, 38% of the items are classified as average. Nearly 50% of items are rated ‘easy’ by the SMEs, and only 13% are rated ‘difficult’. Law & Professional Standards and Underwriting, issues and claims have the largest proportion of easy questions according to the SMEs at 83% and 71% respectively. Need Analysis, Group Insurance and Individual Disability are considered the most difficult modules with 31%, 28% and 23% of items with average scores below 35%.
LLQP Examination Review The Brondesbury Group Page 17

• Although the SMEs find Group insurance difficult, examinees are not confused by the questions and the module doesn’t need alteration. In contrast, Individual Disability and Needs Analysis modules are difficult for both SMEs and candidates and require the most difficult items to be re-written.
• For more in-depth analysis of this material and a comparison to exhibit 2.4b see chapter 3.2.
2.4b Assessment of Item Difficulty
SME
Total Exam (2) Individual Life Insurance (3) Individual DI + A&S (4) Group Insurance (5) Investment Products (6) Underwriting, Issues & Claims (7) Taxation (8) Retirement (9) Needs Analysis & Risk Mgmt (10-11) Law & Professional standards
* This excludes items never attempted.
% Items at Each Level of Difficulty by Module Very Easy Easy Average Difficult (.90-1.00) (.75-.89) (.35-.74) (.20-.34)
No. items
Very Difficult (.00-.19)
3% 3% 0%
10%
0% 0% 0% 0%
13% 0%
assessed 179 29 31 29 19 17 8 18 16 12
22% 17% 23% 10% 16% 47% 13% 6%
13% 58%
27%28% 16% 24%32% 24% 50% 22% 19% 25%
38%
41% 39%
38%
47% 29% 38% 67% 38% 8%
10%
10% 23%
17%
5% 0% 0% 6%
19% 8%
LLQP Examination Review The Brondesbury Group Page 18

2.5 How Effective are the Distracters?
• Distracter effectiveness is based on an analysis of 1048 candidates • shown in Exhibit 2.5. With 196 items reviewed, there was 980 possible answer choices for these items. Of these, 370 were effective distracters, 320 were ineffective (i.e., chosen by less than 5% of examin-ees), 94 were competing distracters (i.e., chosen half as often as the correct answer or more) and 196 were the correct answer.
• The most striking finding is the large number of ineffective distracters. Looking at the number of items we find that 168 of the 196 items have an ineffective distracter. All items in Underwriting and Law & professional standards have at least one ineffective distracter. We conclude that if the exam had four multiple-choice options rather than five, the effectiveness of the remaining distracters would not be altered. The combined effect of reducing the amount of reading and eliminating ineffective distracters would be quite beneficial for the overall quality of the exam.
Overall, 50 of the 196 items have at least one competing distracter and 30 items have a competing distracter chosen more often than the correct answer. In every case where the competing distracter is chosen more often than the correct answer, we recommend that the distracter be re-written to be less confusing. The appendices provide a guide to the changes required as described by the analysis and the very useful comments from the SMEs.
2.5 Effectiveness of Distracters
No. effective No. competing No. ineffective No. correct Total No. No. items w/ No. items w/ Total No. distracters distracters distracters answer options competing ineffective Items
distracters distracters Total Exam** 405 59 320 196 980 50 168 196 (2) Individual Life Insurance 78 4 46 32 160 4 28 32 (3) Individual DI + A&S 49 13 34 24 120 8 21 24 (4) Group Insurance 48 9 55 28 140 8 26 28 (5) Investment Products 69 6 45 30 150 6 25 30 (6) Underwriting, Issues & Claims 23 8 53 21 105 8 21 21 (7) Taxation 13 3 16 8 40 1 7 8 (8) Retirement 52 4 20 19 95 4 12 19 (9) Needs Analysis & Risk Mgmt 53 6 29 22 110 6 16 22 (10-11) Law & Professional standards 20 6 22 12 60 5 12 12
LLQP Examination Review The Brondesbury Group Page 19

2.6 Are Reading Levels Appropriate?
• Exhibit 2.6 lists various contracts, marketing and technical material and rates them in three ways that reflect reading difficulty. The first is the % of passive sentences, second the Flesch Reading Ease score, and finally the Flesch-Kincaid Grade Level. The Flesch Reading Ease score runs from 0-100 with higher ratings indicating an easier to read document, while the Flesch-Kincaid Grade Level translates the reading complexity into an equivalent grade level in a typical educational system. Both scores are based on words per sentence, syllables per word, use of passive voice and other indica-tors of complexity and involvement.
• Comparing industry reading material to the exam, we find that the exams are written at about one grade level lower than the exam, and as one would then expect, the reading ease is slightly higher. With fewer passive sentences and a lower grade level, most of the information that a successful candidate would have to deal with would be slightly more difficult to understand than the qualifying exam. The difference, however, is not great. Since one can be expected to keep learning once on the job, we conclude that the reading level of the exam is appropriate to the material that one would expect to find on the job. Both are relatively demanding.
2.6 Reading Levels
File Name
FINFACTS - brochure it fits - RBC Life Insurance Brochure LL plaintalk brochure par2000eCSF - variable annuity contract zcp - term life policy zcp - rider asset builder - investment policies cash mgnt- investment policies LL estate planning technical guide CSF - fundamental change rights Full Exam* Part A* A&S**Includes Stem ONLY
Type % Passive Flesch Sentences Reading Ease
Brochure 28 31 12 Brochure 10 49 10 Brochure 9 52 9
Brochure 31 34 12 Contract 26 35 12 Contract 22 49 11 Contract 24 50 11 Investment Policies and Objectives Investment Policies and Objectives Technical Guide Technical/Contract Exam Exam
Exam
21 23 25 0 8 7
10
38 17 41 35 50 48 57
Flesch-KincaidGrade Level
12 12 12 12 10 10 9
LLQP Examination Review The Brondesbury Group Page 20
CHAPTER 3STATISTICAL REVIEW
LLQP Examination Review The Brondesbury Group Page 21

3.0 STATISTICAL REVIEW
Highlights
• This statistical review is a complex statistical analysis of exam items based on the performance of examinees. The review assesses the quality of test construction, item difficulty, passing scores and a number of related issues.
• Of the 1350 exams we analyzed, 1050 were Part A exams, 1 was a Part B exam, 45 were A&S exams and only 254 were full exams. In total, some 201 exam items were analyzed. The analysis of items on the Part A exam is most accurate, but because of the relationship between error and sample size, our worst case error for items included in Part A is about +3% while our error for items appearing solely on the full exam is about +6%. The error for the A&S exam is +15%.
• The difficulty of the modules is well-balanced. There are no modules so extreme in their difficulty that they pose a significant problem. There is also no module where we would identify the standard deviation (measurement error) as too small and only two that are relatively high. Correlations for the content modules and total exam score range from acceptable to excellent. The reliability of the modules ranges from acceptable to very good.
• Differences in reliability coefficients for the Full exam versus the Part A exam (corrected for length differences) suggest that the group of examinees taking the Part A exam may be more varied in their background and language skills.
• Just under 10% of test performance can be attributed to reading speed. While three-quarters of examinees complete all of the test items, the performance of some of the remaining one-quarter of examinees is negatively affected by timing.
• If people were allowed to complete the exam at their own pace, the scores on the Part A exam would rise at least 2.7 points. This small difference means that an additional 10% of examinees would pass the Part A exam with 60% of items correct.
• Bloom Levels 4-6 cannot be reliably distinguished from one another and should be treated as one group. Regardless, it is clear that they are more difficult than Bloom Level 3 items.
• Examinees on the Full exam get 60% correct versus 53% for examin-ees that solely take Part A. Matching questions exactly, we find those taking the Full exam also score 61% on the Part A items alone, establishing that the Part A items are no more difficult. Those taking the Full exam score higher than Part A examinees on every module. Differences in performance are pervasive.
• In selection processes like this, there are usually three potential major sources of difference: the exams, the training and the examinees. It is our sense that the likeliest source of difference is that different types of people are choosing to take the Part A exam and the Full exam. The likeliest differences are educational background and mother tongue.
• Using the original aim of 60% of items correct as a guide, 47% pass the Full exam and 21% pass the Part A exam. If you want the current exams (without alterations) to pass 60% of examinees, then you need to set a cutoff of 57 for the Full exam and a cutoff of 50 for Part A. A combined score of 50-51 passes 60% of examinees. Using this cutoff, about 80% of those attempting the Full exam will pass.
• As we have often stated in discussions with the industry and regula-tors, the choice of a cutoff score is a ‘policy decision’ rather than a measurement decision. Nonetheless, we can discuss the pros and cons of several alternatives.
LLQP Examination Review The Brondesbury Group Page 22

3.1 Are the Items & Scales Well-Constructed
• In this section we will look at the major indicators of construction quality for the LLQP examination. There are four sets of indicators shown in Exhibit 3.1.
• The first set of indicators refers to the percentage of the items answered correctly by those that attempted to answer them. We note the smallest percentage correct for each module, as well as the largest. In most cases, these will be 0% and 100% respectively. More important is the “% correct-answered” since this provides us with an index of how difficult it is to correctly answer the items attempted in each content module. As we will see, modules differ considerably in difficulty. We will note the differences in this section of the report and discuss their appropriateness in the next section.
• The second indicator of construction quality is the standard devia-tion of the difficulty. This measure is labeled “% correct-Std Dev” in the exhibit. The size of the standard deviation is an indicator of measurement error. It is also a measure of how widely people differ in their ability to answer the items, but with the same people completing each module, this will have little impact. A very wide standard deviation generally means that you are measuring less accurately and your ability to predict performance is more limited. A very narrow standard deviation means that your examinees are too tightly bunched in a narrow band. This broad interpretation requires some moderation, however, since standard deviation is partially determined by the difficulty of items in the content module.
• The “scale-total correlation” is a measure of how well each content module measures the overall competence that the test is designed to measure. The correlation can take on a value from –1.00 through 0.00 to +1.00. A negative correlation means that those who do well on a content module (scale) do poorly overall. This is a
clear indicator of a poorly constructed module and never occurs in this exam. A correlation around the zero mark indicates no relationship. More to the point, the more positive the correlation, the better that module represents the overall competence that the test is designed to measure. High correlations indicate a well-designed exam.
• The final indicator is the “reliability” of the examinee performance. For a number of statistical reasons, this can only be computed for the full exam where all of the items are answered. The reliability score for a content module is a measure of the degree to which the content in that module draws on a common base of knowledge. It tells us that the items are all measuring the same thing. Reliability coefficients range from 0.00 to +1.00 with higher scores representing more reliability.
Percentage Correctly Answered
• The first two rows in Exhibit 3.1 bear some discussion in regards to the percentage of items correctly answered. First, we must remem-ber that the LLQP exam is a “speed test”. This jargon means nothing more than the fact that examinees must complete the exam in the time allotted, rather than being allowed the time they need to answer all of the questions (“power test”). This means that some examinees never attempt to answer some of the items. For items never answered, we cannot estimate how difficult the item would be for those that never tried it.
LLQP Examination Review The Brondesbury Group Page 23

3.1 Indicators of Test Quality: All Forms Combined
No. Examinees
Minimum % correct
Maximum % correct
% correct-Answered
% correct-Std Dev
Scale-total correlation**
Reliability- Full Exam**
No. items assessed
% total correct w/ missed items 1350 17 100 53.78 10.08 0.938 0.813 201
% correctly answered by module* (Excludes items never attempted) Total Exam 1350 17 100 54.48 10.23 1.000 0.836 201 (2) Indiv. Life Insurance 1123 0 100 53.56 14.32 0.736 0.762 33 (3) Indiv DI + A&S 1349 7 100 49.14 15.19 0.613 0.387 27 (4) Group Insurance 340 0 100 58.85 14.96 0.572 0.637 28 (5) Investment Products 1304 7 100 60.57 15.61 0.682 0.673 30 (6) UW, Issues & Claims 1349 0 100 69.85 17.14 0.381 0.266 21 (7) Taxation 255 14 100 65.21 19.63 0.587 0.312 8 (8) Retirement 1094 6 100 42.53 21.10 0.650 0.793 20 (9) Needs Analysis & Risk Mgmt 1006 10 100 46.14 18.47 0.407 0.366 22 (10-11) Law & Prof. Standards 244 13 100 66.75 17.19 0.365 0.505 12
* This excludes items never attempted. ** Correlation is Pearson product-moment. Reliability assessed using Kuder-Richardson 21 coefficient.
• The first row in the exhibit shows the percentage of correct items based on the total number of items on the exam, rather than just the items that the person answered. The percentage correct is a blending of results from all three exam forms with 1050 of the 1350 examinees having taken the Part A exam. As you can see, 53.8% of the ques-tions on the exam are answered correctly. The next row shows 54.5% answered correctly. The difference is that the second row is based solely on the items that each examinee attempted. Items that they never reached and answered are not included in this proportion correct. The average percentage correct would likely be just 1% higher if the test was a power test rather than a speed test.
• When we look at the scores on the content module, we must neces-sarily compare them to the percentage correct of items that were attempted. Thus 54.5% becomes our benchmark for item difficulty using the combined test forms (see section 3.4 for performance by test form). The reason that we must use this benchmark is because the number of items in each module on each version of the Part A exam can vary. We cannot determine the items the examinee never attempted, since the examinee file only records answers on items actually attempted.
LLQP Examination Review The Brondesbury Group Page 24

• Using a criterion of +10% from the benchmark score, we can identify three modules that are comparatively easy to answer and one that is relatively difficult. The Retirement module consists of some 20 items, half of which are included on the Part A exam. Only 43% of the items are answered correctly in this module versus 54% for the test as a whole. The module is certainly well constructed from the viewpoint of the SME review and SMEs do not consider the items more difficult than other modules. Nonetheless, the items are more difficult for examinees. This suggests that the content may be more complex, and indeed, we suggest that 1-2 items should be made less difficult.
• The three modules that are easier than average are: Underwriting, Issues & Claims with 70% correct; Law & Professional Standards with 67% correct; and Taxation with 65% correct. The last two modules contain relatively few items. These modules also differ in that the ratings are almost totally generated by examinees taking the full exam. The underwriting module may be easier since the typical item is at a lower Bloom Level than on other modules and half of the distracters are seldom chosen by examinees. It is clear that the distracters need to be amended to increase the difficulty of 4-5 questions in the Underwriting, Issues & Claims module.
• Overall though, the difficulty of the modules is quite well-bal-anced. There are no modules that are so extreme in their difficulty that they pose a significant problem.
Standard Deviations
• The standard deviation of the difficulty is an indicator of measurement error. The smaller the standard deviation, the more predictable are the scores that people will achieve. But if the standard deviation is too small, then the module will not be able to adequately discriminate between good and poor-performing examinees. All other things being equal, standard deviation should be largest when 50% of the items are answered correctly and get smaller as you move away from that mark. As you can see here though, that is not the case.
• Generally, two-thirds of the examinees will score within one standard deviation on each side of the mean. Using the Retirement module as an example, two-thirds of examinees will correctly answer 21%-64% of the items they attempt. In contrast to this broad range, two-thirds of examinees will correctly answer 44%-65% of the all test items they attempt.
• Focusing first on the overall test scores, we can see that the standard deviation for the percentage correct including missed items is about the same as the standard deviation for the percentage correct on just the attempted items. This implies that one measure is as good as the other for accuracy purposes.
• Turning to the content modules, there is no module where we would identify the standard deviation as too small. There are two modules where the standard deviation is too large, namely Retirement and Needs Analysis & Risk Management. In the case of the Retirement questions, evidence suggests that they draw on a greater breadth of knowledge than most content areas. This is not a fault, but rather something to be acknowledged as a realistic representation of what someone finds on the job.
• We note from the SME review that the Needs Analysis module has a far higher Bloom Level than any other module (4.75). It also has the lowest rate of confirmation of correct answers and is the module with the lowest rating for the quality of the scenarios used in its items. The distracters are effective, but 1-2 of the scenarios themselves need work. While this module is generally well-designed, the content review combined with these statistical results points to the need to improve the scenarios used in 1-2 of the Needs Analysis items. Sugges-tions for change will appear in the appendix volume.
LLQP Examination Review The Brondesbury Group Page 25

Scale-Total Correlation
• The “scale-total correlation” is a measure of how well each content module measures the overall competence that the test is designed to measure. Correlations for the content modules in the LLQP exam range from acceptable to excellent by most standards. Nonetheless, we would like to highlight a few findings.
• As one would expect and hope, performance on the Individual Life Insurance module shows the best correlation with overall test performance. As we see it, this is a good indicator that the test is measuring relevant skills. In fact, six of the nine modules scores show very good correlations with overall test performance (i.e., scores over 0.500). There are really no problems identifiable at the module level.
• While not shown in the exhibit, we note that the correlation between the number of items answered and the total test score for all items (including those not attempted) is 0.31. The implication of this finding is that just under 10% of test performance can be attributed to reading speed. While three-quarters of examinees complete all of the test items, the performance of some of the remain-ing one-quarter of examinees is negatively affected by timing.
Reliability Analysis
• The reliability score for a content module is a measure of the degree to which the content in that module draws on a common base of knowledge. It tells us that the items are all measuring the same thing. For a large sample of items, reliability coefficients range from 0.00 to +1.00 with higher scores representing more reliability. Scores are not as easy to understand as one might think, however, since the number of items used to generate the score seriously affects how large the reliability coefficient can be. This will have some impact on our interpretation.
• Without a doubt, the overall reliability of the exam is quite good. This is true whether one uses the test score including or excluding items never attempted. Both reliability coefficients are in the 0.8 range and appear quite similar. Nonetheless, the difference between the two coefficients indicates that reliability is lowered by 5-6% because this is a speed test rather than a power test.
• We have also calculated reliability coefficients for the Part A exam. With its shorter length, we obtain a coefficient of 0.65. If we compare this to reliability for questions answered only, we again find reliability is lowered by 5-6% because this is a speed test. In addition, when we estimate the reliability that Part A would have as a full exam, the coefficient (~0.76) is still lower than the coefficient for the full exam itself. This suggests that the group of examinees taking the Part A exam are probably more varied in their background and language skills.
• Turning to the modules, we observe that the reliability for the modules ranges from acceptable to very good. There are five modules that are very reliable, especially relative to the number of items they contain. As you will see, only one module definitely requires attention.
• Two reliability coefficients are relatively low: Taxation and Underwrit-ing, Issues & Claims. In the case of the Taxation module with only 8 items, the reliability is actually not bad at 0.312. We can estimate that the reliability would be in the 0.6 range if the scale was increased to 30 items. This is consistent with several of the higher scoring scales.
• By contrast, the Underwriting module is already over 20 items and increasing it to 30 items would still yield a low reliability coefficient (~0.35). As we mentioned earlier in this section, the Underwriting module has a large number of ineffective distracters and some 4-5 items will need improvement to make this module as good as the others.
LLQP Examination Review The Brondesbury Group Page 26

• Two other modules have relatively low reliability coefficients for their length, although the coefficients are quite acceptable. These are the Individual Disability Insurance/A&S module and Needs Analysis & Risk Management. For Needs Analysis, the rewrite of 1-2 scenarios mentioned earlier should put this module in the same strong perfor-mance zone as other modules. For the Individual DI module, reliability could be improved by altering some of the high incidence distracters in that section, but the reliability coefficient alone is not enough of a problem to justify the need
LLQP Examination Review The Brondesbury Group Page 27

3.2 Is the Level of Item Difficulty Appropriate
• In the preceding section we discussed item difficulty at the module level and concluded that three modules were relatively easy and one relatively difficult. In this section, we move deeper into the module to look at the distribution of item difficulty within each module.
• Exhibit 3.2 shows the distribution of items by success rate for each module of the exam. Items are divided into a five point scale ranging from ‘very easy’ (over 90% correct) to ‘very difficult’ (less than 20% correct). The asymmetry between these two poles is a reflection of the roughly 55% average item difficulty for questions which are attempted. The range of % correct for each category is shown in the exhibit.
• Categories are designed to echo a normal distribution, although the ‘average’ category has been thinned slightly in favor of the categories on both sides. Overall, 63% of the items are classified as average. While the two ‘easy’ categories span a narrower range than the two ‘difficult’ categories, they contain 21% of the items versus 16% for the difficult range. Please understand, however, that this does not imply that the exam should be made more difficult. Rather, our focus is how the modules compare in their balance of easy and difficult items.
• In addition, we must consider other issues that will be raised later in this chapter, namely passing scores and the difference in performance between Part A and Full exams. As the analyses will show, if you want 60% of examinees to pass the exam with at least 60% of the items correct, you will need to make the average item easier than it is now. At the same time, if you make one or two modules far easier than the others, it will lessen your ability to predict how well people will do.
• Given that you generally need to make things easier, we can start by saying that it is only the Underwriting, Issues & Claims module that needs to be made more difficult. This has been mentioned twice already and we have stated that the key to improving this module is reducing the number of ineffective distracters. The exhibit makes the need clearer when we see that there are 10 easy/very easy items (47%) and only one difficult item (5%).
• Looking at the remaining modules, we view the following changes as necessary regardless of any pass scores you may set. The appendices will provide a guide to the changes you need and the items needing change.
¾ Individual DI/A&S: The number of very difficult items should be reduced to no more than 1-2 by rewriting 2-3 items to per form in the high end of the average range (~.7);
¾ Taxation: The one very difficult items should be altered to move it to the high end of the difficult range (~.30-.34);
¾ Retirement: Two difficult items should be rewritten to perform in the low end of the easy range (~.75-79);
¾ Law & Professional Standards: The two very difficult items should be rewritten to perform in the average range.
LLQP Examination Review The Brondesbury Group Page 28

3.2 Assessment of Item Difficulty: All Forms Combined*
No. Items at Each Level of Difficulty by Module
No. items assessed
Very Easy (.90-1.00)
Easy (.75-.89)
Average (.35-.74)
Difficult (.20-.34)
Very Difficult (.00-.19)
Total Exam 201 7 35 126 24 9 (2) Individual Life Insurance 33 0 4 25 4 0 (3) Individual Disability Insur. + A&S 27 0 4 16 3 4 (4) Group Insurance 28 2 3 18 3 2 (5) Investment Products 30 0 7 20 3 0 (6) Underwriting, Issues & Claims 21 3 7 10 1 0 (7) Taxation 8 0 3 4 0 1 (8) Retirement 20 1 2 12 5 0 (9) Needs Analysis & Risk Mgmt 22 1 2 15 4 0 (10-11) Law & Professional standards 12 0 3 6 1 2
* This excludes items never attempted.
LLQP Examination Review The Brondesbury Group Page 29

3.3 Does Reading Affect Performance
• In earlier sections, we noted that the LLQP exam is a ‘speed test’ rather than a ‘power test’. This simply means that the test is timed and that not everyone finishes all items. In fact, while most people come close to answering all items, we still find that one-quarter don’t finish. Given that the test is answered using a scoring form, it is likely that many more simply guess at several of the questions near the end of the exam. In both cases, performance is limited by reading speed.
• Exhibit 3.3 was developed to give us some sense of how much reading speed affects performance. There is no perfect way to do this with the information available (although we can give you a strategy to find out), so we developed an approach that at least addresses the issue. Our reasoning is that if reading time is depress-ing performance for some people, it should be easiest to see in the last 20% of the questions on each exam form. If reading time is a factor, scores on the last 20% of the questions should be lower because there is more guessing on these questions. With no penalty for guessing wrong, most people will simply fill-in the blanks ran-domly, knowing that some of their guesses will be right – about 20%.
• This means that the difference between the percentage of correct items on the first 80% and the last 20% of exam items should provide part of the impact of reading speed on test performance. But, impact will be underestimated by this number unless we correct it for guessing. As well, there are items never attempted in the last 20% of the exam and these items must also be considered in our estimate of impact. The differences in performance and their consequence are shown in the exhibit.
3.3 Test Performance & Reading Speed
Exam Form No. Examinees
% correct -
First 80%
% correct -
Last 20%
Average Score Now
Est. Avg.- Power Test*
Part A Only 719 51.9 48.2 51.2 53.9 Alberta 69 57.8 42.3 54.7 63.0 British Columbia 167 54.2 50.1 53.4 57.2 Ontario 483 50.3 48.3 49.9 51.1 Full Exam 152 61.8 59.8 61.4 62.7 Alberta 48 58.8 55.1 58.1 60.4 British Columbia 30 60.5 52.5 58.9 63.8 Ontario 74 64.2 65.7 64.5 64.5
* Conservative estimate
• Still, we must point out that our estimates are conservative. First, guessing due to limited reading time may be more pervasive than we anticipate here. Second, even people who do not guess, may perform below their capability because they feel “pressed for time”. Finally, some groups will be affected more than others by a speed test. Speed tests at high verbal levels like the LLQP are likely to lower scores for people who are not native English speakers, as well as for those with less formal education. From what we can see here, the impact would not be sufficient to merit calling it “discrimination” in legal terms, but it is enough to merit attention.
LLQP Examination Review The Brondesbury Group Page 30

• If people were allowed to complete the exam at their own pace, and assuming that you moved to four distracters as recommended in chapter 2, the scores on the Part A exam would rise at least 2.7 points. This difference means that an additional 10% of examin-ees would pass the Part A exam with 60% of items correct (see exhibit 3.6). Even at the level of 50% correct, an additional 8% would pass the exam. For the Full exam, the impact of the changes is only be half as large. In both cases, Alberta and BC will see far greater impact than Ontario.
• On the basis of these findings and other considerations, we recom-mend moving from a speed test to a power test. Although the evidence is stronger in the West than Ontario and stronger for the Part A exam, there are other advantages.
¾ It will provide a more realistic and accurate assessment of examinee capabilities based on verbal comprehension and know-ledge without real influence from reading speed.
¾ While the impact is modest overall, it will be far larger for some examinees. It will eliminate a potential source of bias.
¾ If people taking the Part A and Full exams are different, this is likely to close some of the gap between their scores.
¾ It will provide better information for future item analysis. ¾ Our estimates of impact are conservative, but at the very least, it
removes an influence that accounts for more than 5% of perfor-mance.
LLQP Examination Review The Brondesbury Group Page 31
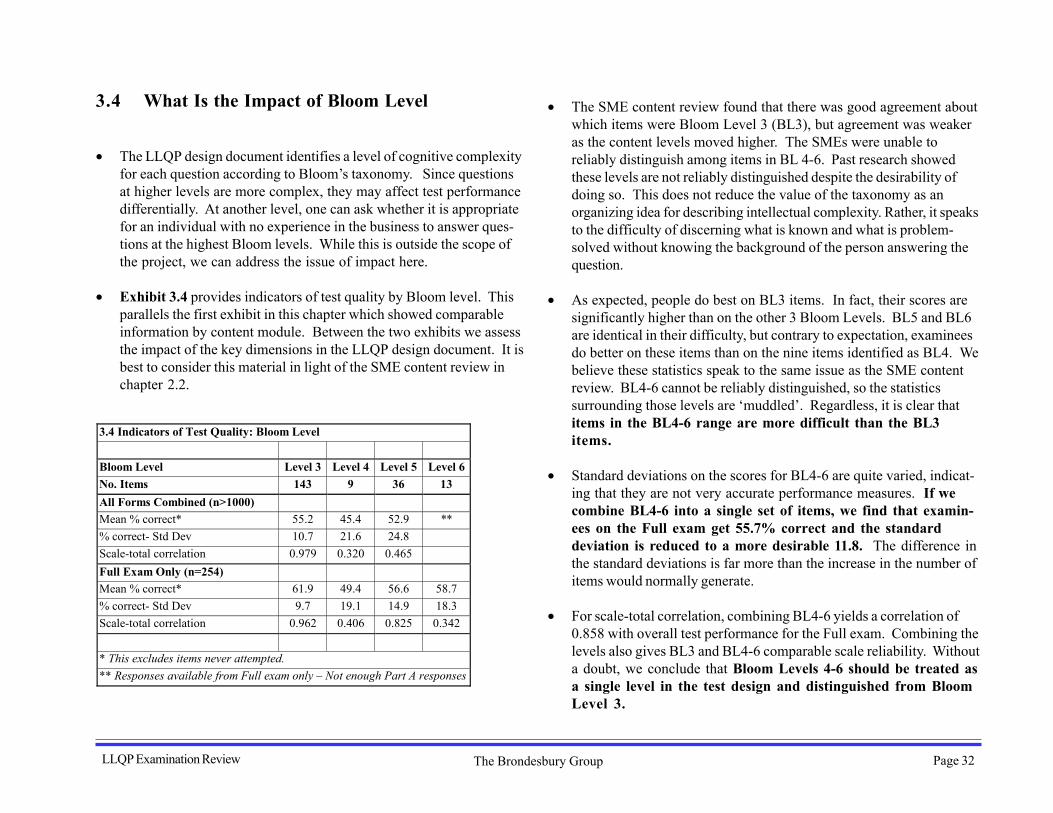
3.4 What Is the Impact of Bloom Level
• The LLQP design document identifies a level of cognitive complexity for each question according to Bloom’s taxonomy. Since questions at higher levels are more complex, they may affect test performance differentially. At another level, one can ask whether it is appropriate for an individual with no experience in the business to answer ques-tions at the highest Bloom levels. While this is outside the scope of the project, we can address the issue of impact here.
• Exhibit 3.4 provides indicators of test quality by Bloom level. This parallels the first exhibit in this chapter which showed comparable information by content module. Between the two exhibits we assess the impact of the key dimensions in the LLQP design document. It is best to consider this material in light of the SME content review in chapter 2.2.
3.4 Indicators of Test Quality: Bloom Level
Bloom Level Level 3 Level 4 Level 5 Level 6 No. Items 143 9 36 13 All Forms Combined (n>1000) Mean % correct* 55.2 45.4 52.9 ** % correct- Std Dev 10.7 21.6 24.8 Scale-total correlation 0.979 0.320 0.465 Full Exam Only (n=254) Mean % correct* 61.9 49.4 56.6 58.7 % correct- Std Dev 9.7 19.1 14.9 18.3 Scale-total correlation 0.962 0.406 0.825 0.342
* This excludes items never attempted. ** Responses available from Full exam only – Not enough Part A responses
• The SME content review found that there was good agreement about which items were Bloom Level 3 (BL3), but agreement was weaker as the content levels moved higher. The SMEs were unable to reliably distinguish among items in BL 4-6. Past research showed these levels are not reliably distinguished despite the desirability of doing so. This does not reduce the value of the taxonomy as an organizing idea for describing intellectual complexity. Rather, it speaks to the difficulty of discerning what is known and what is problem-solved without knowing the background of the person answering the question.
• As expected, people do best on BL3 items. In fact, their scores are significantly higher than on the other 3 Bloom Levels. BL5 and BL6 are identical in their difficulty, but contrary to expectation, examinees do better on these items than on the nine items identified as BL4. We believe these statistics speak to the same issue as the SME content review. BL4-6 cannot be reliably distinguished, so the statistics surrounding those levels are ‘muddled’. Regardless, it is clear that items in the BL4-6 range are more difficult than the BL3 items.
• Standard deviations on the scores for BL4-6 are quite varied, indicat-ing that they are not very accurate performance measures. If we combine BL4-6 into a single set of items, we find that examin-ees on the Full exam get 55.7% correct and the standard deviation is reduced to a more desirable 11.8. The difference in the standard deviations is far more than the increase in the number of items would normally generate.
• For scale-total correlation, combining BL4-6 yields a correlation of 0.858 with overall test performance for the Full exam. Combining the levels also gives BL3 and BL4-6 comparable scale reliability. Without a doubt, we conclude that Bloom Levels 4-6 should be treated as a single level in the test design and distinguished from Bloom Level 3.
LLQP Examination Review The Brondesbury Group Page 32

3.5 How Does Test Form Affect Performance
• Throughout this section we have alluded to differences in perfor-mance on the Part A exam when compared to the Full exam. There are also performance differences for the A&S exam, but with only 45 examinees, the evidence is far from conclusive. In any case, a comparison of performance for the three exam forms is shown in Exhibit 3.5.
• The comparison here is based on items attempted. What we can see is that examinees on the Full exam get 60% of their attempted items correct versus 53% for examinees that solely take Part A. Matching questions exactly, we find that those taking the Full exam also score 61% on the Part A items alone, thereby establishing that the Part A items are no more difficult than other items. The statistical finding on the items is borne out by the SME review in chapter 2. In fact, both analyses indicate that the Part A items are a bit less difficult than remaining items.
• The difference in performance carries through to each module with sufficient items on the Part A exam for our measurement. Whether we look at the performance of people taking the Full exam for the whole exam or Part A alone, those taking the Full exam score higher than Part A examinees on every module. Differences in performance are not isolated in a few areas of learning. This makes course preparation differences less likely than they would be if differences were limited to a few modules. It doesn’t eliminate course preparation differences as a possibility, but it does make it less likely.
• Performance on the A&S exam is difficult to evaluate accurately with only 45 examinees. Error rates on most of the figures are +15%, which means that any judgement of better or worse performance is meaningless. In short, we are showing the numbers here for com-pleteness, but there are not enough A&S examinees to meaning-fully evaluate their performance.
• Exhibit 3.5 also shows test and module standard deviations. What is striking is the similarity between the Full exam and the Part A form. This tells us that neither group is more varied than the other, but the two groups do differ in performance. With multiple course providers for the Full exam and a limited number for Part A, we would expect more spread in the Full exam scores if course was the main factor. Again, this is not conclusive, nor is a conclusive test possible from the data we have in hand.
• In selection processes like this, there are usually three potential major sources of difference: the exams, the training and the examinees. Based on the evidence available, it is our sense that the likeliest source of difference is the examinees. It is likely that different types of people are choosing to take the Part A exam and the Full exam. Without demographic information on the examinees, we cannot be sure of the differences. Intelligent speculation would suggest that the likeliest differences are educational background and mother tongue.
• For most exams of this type, those with deeper educational back-ground (e.g., university versus high school) perform better on the exam. This is certainly the case in another financial services certifi-cation exam used in Canada that we have investigated. A second source of difference is mother tongue. If English is less likely to be the first language of those taking the Part A exam, then the difference in language skills may well be a cause of some of the difference in performance.
• As we mentioned earlier, life insurance is a business requiring high level verbal skills. In fact, the exam itself makes fewer demands on language skills (in terms of reading level) than the documents one must work with in the business. Nonetheless, time pressure does disadvantage those who don’t have English as a first language. Assuming that language is part of the problem, and this cannot be proven here, moving to a power test will offset much of the reading disadvantage posed by the exam.
LLQP Examination Review The Brondesbury Group Page 33

3.5 Performance by Exam Form*
Percentage Correct - Attempted items Standard Deviation Exam Type Full Exam Part A items-
Full exam Part A A&S Full Exam Part A items-
Full exam Part A A&S
Overall 60.0 61.1 53.1 54.7 9.6 9.6 9.9 10.5 (2) Individual Life Insurance 58.8 60.6 53.0 ** 14.9 15.0 13.9 ** (3) Individual DI + A&S 53.2 56.0 47.7 46.3 13.3 16.8 17.5 12.0 (4) Group Insurance 59.5 ** ** ** 12.7 ** ** ** (5) Investment Products 64.8 72.0 58.0 ** 14.7 15.3 15.9 ** (6) Underwriting, Issue & Claims 73.0 73.2 68.7 60.8 15.2 16.0 18.8 18.2 (7) Taxation 66.1 ** ** ** 19.6 ** ** ** (8) Retirement 57.2 58.3 37.0 ** 19.5 21.6 20.0 ** (9) Needs Analysis & Risk Mgmt 55.0 44.1 43.0 ** 15.6 24.4 23.6 ** (10-11) Law & Prof. standards 54.9 58.0 52.6 69.6 17.2 28.8 26.9 16.6 No. Examinees 254 254 1051 45 254 254 1051 45
* This excludes items never attempted. Significant differences range from 1.5 to 3.2 ** Insufficient information
LLQP Examination Review The Brondesbury Group Page 34

3.6 How Can We Set Passing Scores
• For those trying to set passing scores for the exam, Exhibit 3.6 is critical. Using the percentage of correct items (including missing items) as a guide, the exhibit identifies the proportion of examinees for each exam form that will pass the exam at that cutoff. Using the original aim of 60% of items correct as a guide, we can see that 47% pass the Full exam and only 21% pass the Part A exam. If you want the current exams (without alterations) to pass 60% of examinees, then you need to set a cutoff of 57 for the Full exam and a cutoff of 50 for Part A. A combined score that passes 60% of examinees is not shown, but assuming the proportion of examinees for Part A and the Full exam remains constant, the cutoff would be between 50-51. Using this cutoff, about 80% of those attempting the Full exam will pass.
• Without seeing this type of chart, it is very difficult to think about the impact of a cutoff score. Most people think about the raw numbers and try to average them, but in statistical terms the distance between each number on the cutoff scale is not the same. For each form of the exam, the scores are normally distributed in the familiar “bell curve” shape. They are not uniformly distributed as the cutoff scores would make them appear to be. Thus there is virtually no difference in pass rate between 20-30, while 50-60 makes a difference of a third or more.
• Let us look at an example. For the Full exam with a mean of ~60, one-third of examinees will score between 50-60, one-third will score between 60-70 and the remaining one-third will be split between scores under 50 and over 70. As a comparison, one-third of the Part A examinees will score between 42-52 and one-third between 52-62 with the rest split between higher and lower scores. If we look at the range of scores between 60-70, we will find one-third of the Full exam scores in that range, but just over half as many Part A scores.
3.6 Percentage of Examinees Achieving the Score*
Score* 25 30 35 40 41 42 43 44 45 46 47 48 49 50 51 52 53 54 Full Exam (n=254) 99.9 99.6 99.4 98 97.3 96.5 96 95 93.3 91.9 89.6 88.5 86.3 82.7 79.7 76.1 74.5 71.3 Part A (n=1050) 99.4 98.7 95.9 89.4 88.1 87 82.9 79.8 76.4 73.6 70.5 65.9 63.3 59.8 54.2 50.1 46.5 43.4 A&S (n=45) 99.9 91.1 86.7 73.3 71.1 58.9 55.6
46.7
Score* 55 56 57 58 59 60 61 62 63 64 65 66 67 68 69 70 75 80 Full Exam (n=254) 67.3 63.4 60.5 55.4 51.1 47.2 42.8 39.4 36.3 34.5 31.1 26.6 23.2 19 16.7 13.8 5.5 1.6 Part A (n=1050) 37.3 32.2 32 26.7 23.8 21.1 17.5 14.3 12.4 9 7.9 6.1 5.3 5.2 3.7 3.2 1.3 0.3 A&S (n=45) 42.2 27.2 17.8 4.2 2 0.1
* Highlighted numbers are the percentage of correct answers on the exam including missed items.
LLQP Examination Review The Brondesbury Group Page 35

• As we have often stated in discussions with the industry and regula-tors, the choice of a cutoff score is a ‘policy decision’ rather than a measurement decision. Once you can state what you want to achieve with the exam in numerical terms, then the policy decision can be converted into a measurement decision. For now, that is not the case. So, let us look at the alternatives with their pros and cons.
• Choose a percentage of correct answers that is comfortable for most people. This was the initial approach when 60% correct answers was chosen as the cutoff for passing the exam. With this as the cutoff, about 27% of all examinees pass – 47% from the Full exam and 21% from Part A. A likely outcome is that there will not be enough qualified people to meet market demand for insurance agents. As well, if there are differences in the kinds of people taking the two forms of the exam, this approach will keep the type of person who takes Part A out of the market. The trade-off is that the proportion of correct items will provide the public with some comfort that those who do pass the exam are reasonably knowledgeable and safe for prac-tice.
• Choose a cutoff that allows a desired proportion to pass. If the decision is that 60% should pass, then the cutoff should be set in the 50-51 range and 80% of those taking the Full exam will pass as well as 55% of those taking the Part A exam. The advantage is that you have enough people for the industry, but if the proportion of correct answers is low it damages the credibility of the industry. This is the approach typically used for university entrance, but the percentage granted admission rights is far lower.
• Allow different cutoffs for Part A versus Part B and the Full exam. In this approach, a score is set that results in a predetermined proportion of examinees passing the Full exam. The same cutoff is applied to the Part B exam. Part A is allowed a lower cutoff score with a score below 60 (or the desired cutoff) either indicating or mandating remediation as part of further study. This approach maintains a relatively high competency standard and keeps reasonable performers on-track to become full agents, while letting them know they need to work harder at mastering the material. The disadvantage is that it will drive more people to take the Part A exam in order to get into the business and serve to create a dual licensing standard, even if only on a short-term basis.
• Keep the same cutoff but change the item difficulty mix on the exams. An approach conceptually related to the previous one is to keep a common cutoff, but move more of the lower difficulty items to Part A, thereby enabling the cutoffs to remain the same and the pass rates to be the same for Part A and the Full exam. Again, the impact is that more people are likely to take the Part A exam to get into the business, but unlike the preceding approach, the pass rate for Part B will be extremely low. There is a danger that success in Part A will make people over-confident and the failure rate on Part B will be so high that it will be likely to result in complaints.
• Change the average item difficulty and keep a common cutoff. In this approach, the exam itself is altered to make the average item easier to complete. The impact on pass rates is the same as lowering the cutoff score, but the proportion of correctly answered questions is increased and the credibility of the exam is maintained. This can be achieved by eliminating highly competitive distracters in some items, reducing the number of questions at Bloom Levels 4-6 or introducing questions at Bloom Level 2. A combination of these approaches can also be used.
LLQP Examination Review The Brondesbury Group Page 36
• Make changes in procedure that will improve the performance of Part A examinees. This is the most desirable approach, but since there is not enough evidence to accurately assess the underlying causes of the differences in performance, it is difficult to identify strategies that are certain to work. Operating on the assumption that differences are due to mother tongue or educational background, there are several approaches you can take to equalizing the performance of Part A examinees. The first three suggestions are likely to help performance almost regardless of underlying cause and should be minimally disruptive for current practices. The last two ideas are more disruptive and will probably address the problem at the Provin-cial exam level, but they do so by transferring the problem to someone • else rather than solving it.
¾ Change from a speed test to a power test. To the extent that reading speed affects performance, this approach should help to eliminate part of the difference between examinees on Part A and the Full exam.
¾ Move from 5 answer choices to 4 choices for each item. This will lessen the reading demand on the examinee and shorten the exam.
¾ Provide access to instruction on how to take multiple choice exams. For people educated in another culture, particularly those in the British rather than the American tradition, multiple choice exams are not well understood. They don’t understand the strategy for answering multiple choice questions, especially the need to eliminate wrong answers rather than find the exact right one. Training on multiple choice test-taking strategy can improve performance, especially when the course includes training and feedback on a mock exam.
¾ Set minimum educational background prerequisites for taking the Part A exam, for example, a diploma or degree from an institution of higher learning in Canada. The same prerequisite would not apply to the Full exam.
¾ Raise the cutoff for the Restricted License Certification exam that precedes the Provincial exam. This merely pushes the problem back to the stage preceding the Provincial exam. It doesn’t really attack the underlying cause, but it can help solve the problem of different performance at the Provincial exam level.
Having presented these alternatives, the next question is likely to be “What would we recommend?” We will answer this question in our “Conclusions & Recommendations” chapter.
LLQP Examination Review The Brondesbury Group Page 37

CHAPTER 4CONCLUSIONS & RECOMMENDATIONS
LLQP Examination Review The Brondesbury Group Page 38

4.0 CONCLUSIONS & RECOMMENDATIONS
• Answers to the six major questions raised in the Terms of Reference are the first section of this chapter. We then move into a broader summary of Conclusions and then Recommendations
4.1 Conclusions — Six Major Questions
• This section answers the six questions raised in the Terms of refer-ence in as clear a fashion as possible and without much qualification or explanation. We elaborate on many of these issues in the rest of the chapter.
What is the reading level required to understand the questions?
• The Full and Restricted exams are geared to a Grade 10 reading level, while the A&S exam is geared to Grade 9. This is less demanding than typical industry documents, which averaged in the Grade 11-12 range.
Does the response frequency confirm any ambiguity in items?
• Yes. Some 50 of the 196 items we reviewed based on examinee performance have at least one competing distracter (i.e., a distracter chosen by one-third or more of examinees) and 30 items have a compet-ing distracter chosen more often than the correct answer.
• Ambiguity is confirmed by Subject-matter experts (SMEs). Some 59 of the 173 items that the SMEs reviewed have at least one competing distracter and 30 are chosen more often than the correct answer. Half of these 30 items overlap with examinees.
Does the item analysis reveal additional problems?
• Yes, but it also shows the test is well constructed overall. Still a few modules require attention. Needs Analysis & Risk Management items are the most problematic with mismatches for Bloom level, scenarios that need re-writing and resulting high difficulty items. No other module requires near as much attention, but Underwriting, Issues & Claims is probably second for attention required. Aside from this, most of the remaining changes fall in the ‘tinkering’ category from our point of view.
Do Bloom levels correspond to the LLQP design document?
• Not very well. Only half of the items are rated by SMEs as having the Bloom level assigned to them in the design document. Agreement is 61% for level 3 items and falls steadily to 11% by level 6. It is clear that items within Bloom levels 4-6 cannot be adequately distinguished from one another, but can be reasonably distinguished from level 3 items.
• Performance of examinees by Bloom level suggests that level 3 items are easier than others and that levels 4-6 cannot be adequately distinguished. Effectively, the exam measures two distinct levels – level 3 and higher levels.
Do scenarios reflect situations encountered by new agents?
• Yes. With most modules in the 80-100% range for clear life agent scenarios, ratings are quite good. Only 4 items from the full exam are rated as a bad fit by more than one-third of SMEs. None of the items on the A&S exam itself are rated as a bad fit for an A&S scenario.
LLQP Examination Review The Brondesbury Group Page 39

Are there deficiencies that add to the difficulty of the questions?
• Yes, there are two other issues that add to the difficulty under some circumstances: multiple domain content and reading load.
• Most items cover more than one content domain. While this is desirable for this type of exam, it does add to the difficulty. The real concern for content is the A&S exam, where SMEs identified two-thirds of items as involving excluded content domains in addition to the ones they are meant to represent.
• We estimate that 10% of test performance is a function of reading speed, which has its impact through the time limits on the exam. As well, the fact that most items contain a distracter that is seldom chosen means that most people are reading more than is necessary.
4.2 Conclusions – The Consultant View
• Since the research led us into topics that were not envisaged in the original terms of reference, we thought we would also show our view of the conclusions that have the most import. There is necessarily some redundancy with the original six questions.
• Test content does fit into the content categories set out in the LLQP design blueprint, but many of the items also touch on other content domains.
• While there was good agreement that the A&S items did represent the content areas that the Blueprint intended them to represent, two-thirds of A&S items were found to touch on content from excluded content areas.
• Bloom level 3 is clearly different than the higher levels. Bloom levels 4-6 cannot be reliably distinguished from one another either by SME judgement or examinee performance.
� Scenarios used in questions are generally clear and appropriate for their purpose.
• The reading level of the exam is appropriate to the material that one would expect to find on the job. Both are relatively demanding.
� Offering four answer choices rather than five will be just as effective and reduce the reading demand of the exam.
• Nearly one out of six items has a distracter that is chosen more than the correct answer. These distracters need to be re-written to be less confusing.
• While one or two modules require significant attention, the exam is well-constructed for the most part.
LLQP Examination Review The Brondesbury Group Page 40

• The difficulty of the modules is quite well-balanced. There are no modules that are so extreme in their difficulty that they pose a signifi-cant problem.
• The scale-total correlations for the content modules range from acceptable to excellent, indicating that modules measure the overall competence they are designed to measure.
• Reliability scores indicate that the exam draws on a common base of knowledge. The overall reliability of the exam is quite good and the modules range from acceptable to very good.
• Just under 10% of test performance can be attributed to reading speed. We estimate that as many as one-quarter of examinees is negatively affected by timing.
• There is a massive difference in performance on the test between those taking the Full exam and those taking the Part A exam for a restricted license. The differences, which apply to every module, cannot be explained by item difficulty differences. Differences among course providers are also unlikely to account for all of the difference. It is our sense that the likeliest source of difference is the examinees -- with the likeliest differences being educational back-ground and mother tongue.
• Using the original aim of 60% of items correct as a guide, 47% pass the Full exam and only 21% pass the Part A exam. If you want the current exams (without alterations) to pass 60% of examinees, then you need to set a cutoff of 57 for the Full exam and a cutoff of 50 for Part A. A combined score of 50-51 will pass 60% of examinees if the proportion taking the restricted license exam remains constant. Using this cutoff, about 80% of those attempting the Full exam will pass.
4.3 Recommendations
• Most of the recommendations mentioned in this section are sprinkled throughout the report. Nonetheless, it is useful to gather them in one place and give our view on the best approach to some issues which have no ‘right answer’.
1. Each item should have four answer choices including one correct answer and three distracters.
2. For every item where there is a competing distracter chosen more often than the correct answer, the competing distracter should be re-written based on SME comments in the appendix.
3. Change the exam from a speed test to a power test. This means that everyone works on the exam at their own speed until they are done. If you must impose time limits, then identify the point where only 5% have not finished the exam and set the time to slightly longer than that.
4. Develop and introduce material on “How to take multiple choice tests”. Making this material mandatory for those without some post-secondary education is likely to be beneficial, but it is acceptable to simply make this available to those who wish to take advantage of it.
5. Maintain a common cutoff score for the Restricted and Full license exams.
6. A target of 60% of items correct is desirable to protect the integrity of the credential. We believe that if all the changes we have identified here are made, you will be quite close to the desired mark. To make up the difference, we suggest that you lower the average item diffi-culty.
LLQP Examination Review The Brondesbury Group Page 41
7. As an interim measure until the items are re-written, we suggest that you exclude the 13 items used on the Part A exam that have distracters chosen more often by examinees than the correct answer. If you do this, the average Part A score should rise to 58% correct. A cutoff of 55% correct should yield a 60% pass rate across the Full and Restricted exam.
8. Conduct a separate review of the A&S items using a group of special-ists from that industry, to ensure that the learning required to answer the A&S questions is not outside the scope of required competence.
9. Re-balance the proportion of content per domain on the exam recog-nizing that many items fall into multiple domains. Pay particular attention to items in the Investment module.
10. Treat items with Bloom levels 4-6 as a single group of ‘higher level’ items. Spread the higher level items more evenly across the content modules.
11. Re-work the questions in the Needs Analysis & Risk Management module with special attention to competing distracters and unrealistic scenarios. Scenarios in the Taxation module also require “fine-tuning”.
12. Re-write the most difficult questions in four modules to reduce their level of difficulty: Individual DI/A&S (2-3 items), Taxation (1 item), Retirement (2 items) and Law & Professional standards (2 items).
13. Make the item changes suggested in Appendix D in the second volume of this report.
LLQP Examination Review The Brondesbury Group Page 42