ljubljana, 6-8 sept. 2007 soft topographic map for ...sis06gd/publications/all/difatta07-ida.pdf ·...
TRANSCRIPT

In the Proc. of the 7th Int.l Symposium on Intelligent Data Analysis (IDA)Ljubljana, 6-8 Sept. 2007
Soft Topographic Map for Clustering and
Classification of Bacteria
Massimo La Rosa1, Giuseppe Di Fatta2, Salvatore Gaglio13,Giovanni M. Giammanco4 , Riccardo Rizzo1 and Alfonso M. Urso1
1 ICAR-CNR, Consiglio Nazionale delle Ricerche, Palermo, Italy.2 School of Systems Engineering, University of Reading, UK
3 Dipartimento di Ingegneria Informatica, Universita di Palermo, Italy4 Dipartimento di Igiene e Microbiologia, Universita di Palermo, Italy
Abstract. In this work a new method for clustering and building atopographic representation of a bacteria taxonomy is presented. Themethod is based on the analysis of stable parts of the genome, theso-called “housekeeping genes”. The proposed method generates topo-graphic maps of the bacteria taxonomy, where relations among differ-ent type strains can be visually inspected and verified. Two well knownDNA alignement algorithms are applied to the genomic sequences. To-pographic maps are optimized to represent the similarity among thesequences according to their evolutionary distances. The experimentalanalysis is carried out on 147 type strains of the Gammaprotebacteriaclass by means of the 16S rRNA housekeeping gene. Complete sequencesof the gene have been retrieved from the NCBI public database. In theexperimental tests the maps show clusters of homologous type strainsand present some singular cases potentially due to incorrect classifica-tion or erroneous annotations in the database.
1 Introduction
Microbial identification is crucial for the study of infectious diseases. The classi-cal method to identify bacterial isolates is based on the comparison of morpho-logic and phenotypic characteristics to those described as type or typical strains.Recently a new naming approach based on bacteria genotype has been proposedand is currently under development. In this new approach phylogenetic relation-ships of bacteria could be determined by comparing a stable part of the geneticcode. The part of the genetic code commonly used for taxonomic purposes forbacteria is the 16S rRNA “housekeeping” gene. The 16S rRNA gene sequenceanalysis can be used to obtain a classification for rare or poorly described bac-teria, to classify organisms with an unusual phenotype in a well defined taxon,to find misclassification that can lead to the discovery and description of newpathogens.
The aim of this work is to obtain a topographic representation of bacteriaclusters to visualize the relations among them. Moreover, we intend to achievethis objective by using directly the genotype information, without building a

2
feature space. Many clustering approaches are based on a feature space whereobjects are represented. Biological datasets usually contain large objects (longnucleotides sequences or images); a vector space representation of such objectscan be difficult and typically results in a high dimensional space where theeuclidean distance is a low contrast metric. The definition of a vector space alsorequires the choice of a set of meaningful axes that represent some measurablequalities of the objects. In DNA sequences this approach is not straightforwardand may be hindered by an arbitrary choice of features. According to theseconsiderations we do not adopt a vector space representation, but a matrix ofpairwise distances obtained directly from the genetic sequences. Such a matrixcan be computed in terms of string distances by means of well understood andtheoretically sound techniques commonly used in genomics.
The paper is organized as follows: in section 2 we refer to works that focuson similar classification problems of biological species; in sections 3 and 4 wedescribe the algorithms we have adopted for the similarity measure and thegeneration of topographic maps; in section 5 we present an experimental analysisof the proposed method and provide an interpretation of the results.
2 Related Work
In recent years, several attempts to reorganize actual bacteria taxonomy havebeen carried out by adopting 16S rRNA gene sequences. Authors in [1] focusedon the study of bacteria belonging to the prokaryothic phyla and adopted thePrincipal Component Analysis method [2] on matrices of evolutionary distances.Clarridge [3], Drancourt et al. [4, 5] carried out an analysis of 16S rRNA genesequences to classify bacteria with atypical phenotype: they proposed that twobacterial isolates would belong to different species if the dissimilarity in the 16SrRNA gene sequences between them was more than 1% and less than 3%. Clus-tering approaches for DNA sequences [7] and for protein sequences [9] adoptedMedian Som, an extension of the Self-Organizing Map (SOM) to non-vectorialdata. Chen et al. [11] proposed a protein sequence clustering method based onthe Optic algorithm [12]. Butte and Kohane [8] described a technique to findfunctional genomic clusters in RNA expression data by computing the entropyof gene expression patterns and the mutual information between RNA expressionpatterns for each pair of genes. INPARANOID [13] is another related approachthat performs a clustering based on BLAST [14] scores to find orthologs andin-paralogs in two species.
Among other algorithms for the clustering of pairwise proximity data, it isworth to mention an approach to segment textured images [29]. Dubnov et al. [16]proposed a nonparametric pairwise clustering algorithm that iteratively extractsthe two most prominent clusters in the dataset, thus generating a hierarchicalclustering structure. A hierarchical approach was also followed in [17, 18]. Otherworks, e.g. [19, 20], adopted Multidimensional Scaling [22] to embed dissimilaritydata in a Euclidean space.

3
3 Genetic Sequence Similarity
3.1 Sequence Alignment
Sequence alignment allows to compare homologous sites of the same gene be-tween two different species. For this purpose, we used two of the most popularalignment algorithms: ClustalW [23] for multiple-alignment; and Needleman-Wunsch [24] for pairwise alignment. The ClustalW algorithm aims to producethe best alignment configuration considering all the sequences at the same time,whereas Needleman-Wunsch algorithm provides a global optimum alignment be-tween two sequences even of different length. Sequence alignment algorithmsusually insert gaps in the input sequences in order to stretch them and to findthe best matching configuration: gaps represent nucleotide insertions or deletionsand are very important in terms of molecular evolution. An example of pairwisealignment is shown in Figure 1.
Fig. 1. Pairwise alignment between two gene sequences
3.2 Evolutionary Distance
The evolutionary distance is a distance measure between two homologous se-quences, previously aligned. There are several kinds of evolutionary distances:the simplest one is the number of nucleotide substitutions per site. The numberof substitutions observed between sequences is often smaller than the numberof substitutions that have actually taken place. This is due to many geneticphenomena such as multiple substitutions on the same site (multiple hits), con-vergent substitutions or retro-mutations. As a consequence, it is important touse stochastic methods in order to obtain an exact estimate of evolutionary dis-tances. Many stochastic models exist that differ from each other on the basis oftheir a priori assumptions.The most common a priori assumptions are:
– all sites evolve in an independent manner;– all sites can change with the same probability;– all kinds of substitution are equally probable;

4
– substitution speed is constant over time.
In our study, we used the method proposed by Jukes and Cantor [25], where allthe assumptions above are valid. According to [25], the evolutionary distance dbetween two nucleotide sequences is equal to:
d = −34
ln(
1− 43p
), (1)
where p is the number of substitutions per site, defined as:
p =number of different nucleotides
total number of compared nucleotides. (2)
It is important to note that sites containing gaps or undefined bases are notconsidered in the computation of distances.Evolutionary distances computed with (1) constitute the elements of a dissimi-larity matrix that represents the input for the algorithm described in the nextsection.
4 Soft Topographic Map Algorithm
A widely used algorithm for topographic maps is the Kohonen’s Self OrganizingMap (SOM) algorithm [31], but it does not operate with dissimilarity data.
According to Luttrell’s work [26], the generation of topographic maps canbe interpreted as an optimization problem based on the minimization of a costfunction. This cost function represents an energy function and takes its minimumwhen each data point is mapped to the best matching neuron, thus providingthe optimal set of parameters for the map.
An algorithm based on this formulation of the problem was developed byGraepel, Burger and Obermayer [27, 28] and provides an extension of SOM toarbitrary distance measures. This algorithm is called Soft Topographic Map(STM) and creates a map using a set of units (neurons or models) organized ina rectangular lattice that defines their neighbourhood relationships.
The cost function for soft topographic mapping of proximity data (in ourcase a dissimilarity matrix) can be formulated as follows:
E({ctr}) =12
∑t,t′
∑r,s,u
ctrhrsct′uhus∑t′′∑
v ct′′vhvsdtt′ , (3)
where dtt′ is the generic element of the dissimilarity matrix, namely the pairwisedistance among nucleotide sequences of bacteria t and t′. Two constraints holdin (3):
∑r ctr = 1, ∀t, i.e. each data vector can belong only to one neuron r, and∑
s hrs = 1, ∀r. The function hrs is equivalent to the neighborhood function ofclassic SOM algorithm and represents the coupling between neurons r and s inthe map grid. hrs is usually chosen as a normalized Gaussian function such as:
hrs ∝ exp
(−|r− s|2
2σ2
), ∀r, s. (4)

5
Table 1. Soft Topographic Map algorithm.
1. Initialization Step:(a) etr ← ntr,∀t, r, ntr ∈ [0, 1](b) compute lookup table for hrs as in Eq. (4)(c) compute dissimilarity matrix from input data as in Eq. (1)(d) put β ∼= β∗
(e) choose βfinal, increasing temperature factor η, convergence threshold ε2. Training Step:
(a) while β < βfinal (Annealing cycle)i. repeat (EM cycle)
A. E step: compute P (xt ∈ Cr)∀t, r as in Eq. (5)B. M step: compute anew
tr ,∀t, r as in Eq. (7)C. M step: compute enew
tr ,∀t, r as in Eq. (6)ii. until
∥∥enewtr − eold
tr
∥∥ < εiii. put β ← ηβ
(b) end while
In order to optimize the cost function the deterministic annealing [29, 30] tech-nique has been used. This technique is based on the optimization of a family ofcost functions, representing free energy, that depend on the parameter β, the socalled inverse temperature. This parameter represents the amount of smoothingthat is done to the original cost function.
The minimization of this function leads to the probability of the assignmentof the data vector t to the node r (i.e. to its cluster Cr):
P (xt ∈ Cr) =exp(−βetr)∑u exp(−βetu)
, ∀t, r. (5)
In Equation (5), etr is the partial assignment cost of data vector xt to beassigned to cluster Cr, and it is defined as:
etr =∑s
hrs
∑t′
at′s
(dtt′ − 1
2
∑t′′
at′′sdt′t′′
), ∀t, r. (6)
Equation (6) is obtained considering that diagonal elements of the dissimi-larity matrix are equal to zero and that the dissimilarity matrix is symmetric.The weighting factors atr are given by:
atr =∑
s hrsP (xt ∈ Cs)∑t′∑
s hrsP (xt′ ∈ Cs), ∀t, r (7)
and can be seen as weighted averages over data vectors.

6
The Soft Topographic Map algorithm for proximity data described above canbe summarized in the pseudo code of Table 1. Minimization procedure can bedone in two steps, formed by two nested loops. The inner loop 2(a)i constitutes anexpectation-maximization (EM) algorithm: starting from a random initializationof partial costs, equations (5), (7), (6) are computed in sequence for a fixed valueof β until the difference between current partial costs and previous partial costsis lower than a certain threshold. Then, in the outer loop 2a, in order to findthe global minimum of the cost function, β is gradually increased and the innerloop repeated. β is increased according to the annealing scheme β ← ηβ, withη = 1.1 . . . 2.0, up to a previously chosen βfinal.As seen in [27], the initial value of β should be just above a certain value β∗
calculated as:β∗ =
1λC
maxλGmax
, (8)
where λCmax is the largest eigenvalue of the covariance matrix C of the data and
λGmax is the largest eigenvalue of a matrix G, whose elements are equal to:
grt =∑s
hrs
(hst − 1
M
). (9)
5 Experimental Analysis
5.1 Bacteria dataset
In order to test our approach, we have built a database of 16S rRNA bac-teria gene sequences. The choice of the bacteria set has been done accordingto the current taxonomy [1]. We focused on the bacteria belonging to PhylumBXII, Proteobacteria; Class III, Gammaproteobacteria: this class includes someof the most common and dangerous bacteria related to human pathologies. Inthe Gammaproteobacteria class there are 14 orders, each of them containing oneor more family. Each family is divided in genera; for each genus we selected thetype strains, as shown in Figure 2.
For each type strain we selected the 16S rRNA gene sequence, which containsapproximately 1400 nucleotides. The resulting 147 sequences were retrieved fromGenBank [33] in FASTA format [15].
Each gene sequence is labelled according to its order in the actual taxonomy.
5.2 Experimental results
We carried out a set of experimental tests using the algorithm described in thesection 4 with the bacteria dataset of section 5.1. We used both the dissimilaritymatrices obtained from multiple alignment of sequences and pairwise alignmentof sequences in order to compare the results. More specifically, we used twowell known bioinformatic tools: Mega software [34], that implements ClustalWalgorithm, and Emboss tools [35] for Needleman-Wunsch algorithm. In bothsituations, we used default options.

7
Fig. 2. Actual taxonomy of the bacteria dataset
We applied a slightly tuned version of Soft Topographic Map algorithm: inorder to speed up processing time, neighbourhood functions associated to eachneuron have been set to zero if they referred to neurons outside a previouslychosen radius in the grid. The radius has been put to 1/3 of the side of maps.As for the other parameters of the algorithm, we put the annealing increasingfactor η = 1.1, and threshold convergence ε = 10−5, as suggested by [27]. Afterseveral tests we chose, as a good compromise between processing time and clus-tering quality, the final value of inverse temperature equal to 10 times the initialvalue, leading as a consequence 25 learning epochs; finally we put the width ofneighbourhood functions σ to 0.5.
We generated several maps of different dimensions, from 8× 8 up to 20× 20neurons. The dimensions of the maps were set by considering the number of inputpatterns (147 gene sequences) and the number of expected clusters (14 orders inthe taxonomy). We compared each pair of maps of the same dimension obtainedfrom multiple alignment and pairwise alignment. The results were quite similarand we can state that the alignment technique does not affect final results.
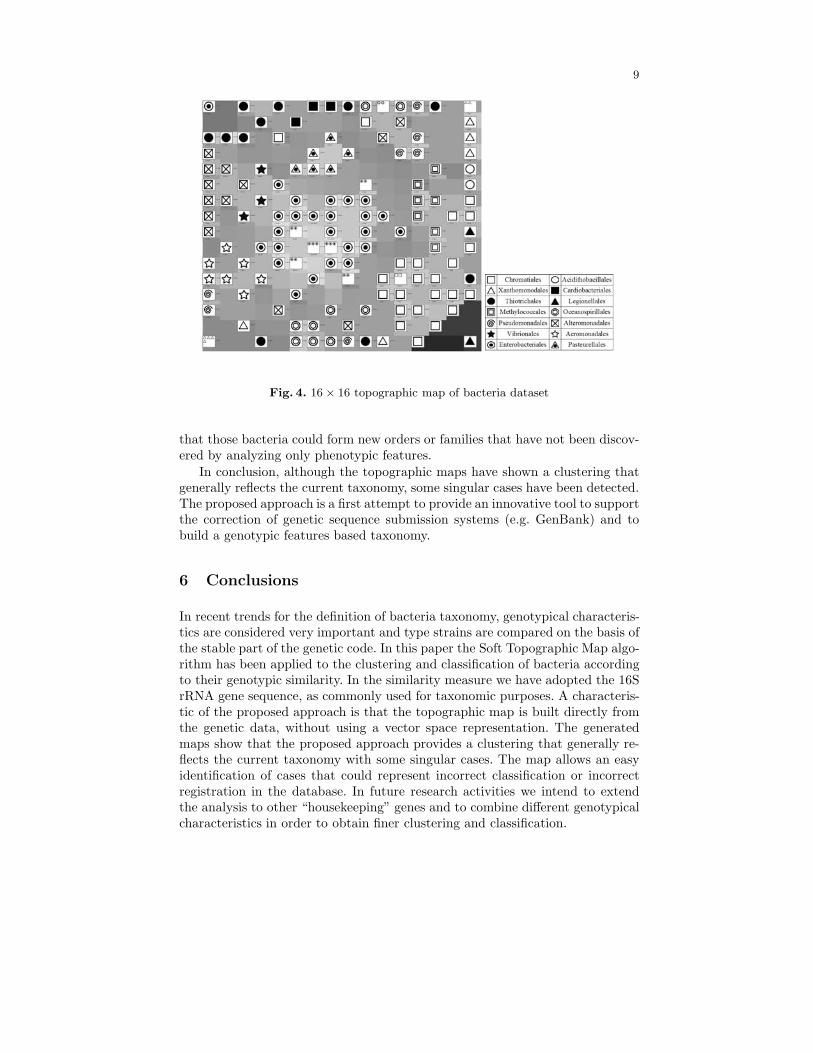
In Figures 3, 4, 5, we show the results provided by 12× 12, 16× 16, 20× 20maps, trained with the dissimilarity matrix using the pairwise alignment. In themaps, bright areas denote proximity and dark zones represent distance, accordingto the U-Matrix style [32].
It should be noticed that in larger maps the units tend to classify homo-geneous patterns better. Namely, comparing the maps we can observe that thenumber of bacteria belonging to mixed clusters, i.e units containing bacteria of

8
Fig. 3. 12× 12 topographic map of bacteria dataset
different orders, decreases as the number of neurons increases (Figure 6). There-fore, the 20× 20 map is the most accurate. In all the maps most of the bacteriaare classified according to their order in the actual taxonomy. We can also seethat bacteria belonging to the order “Enterobacteriales” are split into a seriesof adjacent clusters in the central part of the map. This could mean that theorder “Enterobacteriales” could be subdivided into distinct families rather thanthe single one of the actual taxonomy (see Figure 2).
Finally, an interesting result is that there are some anomalies that are con-stant for all the tests regardless of the chosen map dimension and alignment algo-rithm. For example, in small maps (not shown here) the “Alterococcus agarolyti-cus” bacterium of the “Enterobacteriales” order is incorrectly clustered togetherwith bacteria of other orders, whereas in larger maps it is isolated in an indi-vidual cluster, usually at the border of the map (e.g. at the lower left corner ofFigure 3 and at upper left conrner of Figures 4 and 5). Another interesting ex-ample is given by “Legionella pneumophila” bacterium of “Legionellales” order:that in all maps is located in a corner of the grid and surrounded by a dark greyarea. This would suggest that it can be considered to have an order of its own.In general, we noticed that in the transition from smaller maps to larger onesthere is always a set of bacteria that show the following anomalies:
– bacteria belonging to mixed clusters and far from their homologous bacteria,– isolated bacteria in a single cluster far from their homologous bacteria.
In the former case, it is possible that those bacteria were either incorrectlyclassified or incorrectly registered into GenBank. In the latter, it is very likely
9
Fig. 4. 16× 16 topographic map of bacteria dataset
that those bacteria could form new orders or families that have not been discov-ered by analyzing only phenotypic features.
In conclusion, although the topographic maps have shown a clustering thatgenerally reflects the current taxonomy, some singular cases have been detected.The proposed approach is a first attempt to provide an innovative tool to supportthe correction of genetic sequence submission systems (e.g. GenBank) and tobuild a genotypic features based taxonomy.
6 Conclusions
In recent trends for the definition of bacteria taxonomy, genotypical characteris-tics are considered very important and type strains are compared on the basis ofthe stable part of the genetic code. In this paper the Soft Topographic Map algo-rithm has been applied to the clustering and classification of bacteria accordingto their genotypic similarity. In the similarity measure we have adopted the 16SrRNA gene sequence, as commonly used for taxonomic purposes. A characteris-tic of the proposed approach is that the topographic map is built directly fromthe genetic data, without using a vector space representation. The generatedmaps show that the proposed approach provides a clustering that generally re-flects the current taxonomy with some singular cases. The map allows an easyidentification of cases that could represent incorrect classification or incorrectregistration in the database. In future research activities we intend to extendthe analysis to other “housekeeping” genes and to combine different genotypicalcharacteristics in order to obtain finer clustering and classification.

10
Fig. 5. 20× 20 topographic map of bacteria dataset
References
1. Garrity, G. M., Julia B. A. and Lilburn T. 2004. The revised road map to the manual,p. 159-187. In G. M. Garrity (ed), Bergey’s manual of systematic bacteriology.Springer-Verlag, New York, N.Y.
2. I. T. Joliffe, Principal Component Analysis, Springer-Verlag, New York, 1986.3. Clarridge, Jill E., III. Impact of 16S rRNA Gene Sequence Analysis for Identification
of Bacteria on Clinical Microbiology and Infectious Diseases Clin. Microbiol. Rev.2004 17: 840-862
4. Drancourt, Michel, Bollet, Claude, Carlioz, Antoine, Martelin, Rolland, Gayral,Jean-Pierre, Raoult, Didier. 16S Ribosomal DNA Sequence Analysis of a LargeCollection of Environmental and Clinical Unidentifiable Bacterial Isolates J. Clin.Microbiol. 2000 38: 3623-3630
5. Drancourt, M., Berger, P., Raoult, D. Systematic 16S rRNA Gene Sequencing ofAtypical Clinical Isolates Identified 27 New Bacterial Species Associated with Hu-mans J. Clin. Microbiol. 2004 42: 2197-2202
6. Drancourt, M., Raoult, D. Sequence-Based Identification of New Bacteria: a Propo-sition for Creation of an Orphan Bacterium Repository J. Clin. Microbiol. 2005 43:4311-4315
7. M. Oja, P. Somervuo, S. Kaski, and T. Kohonen, “Clustering of human endogenousretrovirus sequences with median self-organizing map”, in WSOM’03 Workshop onSelf-Organizing Maps, 9-14 Sep 2003.
8. Butte, A.J., and Kohane, I.S. (2000) Mutual information relevance networks: func-tional genomics clustering using pairwise entropy measurements. Proc. Pacific Sym-posium on Biocomputing, 5, 415-426.
9. P. Somervuo and T. Kohonen, Clustering and visualization of large protein sequencedatabases by means of an extension of the self-organizing map, in Discovery Science.Proceedings of the Third International Conference (2000), pp. 76–85.

11
Fig. 6. Bacteria in mixed clusters w.r.t. map size
10. Teuvo Kohonen and Panu Somervuo, How to make large self-organizing maps fornonvectorial data, Neural Networks, Volume 15, Issues 8-9, October-November 2002,Pages 945-952.
11. Yonghui Chen; Reilly, K.D.; Sprague, A.P.; Zhijie Guan. SEQOPTICS: A ProteinSequence Clustering Method. Computer and Computational Sciences, 2006. IM-SCCS ’06. First International Multi-Symposiums on, Vol.1, Iss., 20-24 June 2006Pages: 69- 75
12. Ankerst M, Breunig MM, Kriegel HP, Sander J: OPTICS: Ordering Points ToIdentify the Clustering Structure. In SIGMOD 1999, Proceedings ACM SIGMODInternational Conference on Management of Data, June 13, 1999, Philadelphia,Pennsylvania, USA, 1999:49-60.
13. Maido Remm, Christian E. V. Storm and Erik L. L. Sonnhammer, Automaticclustering of orthologs and in-paralogs from pairwise species comparisons, Journalof Molecular Biology, Volume 314, Issue 5, 14 December 2001, Pages 1041-1052.
14. Altschul S, Gish W, Miller W, Myers E, Lipman D: Basic local alignment searchtool. J Mol Biol 1993, 232:584-99.
15. http://www.ncbi.nlm.nih.gov/blast/fasta.shtml16. S. Dubnov, R. El-Yaniv, Y. Gdalyahu, E. Schneidman, N. Tishby, and G. Yona.
A new nonparametric pairwise clustering algorithm based on iterative estimation ofdistance profiles Machine Learning, 47, 3561, 2002
17. J. Buhmann, T. Zoller, “Active Learning for Hierarchical Pairwise Data Cluster-ing,” icpr p. 2186, 2000.
18. Thomas Hofmann and Joachim M. Buhmann. Hierarchical pairwise data clusteringby mean–field annealing. In Proceedings of ICANN’95, NEURON IMES’95, volumeII, pages 197–202. EC2 & Cie, 1995.
19. Graepel, T., Herbrich, R., Bollmann-Sdorra, P., and Obermayer, K., “Classificationon Pairwise Proximity Data, ” NIPS.
20. T. Hofmann and J. Buhmann. Multidimensional scaling and data clustering. In G.Tesauro, D. S. Touretzky, and T. K. Leen, editors, Advances in Neural InformationProcessing Systems 7, pages 459–466. Cambridge, Mass: MIT Press, 1995.

12
21. Hansjrg Klock and Joachim M. Buhmann. Multidimensional scaling by determin-istic annealing In Springer Lecture Notes in Computer Science Venice, editor, Pro-ceedings of the International Workshop on Energy Minimization Methods in Com-puter Vision and Pattern Recognition, EMMCVPR’97, volume 1223, pages 246–260,May 1997.
22. W. S. Torgerson, “Multidimensional scaling: I. Theory and method,” Psychome-trika, vol. 17, pp. 401–419, 1952.
23. J. D. Thompson, D. G. Higgins, and T. J. Gibson. CLUSTAL W: improving thesensitivity of progressive multiple sequence alignment through sequence weighting,position specific gap penalties and weight matrix choice. Nucleic Acids Research,22:4673–4680, 1994.
24. Needleman, S. B. and Wunsch, C. D. (1970) J. Mol. Biol. 48, 443-453.25. T. H. Jukes and C. R. Cantor, Mammalian Protein Metabolism, H. N. Munro,
editors, Academic Press, New York, 1969, ch. Evolution of Protein Molecules, pp.21– 132.
26. S. P. Luttrell, “A Bayesian analysis of self-organizing maps,” Neural Comput., vol.6, pp. 767–794, 1994.
27. T. Graepel, M. Burger, and K. Obermayer. Self-organizing maps: generalizationsand new optimization techniques. Neurocomputing, 21:173–190, 1998.
28. Graepel, T. and Obermayer, K. (1999). A stochastic self organizing map for prox-imity data. Neural Computation, 11:139–155.
29. T. Hofmann and J. M. Buhmann, “Pairwise data clustering by deterministic an-nealing,” IEEE Transactions on Pattern Analysis and Machine Intelligence, vol. 19,pp. 1–14, 1997. 154
30. Rose, K., “Deterministic Annealing for Clustering, Compression, Classification,Regression, and Related Optimization Problems, ” Proc. of the IEEE, Vol. 86:11,pp.2210-2239, 1998.
31. Teuvo Kohonen. Self-organizing maps. Springer, Berlin; Heidelberg; New-York,1995.
32. Ultsch, A. U*-Matrix: a Tool to visualize Clusters in high dimensional Data, Tech-nical Report No. 36, Dept. of Mathematics and Computer Science, University ofMarburg, Germany, (2003)
33. http://www.ncbi.nlm.nih.gov/entrez/query.fcgi?db=Nucleotide34. S Kumar, K Tamura, and M Nei (2004) “MEGA3: Integrated software for Molecu-
lar Evolutionary Genetics Analysis and sequence alignment” Briefings in Bioinfor-matics 5:150-163.
35. Rice,P. Longden,I. and Bleasby,A. EMBOSS: The European Molecular BiologyOpen Software Suite (2000) Trends in Genetics 16, (6) pp276–277