liyi zhang - tel
TRANSCRIPT

HAL Id: tel-00689788https://tel.archives-ouvertes.fr/tel-00689788
Submitted on 20 Apr 2012
HAL is a multi-disciplinary open accessarchive for the deposit and dissemination of sci-entific research documents, whether they are pub-lished or not. The documents may come fromteaching and research institutions in France orabroad, or from public or private research centers.
L’archive ouverte pluridisciplinaire HAL, estdestinée au dépôt et à la diffusion de documentsscientifiques de niveau recherche, publiés ou non,émanant des établissements d’enseignement et derecherche français ou étrangers, des laboratoirespublics ou privés.
Study of the transferability of microsatellite markersderived from bread wheat (T. aestivum) or rice ( O.
sativa) ESTs (EST-SSRs) to their close and wild relativeand evaluation of their potential for the organisation of
genetic resources in the grass familyLiyi Zhang
To cite this version:Liyi Zhang. Study of the transferability of microsatellite markers derived from bread wheat (T.aestivum) or rice ( O. sativa) ESTs (EST-SSRs) to their close and wild relative and evaluation of theirpotential for the organisation of genetic resources in the grass family. Vegetal Biology. UniversitéBlaise Pascal - Clermont-Ferrand II; Université d’Auvergne - Clermont-Ferrand I, 2006. English.�NNT : 2006CLF21650�. �tel-00689788�

Etude de la portabilité de marqueurs microsatellites issus d’EST de blé tendre (T. aestivum) ou de riz (O.sativa) vers des espèces apparentées et évaluation de leur intérêt pour la
structuration des ressources génétiques chez les graminées
UNIVERSITE BLAISE PASCALNo D.U. 1650 Année 2006
ECOLE DOCTORALE DES SCIENCS DE LA VIE & DE LA SANTE
T H E S E
Présentée à l’Université Blaise Pascal pour l’obtention du titre de
D O C T E U R D ’ U N I V E R S I T E
(Spécialité : Biologie Moléculaire Végétale)
Soutenance le 23 mai 2006
Liyi ZHANG
Président : Examinateurs:
Rapporteur :
Directeur de thèse :
U.M.R. INRA/UBP Amélioration et Santé des Plantes – INRA de Clermont-Ferrand
P. NICOLASM. BERNARDP. BARRE (Invité)D. CROUZILLATF. QUETIERP. DEVAUXP. SOURDILLE
UNIVERSITE D’AUVERGNE
No d’ordre 437


Study of the transferability of microsatellite markers derived from bread wheat (T. aestivum) or rice (O. sativa) ESTs (EST-SSRs) to their close and wild relatives and evaluation of their
potential for the organization of genetic resources in the grass family
UNIVERSITE BLAISE PASCALNo D.U. 1650 Année 2006
ECOLE DOCTORALE DES SCIENCS DE LA VIE & DE LA SANTE
T H E S E
Présentée à l’Université Blaise Pascal pour l’obtention du titre de
D O C T E U R D ’ U N I V E R S I T E
(Spécialité : Biologie Moléculaire Végétale)
Soutenance le 23 mai 2006
Liyi ZHANG
Président : Examinateurs:
Rapporteur :
Directeur de thèse :
U.M.R. INRA/UBP Amélioration et Santé des Plantes – INRA de Clermont-Ferrand
P. NICOLASM. BERNARDP. BARRE (Invité)D. CROUZILLATF. QUETIERP. DEVAUXP. SOURDILLE
UNIVERSITE D’AUVERGNE
No d’ordre 437


Remerciements
Cette thèse a été réalisée avec l’aide d’une bourse de China Scholarship Council (CSC)
Je tiens tout d’abord à remercier Michel Beckert et Gilles Charmet, directeurs successifs
de la station d’Amélioration des Plantes de l’INRA de Clermont-Ferrand, pour leur
accueil au sein de leur établissement.
Mes remerciements sont adressés à Michel Bernard et Catherine Feuillet qui m’ont
accueillie dans leur équipe et pour leur critique des publications.
Mes remerciements sont particulièrement adressés à Pierre Sourdille qui m’a encadrée au
laboratoire et m’a aidé pour la rédaction de ma thèse et des publications avec beaucoup
de patience et de façon très constructive. Nos échanges scientifiques sur les marqueurs
microsatellites ont été passionnants et fructueux.
J’adresse également toute ma reconnaissance à Sylvie Bernard pour son aide pour la
prononciation du français et à Philippe Leroy qui m’a initiée aux blast contre les
séquences génomiques chez le riz et le blé. Merci encore à Catherine Ravel pour m’avoir
aidée dans les analyses statistiques et la construction des arbres phylogénétiques et à
François Balfourier pour ses conseils dans les analyses de diversité et pour la fourniture
de toutes les espèces cultivées ou sauvages de graminées. Merci enfin à Christiane, Jérome
et Pierre B pour leurs précieux conseils et à Gilles B et Nicolas pour m’avoir aidé à
analyser les produits PCR sur Genescan et Genotyper
Une pensée toute particulière à tous ceux qui sont passés au labo BM et Génotypage, qui
sont partis ou y sont encore : Bouzid, Delphine B, Cécile, Vincent, Nathalie N, Valérie,
Fatou, Elisabeth, Delphine R, Etienne, Walid, Cyril, Caroline, Nathalie M, Séverine, Lydia,
Pierre D, Jacqueline et Stéphane.
Merci à Pascal pour avoir arrangé beaucoup de choses et à Jeff pour le coup de main avec
le PC et les problèmes d’imprimante.
Merci à ma famille et surtout à ma mère et mon père pour m’avoir encouragée et soutenue.
Enfin, merci à mon mari et mon fils pour leur soutien, et surtout à mon fils pour m’avoir
accompagnée pendant tout ce temps en France.


Abbreviations
DNA:DeoxyriboNucleic Acid AFLP: Amplified Fragment Length Polymorphism CDS: Coding DNA Sequence CTAB: Cetyl Trimethyl Amonium Bromide CIMMYT : Centro International de Mejoranniento de Maiz Y Trigo (Mexique) BLAST: Basic Local Alignment Search Tool EDTA: Ethylene Dinitrilo Tetraacetic Acid EST: Expressed Sequence Tag EST-SSR: Simple Sequence Repeats derived from Expressed Sequence Tag FAO: Food and Agriculture Organization H2OUP: ultra pure water ISSR: Inter Simple Sequence Repeats ITMI: International Triticeae Mapping Initiative kb: kilobase ORF: Open Reading Frame MAS: Marker Assisted Selection NIRS: Near Infrared Spectroscope pb: pair of bases PCR: Polymerase Chain Reaction PIC: Polymorphism Information Content QTL: Quantitative Trait Locus RAPD: Random Amplified Polymorphic DNA RFLP: Restriction Fragment Length Polymorphism SCAR: Sequence-Characterized Amplified Region SDS: Sodium Dodecyl Sulfate SNP: Single Nucleotide Polymorphism SSLP: Simple Sequence Length Polymorphism SSCP: Simple Sequence Conformation Polymorphism SSR: Simple Sequence Repeat STS: Sequence Tagged Site TBE: Tris Borate EDTA TE: Tris EDTA TEMED: Tetra Methyl Ethylene Diamine TIGR: The Institute for Genomic Research 5’-UTR: 5’- UnTranslated Regions 3’-UTR: 3'- UnTtranslated regions


Table of content
Introduction………………………………………………………………….…1
Chapter I: Bibliography………………………..………….……………………….…3 1. Hexaploid wheat………………………………..……………………………………...3
1.1 Economical importance of wheat……...…….……………………………………...…3
1.2 Classification of the hexaploid wheat………………...……………………………….4
1.3 Origins of bread wheat…………………...……………………………………….…...5
1.4 Genetic specificity of bread wheat………………...…………………………………5
2. Simple sequence repeats (SSRs) …………………...……..…………………….….…..7
2.1 Definition and classification …………………………………………...……………….7
2.2 Advantages of SSRs compare to other markers……………………….…………….….7
2.3 SSRs within genomes…………………………………………...………………….…8
2.3.1 Abundance in genomes………………….……………………………………….….8
2.3.2 Dispersion within genomes…………….………………………………………….….9
2.3.3 Composition ……………….………………………………………………………..10
2.3.4 Number of repeats……………………………...……………………………………12
2.4 SSRs within cereals…………………………………...……………………………….12
2.5 Level of polymorphism of SSRs………………………..…………………………….13
2.5.1 Definition of SSR polymorphism……………...…………………………………….13
2.5.2 Mutational mechanisms of SSRs……………….……………………………………14
2.5.2.1 Replication slippage……………………...………………………………………..14
2.5.2.2 Unequal Recombination…………...………..…………………………………...14
2.5.2.3 Interaction replication slippage and recombination…………………...…………..15
2.5.3 Polymorphism of g-SSRs……………………………………...………………….…15
2.5.4 Polymorphism of EST-SSRs………………………………………………………...16
2.6 Role and function of the SSRs……………………………………………………....16
2.6.1 DNA conformation……………………….……………………………………….…16
2.6.2 Promoter regulation…………………...………………………………………….….16
2.6.3 Meiosis and mitosis………………...………………………………………………..17
2.6.4 Coding function……………………..…………………………………………….…17


2.7 Application of SSRs to plant genetic studies……………..…………………………....17
2.7.1 Genetic mapping……………………...……………………………………..…17
2.7.2 Genetic diversity……………………………………………………………….…..18
2.7.3 Comparative mapping…………………………...……………………………….….19
2.7.4 Phylogenic studying…………………………..…………………………………...20
2.7.5 MAS breeding……………………………………………………….……………....20
3. Organizations of genetic resources ………………………………………………..…22
3.1 History……………………………………………………………………………....22
3.2 Definition and classification…………………………………………..………….…22
3.3 Collections………………………………………………………….……………...23
3.3.1 Landraces…………………………………………………………..………………23
3.3.2 Wild species………………………………………………………….…………….24
3.4 Evaluation for genetic resources…………………………………………………..24
3.4.1 Agronomic and morphologic data……………………………………………….25
3.4.2 Isozymes data……………………………………..…………………………….25
3.4.3 NIRS data…………………………………………………………………….…26
3.4.4 Molecular data…………………………….………………………………….…27
3.4.4.1 RFLP…………………………….…………………………………………..27
3.4.4.2 RAPD…………………………...………………………………………….….27
3.4.4.3 AFLP………………………..……………………………………………...28
3.4.4.4 Microsatellites……………………………………………………………….29
3.4.4.5 ISSR………………………………………………………………………………30
3.4.4.6 STS……………………………………………………………………………….30
3.4.4.7 SNPs…………………………………………………………………………...31
3.4.4.8 ESTs………………………………………………………………………………31
3.4.4.9 Comparison between the different types of markers for diversity…………….32
3.5 Aims of the thesis…………………….……………………………………………..34
3.5.1 Scientific question…………………………………….…………………………34
3.5.2 Methodology……………………………………………………………………34
3.5.3 Deliverables………………………………………….………………………….35

Chapter II: Materials and Methods…………………...…………………………36
1. Plant material and extraction……………………………………..……………………36
1.1 Hexaploid wheats for polymorphism evaluation………………...…………………..36
1.2 Grass species for transferability studies…………………….…………………………36
1.3 Aneuploid lines………………………………………………………………………37
1.4 Segregating populations………………………………………….……………………37
1.4.1 ITMI population……………………………………………………….…………..37
1.4.2 Courtot X Chinese Spring population…………………….……………………….37
1.5 DNA extractions………………………………………….…………………………...38
2. Wheat and rice EST-SSRs……………………….…………………………………….38
2.1 Analysis of the wheat ESTs…………………………………………………………..38
2.2 Primer design………………………………..………………………………………..39
2.3 Rice EST-SSRs…………………………...…………………………………………..39
2.4 EST-SSR detection………………………...………………………………………..40
2.4.1 Principle of the M13-tailed primer method………………………………………..40
2.4.2 PCR reaction and detection………………………………………………………..40
3. Data analysis…………………………………….…………………………………….41
3.1 Genetic and cytogenetic mapping of EST-SSRs………………...…………………….41
3.1.1 Chromosomal assignment…………………...…………………………………….41
3.1.2 Genetic mapping………………………………………..………………………….41
3.2 Transferability of the EST-SSRs to wheat related species…………………………….42
3.3 In silico analysis of EST-SSRs……………………………………...…………………42
3.4 Distribution of EST-SSRs on the rice genome……………………………….………..43
3.5 Determination of Polymorphism Information Content (PIC) values……………...…..43
3.6 Determination of the Jaccard similarity coefficient ………………………….……….43
3.7 Unweighted Pair Group Method with Arithmetic Mean (UPGMA)…………….…….44
Chapter III: Results and discussion………………………………..…………….45
1 Analysis of the wheat ESTs………………………………………..…………….……45
1.1 Characteristics of EST-SSRs………………………………….……………………….45


1.2 Amplification and polymorphism of EST-SSRs………...…………………………….46
1.3 Genetic mapping of the EST-SSRs……………………...…………………………….46
1.4 Discussion……………………………………………………………...……………...47
2 Transferability of the wheat EST-SSRs to grass species…………………...…………50
2.1 Publication 1: High transferability of bread wheat EST-derived SSRs to other cereals
(2005, Theor Appl Genet 111:677-687)………………………...…………………...51
2.2 Publication 2: Transferable bread wheat EST-SSRs demonstrated that grass species can
be a reservoir of new alleles for wheat improvement (Plant Breeding in
press)…………………………………………………………..………………………61
2.3 Comments and perspectives………………...……………………………………...….76
3 Transferability of EST-SSRs between wheat and rice…………...……………………77
3.1 Transferability from bread wheat to rice…………..…………………………………..77
3.2 Transferability from rice to bread wheat…………………………..…………………..77
3.3 Discussion, comments and perspectives………………….………………...………...80
4 Phylogenetic studies of Triticeae using wheat EST-SSRs…………...………………..83
4.1 Publication 3: Transferable bread wheat EST-SSRs can be useful for phylogenetic
studies among the Triticeae species (Theor Appl Genet, on line first, DOI:
10.1007/s00122-006-0304-4)…………………………………………………….… 84
4.2 Comparison of the classification of T. aestivum lines obtained using g-SSRs and
EST-SSRs…………………………………………………………..….………..….96
4.3 Genetic diversity of Triticale species……………………………………………..….97
4.4 Phylogenetic relationship for species with D genome…………………..…………...98
4.5 Phylogenetic relationship between all the species……………………...……….....98
4.6 Discussion……………………………………………………….…………………..99
4.7 Comments and perspectives………………………………………………..………...101
General Conclusion………………………………...……………………………….102
1. Analysis of the wheat ESTs………………………………………..…………………102
1.1 Main results……………………………………………………...……………...……102
1.2 Perspectives…………………………………………...……………………………..102
2. Transferability of the wheat EST-SSRs……………………………..………………..103
2.1 Main results………………………………………...………...………………………103
2.2 Perspectives………………………………………………………..…………...……104
3. Phylogenetic studies………………………………………………..…………….…..104


3.1 Main results………………...………………………………...………………………104
3.2 Perspectives…………………………………………………………………..……...105
4. Transferability of rice EST-SSRs………………………………..…………………...105
4.1 Main results………………………………………………….………………………105
4.2 Perspectives…………………………………………..………………………………106
5. Conclusion…………………………………………………..………………………..106
References............................................................................................................108
Annexes Annex 1: Fifteen international agricultural research centres supported by the CGIAR
Annex 2: The list of plant genotypes used for transferability assessment and phylogenetic
analysis
Annex 3: List of EST-SSRs developed from common wheat
Annex 4: Result of amplification, polymorphism and transferability for 301 EST-SSRs
Annex 5: Genetic map from ITMI and CTCS segregating populations
Annex 6: Protocols & Products


INTRODUCTION

Introduction
- 1 -
Introduction
Since humans have domesticated and cultivated the plant species that were necessary for
their own or cattle feedings or for their material needs, they have been confronted to
numerous plant development harmful events. Those events are abiotic stresses such as
drought or soil salinity as well as biotic stresses like devastating insects or diseases. In
order to face these constraints, several cultural practices aiming at correcting the
environment such as irrigation, fertilizer supplies, or phytosanitary treatments were
developed. At the same time, knowledge in plant genetics and especially cereals that have
dramatically increased since the beginning of the 20th century, have been extensively
exploited in order to genetically improve cultivated crops (Green Revolution during the
sixties). Especially, criteria that are the most largely taken into account in genetic breeding
are yield, environment adaptation (earliness, drought resistance…) and disease resistances.
Until now, the cereals world production has covered the human needs, even outpacing
population growth leading to surpluses in the past twenty years. However, the demographic
increase that is estimated for the next 50 years will induce a simultaneous increase in the
world cereal demand for feeding. If cultivating more and more lands has been the
traditional answer to address the growing needs of the population, this will no longer be the
case because of the decrease of agricultural land areas, especially in the developing
countries, leading thus probably to stock depletions.
In addition, agriculture has also now to face ecological constraints. Intensive agriculture
has induced huge modifications of the environment (deforestation, suppression of the
hedges and ditches…) leading in soil degradation and in flooding. Also, intensive use of
fertilizers, herbicides, insecticides and fungal treatments has conducted simultaneously to
deplete the animal as well as floral genetic variability, to pollute phreatic water and to
contribute to the eutrophy of lakes and rivers.
Thus, improvement of cereal yield in the context of sustainable agriculture has to be
reached in the next decades to meet human needs by 2050. Significant advances in the
understanding of the plant biology as well as in the management and exploitation of
genetic resources must be achieved to face this challenge. Concerning this latter point,
genetic variability in cereals and especially in wheat is extremely extended but remains
largely underexploited. This is due: (1) to the poor knowledge of the capacities of these


Introduction
- 2 -
resources in terms of biotic and abiotic resistances as well as their potential for bread
making quality or yield performances; (2) to the fact that they are bearing many traits of
low agronomical interest such as plant height, lodging susceptibility, free threshing, hulled
kernels… Because of this, low attentions have been paid on the study of wheat related
species especially in genomic areas while genomics has exploded in wheat in the last five
years leading to better marker-assisted selection and to the positional cloning of a number
of genes of agronomic interest.
The first aim of the thesis was to develop efficient genomic tools to study a wide range of
wheat related species. Especially, we decided to focus our efforts in the development of
molecular markers that can be used on wheat as well as on a large range of wild and
cultivated wheat-related species that can be of interest for wheat genetic improvement.
These markers would further be used to follow introgressions of genes of agronomical
interest issued from these species, and to reduce the linkage drag of unfavourable alleles
that they carry. The second aim was to use these markers to study the genetic variability
existing within these species in comparison to wheat, in order to see whether they can be
used as source of new alleles. We also assessed the relationships between and within these
species. All this work will support the research towards the improvement of wheat and a
better understanding of the organisation, function and evolution of the wheat genome.


BIBLIOGRAPHY

Tab 1-1. World wheat production (million tonnes)
Fig1-1. Wheat production worldwide compared with the area sown to wheat from 1961 to 2000.
Bibliography – Hexaploid wheat
- 3 -
Chapter I: Bibliography
1. Hexaploid wheat
Small grain cereals offer the decisive advantage of constituting supplies that can be stored
as grains, which have a high nutritional value due to their starch as well as protein contents.
In addition, they can be easily transformed by cooking under numerous forms. First
archeological evidences of cereal harvests date about 10,000 years ago and were found in
the Middle-East, in the “Fertile Crescent” (Feldman, 1976) where einkorn (T. boeoticum)
and wild durum species (T. dicoccoides) were subjected to gathering. Among the cereals,
bread wheat (Triticum aestivum L.) occupies arguably the most important place. It
appeared in the same region about 8,000 years ago and was one of the first domesticated
crops. Then it was dispersed all over the world from Greece and Europe and has served as
staple food for the major civilizations in Europe, West Asia and North Africa. At the
present time, wheat remains the most important food source for humans and one of the
most important merchandise for economical exchanges.
1.1 Economical importance of wheat
Wheat is grown as a commercial crop in 120 countries on an area of 217 million hectares
in 2004 (FAO source) which represents about one third of the total cereal-cultivated areas.
Wheat is also the most productive among the cereals and the combined harvests in 2004
were 627 million metric tonnes. The major producers in 2004 were China, European Union
(25 countries), India, U.S.A., Russian Federation, Canada and Australia. The world wheat
production in 2005 is expected to be 612 million tonnes, 15 million tonnes lower than the
record in 2004 but still well above than the average of the past five years (Tab. 1-1) (FAO;
http://www.fao.org/).
Improvement of cultural practices and genetic breeding since the beginning of the 20th
century largely contributed to increase the world yields from 0.9 t/ha in 1900 to 2.9 t/ha in
2004. For example, since the early 1960s there has been little increase in the area sown
with wheat, but over the same period, yields have increased almost 3-fold (Fig. 1-1).
However, yields remain very different among the countries and if they can reach a mean of
7.8 t/ha in the Netherlands, they are only of 0.34 t/ha in Somalia.
Wheat also takes the first place in the international agricultural trade of cereal productions.

Fig 1-2. Wheat import by region Fig 1-3. Wheat export price
(US No.2 Hard Winter, Gulf)
Fig 1-4: Close and wild related species of T. aestivum
Bibliography – Hexaploid wheat
- 4 -
World trade in wheat in the current 2004/2005 marketing year is now forecast to reach 103
million tonnes (FAO; http://www.fao.org/). Fig. 1-2 and 1-3 indicate the situation of wheat
import of each region in the whole world and the price of wheat export in 2004 and 2005,
respectively.
Wheat is primarily grown for its grain which is mainly used in bakery but it has other uses
in the livestock feed and industry. Bread wheat can be roughly classified into several types,
based on the growth habit (spring vs winter) and the hardness of the kernel endosperms
(hard vs soft). The hard types of bread wheat often show high protein contents, especially
gliadins and glutenins. They are mainly utilized for the production of a large variety of
leavened and flat breads. The high level of these protein fractions in the flour imparts
elasticity to bread dough and allow it to expand during leavening and baking. On the
contrary, soft wheats are generally low in protein content, and are thus mostly milled into
flour for use in a wide variety of bakery products such as cakes, pastries, and unleavened
breads.
1.2 Classification of the hexaploid wheat
Botanically, wheat (Triticum aestivum L. em Thell) belongs to the sub-family of the
Pooideae within the grass family (Poaceae) which also includes the sub-families of the
Bambusoideae that comprises rice (Oryza sativa) and of the Panicoideae that comprises
maize (Zea mays), sorghum (Sorghum bicolor) and sugar cane (Saccharum officinarum).
Within the Pooideae sub-family, wheat belongs to the Triticodeae super-tribe and to the
Triticeae tribe. This latter tribe includes three important sub-tribes: the Triticineae with the
Triticum and Aegilops species, the Secalineae with rye (Secale cereale) and the Hordineae
with barley (Hordeum vulgare). Over two dozen individual species have been
characterized as members of the genus Triticum among which only T. monococcum L., T.
turgidum L., T. aestivum L. are widely cultivated and only the two latter are common.
Relationships between T. aestivum and its close and wild relatives are listed in Fig. 1-4.
It was early demonstrated that wheats formed polyploid series (Sakamura, 1918). The
diploid species contain eight distinct genomes that were given a letter as names often
followed by an additional letter representing the sub-species: A (T. monococcum ssp.
boeoticum, Ab; ssp. monococcum, Am; ssp. urartu, Au), C, D, M, N, S (Sitopsis section: Ae.
speltoides, Ss; Ae. bicornis, Sb; Ae. longissima, Sl; Ae. sharonensis Ssh), T and U. Two of
the genomes found in polyploid wheats were given new names, B and G, because their
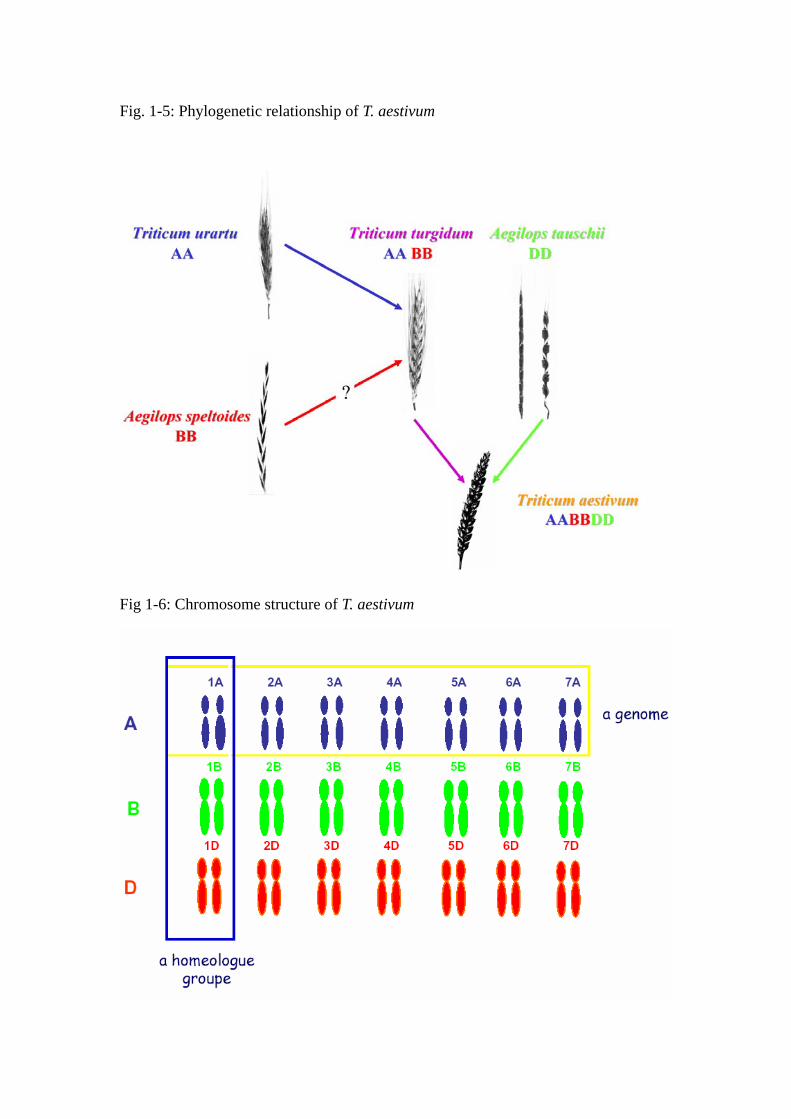
Fig. 1-5: Phylogenetic relationship of T. aestivum
Fig 1-6: Chromosome structure of T. aestivum

Bibliography – Hexaploid wheat
- 5 -
diploid progenitors were not known. Some of the diploid species contributed to the
genomes of polyploid species. The Triticum and Aegilops species gather diploid as well as
polyploid species among which hexaploid bread wheat (Triticum aestivum) occupies the
most important place of the Triticeae tribe.
1.3 Origins of bread wheat
Hexaploid bread wheat (Triticum aestivum L.em.Thell. 2n = 6x = 42) is an allopolyploid
species which arose under cultivation 8,000 years ago from hybridization, followed by
spontaneous chromosome doubling, between T. turgidum ssp. dicoccum and the diploid
goatgrass Aegilops tauschii ssp. strangulate (2n= 6x =14, DD-genome; McFadden et al.
1946; Jaaska 1980). Early cytogenetic studies suggested that the A genomes of the
polyploids were contributed by T. monococcum (Sax 1922; Lilienfeld and Kihara 1934) but
more recent studies evidenced that T. urartu was the real donor of the A genome (Natarajan
et al. 1974; Huang et al. 2002). The origins of the B genome remain uncertain and
controversial (Kerby and Kuspira, 1987). At least six different diploid Aegilops species
from the Sitopsis section were proposed as possible source of the B genome. Other studies
suggest a possible polyphyletic origin of the B genome. Two different allotetraploids with a
common A genome (AAXX and AAYY) could have hybridized and within their descent,
the X and Y genomes could have rearranged and gave rise to the actual B genome.
However, Ae. speltoides is at the present time the most likely living relative of an extinct or
yet to be discovered B genome donor species (Fig. 1-5, Sarkar and Stebbins 1956; Riley et
al. 1958; Rees and Walters 1965; Natarajan and Sharma 1974; Chen et al. 1975; Jaaska
1980; Hassan and Gustafson 1996, Maestra and Naranjo 1998).
1.4 Genetic specificity of bread wheat
The wheat genome is hexaploid and is made by the juxtaposition of three simple genomes
named A, B and D also called homoeologues. DNA is organized into 21 pairs of
chromosomes (Fig. 1-6), seven pairs belonging to each of the A, B and D genomes (Sears
1954; Okamoto 1962). Within each diploid genome, the chromosomes are designated from
1 to 7. The size of each diploid genome varies between 4,500 and 6,000 mega bases (Mb,
Bennet and Leitch, 1995) depending on the species. The bread wheat genome size was thus
estimated to be 16,974 Mb (1C, Bennet and Smith, 1991) which represents 4, 40 and 130
times more than the human, rice and Arabidopsis thaliana genomes respectively. Wheat


Bibliography – Hexaploid wheat
- 6 -
genome is very complex and consists of unique or low-copy sequences surrounded by
regions of highly repetitive DNA which represents about 70-80% of the genome (Flavell et
al., 1977; Vedel and Delseny, 1987; Wicker et al., 2003). Although early studies indicated
gene clustering in gene-rich islands located in distal parts of the chromosomes (telomeres),
it is now believed that the islands are dispersed throughout the whole length of the
chromosomes (Akhunov et al., 2003). Repetitive DNA mainly consists of transposable
elements (e.g. Fatima, Caspar and Angela, Sabot et al., 2005) but Simple Sequence
Repeats (SSRs) located in non-coding as well as in coding sequences are also frequent.

Fig 1-7: Examples of different types of SSRs
a. Perfect repeats without interruptions
GAGAGAGAGAGAGAGAGAGAGAGAGAGAGAGA
b. Imperfect repeats with one or more interruptions
GAGAGAGAGAGAGAGCGAGAGAGAGAGAGAGA
c. Compound repeats with adjacent tandem simple repeats of a different repeat:
Perfect compound repeats: GAGAGAGAGAGAGAGAGTGTGTGTGGTGTGTGTG
Imperfect compound repeats: GAGAGAGAGAGAGAGGGGTGTGTGGTGTGTGT

Bibliography – Simple Sequence Repeats
- 7 -
2 Simple Sequence Repeats (SSRs)
2.1 Definition and classification
Microsatellites, also referred to as Simple Sequence Repeats (SSRs), Variable Number of
Tandem Repeats (VNTRs) or Variable Simple Sequence Motif (VSSM), were first
described in eukaryotes in the early eighties (Hamada et al. 1982). They are defined as
stretches of DNA, which consist of only one or a few (maximum of six) tandemly, repeated
nucleotides, such as poly (A/T) or poly (GT/CA) of less than 100 bp in length with a
minimal length of 12 bp (Tautz and Rentz, 1984; Tautz 1993). These types of simple
sequence were shown to be repetitive and interspersed in many eukaryotic genomes (Tautz
et al. 1986). Several other types were found by sequencing eukaryotic DNA. They were
reported in the genome of diverse species (Hamada et al. 1982; Tautz and Rentz 1984;
Greaves and Patient 1985; Dover and Tautz 1986) and have been implicated in a range of
functions including gene regulation (Wang et al. 1979; Weintraub and Groudine 1976;
Hentschel 1982; Shen et al. 1981), signals for gene conversion and recombination (Shen et al.
1981; Goodman 1996; Jeffreys et al. 1985), and the replication of telomeres (Blackburn and
Szostak, 1984).
SSRs are divided into different categories according to their composition (Fig 1-7; Weber
1990): perfect, imperfect or compound repeats. They are also classified into two classes
based on their origins. Some are developed from enriched genomic DNA libraries
(Edwards et al. 1996; Ostrander et al. 1992) and are thus named genomic SSRs (g-SSRs).
Most of them have neither genic function nor close linkage to coding regions (Metzgar et
al. 2000), and their developing process is very tedious and expensive. The second class of
SSRs is derived from EST sequences originating from the expressed regions of the genome
and is named EST-SSRs. In general, EST-SSR markers produce high quality patterns, but
give a lower level of polymorphism compared to that from genomic SSRs (Holton et al.
2000; Thiel et al. 2003). An important feature of the EST-SSR markers is that they can be
rapidly developed from the EST databases at low cost, and due to their existence in
expressed regions, this will increase the efficiency of selecting genes of interest through
marker assisted selection (MAS).
2.2 Advantages of SSRs compared to other markers
The numerous advantages of the microsatellites have been well-documented (Morgante


Bibliography – Simple Sequence Repeats
- 8 -
and Olivieri 1993; Rafalski and Tingey 1993; Powell et al. 1996). One of the main
advantages of the microsatellites compared with other markers is their highly polymorphic
rate due to the variability of the number of repeats at a given locus (Poulsen et al. 1993;
Schmidt et al. 1993; Thomas and Scott 1993; Senior and Heun 1993; Becker and Heun
1995; Rongwen et al. 1995). However, they remain sufficiently stable to avoid somatic
variations (Barret 1993). The polymorphism can be evaluated through the polymorphism
information content value (PIC value), a criterion that was first introduced by Nei et al.
(1973) in human genetics. These are also mainly co-dominant markers with a Mendelian
inheritance, which can reveal homozygous as well as heterozygous lines and which can be
used on a wide range of segregating population (Morgante and Olivieri 1993). In addition,
they show a high reproducibility compared to other markers such as RAPDs. When
polyploid plants like rapeseed and wheat are considered, microsatellites are also frequently
specific of the genome and give a single signal compared to RFLPs (Poulsen et al. 1993;
Röder et al. 1995). Finally, they can be easily automated and used on high throughput
genotyping platforms (Nicot et al. 2004).
2.3 SSRs within genomes
2.3.1 Abundance in genomes
Abundance and polymorphism of the SSRs, especially of the dinucleotides (TG)n, (AC)n
and (AT)n was demonstrated in human and other eukaryotes (Weber and May 1989; Tautz
1989; Litt and Luty 1989). In general, plants have a lower proportion of sequences that
account for SSRs than do vertebrates but a higher proportion compared with invertebrates
and fungi. The range for plants is between 0.85% (Arabidopsis) and 0.37% (maize) of the
genome (Morgante et al. 2002), whereas estimates for the fish species Tetraodon
nigroviridis and Fugu rubipres are respectively 3.21% (Crollius et al. 2000) and 2.12%
(Elgar et al. 1999), 1.07% for human chromosome 22, 0.21% for Caenorhabditis elegans
and 0.30% for Saccharomyces cerevisiae (Toth et al. 2000). Within higher plants, Morgante
and Olivieri (1993) estimated that the frequency of the microsatellites was one every 50 kb
which contrasts with what is observed in human, with an estimated average density of one
SSR every 6 kb (Beckman and Weber. 1992). Only few SSRs were detected within the
organellar genome (Wang et al. 1994). The different types of SSRs exist in different
density throughout the genome with slight variations according to the species. In primates,
mononucleotides (mainly, poly (A/T) tracts) are the most copious classes of SSRs (Toth et


Bibliography – Simple Sequence Repeats
- 9 -
al. 2000; Wren et al. 2000). Dinucleotide (AT)n motifs were found to be rare within animal
genomes while (CA)n were the most common SSRs (Moore et al. 1991). Most of the SSRs
(48-67%) found in plant species are dinucleotide repeats while mono- and tetranucleotide
repeats are the least common (Wang et al. 1994; Schug et al. 1998). A mean of one SSR
every 64.6 kb and 21.2 kb was detected for monocotyledons and dicotyledons species
respectively. However, frequency can vary from one every 3 kb in barley (Becker and
Heun 1995) to one every 80 kb in rice (Panaud et al. 1995). At the centimorgan level, the
SSRs provide thus an important source of markers for genetic mapping in eukaryotes. The
utilization of microsatellites as genetic markers for a global approach of the genetic
mapping in eukaryotes was proposed (Beckman and Soller 1990) and they have been thus
extensively used to elaborate genetic maps in human (Weissenbach et al. 1992), pig
(Rohrer et al. 1994) and other mammals and plants.
2.3.2 Dispersion within genomes
Microsatellites were found to be widely and randomly distributed in coding as well as non
coding regions of the genome. A high proportion of SSRs is associated to Alu and SINE
elements in primates and human (Arcot et al. 1995; Nadir et al. 1996) and thus forms a
rather large portion of non-coding DNA regions. It was also demonstrated that they are
frequently associated with retro-transposons and other dispersed repetitive elements in
barley (Ramsay et al. 1999) as well as in other plant species (Wang et al. 1994). Di- and
tetranucleotide SSRs are more frequent in non coding regions compared with trinucleotides.
Dinucleotides are about 20 times more frequent in random genomic clones of Norway
spruce (Picea abies, Scotti et al. 2000) compared to expressed sequences while Morgante
et al. (2002) reported that all SSR types except tri- and hexa-nucleotides are significantly
more frequent in the non coding fraction of six plant species compare to 25,762 predicted
protein-coding sequences. In some cases, it was suggested that they could be clustered in
some region of the genome (Condit and Hubbel 1991; Panaud et al. 1995; Arens et al.
1995).
Other evidences show that dinucleotide motifs seem to be located closer to the coding
regions, in the 5’ UTRs or in the introns while one third of the trinucleotide motifs are
located in the coding fraction of the genes (Morgante and Olivieri 1993). Introns have a
similar repeat-unit profile to genomic DNA with various biases depending on species and

Tab 1-2: Various types of microsatellites (from Jin et al. 1994)
Mononucleotide motif (2): A C Dinucleotide motif (4): AC AG AT CG Trinucleotide motif (10): AAC AAG AAT ACC ACG ACT AGC AGG ATC CCG Tetranucleotide motif (33): AAAC AAAG AAAT AACC AACG AACT AAGC AAGG AAGT AATC AATG AATT ACAG ACAT ACCC ACCG ACCT ACGC ACGG ACGT ACTC ACTG AGAT AGCC AGCG AGCT AGGC AGGG ATCC ATCG ATGC CCCG CCGG Pentanucleotide motif (102): AAAAC AAAAG AAAAT AAACC AAACG AAACT AAAGC AAAGG AAAGT AAATC AAATG AAATT AACAC AACAG AACAT AACCC AACCG AACCT AACGC AACGG AACGT AACTC AACTG AACTT AAGAC AAGAG AAGAT AAGCC AAGCG AAGCT AAGGC AAGGG AAGGT AAGTC AAGTG AATAC AATAG AATAT AATCC AATCG AATCT AATGC AATGG AATGT AATTC ACACC ACACG ACACT ACAGC ACAGG ACAGT ACATC ACATG ACCAG ACCAT ACCCC ACCCG ACCCT ACCGC ACCGG ACCGT ACCTC ACCTG ACGAG ACGAT ACGCC ACGCG ACGCT ACGGC ACGGG ACGTC ACTAG ACTAT ACTCC ACTCG ACTCT ACTGC ACTGG AGAGC AGAGG AGATC AGATG AGCAT AGCCC AGCCG AGCCT AGCGC AGCGG AGCTC AGGAT AGGCC AGGCG AGGGC AGGGG ATATC ATCCC ATCCG ATCGC ATGCC CCCCG CCCGG CCGCG
Bibliography – Simple Sequence Repeats
- 10 -
motifs (Toth et al. 2000). Despite the fact that numerous SSRs exist in the open reading
frames (ORFs) of higher eukaryotes including Drosophila, Caenorhabditis elegans,
mammals, humans, plants and yeast (Toth et al. 2000; Katti et al. 2001; Kantety et al. 2002;
Morgante et al. 2002), their occurrence in coding regions seems to be limited by
non-perturbation of ORFs (Metzgar et al. 2000). In human cDNA databases, more than
92% of the predicted SSR polymorphisms within coding sequences have repeat-unit sizes
that are a multiple of three (Wren et al. 2000). Thus, in many species, exons contain rare
dinucleotide and tetranucleotide SSRs, but have many more trinucleotide and
hexanucleotide SSRs than other repeats. Trinucleotide repeats show approximately a two
fold greater frequency in exonic regions than in intronic and intergenic regions in all
human chromosomes except the Y chromosome (Subramanian et al. 2003).
Within transcribed regions, UTRs harbor more SSRs than the coding regions themselves
(Wren et al. 2000; Morgante et al. 2002). In Arabidopsis, the 5’-UTRs, exhibit a strong
bias toward AG/CT contrary to human where 3’-UTRs show a bias toward AC/GT. Also,
the 5’-UTRs contained more trinucleotide repeats than the 3’-UTRs in humans (31.1% vs.
4.6%; Stallings 1994; Wren et al. 2000) as well as in barley (67% vs. 26%; Thiel et al.
2003).
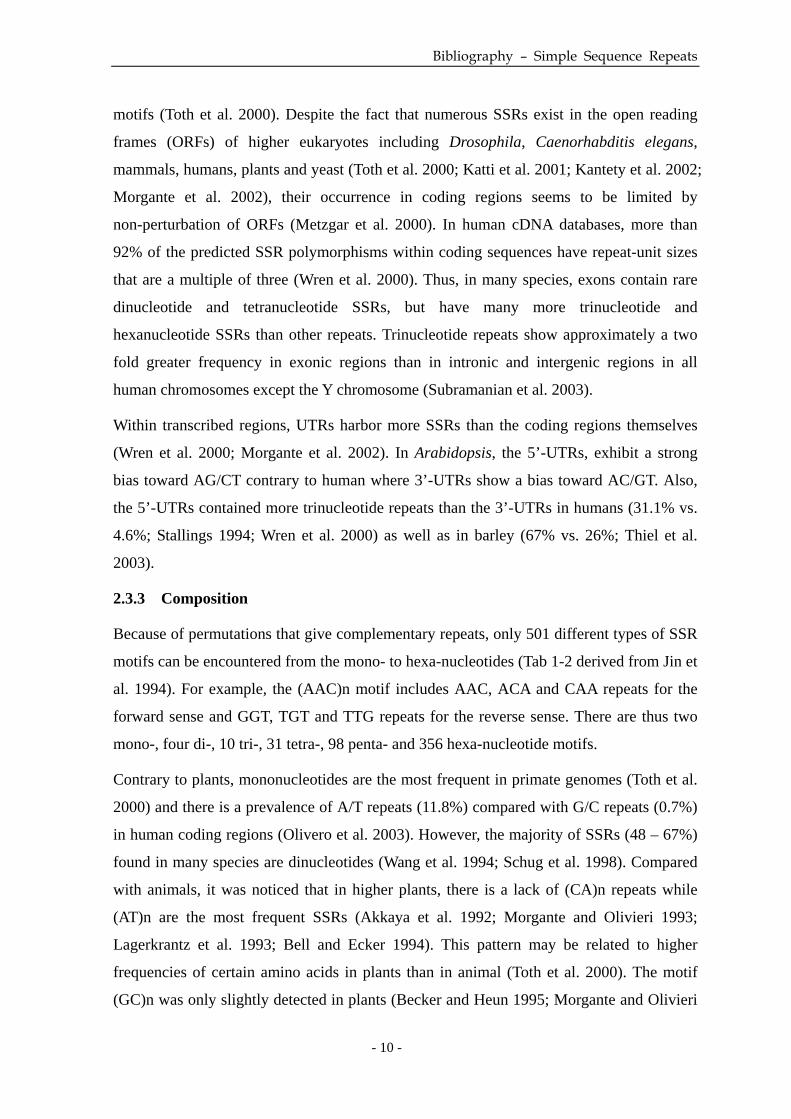
2.3.3 Composition
Because of permutations that give complementary repeats, only 501 different types of SSR
motifs can be encountered from the mono- to hexa-nucleotides (Tab 1-2 derived from Jin et
al. 1994). For example, the (AAC)n motif includes AAC, ACA and CAA repeats for the
forward sense and GGT, TGT and TTG repeats for the reverse sense. There are thus two
mono-, four di-, 10 tri-, 31 tetra-, 98 penta- and 356 hexa-nucleotide motifs.
Contrary to plants, mononucleotides are the most frequent in primate genomes (Toth et al.
2000) and there is a prevalence of A/T repeats (11.8%) compared with G/C repeats (0.7%)
in human coding regions (Olivero et al. 2003). However, the majority of SSRs (48 – 67%)
found in many species are dinucleotides (Wang et al. 1994; Schug et al. 1998). Compared
with animals, it was noticed that in higher plants, there is a lack of (CA)n repeats while
(AT)n are the most frequent SSRs (Akkaya et al. 1992; Morgante and Olivieri 1993;
Lagerkrantz et al. 1993; Bell and Ecker 1994). This pattern may be related to higher
frequencies of certain amino acids in plants than in animal (Toth et al. 2000). The motif
(GC)n was only slightly detected in plants (Becker and Heun 1995; Morgante and Olivieri


Bibliography – Simple Sequence Repeats
- 11 -
1993). On the contrary, the (GA)n repeats are more abundant than the (CA)n repeats which
seems to be characteristic of the plant genomes (Condit and Hubbel 1991). Exons and
ESTs show higher frequency for GA/CT repeat than for AT repeat in Arabidopsis thaliana
and cereals (Morgante et al. 2002; Kantety et al. 2002). However, the proportion of the
different types of microsatellites depends on the species. For example, in Arabidopsis,
frequencies of the (CA)n and (GA)n repeats are lower compared to what is estimated in
other plants (Bell and Ecker 1994). In rice, microsatellites (GA)n are the most frequent
(Panaud et al. 1995). The proportion of dinucleotide repeats was greater among genomic
DNA than among EST, and this proportion increased with longer SSRs (La Rota et al.
2004).
Concerning the trinucleotide motifs, microsatellites (TAT)n are the most frequently
detected in animals as well as in plants (27.5%) followed by (TCT)n motif (25%; Morgante
and Olivieri 1993). However, similarly to the dinucleotides, frequency varies among the
species. In barley, the (AGC)n and (CCT)n motifs are the most frequent (Becker and Heun
1995) while in rice, it is the (TTG)n motif (Panaud et al. 1995). Trinucleotide repeats are
significantly more abundant in EST sequences compared to genomic sequences. In the
animals, (AGC)n repeat is the most common motif (40.9% - 60.9%) while in plants,
monocotyledons are richer in GC-rich trinucleotide repeats compared to dicotyledons
(Cordeiro et al. 2001; Varshney et al. 2002; Thiel et al. 2003; Gupta et al. 2003). The most
frequent trinucleotide motif in A. thaliana, grape and endophytes is AAG (28.3% - 42.1%).
Abundance of CCG repeats in monocot genomes may be due to their increased GC content
(Morgante et al. 2002). The AAT motifs were the least common (<1%) in monocot species
and in other species ranging from 17.4% in S. cerevisiae to 0 in primates (Cordeiro et al.
2002; Varshney et al. 2002). This may be explained by the fact that TAA-based variants
code for stop codons that have a direct effect in protein synthesis in eukaryotes.
Other types of motifs (tetra-, penta- and hexa-nucleotides) are less studied. However, they
can sometime be very frequent such as tetranucleotide repeats which exceed trinucleotide
repeats in vertebrate introns and intergenic regions. Poly (A/T) motifs are the most
abundant especially in plants but tetranucleotides are rare in ESTs (Toth et al. 2000; Gupta
et al. 2004). Similarly the most frequent pentanucleotide motifs are A/T rich in vertebrates
but are under-represented in coding regions (Toth et al. 2000). Hexanucleotide repeats
constitute the second most frequent type after trinucleotide repeats in exons (Toth et al.


Bibliography – Simple Sequence Repeats
- 12 -
2000), whereas they are less frequent (<1%) in the whole genome of plants (Varshney et al.
2002; Cardle L. 2000), a dominance of (A+T)-rich repeats in introns and intergenic regions
being observed in most of the species (Toth et al. 2000).
2.3.4 Number of repeats
The number of repeats is characteristic of an allelic variant at a given locus. This number
depends on the type and of the size of the motif. A minimum number of six repeats is
generally considered as appropriate for dinucleotides (Tautz 1993). In rice genome 72% of
SSRs longer than 30 bp were of the dinucleotide type. In human, most of dinucleotide
repeats had between 12 and 15 units (Weber et al. 1990). In general, g-SSRs have more
repeats than EST-SSRs. For example, the mean number of units for rice g-SSRs is 16.5
while the mean number for EST-SSRs is 15.3 indicating that longer SSRs are mainly
located in non coding regions (La Rota et al. 2005).
Similarly, in cereal ESTs, the frequency of SSRs decreases with increasing repeat length
for all the species and every class of SSRs. In maize, the six repeat unit SSRs represent
56.9% of the total number of dinucleotide repeats SSRs and among the trinucleotide repeat
SSRs, five repeat units share as much as 64.5% of total class. If all EST-SSRs of different
types are classified into categories of <10 and >10 repeat units, the category of >10 repeats
contributes only as much as 25% to the total number of SSRs. In the tetra- to
hexanucleotide repeats SSR classes, all the EST-SSRs (100%) fall into the category of <10
repeat units (Varshney et al 2002).
2.4 SSRs within cereals
During the last decade, SSR markers were developed and investigated in a large number of
plants including major cereal species such as barley (Thiel et al. 2003), maize (Chin 1996;
Yu et al. 2001), oats (Li et al. 2000), rice (Gao et al. 2003), rye (Saal and Wricke, 1999),
Sorghum (Bhattramakki et al. 2000) and wheat (Röder et al. 1998; Varshney et al. 2000;
Guyomarc’h et al. 2002a, b; Gupta et al. 2002). In the majority of these, the two most
common SSRs, whose density in the genome were determined while screening genomic
libraries included GA and GT. The density of GA (38% to 59%) and GT (20% to 34%) in
these different species ranged from one SSR every 212 kb to 704 kb (Varshney et al. 2002).
Estimates of the total number of SSRs at the genome level were also performed in several


Bibliography – Simple Sequence Repeats
- 13 -
crops. The frequencies per haploid genome were one SSR each 3.6 X 10⁴ bp for (GA)n and
for 2.3 X 10⁴ bp for (GT)n in bread wheat (Röder et al. 1995), and were estimated to be
one SSR each 1.36 X 10³ bp for (GA)n and for 1.23 X 10³ bp for (GT)n in rice (Panaud et
al. 1995).
In a recent survey of EST and genomic sequences, densities of SSRs were higher in the
coding regions compared to non-coding regions of the genomes (Morgante et al. 2002). In
EST sequences of several cereal species, it was estimated that the frequency ranged from
one SSR every 3.9 kb in rice to one SSR every 7.5 kb in maize (Varshney et al. 2002). In
wheat, the same authors mentioned one SSR every 6.2 kb while Gupta et al. (2003)
reported one SSR each 9.2 kb.
Overall, an average of one SSR every 6-7 kb seems to be a good estimate for SSR
frequency in the whole genome of plants (Cardle et al. 2000).
2.5 Level of polymorphism of SSRs
2.5.1 Definition of SSR polymorphism
SSR polymorphism can be defined as the difference in the number of DNA repeats at a
given locus, and can be easily analyzed through electrophoresis after PCR amplification.
The level of polymorphism is generally evaluated through the Polymorphism Information
Content (PIC) value (Nei et al. 1973) or diversity index (Akagi et al. 1998). However, it
must be noticed that these values mostly depend on the sample studied (size and variability)
and just allow comparison within the samples but not among different studies.
The sequences flanking specific SSR loci in a genome are supposed to be highly conserved
within a species, but also in some cases across species, within a genus and rarely across
related genera. These conserved sequences are therefore used to design primers for
individual SSR loci. In human and various animals, SSRs have high mutation rates,
ranging from 10-3 to 10-6, which is superior to that of other regions in the genome
(Bachtrog et al. 1999). In plants, the mutation rate at microsatellite loci is even higher than
in animals, with the range of 10-2 to 10-3 in chickpea (Cicer arietinum, Udupa et al. 2001),
or 10-3 to 10-4 in durum wheat (Triticum turgidum, Thuillet et al. 2002). SSR mutation rates
are influenced by several factors, including motif type, perfection and number of repeats,
among which the repeat number was best characterized (Schlötterer et al. 1998; Thuillet et
al. 2004). In a variety of organisms, it was demonstrated that SSR mutation rates are

Figure 1-8 Model of SSR mutation by replication slippage (slipped-stand mispairing)
Repeat units are denoted by arrows. Numbers refer to the repeat unit number within each strand. (a) When the repetitive region is being synthesized the two strands can dissociate. Sometimes the strands are misaligned upon reassociation; that is, the nascent strand might incorrectly realign with repeat units downstream on the template strand. In such cases, a loop is formed on the nascent strand, and when synthesis of the new strand is initiated again it will become one repeat unit longer than the template strand. (b) As in (a), but the incorrect alignment occurs upstream on the template strand, and the new strand will therefore become one repeat unit shorter than the template strand.

Bibliography – Simple Sequence Repeats
- 14 -
positively correlated with repeat numbers and that the most polymorphic SSRs are the
longest ones (Sia et al. 1997; Schlötterer et al. 1998; Thuillet et al. 2004). Weber (1990)
reported that SSRs with 12 or fewer repeats were monomorphic in human (PIC = 0) and
that the PIC value increased simultaneously to the average number of repeats, especially in
the range of about 11 – 17 repeats.
2.5.2 Mutational mechanisms of SSRs
Two hypotheses are currently admitted to explain the variability of SSRs. The first one
involves unequal crossing over between sister chromatides either during mitosis or after
homologous pairing of chromosomes at meiosis (Wolf et al. 1989; Harding et al. 1992).
However, they are most likely thought to accumulate by DNA slippage (Wells et al. 1965;
Streisinger et al. 1966; Morgan et al. 1974; Efstratiadis et al. 1980; Drake et al. 1983;
Levinson and Gutman 1987) and mispairing during replication and recombination or
extension of single-strand ends (Tautz and Rentz 1984; Dover and Tautz 1986; Jeffreys et al.
1985; Wells et al. 1965).
2.5.2.1 Replication slippage
A model for SSR mutation based on replication slippage was formulated by Levinson and
Gutman (1987). Replication slippage or slipped strand mispairing refers to the
out-of-register alignment of the two DNA strands following dissociation at the time when
the DNA polymerase traverses the repetitive region. This slippage implies the formation of
a single-strand loop during DNA synthesis and addition (or suppression depending on the
strand concerned with the loop) of a motif. If the most 3’ repeat unit of the nascent strand
re-hybridizes with a complementary repeat unit downstream along the template strand, a
loop will be formed in the nascent strand and the new sequence will become longer than
the template sequence upon elongation (Fig1-8a). On the contrary, if the incorrect
alignment occurs upstream along the template strand, the new strand will become shorter
than the template sequence (Fig1-8b). Most of these primary mutations are corrected by the
mismatch repaired system, and only the small fraction that was not repaired ends up as
microsatellite mutation events (Schlotterer and Tautz 1992).
2.5.2.2 Unequal recombination
Recombination could potentially change the SSR length by unequal crossing over or by
gene conversion, which introduce mutation in the satellite sequence. In the version of the

Figure 1-9. Model of SSR mutation by recombination
The open rectangles represent individual repeat units. (A) Homologous recombination between misaligned arrays of 10 repeats results in one DNA molecule with a repeated tract one repeat unit longer than the original tract and one molecule that is one repeat unit shorter than the original tract. (B) A double strand break occurs within the repeated tract. This break is followed by exonuclease degradation that exposes complementary single-stranded regions. Hybridization of these regions followed by DNA synthesis and religation results in a reduction in repeat units. Alternatively, the broken ends could invade an array on another DNA molecule leading to an expansion in the tract.

Bibliography – Simple Sequence Repeats
- 15 -
recombination model shown in Fig1-9A, simple repeats located on different DNA
molecules pair in a misaligned configuration and a crossover occurs, resulting in arrays
with reciprocal additions and deletions. Other recombination models in which the additions
or deletions are not reciprocal are also possible (Fig1-9B). There is little evidence that
recombination would also contribute to microsatellite mutation. Genomic SSR
distributions are associated with sites of recombination, most probably as a consequence of
repetitive sequences being involved in recombination rather than being a consequence of it
(Treco and Arnheim 1986; Majewski and Ott 2000)
2.5.2.3 Interaction between replication slippage and recombination
Other possible SSR mutation model was proposed by Li et al. (2002). When studying SSR
diversity in wild emmer wheat, they found a strong interaction between mean repeat length
and SSR locus distance from centromere. This interaction has an effect on the number of
alleles and variance in repeat size at SSR loci. SSR mutation might thus be the result from
the possible influence of replication slippage during recombination-dependent DNA repair.
In fact, strand exchange between two homologous chromosomes should create a
four-stranded configuration, called a Holliday structure, associated with mismatched
(heteroduplex) DNA region. These regions undergo replication-dependent correction.
Hence, a slippage mechanism may also work in recombination tracts involving SSR arrays
(Gendral et al. 2000; Li et al 2002)
2.5.3 Polymorphism of g-SSRs
Numerous studies demonstrated that g-SSRs show a high level of polymorphism compared
to other types of molecular markers. Kölliker et al. (2001) reported that SSR markers
developed from white clover were highly polymorphic, 88% detecting polymorphism
across seven genotypes with an average allele number of 4.8. In maize, PIC values ranged
between 0.06 and 0.91 with a mean of 0.62 (Smith et al. 1997) which was similar to what
is mentioned for RFLPs (Senior and Heun 1993). In barley, it was demonstrated that even
if SSRs show lower diversity index compared to AFLP (0.521 and 0.937 respectively),
they reveal a high number of allele at each locus making them very effective to study
genetic relationships (Russell et al. 1997). In cultivated spelt wheat, Bertin et al. (2001)
found that the mean PIC value was 0.64 while in common wheat; it was assessed to be
0.71. Even if lower PIC value (0.57) are also reported for common wheat (Stachel et al.
2000), this is twice higher than what is revealed by RFLPs (Chao et al. 1989; Cadalen et al.


Bibliography – Simple Sequence Repeats
- 16 -
1997).
2.5.4 Polymorphism of EST-SSRs
Assessments of polymorphism of EST-SSRs have been carried out in rice (Cho et al. 2000),
grape (Scott et al. 2000), sugarcane (Grivet et al. 2003), tomato (Areshchenkova and Ganal,
2002), Alpine Lady-fern (Woodhead et al. 2003), pasture grass endophytes (Jong et al.
2002), barley (Thiel et al. 2003) and rye (Hackauf and Wehling 2002). In common wheat,
EST-SSRs give better profiles compared to the g-SSRs (Holton et al. 2002) but the
polymorphism level among EST-SSRs ranged from 7% to 55% (Holton et al. 2002; Eujayl
et al. 2002; Gupta et al. 2003; Leigh et al. 2003; Nicot et al. 2004) which was lower
compared to g-SSRs (61%, Sourdille et al. 2001; 100% Prasad et al. 2000). However,
despite the fact that EST-SSRs show less polymorphism than g-SSRs, they are still
informative for assessing genetic relationships (Eujayl et al. 2001, 2002; Gupta et al.
2003).
2.6 Role and function of the SSRs
2.6.1 DNA conformation
Alternations of purins and pyrimidins such as in (CG)n or (CA)n microsatellites favour the
formation of Z-DNA (Bull et al. 1999). Z-DNA formed a double left-turned helix, which is
more condensed compare to B-DNA because it contains 12 bp at each turn instead of 10.4
bp (for reviews see Loridon et al. 1998). Z-DNA is involved in recombination, gene
expression regulation during transcription. On the contrary, homopurin and homopyrimidin
sequences form H-DNA. Negative super-coiling of the DNA allows the formation of a
triple helix resulting from the addition of a third DNA strand within the large groove of the
double helix (Loridon et al. 1998). Other microsatellites may confer a hairpin loop
structure and can thus play a role in the replication, the transcription, the translation and
the interactions between DNA and proteins.
2.6.2 Promoter regulation
Microsatellites are frequently associated with regulatory elements (Levinson and Gutman
1987; Barrier et al. 2000). Hot spots for microsatellite formation within development
homeotic genes such as the antennapedia and dorsal genes in Drosophila and apetala gene
involved in floral regulation in plants can be identified (Barrier et al. 2000). Also, nuclear
proteins specifically bind to repeated sequences such as (CCG)n which are frequently


Bibliography – Simple Sequence Repeats
- 17 -
encountered in the 5’URTs of the genes and which have thus an effect on mRNA
transcription (Debrauwere et al. 1997).
2.6.3 Meiosis and mitosis
Microsatellites may also be involved in chromosome pairing at meiosis (Samadi et al. 1998)
and in the centromere function (Levinson and Gutman 1987). It was also demonstrated that
the tetranucleotide repeats (GACA)n were tightly linked to the nucleoli organizer in
primates (Arens et al. 1995). Moreover, (GT)n SSRs have no effect on simple crossing
over but increase multiple crossing over (Gendrel et al. 2000). The microsatellites inhibit
Strand exchanges, which are promoted by RecA.
2.6.4 Coding function
Most of the microsatellites are distributed in euchromatin in coding as well non coding
regions. Trinucleotide repeats locating in ORFs are coding for tandemly repeated amino
acids that interfere with the protein function (Richard and Dujon, 1997). They can thus
form proteic domains that are enriched in specific amino acids (Gortner et al, 1996). The
most frequent codons are those coding for glutamine, asparagine and glycin.
In wheat, five microsatellites were initially identified in genes (Devos et al. 1995).
Similarly, four genes bearing a microsatellite were reported in barley (Saghai-Maroof et al.
1994) and 27 in rice (Cho et al. 2000). With the rapid increase of ESTs in the databases
(http://www.ncbi.nlm.nih.gov/dbEST), it is now well known that about 10% of the genes
contain a microsatellite motif (Morgante et al. 2002, Nicot et al. 2004).
2.7 Application of SSRs to plant genetic studies
2.7.1 Genetic mapping
Breeding and genomics research efforts can make use of genetic maps to facilitate plant
selection and to position BAC clones along physical maps of the genomes. In both cases,
high throughput accurate marker technology is essential to avoid errors in genotyping and
to enable processing of hundred or thousands of DNA samples in a short time.
Microsatellites offer an easy tool and an abundant source of genetic markers. Consequently,
SSR linkage maps have become available for a variety of plant genomes including rice
(Wu and Tanksley 1993), barley (Saghai-Maroof et al. 1994), maize (Senior and Heun
1993) and wheat (Röder et al 1998; Somers et al. 2004). All these maps were proven to be

Tab1-3: Genome mapping using EST-SSR markers
a Abbreviations: BC1, backcross population; DHs, doubled haploids; RILs, recombinant inbred lines.
Plant species Number of genic
SSR loci mapped Mapping population used Refs
Barley 185 3 DHsa (Igri×Franka, Steptoe×Morex, OWBDom×OWBRec) Thiel et al.2003
39 F2s (Lerche×BGR41936), DHs (Igri×Franka), wheat–barley addition lines Pillen et al. 2000
Cotton 111 BC1b lines (TM1×Hai7124)×TM1) Han et al. 2004
Kiwifruit 138 Intraspecific cross Fraser et al. 2004
Raspberry 8 Full-sib family (Glen Moy×Latham) Graham et al. 2004
Rice 91 DHs (IR64×Azucena), RILs
c (Milyang 23×Gihobyeo, Lemont×Teqing, BS125×WL0Genome
mapping using EST-SSRs 2) Temnykh et al. 2000
Rye 39 4 mapping populations derived from reciprocal crosses (P87×P105, N6×N2, N7×N2,
N7×N6) Khlestkina et al. 2004
Ryegrass 91 Three-generation population (Floregon×Manhattan) Warnke et al. 2004
Tall fescue
(Festuca spp.) 91 Pseudo-test cross-population (HD28–56×R43–64) Saha et al. 2004
Wheat 149 RILs (W7984×Opata85) Yu et al.2004
126 RILs (W7984×Opata85) Nicot et al. 2004
101 RILs (W7984×Opata85, Wenmai 6×Shanhongmai), DHs (Lumai14×Hanxuan 10) Gao et al. 2004
White clover 449 Pseudotest cross-population (6525/5×364/7) Barrett et al. 2004
Bibliography – Simple Sequence Repeats
- 18 -
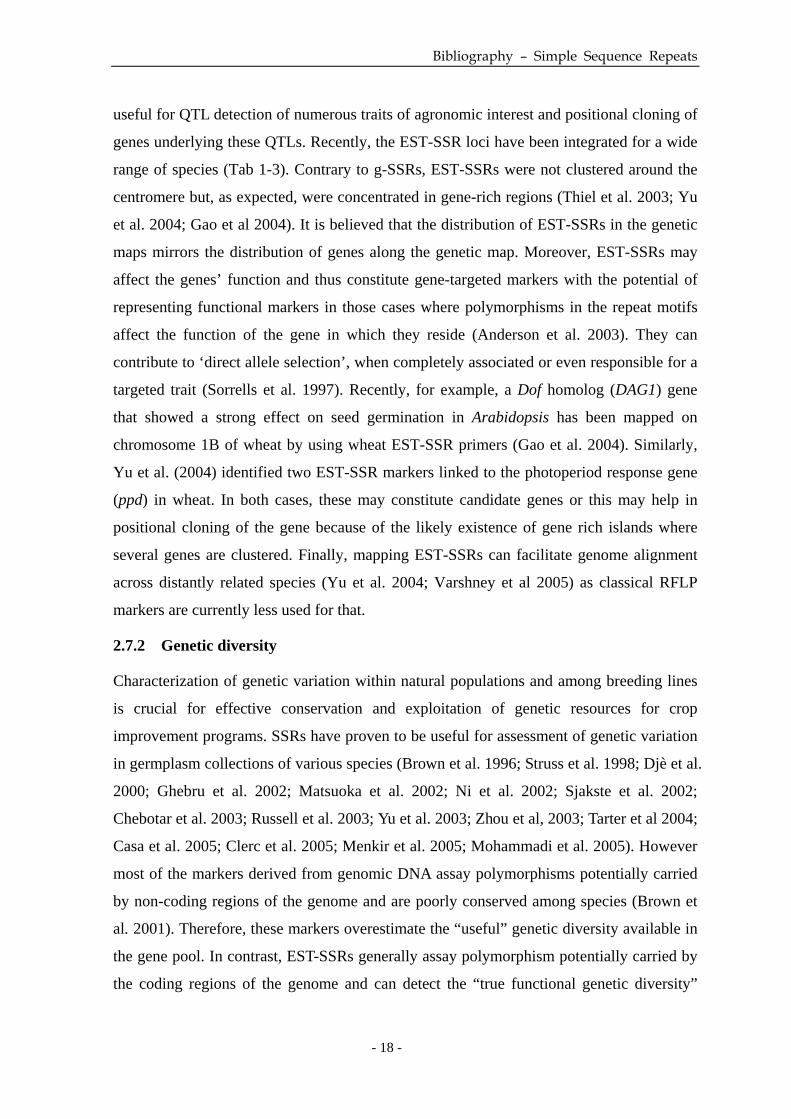
useful for QTL detection of numerous traits of agronomic interest and positional cloning of
genes underlying these QTLs. Recently, the EST-SSR loci have been integrated for a wide
range of species (Tab 1-3). Contrary to g-SSRs, EST-SSRs were not clustered around the
centromere but, as expected, were concentrated in gene-rich regions (Thiel et al. 2003; Yu
et al. 2004; Gao et al 2004). It is believed that the distribution of EST-SSRs in the genetic
maps mirrors the distribution of genes along the genetic map. Moreover, EST-SSRs may
affect the genes’ function and thus constitute gene-targeted markers with the potential of
representing functional markers in those cases where polymorphisms in the repeat motifs
affect the function of the gene in which they reside (Anderson et al. 2003). They can
contribute to ‘direct allele selection’, when completely associated or even responsible for a
targeted trait (Sorrells et al. 1997). Recently, for example, a Dof homolog (DAG1) gene
that showed a strong effect on seed germination in Arabidopsis has been mapped on
chromosome 1B of wheat by using wheat EST-SSR primers (Gao et al. 2004). Similarly,
Yu et al. (2004) identified two EST-SSR markers linked to the photoperiod response gene
(ppd) in wheat. In both cases, these may constitute candidate genes or this may help in
positional cloning of the gene because of the likely existence of gene rich islands where
several genes are clustered. Finally, mapping EST-SSRs can facilitate genome alignment
across distantly related species (Yu et al. 2004; Varshney et al 2005) as classical RFLP
markers are currently less used for that.
2.7.2 Genetic diversity
Characterization of genetic variation within natural populations and among breeding lines
is crucial for effective conservation and exploitation of genetic resources for crop
improvement programs. SSRs have proven to be useful for assessment of genetic variation
in germplasm collections of various species (Brown et al. 1996; Struss et al. 1998; Djè et al.
2000; Ghebru et al. 2002; Matsuoka et al. 2002; Ni et al. 2002; Sjakste et al. 2002;
Chebotar et al. 2003; Russell et al. 2003; Yu et al. 2003; Zhou et al, 2003; Tarter et al 2004;
Casa et al. 2005; Clerc et al. 2005; Menkir et al. 2005; Mohammadi et al. 2005). However
most of the markers derived from genomic DNA assay polymorphisms potentially carried
by non-coding regions of the genome and are poorly conserved among species (Brown et
al. 2001). Therefore, these markers overestimate the “useful” genetic diversity available in
the gene pool. In contrast, EST-SSRs generally assay polymorphism potentially carried by
the coding regions of the genome and can detect the “true functional genetic diversity”


Bibliography – Simple Sequence Repeats
- 19 -
(Maestri et al. 2002; Yamanaka et al. 2003; Gupta et al. 2003). In recent years, EST-SSRs
have also been used for diversity estimations in several plant systems including durum
wheat (Eujayl et al. 2001), Pisum sp. (Burstin et al. 2001), barley (Thiel et al. 2003; Holton
et al. 2002), bread wheat (Holton et al. 2002; Gupta et al. 2003; Gao et al. 2003), rye
(Hackauf and Wehling 2002). In comparison to genomic SSRs, EST-SSRs revealed less
polymorphism in germplasm characterization and genetic diversity studies (Scott et al.
2000; Thiel et al. 2003; Cho et al. 2000, Russell et al 2004). Therefore, evaluation of
germplasm with EST-SSRs enhance the role of genetic markers by assaying the variation
in transcribed regions, although there is a higher probability of bias owing to selection.
Thereby, the genetic diversity presented by combining two types of markers might be
representative of the entire genome. In addition, EST-SSRs also provide opportunities to
examine functional diversity in relation to adaptive variation (Eujayl et al 2001; Russell et
al 2004).
2.7.3 Comparative mapping
Numerous studies demonstrated that g-SSRs are frequently locus specific without
corresponding homoeoloci on the other related genomes (Bryan et al. 1997; Stephenson et
al. 1998; Röder et al. 1998). Thus, they appeared to have a limited transferability to related
species (Sourdille et al. 2001; Varshney et al. 2000) suggesting that they are of limited
utility, when used for comparative mapping. On the contrary, numerous studies revealed
that EST-SSRs showed a high level of transferability to close and wild relatives because
they are derived from conserved coding regions (Holton et al. 2002; Gupta et al. 2003;
Eujayl et al. 2001, 2002; Bandopadhyay et al. 2004). Recently, the potential use of
EST-SSRs developed for barley and wheat has been demonstrated for comparative
mapping in wheat, rye and rice (Yu et al. 2004; Varshney et al 2005). These studies
suggested that EST-SSR markers could be used in related plant species for which little
information is available on SSRs or ESTs. In addition, the EST-SSRs are good candidates
for the development of conserved orthologous markers for genetic analysis and breeding of
different species. For example, a set of 12 barley EST-SSR markers was identified that
showed significant homology with the ESTs of four monocotyledonous species (wheat,
maize, sorghum and rice) and two dicotyledonous species (Arabidopsis and Medicago) and
could potentially be used across these species (Varshney et al 2005).
Similarly, orthology can only be determined by comparing both similarity of amplicon


Bibliography – Simple Sequence Repeats
- 20 -
sequences and genome location across species (Yu et al. 2004; Varshney et al 2005). For
example, Saha et al. (2004) who sequenced the products of one EST-SSR primer pair for
three fescue species, ryegrass, rice and wheat reported that sequences were >85% similar.
Sequence-based comparison of mapped barley EST-SSRs with genetically and/or
physically mapped markers in wheat, rye and rice revealed several markers that showed an
orthologous relationship between examined cereal species (Varshney et al 2005).
Comparison of genome locations of polymorphic EST-SSR markers mapped in both wheat
and rice also confirmed previously known genome relationships with most of the markers
examined (Yu et al. 2004). However, the assessment of colinearity was complicated by the
detection of multiple polymorphic loci in either wheat or rice for 85% of the primer pairs
suggesting sequence divergence or differential gene duplication.
2.7.4 Phylogenetic studies
Genomic SSRs were extensively explored in plant evolutionary studies because of their
high polymorphism level, their co-dominant inheritance, and their reproducibility
(Plaschke et al. 1995; Prasad et al. 2000; Manifesto et al. 2001; Ben Amer et al. 2001;
Leisova and Ovesna 2001; Zhang et al. 2002). However, interspecific phylogenetic studies
in using SSRs were often restricted because of the limited transferability of genomic SSRs
to related species (Lelley et al. 2000) and the high mutation rate. Because being highly
transferable to distantly related species, EST-SSRs are thought to be more suitable for this
purpose. EST-SSRs had been used to investigate their potential in providing useful
information for phylogeny (Rossetto et al. 2002). Three EST-derived microsatellite loci
from Vitis vinifera were amplified and sequenced across eight species of Vitaceae from
four different genera. Phylogenetic analysis of the microsatellite's flanking regions
produced informative results in congruence with previous studies. Based on EST-SSRs
allelic polymorphism among 18 species of Triticum-Aegilops complex using 64 common
wheat EST-SSRs, Bandopadhyay et al. (2004) were able to construct a dendrogram
separating the diploid and tetraploid species.
2.7.5 Marker Assisted Selection (MAS)
Application of MAS has been shown to increase selection efficiency, particularly for traits
with low heritability (Bernardo et al. 2001). It will be increasingly applied to accelerate
selection of traits that are difficult to manage via phenotype, owing to low penetrance
and/or complex inheritance. It will also serve to maintain recessive alleles in backcrossing


Bibliography – Simple Sequence Repeats
- 21 -
pedigrees, to pyramid disease-resistance genes and to aid in the choice of parents in
crossing programs, to ensure minimal levels of duplication of alleles across sets of genes
targeted for selection, and to promote fixation.
Recently, increasing numbers of agronomically significant genes have been tagged with
linked SSR assays (Huang et al. 2000; Raupp et al. 2001; Bariana et al. 2001). Most of
these are resistance genes because single-gene control of this class of character is
widespread. For example, Hurtado et al. (2002) demonstrated that SSRs tightly linked to
sharka resistance facilitated MAS in breeding for resistance in apricot.
However, most traits of agronomical interest are under polygenic control such as the
resistance to fusarium head blight (FHB), which is a major objective for many private as
well as public laboratories in the world. For practical reasons, FHB is a difficult disease to
handle by conventional pathology testing, and genetic analysis of the primary sources of
resistance has shown that a significant proportion of the effect can be attributed to three
QTL, mapping to different chromosomes, with each of the relevant genomic sites tagged
with the genomic SSR locus (Anderson et al. 2001). Similarly in rice, numerous g-SSRs
were found to be closely associated with low glutelin content and their effectiveness in
MAS breeding was illustrated (Wang et al. 2002). EST-SSRs are more likely to exhibit
perfect marker-trait association, provided that the gene containing SSR is the QTL itself.
This perfect marker-trait association must be assessed by fine association mapping (linkage
disequilibrium = LD) prior to MAS. Through marker-trait association, these so-called
“perfect markers” can be developed for a variety of traits in a large number of plant
systems, once candidate genes have been found.


Bibliography – Organization of genetic resources
- 22 -
3 Organization of genetic resources
3.1 History
Agricultural practices prior to the eighteenth century were completely dependent on crop
landraces and mixtures of these landraces. The Industrial Revolution was followed by a
simultaneous population explosion that transformed the subsistence nature of agriculture
and its farming systems forever. In the mid nineteenth century, Mendel (and other
pioneering plant geneticists such as Vilmorin) provided knowledge of plant genetics that
made it possible to dramatically increase the production potential of agriculture.
Undeniably, the wonders of crop improvement have resulted in the erosion of genetic
diversity of many crops in farmers’ fields, including wheat, due to the replacement of many,
heterogenous landraces and farmers’ old cultivars by fewer modern high-yielding varieties.
3.2 Definition and classification
Genetic resources are genetic material with an effective or potential value, which
encompass the diversity of genetic material both in traditional varieties and modern
cultivars, as well as crop wild relatives and other wild plant species. Besides, they are
fundamental to sustain global production now and especially in the future.
Genetic resources include a wide range of genetic diversity that is critical to enhance and
maintain the yield potential and to provide new sources of resistance and tolerance to biotic
as well as abiotic stresses. Modern high-yielding cultivars are an assembly of genes or
gene-combinations pyramided by breeders using, in most cases, well-adapted cultivars
from their regions. International agriculture research has enormously expanded the
availability of widely adapted germplasm that is genetically diverse (i.e. descended from
more sources). Genetic resources are also a reservoir of genetic adaptability to buffer
against potentially harmful environmental and economic changes. However, introgression
of additional variation found in genetic resources is necessary to increase yield stability
and further improvement.
Genetic resources were categorized by Frankel (1977) and the Food and Agriculture
Organization of the United Nations Commission on Plant Genetic Resources (FAO, 1983),
though this categorization is not followed by all centers involved in genetic resource
conservation and utilization. These categories are:

Bibliography – Organization of genetic resources
- 23 -
• modern cultivars in current use;
• obsolete cultivars, often the elite cultivars of the past and often found in the
pedigrees of modern cultivars;
• landraces;
• wild relatives of crop species in the Triticeae tribe;
• genetic and cytogenetic stocks;
• breeding lines.
These genetic resources constitute the gene pool available for breeders and other scientists,
and in the Triticeae tribe several pools are recognized (Bothmer et al., 1992). The primary
gene pool consists of the biological species, including cultivated, wild and weedy forms of
crop species. Gene transfer in the primary gene pool is considered to be easy. In the
secondary gene pool are the coenospecies from which gene transfer is possible but difficult,
while the tertiary gene pool is composed of species from which gene transfer is very
difficult or almost impossible.
3.3 Collections
3.3.1 Landraces
Landraces refers to the particular kind of old seed strains and varieties that are
farmer-selected in areas where local subsistence agriculture has long prevailed. Landraces
are highly adapted to specific locales or groups. The term is usually applied to varieties of
wheat, corn, squash, and beans that were domesticated by native farmers, and further
modified by native and also immigrant farmers.
Nicolai Vavilov initiated works in the context of landraces in 1926. He firstly engaged in
studying the geographical situation of landraces and investigated the origins of these
landraces. His studies approved the concepts of “the origin center” and “the diversity
center” for landraces, referring to some cultivars in certain region showing a very strong
diversity, which made it feasible to well understand their diversity and to well collect
genetic resources.
In order to manage these genetic resources, CGIAR (Consultative Group on International
Agricultural Research) was created in 1971. CGIAR is a strategic alliance of countries,

Tab 1-4: Number of accession available in wheat collections around the world
(Source: Information collared from IBPGR, 1990)
Type of wheat Number of accessions
Hexaploid 266 589
Tetraploid 78 726
Diploid 11 314
Unspecified Triticum 252 530
Aegilops ssp 17 748
Triticale 23 659
Total 650 566

Bibliography – Organization of genetic resources
- 24 -
international and regional organizations, and private foundations supporting 15
international agricultural Centers (list in annex 1), which work with national agricultural
research systems and civil society organizations including the private sector. In CGIAR’s
gene banks, about 640 000 accessions of Triticum ssp., Aegilops ssp. and X Triticosecale
can be found for global wheat genetic resources (Tab. 1-4). In order to collect these genetic
resources, many missions were carried out with regard to Triticum genus. For example, a
collection was completed in Albanie Mountain in 1995 (Hammer et al. 2000). One hundred
and twenty accessions of landraces and wild species were collected, including some
traditional species, such as Triticum monococcum. In the same year, another task was also
performed in southern Sardinia and 80 samples were gathered in 22 different sites,
principally with focus on cereals (including Triticum genus), leguminous and vegetables.
Some genetic erosion was observed for these accessions.
3.3.2 Wild species
Wild species refers to plants growing in the wild that have not been subject to
domesticating to alter them from their native state.
In order to conserve wild species, an organization – Botanic Gardens Conservation
International (BGCI) – was founded in United Kingdom in 1987. To date, more than 500
members from 112 different countries work in BGCI to efficiently conserve these genetic
resources. There are botanic gardens and arboreta in 148 countries worldwide and they
maintain more than 4 million living plant collections. Amongst their collections are
representatives of more than 80,000 species, almost one third of the known vascular plant
species of the world. There are a total of 142 million herbarium specimens in botanic
garden herbaria and 6.13 million accessions in their living collections. Over 500 botanic
gardens occur in Western Europe, more than 350 in North America and over 200 in East
and Southeast Asia, of which the majority are in China. Most of the southern Asian botanic
gardens are found in India. There are seven research centers, distributed in USA, Canada,
China, Brazil, Japan, India and Russia. The main objectives of this organization include a)
Understanding and documenting plant diversity; 2) Conserving plant diversity; 3) Using it
sustainably; 4) Promoting education and awareness about plant diversity; 5) Building
capacity for its conservation.

Bibliography – Organization of genetic resources
- 25 -
3.4 Evaluation of genetic resources
Evaluation should be a major activity of germplasm banks to identify useful genetic
variation and make it available to breeders. There are many methods for depicting and
evaluating diversity of genetic resources (Lefort-Buson et al. 1988). Several descriptive
levels exist: agronomical level, technological level, biochemical level and molecular level.
Information from each level is specific, and shows some advantages and drawbacks. In the
following part, these methods will be presented one by one, and compared. Because
numerous studies on genetic diversity have been made on plant species, we will focus our
presentation on grass species only and mainly on wheat.
3.4.1 Agronomical and morphological data
The morphological traits were the first descriptive markers used. They are simple and easy
to obtain. The information derived from morphological character was an important
characteristic for classification and systematics of the studied material. With regard to
grass species, many researches based on morphological data were performed. In 2000,
Nieto-Lopez identified significant intra- and inter-population diversity within a collection
of wild populations in Elymus and Thinopyrum genus by using 22 morphological and
agronomical traits. Several similar studies were achieved for Poaceae species, such as
maize (Malosetti et al, 2001) and wheat (Jardat, 2001; Brandolini et al, 2002; DeLacy et al,
2000, Grenier et al, 2001). For wheat landraces, 465 individual spikes of bread wheat were
collected from 24 sites in three states of Mexico in 1992. They were examined for 15
morphological, agronomic and grain quality attributes as part of the routine regeneration
process conducted by the CIMMYT Wheat Genetic Resources Program in unreplicated hill
plots in a screen house. A pattern analysis (combined use of classification and ordination
methods) of the data showed a good description of the accessions and the collection sites,
suggesting that the analysis for economically useful attributes could provide relevant
information for users and the germplasm curators (DeLacy et al. 2000).
3.4.2 Isozymes data
Isozymes were first described by Hunter and Markert (1957) who defined them as different
variants of the same enzyme having identical functions and present in the same individual.
This definition encompasses (1) enzyme variants that are the product of different genes and
thus represent different loci (described as isozymes) and (2) enzymes that are the product


Bibliography – Organization of genetic resources
- 26 -
of different alleles of the same gene (described as allozymes). Isozymes constitute a
powerful tool for genetic diversity study within and among population of plants and
animals. Isozymes may be almost identical in function but may differ in other ways. In
particular, amino acid substitutions that change the electric charge of the enzyme (such as
replacing aspartic acid with glutamic acid) are simple to identify by gel electrophoresis,
and this forms the basis for the use of isozymes as molecular markers.
Isozymes have been the most widely used molecular markers to identify genetic variation
within and between populations. Genetic diversity in 79 European accessions of the Barley
Core Collections was surveyed using isozyme electrophoresis. Results on a total of 26
alleles observed at ten isozyme loci demonstrated that 6-rowed barley contained larger
diversity than 2-rowed barley and that winter type contained larger diversity than spring
type (Liu et al. 2000). Also for barley, Kaneko et al. (2002) investigated the polymorphism
and geographical distribution of β-amylase isozymes by isoelectric-focusing (IEF) analysis
in a sample of world barley. The isozyme pattern of high thermostability type A and low
thermostability type C varieties was restricted in isozyme type II. However, the isozyme
pattern of the middle thermostability type B varieties was polymorphic.
Concerning wheat, a large amount of studies focused on wheat endosperm storage proteins:
gliadins and glutenins, because they play an important role in dough properties and in
bread making quality in various wheat varieties. Therefore, many researches were
performed in order to survey genetic diversity of genes coding these proteins (Metakovski
and Branlard 1998; Branlard et al. 2001; Ruiz 2002). For example, by using SDS - PAGE,
the different alleles encoded at the 6 glutenin loci and at 3 ω-gliadin loci were identified
from a set of 200 hexaploid wheat cultivars grown primarily in France (Branlard et al.
2003), and some associations were revealed due to pedigree relatedness between some
French wheat cultivars. These studies allowed to better understanding genetic diversity of
protein-coding genes, which can be useful for future genetic and technological wheat
improvement.
3.4.3 NIRS data
With increases in the processing speed of PCs, and in the capabilities of the softwares,
Near Infrared Spectroscopy (NIRS) data have been used to analyze and measure the
concentration of a number of compounds simultaneously in more complex mixtures. For
cereals, NIRS method has been used to investigate diversity in rice varieties (Krzanowski


Bibliography – Organization of genetic resources
- 27 -
et al. 1995) in order to identify differences between Basmati and other rices. Moreover,
Roussel et al (2005) studied wheat components (proteins, minerals, fatty acids and
carbohydrates) in a set of 539 French bread wheat accessions released and cultivated
during the last two centuries in France. Results showed that whole NIRS spectra provided
a useful tool for describing the global evolution of the chemical composition of the grain of
French wheat.
3.4.4 Molecular data
3.4.4.1 RFLP
Restriction Fragment Length Polymorphism (RFLP) is a technique that uses restriction
endonucleases (RE) to cut DNA at specific 4-6 bp recognition sites and resulting fragments
are separated according to their molecular size using gel electrophoresis. Presence and
absence of fragments resulting from changes in recognition sites are used identifying
species or populations. Because RFLPs were the first molecular markers developed, they
have been widely used for diversity analyses in numerous plant species. Only selected
results on wheat will be presented here.
Genetic diversity in a set of 11 red and 11 white wheat lines from the Eastern U.S. soft
wheat germplasm pool was measured using restriction fragment length polymorphism
(RFLP) assay (Kim and Ward 1997). It revealed that the frequency of polymorphism in the
Eastern U.S. soft white winter (SWW) wheat gene pool was much lower than that observed
in the Eastern U.S. soft red winter (SRW) wheat gene pool. In another study, genetic
diversities were investigated in landraces of T. aestivum from China (38) and Southwest
Asia (55) by RFLP analysis (Ward et al. 1998). A total of 368 bands were found for 39
Chinese hexaploid wheat accessions with 63 RFLP probe-HindIII combinations. Results
showed that the individual Chinese landrace wheat groups revealed less variation than
those from Afghanistan, Iran, and Turkey. Also, a narrow genetic variability was revealed
among 17 populations of wild emmer wheats sampled from South-eastern Turkey, by
using eleven RFLP clones and 4 restriction enzymes (Tanyolac et al. 2003). All the
published works demonstrated that RFLPs were an effective marker to study genetic
diversity.
3.4.4.2 RAPD
Random Amplified Polymorphic DNA (RAPD) analysis described by Williams et al.

Bibliography – Organization of genetic resources
- 28 -
(1990) was a commonly used molecular marker in genetic diversity studies. The principle
involved in generating RAPDs is that, a single, short oligonucleotide primer, which binds
to many different loci, is used to amplify random sequences from a complex DNA
template. This means that the amplified fragments generated by PCR depend on the length
and size of both the primer and the target genome. The assumption is made that a given
DNA sequence (complementary to that of the primer) will occur in the genome, on
opposite DNA strands, in opposite orientation within a distance that is readily amplifiable
by PCR. These amplified products (of up to 3.0 kb) are usually separated on agarose gels
and visualised by ethidium bromide staining. The use of a single 10-mer oligonucleotide
promotes the generation of several discrete DNA products and these are considered to
originate from different genetic loci. Polymorphisms result from mutations or
rearrangements either at or between the primer binding sites and are detected as the
presence or absence of a particular RAPD band. This means that RAPDs are dominant
markers and therefore cannot be used to identify heterozygotes.
RAPDs have been largely exploited in genetic diversity researches. A set of 86 RAPD
markers was used to characterize the USDA Poa pratensis collection (Johnson et al. 2002),
and illustrating that RAPD was a very useful tool in species identification and diversity
estimation within accessions. In order to study genetic diversity among Croatian wheat
cultivars, 36 RAPD primers were screened and the 14 most polymorphic ones yielded 341
polymorphic bands. RAPD markers showed a high level of polymorphism among the
cultivars examined and the breeding lines. (Maric et al. 2004).
3.4.4.3 AFLP
The AFLP (Amplified Fragment Length Polymorphism) technique was described by Vos et
al. (1995) and is based on the selective PCR amplification of restriction fragments from a
total digest of genomic DNA. The technique involves three steps: (i) restriction of the DNA
and ligation of oligonucleotide adapters, (ii) selective amplification of sets of restriction
fragments, and (iii) gel analysis of the amplified fragments. PCR amplification of
restriction fragments is achieved by using the adapter and restriction site sequence as target
sites for primer annealing. The selective amplification is obtained by the use of primers
that extend into the restriction fragments, amplifying only those fragments in which the
primer extensions match the nucleotides flanking the restriction sites. Using this method,
sets of restriction fragments may be visualized by PCR without knowledge of nucleotide


Bibliography – Organization of genetic resources
- 29 -
sequence.
AFLP has been wildly used in genetic diversity analysis. Genetic diversity was estimated
within and between populations of perennial ryegrass (Lolium perenne L., Guthridge et al.
2001). Cluster analysis of AFLP data from bulked samples produced a phenogram showing
relationships consistent with the results of individual analysis. These results suggested that
AFLP profiling provides an important tool for the detection and quantification of genetic
variation in perennial ryegrass. A study of the genetic variability in 94 genotypes from ten
populations of wild barley, Hordeum spontaneum (C. Koch) Thell., originating from ten
ecologically and geographically different locations in Israel, was performed (Turpeinen et
al, 2004). It revealed that genetic diversity was larger within (69%) than among (31%)
populations.
For wheat, Roy et al (2004) performed a comparison between AFLP-based genetic
diversity with diversity based on SSR, SAMPL, or phenotypic traits in 55 elite and exotic
bread wheat lines. Results showed that AFLP was superior for estimation of genetic
diversity for landraces to other molecular markers. Moreover, a group of 54 synthetic
hexaploid wheats derived from crosses between emmer wheat (Triticum dicoccum, source
of the A and B genomes) and goat grass (Aegilops tauschii, D genome donor) were
investigated for genetic diversity. Based on data from four AFLP primer pairs,
dendrograms revealed clear grouping according to geographical origin for the T. dicoccum
parents but no clear groups for the Ae. tauschii parents (Lage et al. 2003). This study also
suggests that synthetic hexaploid wheats can be used to introduce new genetic diversity
into the bread wheat gene pool. In 2002, a substantial amount of between- and
within-cultivar genetic variation was detected in all the 13 registered modern Canadian
durum wheat (Triticum turgidum L. ssp. durum (Desf.) Husn.) cultivars based on AFLP.
Among the approximately 950 detected AFLP markers, only 89 (average of 8.9
polymorphic loci per primer pair) were polymorphic, 41 showing polymorphism between
cultivars whereas the remaining 48 showed polymorphism within at least one cultivar.
Otherwise, the level of genetic variation among individuals within a cultivar at the
breeders' seed level was estimated based on an inter-haplotypic distance matrix derived
from the AFLP data. Results show that the level of genetic variation within the
most-developed cultivars is fairly substantial despite rigorous selection pressure aimed at
cultivar purity in breeding programs (Soleimani et al. 2002).


Bibliography – Organization of genetic resources
- 30 -
3.4.4.4 Microsatellites
Numerous works were carried out in cereals like rice (Ni et al. 2002; Yu et al. 2003; Zhou
et al, 2003), maize (Matsuoka et al. 2002; Tarter et al 2004, Clerc et al. 2005; Menkir et al.
2005), sorghum (Brown et al. 1996; Djè et al. 2000; Ghebru et al. 2002; Casa et al. 2005),
barley (Struss et al. 1998; Sjakste et al. 2002; Russell et al. 2003), and rye (Chebotar et al.
2003). In the case of wheat, this type of marker was also largely used to study genetic
diversity among European varieties (Röder et al, 2000), in European bread wheat varieties
released from 1840 to 2000 (Roussel et al 2005), among European cultivated spelt (Bertin
et al. 2001), among old and modern Siberian varieties (Khlestkina et al, 2004), in natural
populations of wild emmer wheat, Triticum dicoccoides, in Israel (Fahima et al. 2002).
Through these studies, we are able to better understand the diversity in these species, as
well as their evolution.
3.4.4.5 Inter- Simple Sequence Repeat (ISSR)
Inter-simple sequence repeat or ISSR is an efficient DNA fingerprinting method that do
not require prior knowledge of the nucleotide sequence to be analyzed. One single ISSR
reaction can simultaneously identify multiple polymorphisms at various loci throughout the
genome, depending on the amount of variation between the cultivars studied. ISSR
techniques were firstly described by Zietkiewicz et al. (1994) and are used to detected
polymorphisms for a short DNA sequence between two SSR in the genome, by designing
primers from microsatellite regions. ISSR has been widely used for genetic diversity
studies in barley (Tanyolac et al. 2003), Lolium perenne (Ghariani et al. 2003), rice (Bao et
al. 2006). For example, Ghariani et al (2003) examined the genetic diversity in Tunisian
perennial ryegrass (Lolium perenne) by using inter-simple sequence repeats (ISSR). One
hundred and thrity six polymorphic ISSR markers (average of 12.6 polymorphic
bands/primer) were used to estimate the genetic distance among eighteen accessions, to
draw phylogenetic trees, and to provide evidence of a high degree of genetic diversity in
Tunisian ryegrass.
3.4.4.6 Sequence Tagged Site (STS)
Sequence tagged site or STS is a short unique genomic sequence that is amplified by using
allele-specific oligonucleotides as PCR primer. When mapped RFLP or gene sequence


Bibliography – Organization of genetic resources
- 31 -
information is available, it can be used to design PCR-based STS primers. To date, STS
has been used to analyze the genetic diversity for several agricultural crops, such as in
Hordeum (Chen et al. 2005). To assess the genetic diversity among China’s cultivated
barley, sequence tagged site (STS) marker analysis was carried out to characterize 109
morphologically distinctive accessions originating from five Chinese eco-geographical
zones. Fourteen polymorphic STS markers representing at least one on each chromosome
were chosen for the analysis. They revealed a total of 47 alleles, with an average of 3.36
alleles per locus (range 2–8). The result suggested that the STS diversity in different zones
was quite different from the morphology diversity, and indicated that the STS variation
was partitioned into 17% among the zone and 83% within the zone (Chen et al. 2005).
3.4.4.7 Single Nucleotide Polymorphisms (SNPs)
Single Nucleotide Polymorphism or SNP is a DNA sequence variation, occurring when a
single nucleotide (adenine (A), thymine (T), cytosine (C) or guanine (G)) is altered in the
genome (i. e. substituted, deleted or added). It is estimated that there is probably one SNP
locus every 500 to 1,000 bp between two individuals randomly sampled in the same
species. This large abundance suggests that SNPs markers can be useful for numerous
genetic applications. For example, SNPs were approved as an effective mean of
characterizing the range of DNA variation at a genomic scale in Arabidopsis thaliana and
to build up a core collection (McKhann et al. 2004). Since SNPs appeared recently, only
few studies used this method for genetic diversity estimation in cereals and they were
focused on genes of interest. For example, in 2003, Yanagisawa et al. investigated a single
nucleotide polymorphism (SNP) in the Wx-D1 gene of wheat by using a derived cleaved
amplified polymorphic sequence (dCAPS) marker, and showed that the SNP in the Wx-D1
gene was responsible for the waxy character. Furthermore, this type of marker was also
demonstrated to be a very useful tool to study linkage disequilibrium in common wheat
(Ravel et al. 2005) as well as in barley (Potokina et al. 2006).
3.4.4.8 Expressed Sequence Tag (EST)
An Expressed Sequence Tag or EST is a short sub-sequence of a transcribed
protein-coding or non-protein-coding DNA sequence. ESTs can be derived in PCR-based
markers, which can detect length and sequence polymorphisms carried by the expressed
regions of plant genomes. This involves the designing of primers separated by an

Tab 1-5: Comparison of different molecular markers
Markers Advantages Disadvantages Morphological Easy monitor Affected by the enviroment markers Limited number of avaible markers Sometime difficult to score Allozymes Cheap Limited number of avaible markers Samlp being prepared easily Some loci show protein instability Standard statistical procedure Potentially direct target of selection RFLPs Co-dominant inheritance Low infornation content Reproductibility Pollution of isotope Highly tansferable across distant relatives Requirement of a huge quantity of DNA Impossible to automate RAPDs Cheap Relatively high information content Low reproducibility Requirement neither DNA probe nor sequence information Dominant inheritance Technique quick and simple Requirement of small amounts of DNA Automation AFLPs High information content Expensive Reproductibility Dominant inheritance Genome-specific Automation
SSRs Abundant dispersion on the whole genome High mutation rate High information content Complex mutation behaviour Co-dominant inheritance Reproductibility Locus specificity for g-SSRs Highly tansferable across distant relatives for EST-SSRs Automation ISSRs High information content High mutation rate Co-dominante Reproductibility No requirement of sequence information Technique quick and simple

Bibliography – Organization of genetic resources
- 32 -
amplifiable EST segment, and use of these primers for PCR amplication of gDNA. The
growing numbers of ESTs in databsaes has provided a valuable resource for EST markers.
They have been successfully used in several species of Pinus (Harry et al. 1998) and Picea
(Brown et al. 2001) to serve as links between the maps of different species. Moreover,
several EST-derived molecular markers have been widely exploited for phylogenetic
studies, such as EST-SNPs ( McKhann et al. 2004) or EST-SSRs (Eujayl et al. 2001;
Burstin et al. 2001; Thiel et al. 2003; Holton et al. 2002; Gupta et al. 2003; Gao et al. 2003;
Hackauf and Wehling 2002).
3.4.4.9 Comparison between the different types of markers for diversity analyses
Advantages and drawbacks of the different types of markers are given in Tab. 1-5. It is well
known that morphological data are the less reliable markers because of their strong
interactions with environment. They are in a limited number, and sometime difficult to
score. This is why molecular markers were primarily developed. Compared with other
markers, isozymes are relatively inexpensive. Large samples can be processed with far less
training and time per sample, and standard statistical procedures can be used for fine and
broad scale genetic variation studies. However, their number is also limited (about 40) and
only few alleles exist at each locus. In recent years, there has been an explosion in the
number of different types of DNA markers available, which provide the same type of
information as isozymes, but allow clearer resolution of genetic differences and which can
be found in an almost unlimited number. In the past decades, RAPDs have been widely
used because they require neither DNA probe nor sequence information. In addition, the
procedure involves no blotting or hybridization steps leading therefore the technique quick,
simple and efficient. RAPDs also require only small amounts of DNA (about 10 ng per
reaction) and the procedure can be automated. However, RAPDs are known to be only
poorly reliable and reproducible between the laboratories. Moreover, these markers are
mainly dominants and heterozygotes cannot be detected. Concerning AFLPs, the method
allows the specific co-amplification of a high number of fragments. Typically 50-100
fragments are amplified and detected on denaturing polyacrylamide gels. The AFLP
technique provides a novel and very powerful DNA fingerprinting technique for DNAs of
any origin or complexity. However, like RAPDs, these are mostly dominant markers and
only two alleles are observed at each locus (presence/absence of a band). RFLPs are
mainly codominant markers which show a quite high level of polymorphism and several
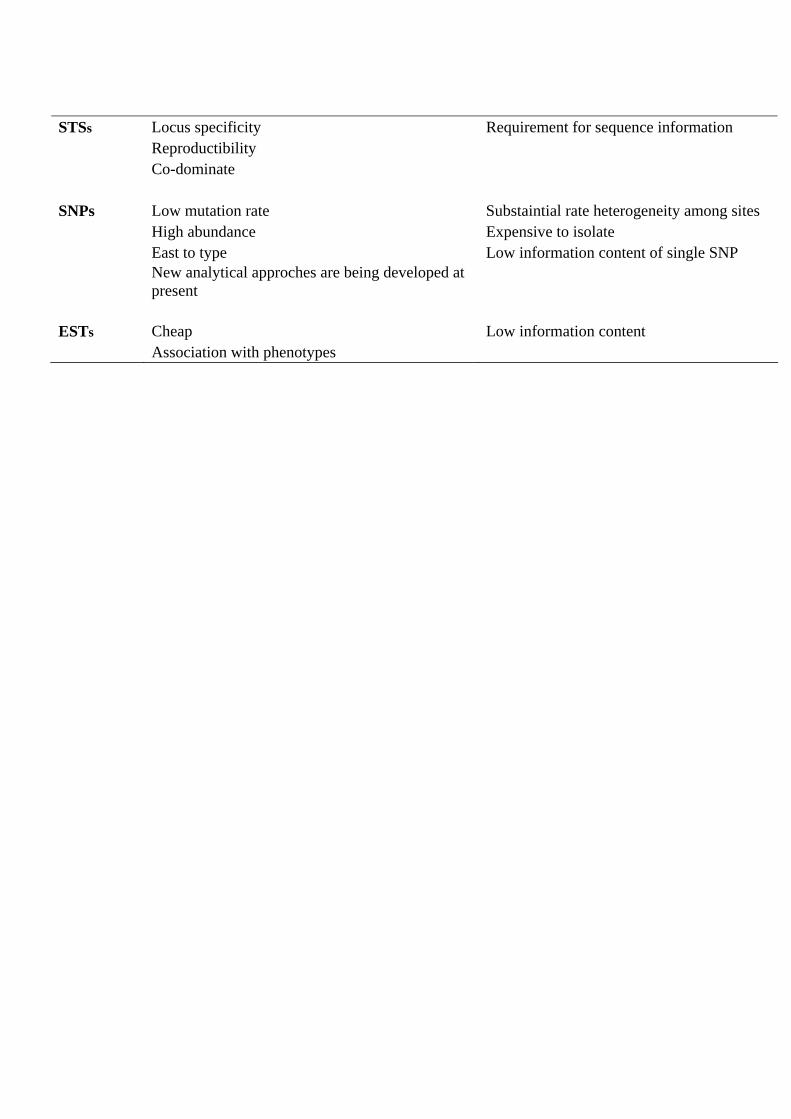
STSs Locus specificity Requirement for sequence information Reproductibility Co-dominate
SNPs Low mutation rate Substaintial rate heterogeneity among sites High abundance Expensive to isolate East to type Low information content of single SNP
New analytical approches are being developed at present
ESTs Cheap Low information content Association with phenotypes

Bibliography – Organization of genetic resources
- 33 -
alleles at each locus (mean ~3). In addition, they often detect homoeologous copies and
can thus be used in comparative studies. However, they require a huge quantity of DNA
(several µg) and are also impossible to automate. Thus, only few samples can be run
simultaneously. SSRs exhibit all the advantages of the other markers. They are codominant,
highly reproducible and polymorphic (twice more than RFLPs), they can be easily
automated and are mainly genome-specific in wheat. However, due to this latter point, they
cannot be used in comparative studies and in addition; they are very expensive to develop
because of the high number of sequences that must be made prior to have a useful marker.
Despite this, they constitute the marker of choice for genetic studies in wheat.


Aims of the thesis
- 34 -
3.5 Aims of the thesis
3.5.1 Scientific question
As previously described, the Triticeae species show a high genetic variability that can be
useful for wheat genetic improvement. They can constitute a huge reservoir of new alleles
for biotic and abiotic resistances as well as for quality or development traits. However,
introducing wild genotypes into the classical breeding programs may have some
advantages but also many drawbacks. Especially, these species carry numerous traits that
are not compatible with modern agricultural practices such as plant height, poor lodging
resistance, free threshing, etc. At the present time, new genomic tools that have been
extensively developed for wheat genetics can be used in breeding programs for marker
assisted selection, QTL detection or positional gene cloning. Nevertheless, these tools are
not adapted to the study, exploration and exploitation of wild genetic resources, because of
the low transferability of g-SSR markers. Because of the cost, almost no effort is made to
develop genomic tools necessary for each species. The aims of the thesis were thus 1) to
develop a set of markers useful for a large number of wild wheat-related species and 2) to
use this set for phylogenetic studies.
3.5.2 Methodology
As demonstrated above, the SSRs are the marker of choice for wheat genetic studies but
they are expensive to develop. According to this, it was concluded that developing a
specific representative set for each species was prohibitive. In addition, the g-SSRs are
only poorly transferable to related species and the markers developed from wild species
will be useful neither on wheat nor on the other species. Concerning this latter point,
sequences that are likely to be more transferable are the coding sequences because they are
known to be well conserved even between divergent species. It was also demonstrated that
a significant proportion (about 10%) of the genes contain a microsatellite motif. It was thus
decided to develop a set of microsatellites issued from wheat coding sequences. At the
present time, there are more than 600,000 wheat ESTs in the international data bases
(http://www.ncbi.nlm.nih.gov/dbEST/) representing nearly 50,000 unique contigs
suggesting that about 5,000 EST-SSRs can be developed. We also decided to use the
available rice sequence (http://www.tigr.org/tdb/e2k1/osa1/pseudomolecules/info.shtml) to
develop EST-SSRs from the rice coding regions. We decided to focus on rice chromosome


Aims of the thesis
- 35 -
1 because the syntenic relationships are known to be well conserved with wheat group 3
chromosomes. This homoeologous group is of main interest for the UMR since the
physical map of the chromosome 3B is currently under elaboration in the team. Moreover,
this chromosome is the largest in physical size, and a number of important traits are known
to be controlled by loci on this chromosome. Because we would like to have together
transferable markers to a large range of related species and showing the highest possible
variability, our EST-SSRs were tested on a set of more than 30 species and on about five
accessions for each species.
3.5.3 Deliverables
According to the aims, the results will be presented into three parts:
-the development of the set of markers. From the experience of the lab, it was decided to
start with a set of 300 ESTs containing a microsatellite motif. It was expected to have
about 80% of the primer pairs giving an amplification product and about 40% giving
polymorphism on wheat.
-the study of the transferability of the EST-SSRs to wheat-related species. This part was
made following a two-steps procedure. Transferability was first evaluated on a set of eight
different species. Then, the most transferable markers were used on the total set of the
lines.
-the evaluation of genetic diversity within and between the species. Genetic diversity was
estimated in terms on number of new alleles compared to wheat. Phylogenetic
relationships between the species were then evaluated using either separated sets of
markers (according to their chromosomal assignment) or the whole set but only between
species with similar levels of ploidy.


MATERIALS & METHODS


Material and Methods
- 36 -
Chapter II: Material and Methods
1 Plant material and DNA extraction
1.1 Hexaploid wheats for polymorphism evaluation
In a first phase, eight hexaploid wheat lines corresponding to the parents of five mapping
populations were used for polymorphism screening of the microsatellites: W7984
(synthetic wheat, Van Deynze et al. 1995) and cultivars Opata, Courtot, Chinese Spring,
Eurêka, Renan, Arche, and Récital. Twenty-two additional wheat cultivars (Annex 2) were
further analysed in order to evaluated polymorphism information content (PIC) values and
for phylogenetic studies. These lines were selected according to Roussel et al. (2005) in
order to maximize the variability. They are issued from a larger core-collection of 372 lines
which represents nearly the whole variability (98%) existing in the total collection
available in Clermont-Ferrand (F Balfourier, personal communication). For each accession,
ten seeds from self-pollinated ears were sown for further DNA extraction.
1.2 Grass species for transferability studies
Eight accessions of cultivated or wild species including polyploid as well as diploid
species were primarily used to study the transferability of EST-SSRs to close and wild
relatives of wheat: T. durum, T. monococcum, Ae. speltoides, Ae. tauschii, rye (Secale
cereale), barley (H. vulgare), Agropyron elongatum, and rice (Oryza sativa). In a second
step, a larger number of wheat-related species or sub-species was evaluated. In order to
facilitate the comparison, similar numbers of accessions (between two and six) for each
species were randomly chosen among our collection except for T. durum and Triticale
where respectively 23 and 8 varieties were selected. Overall, 182 accessions representing
33 species or sub-species of the grass family and 17 genomes were used (Annex 2). Seeds
were mainly obtained from the Centre of Biological Resources on Cereal Crops
(INRA-Clermont-Ferrand), and from Jacques David (INRA Montpellier, tetraploid and
Aegilops species), Nathalie Chantret (INRA-CIRAD Montpellier, rice species) and
Philippe Barre (INRA Lusignan, Lolium species). Similarly as for wheat, for each species,
between five and ten seeds from self-pollinated ears, (when available or possible) except
for rye and Ae. speltoides were sown for further DNA extraction.
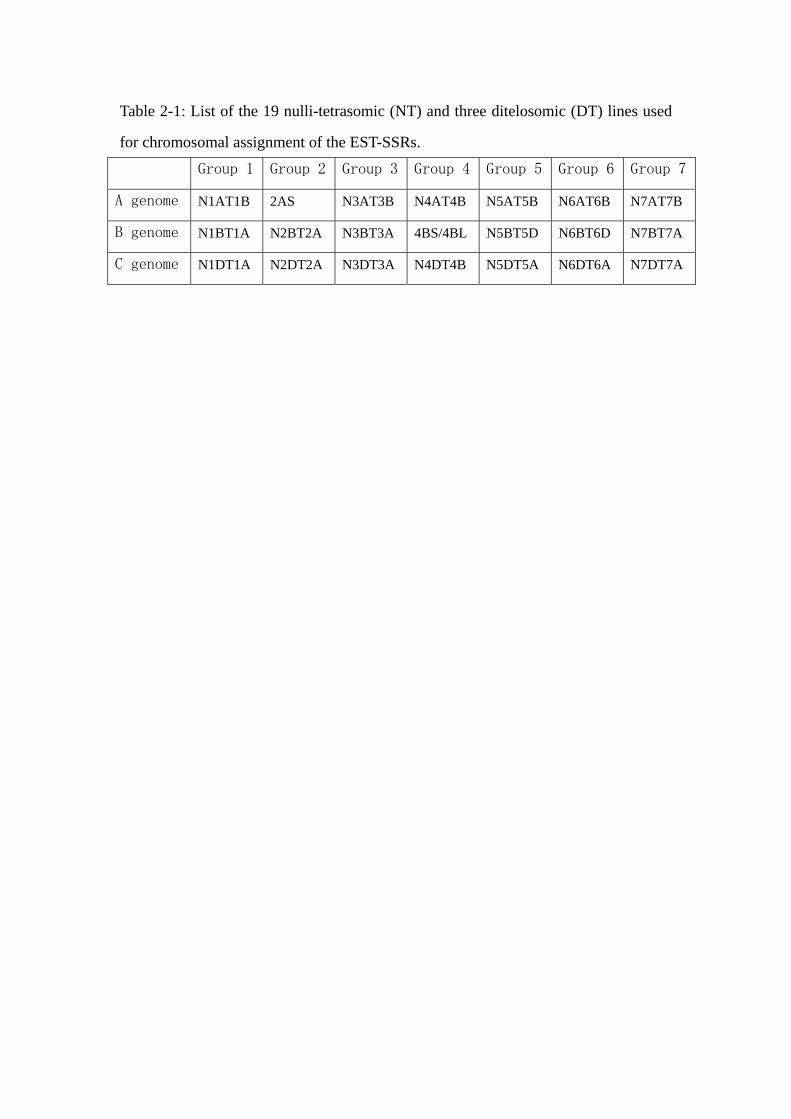
Table 2-1: List of the 19 nulli-tetrasomic (NT) and three ditelosomic (DT) lines used
for chromosomal assignment of the EST-SSRs.
Group 1 Group 2 Group 3 Group 4 Group 5 Group 6 Group 7
A genome N1AT1B 2AS N3AT3B N4AT4B N5AT5B N6AT6B N7AT7B
B genome N1BT1A N2BT2A N3BT3A 4BS/4BL N5BT5D N6BT6D N7BT7A
C genome N1DT1A N2DT2A N3DT3A N4DT4B N5DT5A N6DT6A N7DT7A

Material and Methods
- 37 -
1.3 Aneuploid lines
Hexaploid wheat tolerates the loss of a certain level of its genetic patrimony because this
can generally be balanced by the other homoeologous chromosomes. Thus, stocks of
aneuploid lines were developed from Chinese Spring by Sears (1954, 1966) and were
kindly provided to us by Dr Steve Reader (John Innes Centre, United Kingdom) for
chromosomal assignment of EST-SSR markers. The complete set of nulli-tetrasomic (19
NT, Table 2-1) lines except nulli 2A (N2A) and nulli 4B (N4B) supplemented with three
ditelosomic (DT) lines (DT2AS, DT4BS, DT4BL) was used to assign marker to wheat
chromosomes or chromosome arms.
1.4 Segregating populations
Two segregating populations extensively used in the laboratory and for which
well-saturated genetic maps were previously elaborated, were used for genetic mapping of
the polymorphic EST-SSRs.
1.4.1 ITMI population
The ITMI (International Triticeae Mapping Initiative) population is recognized as the
international reference for genetic mapping. It was developed from the cross between the
Mexican spring wheat cultivar Opata 85 and the Synthetic wheat W7984. This latter was
obtained from a cross between the diploid D genome ancestor of cultivated wheat,
Aegilops tauschii (Coss.) Schmal. and the CIMMYT (Centro International de Mejoramento
de Maize Y Trigo) T. durum (AABB) variety ‘Altar 84’, using the T. durum line as the
female parent. Crossing between these two species was followed by embryo excision and
culture and colchicine treatment of seedlings in order to generate fertile amphihexaploid
plants. Pollen from one of these was used to pollinate the variety ‘Opata 85’. The F1
progeny was grown in Ciudad Obregon, Mexico, and the F2 seeds were cultivated and
advanced by single-seed descent to the F7-8 generation in Cornell University (New York,
USA). A set of 114 lines was randomly selected and widely distributed in various labs all
over the world for genetic mapping leading now to more than 3,000 loci mapped. In our
case, we selected 90 lines for genotyping in order to integrate our EST-SSRs to ITMI
reference map.
1.4.2 Courtot x Chinese Spring population
The population consisted in 217 doubled-haploid (DH) lines and was produced through


Material and Methods
- 38 -
anther culture from Courtot (Ct) x Chinese Spring (CS) F1-hybrids (Félix et al., 1996;
Cadalen et al., 1997) according to the procedure described in Martinez et al. (1994).
Contrary to Chinese Spring, Courtot is a semi-dwarf variety with a good productivity and a
good bread-making quality. However the former represents the international reference in
wheat genetics with numerous series of specific material (Sears 1954, 1966; Law et al.
1988; Gale and Miller 1988; Endo and Gill 1996) and a lot of Expressed Sequence Tags
(ESTs) and full-length cDNA libraries (Ogihara et al. 2004). Moreover, these two cultivars
presented a high level of polymorphism (60%, Cadalen et al. 1997) as well as many
differences for several agronomic traits (for a review see Sourdille et al. 2003). One
hundred and six lines were genotyped for most markers and an additional set of 81 DH
lines were genotyped only for anchor loci. The genetic map now includes 824 loci and
covers 3,685 cM (Sourdille et al. unpublished results). Ninety-four DH lines were screened
in our study to integrate our EST-SSRs into the CT x CS genetic map.
1.5 DNA extractions
DNA extraction was performed according to a CTAB protocol as described by Murigneux
et al. (1993). The detailed protocol is presented in Annex 6. About 3g of fresh young leaves
of each individual were cut from 3- to 4-weeks-old seedlings and were ground in liquid
nitrogen. The quality of each DNA sample was estimated after migration on 0.8% agarose
gel and their concentrations were quantified using spectrophotometry at OD260 nm
(Eppendorf, BioPhotometer, Germany).
2 Wheat and rice EST-SSRs
2.1 Analysis of the wheat ESTs
The clustering was done from 170,746 wheat EST sequences originating from public and
Génoplante databases (92,387 and 78,359 ESTs, respectively). The sequences were
previously masked for vectors and repeats. The minimal overlapping length was fixed at 80
bp with 96% identity for an alignment length between 80 bp and 200 bp and 90% identity
for an alignment length greater than 200 bp. The CAP3 program (Huang et al. 1999) was
used for EST assembly with default parameters on unmasked sequences. This resulted in
19,191 contigs containing a range of 2–395 sequences and 27,319 singletons (Nicot et al.
2004). The 46,510 consensus sequences ranged from 93 to 7,497 bp in length and were
screened for the presence of SSRs using either REPEATMASKER (Smit AFA and Green P,


Material and Methods
- 39 -
http://ftp.genome.washington.edu/RM/RepeatMasker.html) SSRSEARCH
(ftp://ftp.gramene.org/pub/gramene/software/scripts/ssr.pl) or TRF (Benson 1999) programs.
A microsatellite was considered when the sequence contained a minimum of three repeats
of a motif comprising from one to six nucleotides, with a total length of at least 12
nucleotides. ESTs containing SSRs were then extracted from the pool of 46,510 contigs.
For our study we randomly selected about 1,000 EST sequences containing a microsatellite
which were further used for primer design.
2.2 Primer design
Primers were designed using Primer software (version 0.5, Whitehead Institute for
Biomedical Research, Cambridge, Mass.) based on the following criteria: primer length
ranging from 18-22 bp with 20 bp as the optimum; product size ranging from 100-400 bp;
melting temperature (Tm) between 57-63°C with 60°C as optimum; GC% content between
20-80%; maximum acceptable primer self-complementarity of 5 bases; maximum
acceptable 3’ end primer self-complementarity of 3 bases. Primers were selected when they
contained as few as possible of repeated sequence, and when the 3’-end of the two primers
ended with C or G when possible. Primer sequences were subjected to BLAST analysis
against an in-house database to avoid redundancy with those that already exist. On this
basis, 301 primer pairs were selected, and designated as CFE (primer sequences available
on Graingenes: http://wheat.pw.usda.gov/index.shtml). Each forward primer was
M13-tailed (M13: 5’CACGACGTTGTAAAACGAC3’, synthesis MWG (Germany)) for
easier automation on capillary electrophoresis system (see further).
2.3 Rice EST-SSRs
Synteny relationships between rice and grass species using a circle as a model were already
described by Moore et al. (1995) and colinearity between wheat group 3 chromosomes and
rice (Oryza sativa L.) chromosome 1 was even shown earlier (Devos et al. 1992; Ahn et al.
1993; Kurata et al. 1994; Van Deynze et al. 1995) and precised recently (Sorrells et al.
2003; La Rota and Sorrells 2004, Munkvold et al. 2004). We thus decided to develop SSRs
from rice chromosome 1 and test for their transferability on wheat group 3 chromosomes.
From TIGR rice pseudo-molecules, (The Institute for Genomic Research;
http://www.tigr.org/,version V02 ) 6,852 unigene sequences from rice chromosome 1
(including exons, introns and upstream/downstream untranslated region) were screened for
the presence of perfect and imperfect SSRs using either SSRSearch or TRF programs

Figure2-1. M13-tailed primer strategy

Material and Methods
- 40 -
according to the same criteria as described above (3.1). More than 4,000 gene sequences
located on rice chromosome 1 contained at least one SSR. Based on the ARTEMIS viewer,
we selected 200 rice genes bearing SSRs, half of them being collinear to the wheat
3BL7-0.63-1.00 long arm distal deletion bin and the remaining 100 genes corresponding to
the bin 3BL2-0.22-0.50. These two regions are known to show a better level of
conservation with wheat homoeologous group 3 (Munkvold et al. 2004). The sequences
were then analyzed using Vector NTI (version 7) software to identify the location of the
SSR in CDS or in intron and only those where SSRs located in CDS were retained in order
to maximize the probability of conservation and thus transferability between rice and
wheat. Primers were designed using the following criteria: Tm ranging from 40 to 50oC,
GC% from 35 – 60 %; primer length from 20 – 25bp; maximum nucleotide repeats of 4;
maximum palindromes of 8; stem length of hairpin loop ≥ 3 and permitted dG ≥ -1.0; the
different Tm between forward and reverse primer ≤ 5oC; the different GC% content ≤ 10;
permitted dimers with dG ≥ -15 kcal / mol and permitted primer-primer 3’end
complementarities with dG ≥ -3 15 kcal / mol. Primers were selected when forward and
reverse primer showed as similar as possible Tm and GC% and formed as few as possible
dimers, and when the 3’-end of the two primers ended with C or G whenever possible. On
this basis, 106 primer pairs were selected, and designated as CFR. Like for wheat
EST-SSRs, each forward primer was M13-tailed.
2.4 EST-SSR detection
2.4.1 Principle of the M13-tailed primer method
For automation of the SSR detection on the ABI3100 capillary electrophoresis system
(Applied Biosystems), DNA fragments must be labeled with specific fluorescent dyes.
Because labeling all the primers individually would prohibitively increase the cost of
genotyping projects, which involve many SSR markers, an alternative and cost-effective
method was used. This technique employed a two-part primer in which a standard “tail”
corresponding to a universal M13 primer is added to the 5’ end of the forward primer
sequence. The amplification of SSRs is thus performed with three primers: the forward
primer with the M13 tail, the reverse non-tailed primer and the fluorescently labeled M13
primer (Boutin-Ganache et al 2001; Zhang et al. 2003; Fig 2-1).
2.4.2 PCR reaction and detection
PCR reactions were performed in two types of plate (96- or 384-wells plates). For the

Figure2-2: Example of chromosomal assignment for Xcfe 163 by aneuploid analysis

Material and Methods
- 41 -
96-wells-plate, a volume of 20 μL containing 80 ng of template DNA, 200 µM of each
dNTP, 0.4 unit of Taq polymerase (Qiagen) with 1X of its appropriate buffer (1.5 mM
MgCl2, 10 mM Tris-HCl (pH 9.0) and 50 mM KCl), 500 nM of each M13-labeled (6-FAM,
HEX, VIC, PET or NED) and reverse primer, 50 nM of the forward M13-tailed primer,
was added into each well. For the 384-well-plate, PCR reactions were carried out in a final
volume of 6.5 µL with the same concentrations as above except that only 25 ng of template
DNA and 0.2 U of Taq polymerase (Qiagen) were used. PCR amplifications were
conducted using the following procedure: 5 min 95°C, followeb by 20 cycles (30 sec 94°C,
30 sec 60°C, 30 sec 72°C) and 5 min 72°C. Fluorescent amplification products were then
mixed with de-ionized formamide and an internal size standard (Genescan 400 or
500–TAMRA, Applied Biosystems) in a 1:12:0.5 volume ratio. After a 5 min denaturation
at 95°C, amplification products were visualized using an ABI PRISM®3100 Genetic
Analyzer (Applied Biosystems). Fragment sizes were calculated using GENESCAN and
GENOTYPER softwares (Applied Biosystems), where different alleles are represented by
different amplification sizes for tandem repeats. 3 Data analysis
3.1 Genetic and cytogenetic mapping of EST-SSRs
3.1.1 Chromosomal assignment
Those primer pairs that yielded products were used for amplification on the 19
nulli-tetrasomic (NT) and three ditelosomic (DT) lines derived from Chinese Spring (Fig
2-2). EST-SSRs loci were assigned to the chromosomes corresponding to the
nullisomic-tetrasomic lines for which no amplification product was obtained, following
confirmation that all other nullisomic-tetrasomic lines amplification products were in order.
An example of chromosomal assignment for Xcfe163 is shown in Figure 2-2.
3.1.2 Genetic mapping
The polymorphic EST-SSRs were genotyped on either the ITMI or the CtCS segregating
populations according to the polymorphism revealed. The data were integrated into an
existing framework map. For all loci, goodness of fit to a 1:1 segregation ratio was tested
using a chi-square analysis. Linkage maps were previously constructed with
MAPMAKER/exp 3.06 (Lander et al. 1987) for loci showing no segregation distortion
(Sourdille et al. 2003 and unpublished results). Linkage groups were established by

Material and Methods
- 42 -
calculating recombination frequencies with identical conditions (maximum recombination
fraction = 0.35 and minimum LOD score = 3.0). The Kosambi mapping function (Kosambi
1944) was applied to transform recombination frequencies into additive distances in
centiMorgans. In our case, the new EST-SSR loci were attributed to and placed within the
framework of the chromosomes using respectively the “assign” and “place” commands of
Mapmaker.
3.2 Transferability of the EST-SSRs to wheat related species
Transferability of the wheat EST-SSRs to the related species was computed as the
percentage of markers giving an amplification product on at least one of the accessions
from a given species or sub-species. As an estimate of the genetic diversity within each
species or sub-species, the number of bands per locus and per individuals (NB) was
computed as follows: NB = (N x 100)/(116 x Transferability (%) x Number of individuals)
where N is the total number of bands observed for each species, 116 is the total number of
EST-SSRs tested and Transferability is the percentage of EST-SSRs that give an
amplification product on related species.
3.3 In silico analysis of EST-SSRs
To assign putative functions to EST bearing SSRs, the sequences were compared to the
SwissProt and TrEMBL protein databases using BLASTx algorithms (Altschul et al. 1990),
with expected value of 1 e-5 as a significant homology threshold. Putative functions were
attributed according to the definitions given at
http://www.godatabase.org/cgi-bin/amigo/go.cgi. Three different classes of function are
proposed: (1) biological process, which means phenomena, marked by changes that lead to
a particular result, mediated by one or more gene products, such as light-inducible protein
CPRF-2. (2) Cellular components including gene products that are parts of macromolecular
complexes, such as Actin. (3) Molecular function which means elemental activities, such
as catalysis or binding, presenting the actions of a gene product at the molecular level. For
example, sulfite reductase (Ferredoxin) involves in oxidoreductase reaction in catalytic
activity. tBLASTx searches were also performed against rice and barley NCBI unigene sets
(http://www.ncbi.nlm.nih.gov/) to study the degree of conservation of the repeated motif
between the three species. In addition, the EST sequences were compared to the rice
pseudo-molecules (http://www.tigr.org/tdb/e2k1/osa1/, version V01) using tBLASTx and
BLASTn to identify putative orthologues on rice chromosomes. E-values of less than 1 e-5,


Material and Methods
- 43 -
1 e-10, 1 e-25, 1 e-50 and 1 e-100, were selected.
3.4 Distribution of EST-SSRs on the rice genome
Potential bias in the distribution of wheat EST orthologs on rice pseudomolecules was
investigated using the relative error (Er). This value was computed as follows: the rice
gene proportion for each chromosome was calculated as the ratio between the number of
genes on the rice chromosome and the total number of genes on the rice genome (values at
http://www.tigr.org/tdb/e2k1/osa1/). Then the expected number of hits was evaluated as the
product of the number of wheat EST blasted (251) by the rice gene proportion. Observed
hit values were compared to the expected values using a classical binomial test from Splus
and only significant values at the 0.05 or 0.01 thresholds were retained.
3.5 Determination of Polymorphism Information Content (PIC) values
For each EST-SSR, the numbers and the frequencies of alleles were computed. Two alleles
are considered as identical when they show the same fragment size. The polymorphism
information content (PIC) value (Nei 1973) was then computed for each marker using the
following formula:
PIC= 1-∑ (Pi)2
where Pi is the proportion of the population carrying the ith allele, calculated for each SSR
locus. This value provides an estimate of the discriminating power of a locus by taking into
account not only the number of alleles that are expressed but also their relative frequencies.
PIC values were only computed for T. aestivum, T. durum and Triticale species because
larger numbers of accessions were used.
3.6 Determination of the Jaccard similarity coefficient (1908)
For phylogenetic studies, the binary matrix was generated as followed: presence of an
amplified product of a given size was scored as “1” while the absence of the same
amplification product was scored as “0”. The binary data were used to compute the
distance matrix as 1 – the Jaccard’s similiraty coefficient (1908). This latter coefficient (sij)
measures the asymmetric information on binary variables and is computed according to the
following formula:
Where p = number of bands present in both individuals (i and j)


Material and Methods
- 44 -
q = number of bands present in i and absent in j
r = number of bands present j and absent in i
Because transferability was not complete, null alleles were not considered and were quoted
as missing data since there was a higher probability that the lack of amplification was due to
the presence of numerous mutations in the flanking sequences which are obviously different
between the species rather than to a deletion of the genes which could have been considered
as similar events. This also justifies the choice of the Jaccard distance index, which does not
consider as informative a shared absence of a given trait (here an amplification product).
3.7 Unweighted Pair Group Method with Arithmetic Mean (UPGMA)
There are numerous methods for constructing phylogenetic trees from molecular data
(Felsenstein 1988; Miyamoto and Cracraft 1991). In the present study, a phylogenetic tree
was constructed by the Unweighted Pair Group Method with Arithmetic Mean (UPGMA,
Phylip software (Felsenstein et al. 1993)), which is the simplest, and the most intuitive
method for tree construction. As all the species studied belong to the Triticeae tribe, the
assumption of a molecular clock was acceptable. Therefore, the trees obtained by the
UPGMA clustering method can be considered as phylogenetic inferences. The reliability
and goodness of fit of dendrograms obtained from EST-SSRs data were tested through
bootstrapping based on 100 samples (Felsenstein, 1985). This led to 100 phylogenetic trees
summarized in a consensus tree which indicated the proportion of bootstrapped trees
showing that same clade.


RESULTS & DISCUSSION

Figure 3-1: Distribution of the different types of SSRs in wheat EST-SSRs.
0
50
100
150
200
250
Di- Tri- Tetra- Penta- Hexa-
Type of SSRs
Frequency
Figure 3-2: Frequency of the motifs according to their respective length. a:
dinucleotide motifs; b: trinucleotide motifs; c tetranucleotides motifs; d:
pentanucleotide motifs; e: hexanucleotide motifs.
a:
b:
0
10
20
30
40
50
60
70
80
90
CCG(GGC)
GAG(CTC0
CAG(ACG)
TGC(ACG)
TGG(ACC)
TTC(AAG)
ATC(TAG)
ATG(TAC)
CAA(GTT)
TAA(ATT)
Trinucleotide repeats
TG (AC)
TC (AG)
CG (GC)

Results and discussion – Characteristics of EST-SSRs
- 45 -
Chapter III: Results and discussion
1 Analysis of the wheat ESTs
All of the CFE forward and reverse primers designed within this study are listed in Annex
3.
1.1 Characteristics of EST-derived SSRs
Among the 301 wheat EST-derived SSRs selected, five different classes of repeated motif
length occurred (di- to hexanucleotides). The trinucleotide repeats were the most common
in our wheat ESTs (77%), followed by dinucleotide and tetranuleotide motifs accounting
respectively for 10.33% and 9%. The hexanuleotide motifs were the least common,
accounting for only 1.3% (Figure 3-1). Almost all EST-SSRs (99.3%) except two (Xcfe58
(TTA), Xcfe197 (TAA)) contained either a G or a C in the motif, whereas only 48% of
genomic SSRs did so (Wang et al. 1994).
Concerning dinucleotide repeats, only three occurred: (TG)n, (TC)n and (GC)n with
frequencies of 51.6%, 41.9% and 6.5% respectively (Fig 3-2a). No (TA)n motif was
observed in our case. For trinucleotide repeats, (GCC)n motif was the most abundant,
representing 36% followed by the (GAG), (CAG), (TGC), (TGG), (TTC), (ATC), (ATG),
(GAA) and (TAA) (Fig 3-2b). Frequency for tetranucleotide repeats are illustrated in
Figure 3-2c. Fifteen among the 33 possible classes of tetranucleotide repeats occurred in
this study, (GCGG) being the most frequent followed by (TACC). Only seven different
pentanucleotide repeats were found (AGGCG, GATCT, CTAGG, CATGG, GGAGG,
AAGGG, TCTCC) and only three hexanucleotide repeats (GAACCC, GGCGGT,
GGGGGC). Results are shown in Figure 3-2d and 3-2e.
The frequency of the number of repeats (n) was also surveyed (Figure 3-3). SSRs with
large numbers of repeats were less frequent than those with low numbers of repeats. Motifs
with four repeats occurred the most frequently in wheat EST-SSRs, accounting for 37.4%
of the n values. Most of the markers showed repeat unit numbers lower than 10 and
contributed 94.5% to the total number of EST-SSRs.

c:
0
1
2
3
4
5
6
T G T A T A C G C C G T G C G G G A A G T C G C C C A T A C A G G G A C G T G C G T G A G G T T G T C A G C T C A A T C
Tetranucleotide repeats
d: e:
0
0.5
1
1.5
2
AGGCG GATCT CTAGG CATGG GGAGG AAGGG TCTCC
Freq
uecny
0
0.5
1
1.5
2
2.5
3
GAACCC GGCGGT GGGGGC GCGGCG
Frequency
Figure 3-3: Distribution of the SSRs according to the number of repeats
0
20
40
60
80
100
3 X 4 X 5 X 6 X 7 X 8 X 9 X 10 X 11 X 12 X 13 X 14 X 15 X 16 X 20 X 22 X
Number of repeat units
Num
ber o
f SSR
s
Results and discussion – Characteristics of EST-SSRs
- 46 -
1.2 Amplification and polymorphism of EST-SSRs
The 301 primer pairs were tested on eight reference cultivars in order to detect
polymorphism. For each primer pair, quality of the amplification, real size of the PCR
product, and polymorphism between the parents of four mapping populations are shown in
Annex 4. About 80% (240) of the primer pairs led to an amplification product. Some
differences were observed between the expected and the observed size of the amplification
product. Among the 240 primer pairs, 51 (21.3%) gave an amplification product either
larger, suggesting the possible simultaneous amplification of an intron during the PCR, or
smaller than expected, suggesting (1) the occurrence of deletions within the genomic
sequences, (2) a lack of specificity of some primer pairs which may have amplified a
different copy belonging to the same multigenic family, or (3) a slight variation between
the amplified copy and the consensus sequence.
In general, EST-SSRs markers produced high quality patterns compared to those from
genomic SSRs (Fig. 3-4). In our study, 192 markers produced strong and clear bands,
representing about 80% of markers giving amplification (240).
Among all the cultivars tested, for all of EST-SSR markers, dinucleotide repeats displayed
higher level of polymorphism (Tab 3-1, 90.5%) than trinucleotide repeats (80%), while
tetranucleotide repeats showed the lowest level (57%). At the same time, 139 (58%) of the
240 markers giving an amplification product showed polymorphism on at least one of the
eight wheat cultivars used. The combination W7984 x Opata (37.5%) was the most
polymorphic (Figure 3-5) followed by Courtot x Chinese Spring with 25.4%, whereas
Eurêka x Renan and Arche x Récital gave the lowest level of polymorphism with 20.8%
and 20% respectively. The average level of polymorphism was 25.4% for the four
populations.
Overall, 223 out of the 240 primer pairs that amplified distinguishable bands in wheat
cultivars gave clear and readable patterns and were used to survey the number of bands
produced. Most of them (96%, Figure 3-6) gave less than four amplification products.
About 19.7% gave three bands probably corresponding to the three homoeologous
chromosomes while 54 % gave only one band suggesting that these latter were specific of
one of the three copies or that the three copies had identical sizes or that these SSRs were
located within unique genes.

Figure 3-4: Comparison patterns produced by g-SSRs with those by EST-SSRs a. Patterns produced by g-SSRs Xgwm383 (L) and Xgwm118 (R)
b: Patterns produced by EST-SSRs Xcfe190 (L) and Xcfe257 (R)

Results and discussion – Characteristics of EST-SSRs
- 47 -
1.3 Genetic mapping of the EST-SSRs
According to the survey of polymorphism, 90 out of the 240 EST-SSRs showed
polymorphism between the two parental lines of the ITMI population, Synthetic W7984
and Opata 85. Only 71 markers gave useful genotyping in the segregating population
because: i) some makers gave too weak bands to accurately distinguish the parental alleles;
ii) some that exhibited polymorphism between the parents were no more polymorphic
within the population. Among these 71 markers, 65 gave clear segregations and generated
75 loci which were tentatively integrated into the ITMI map. The remaining six were
excluded because of too complex patterns. Finally, 62 loci were directly integrated to the
map (Annex 5) while the remaining 13 loci were found to be unlinked to any of the other
markers. Eighteen additional markers that did not show any polymorphism in the ITMI
population were polymorphic between Courtot and Chinese Spring and could therefore be
mapped on the CtCS population. These markers gave rise to 22 loci among which, 19 were
added to the CTCS map (Annex 5), three remaining unlinked to any linkage group. Results
of the assignment to the different chromosomes are summarized in Tab 3-2. While no
significant differences were observed concerning the chromosomal assignment of the
wheat EST-SSRs to the wheat chromosomes (see further details in Zhang et al. 2005
below), more loci mapped to the B genome (40) compared to the A (31) and especially to
the D (10) genomes confirming that the former exhibits more polymorphism than the other
two. Similarly, only three loci mapped to group 5 chromosomes suggesting a better
conservation and less polymorphism within the genes from these chromosomes compare to
the others. For the map position (Annex 5), most of the loci were located in the distal
regions of wheat chromosomes, and only 13 loci were localized close to the centromeres.
However, the proximal genetic location does not involve that these markers are physically
located close to the centromere since genetic to physical distance relationships may vary a
lot along the chromosome (Sourdille et al. 2004). 1.4 Discussion
Recent studies on several plant genomes have demonstrated that SSRs were predominantly
located in ESTs compare to genomic DNA (Morgante et al. 2002). We thus investigated the
frequency of different classes and types of SSRs in wheat ESTs. Tricluneotide repeats were
the most frequent (~77%). This was expected since these SSRs only change the number of
amino acids in the protein but do not modify the reading frame if one or more motifs are
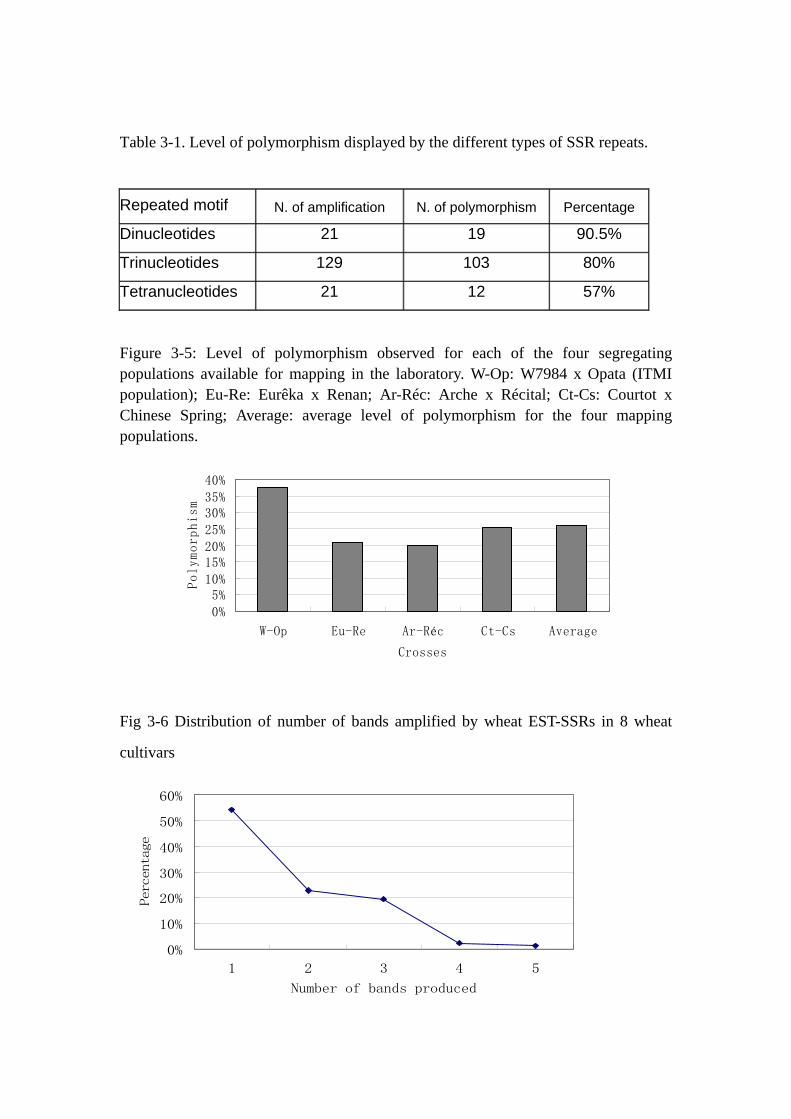
Table 3-1. Level of polymorphism displayed by the different types of SSR repeats.
Repeated motif N. of amplification N. of polymorphism Percentage
Dinucleotides 21 19 90.5%
Trinucleotides 129 103 80%
Tetranucleotides 21 12 57%
Figure 3-5: Level of polymorphism observed for each of the four segregating populations available for mapping in the laboratory. W-Op: W7984 x Opata (ITMI population); Eu-Re: Eurêka x Renan; Ar-Réc: Arche x Récital; Ct-Cs: Courtot x Chinese Spring; Average: average level of polymorphism for the four mapping populations.
0%5%
10%15%20%25%30%35%40%
W-Op Eu-Re Ar-Réc Ct-Cs Average
Crosses
Polymorphism
Fig 3-6 Distribution of number of bands amplified by wheat EST-SSRs in 8 wheat
cultivars
0%
10%
20%
30%
40%
50%
60%
1 2 3 4 5
Number of bands produced
Percentage

Results and discussion – Characteristics of EST-SSRs
- 48 -
added or deleted. This was also consistent with the results reported earlier (Morgante et al.
2002; Varshney et al. 2002; Nicot et al. 2004). Within EST-SSRs, the abundance of
trinucleotide repeats is attributed to the suppression of specific selection against the frame
shift mutation in coding region resulting from length changes in nontriplet repeats
(Metzgar et al. 2000)
For trinucleotide motifs, (CCG)n was very abundant in wheat EST sequences although
Kantety et al. (2002) found that in wheat, the most abundant trinucleotide motifs were
AAC/TTG. However, this was consistent with the results of Morgante et al. (2002) and of
Murray et al. (1989) who found a high GC% level in the monocotyledonous genes. Among
the ESTs analysed, 21% were issued from seed tissues. In seeds, the most frequent
amino-acids are Proline (Pro) and Glutamine (Gln) (Feillet, 1965). Pro is coded by CCG
and Gln by CAA and CAG. These three motifs represent 60% of all the trinucleotide
microsatellites we found in wheat ESTs. The difference observed with Kantety et al. (2002)
was probably due to the tissues used for EST production. The two motifs ATT/TAA and
CTA/TAG were less represented (0.54% and 1.36% respectively) presumably because they
constitute stop codons.
We found only two EST-SSRs without any C or G. Wang et al. (1994) demonstrated that
the majority of SSRs in coding region contained G+C base pairs, contrarily to A+T base
pairs, and also found that all of 8 (ATT)n, (TTA)n repeats were in non-coding region. Our
results were in agreement with those of Wang et al. (1994). The presence of “CpG islands”
upstream of many genes can be used to explain this phenomenon. Besides, due to the
stronger linkage between G and C than between A and T, this ensures a correct replication
(Carels et al. 2000). In addition, that TAA is a stop codon can also partially account for this
phenomenon.
Most wheat EST-SSRs were shorter than 10 repeat units and four units were the most
frequently encountered in our research. Lot of studies using both in silico analysis and
experimental designs showed that this feature is common to many species (Kantety et al.
2002; Thiel et al. 2003; Barrett et al. 2004; Varshney et al. 2002). Maybe this explains that
the polymorphism is lower for EST-SSRs than for genomic SSRs since longer SSRs are
more polymorphic (Thuillet et al. 2004). Conversely the selection pressure is probably very
strong and prevents the EST-SSRs from being too long and too polymorphic in order to
keep them functional.
About 25% of the EST-SSRs exhibited polymorphism which was similar to the results

Table 3-2: Distribution of EST-SSR loci on the genetic maps (in brackets number of loci on ITMI and CtCS maps respectively) according to their assignment to wheat chromosomes and homoeologous groups
Homoeologous Group 1 2 3 4 5 6 7 Total
Chromosome A 5 (0/5) 1 (1/0) 1 (1/0) 10 (10/0) 2 (1/1) 6 (4/2) 6 (4/2) 31 (21/10)
Chromosome B 9 (7/2) 5 (4/1) 9 (8/1) 2 (2/0) 0 4 (0/4) 11 (11/0) 40 (32/8)
Chromosome D 3 (3/0) 1 (1/0) 2 (2/0) 1 (1/0) 1 (0/1) 2 (2/0) 0 10 (9/1)
Total 17 (10/7) 7 (6/1) 12 (11/1) 13 (13/0) 3 (1/2) 12 (6/6) 17 (15/2) 81 (62/19)

Results and discussion – Characteristics of EST-SSRs
- 49 -
described earlier (Eujayl et al. 2001, Gupta et al. 2003, Thiel et al. 2003, Gao et al. 2004,
Nicot et al. 2004), and was much lower than that observed for genomic SSRs (53%, Eujayl
et al. 2001). The characteristics of EST-SSRs, i. e. the existence in the coding region where
the mutation was restrained and a lower number of repeat units, probably accounted for
this lower percentage of polymorphism. We also found that dinucleotide repeat displayed a
higher level of polymorphism than that of trinucleotide repeat, which was consistent with
the results of Nicot et al. (2004).
Eighty one new EST-SSR loci were integrated to the two reference genetic maps currently
used in the lab (62 and 19 on ITMI and 1 CtCS maps respectively). More loci mapped to
the B genome which was expected since this genome is always reported as being more
polymorphic than the other two. We noticed few discrepancies between cytogenetical
assignment to chromosomes or chromosome arms using NT/DT lines and genetic mapping
which could be attributed to the difficulty in clearly assigning the polymorphic locus or in
a wrong placement on the genetic map. The EST-SSR loci were mainly distributed on the
distal ends of the chromosomes which was consistent with what is observed in our in silico
maps. Similar results were also reported in tomato (Areshchenkova and Ganal 2002) in rye
(Khlestkina et al 2004) and in wheat (Gao et al. 2004).
As a conclusion, wheat EST-SSRs markers exhibited some interesting features, different
from those of genomic SSRs. This makes them highly valuable as a source for marker
development as well as other applications.

Results and Discussion - Transferability
- 50 -
2 Transferability of the wheat EST-SSRs to grass species
This part was the subject of two manuscripts which were respectively published in
Theoretical and Applied Genetics (111: 677-687) and accepted for publication in Plant
Breeding. These papers deal with two of the scientific questions which were asked at the
beginning of the project and which concern the transferability of wheat EST-SSRs to
related species and the potential of these markers to serve as genomic tools for orphan
species and to reveal the diversity existing within these species.
2.1 High transferability of bread wheat EST-derived SSRs to other cereals
(2005, Theor Appl Genet 111: 677-687)


Results and Discussion - Transferability
- 51 -


Results and Discussion - Transferability
- 52 -


Results and Discussion - Transferability
- 53 -

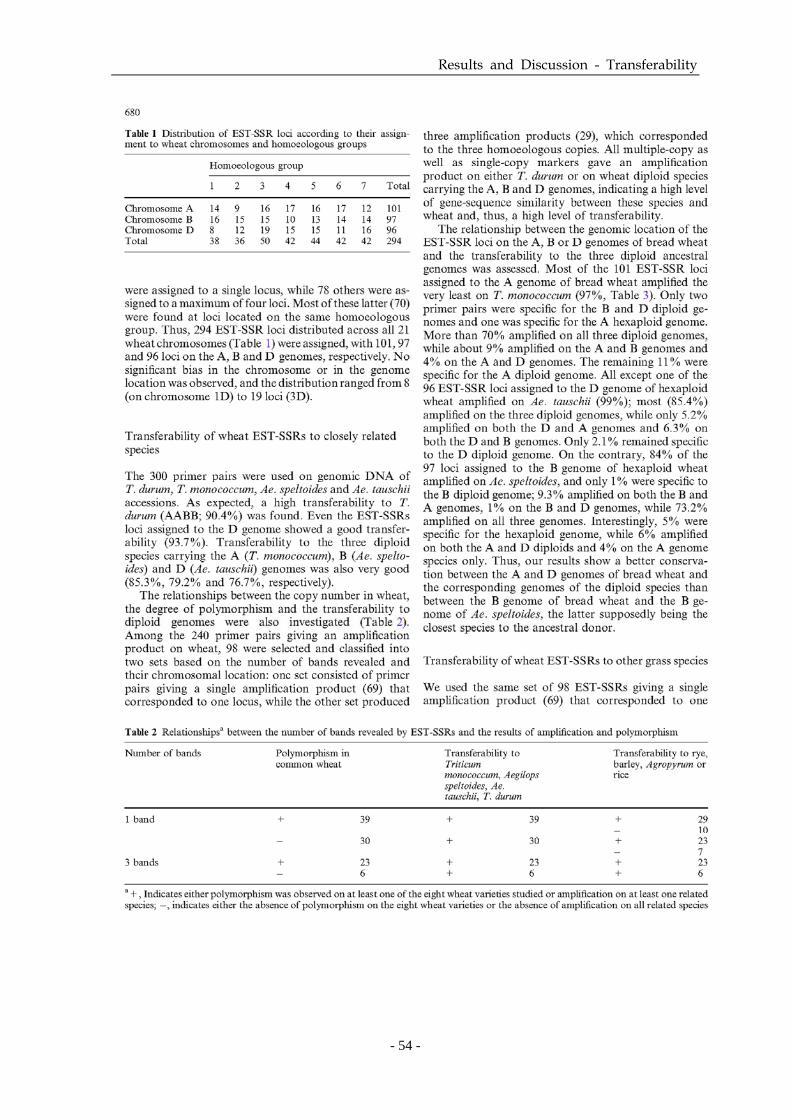
Results and Discussion - Transferability
- 54 -


Results and Discussion - Transferability
- 55 -


Results and Discussion - Transferability
- 56 -


Results and Discussion - Transferability
- 57 -


Results and Discussion - Transferability
- 58 -


Results and Discussion - Transferability
- 59 -


Results and Discussion - Transferability
- 60 -

Results and Discussion - Transferability
- 61 -


Results and Discussion - Grass species can be a reservoir of new alleles for wheat improvement
- 62 -
2.2 Wheat EST-SSRs for tracing chromosome segments from a wide range of grass specie (Plant Breeding, accepted)


Results and Discussion - Grass species can be a reservoir of new alleles for wheat improvement
- 63 -
Wheat EST-SSRs for tracing chromosome segments from a wide range
of grass species
ZHANG LY, BERNARD M, RAVEL C, BALFOURIER F, LEROY P, FEUILLET C, SOURDILLE P.
Zhang LY, Bernard M (), Ravel C, Balfourier F, Leroy P, Feuillet C, Sourdille P UMR
INRA-UBP Amélioration et Santé des Plantes, Domaine de Crouël, 234 Avenue du Brézet,
63100 Clermont-Ferrand, France
e-mail : [email protected]
Te: 33 4 73 62 43 07, Fax: 33 4 73 62 44 53
With: - 2 tables
- 2 supplementary data files


Results and Discussion - Grass species can be a reservoir of new alleles for wheat improvement
- 64 -
Abstract Transferability of 116 common wheat EST-SSR markers was investigated on 158
accessions representing 18 grass species to identify new alleles useful for wheat
improvement. Transferability among the Triticeae ranged from 73.7% for Ae. longissima to
100% for wheat sub species (T. compactum) but was also good for less related species such
as rye (72.8%) or maize (40.4%). On average, the number of alleles/locus detected by
EST-SSR markers was 3.1 on hexaploid wheat. The PIC values simultaneously estimated
for T. aestivum and T. durum were similar for the two species (0.40 and 0.39 respectively).
The allelic diversity within allogamous species was higher (0.352-0.423) compare to that
of T. aestivum and T. durum (0.108 and 0.093 respectively). T. aestivum and T. durum
shared the largest number of alleles (74.6%) while among the three ancestral diploid
species of bread wheat, Ae. tauschii had the highest percentage of common alleles with T.
aestivum (57.4%). These results indicate that grasses orphan species can be studied using
wheat EST-SSRs and can serve as a source of new alleles for wheat genetic improvement.
Key words Triticum – microsatellites – bread wheat – genetic diversity – markers – relatives


Results and Discussion - Grass species can be a reservoir of new alleles for wheat improvement
- 65 -
Introduction Significant advances in the understanding of the plant biology as well as in the
management and exploitation of genetic resources must be achieved to face increasing
human needs. Concerning genetic resources, genetic variability in grasses and especially in
wheat (Triticum aestivum L.) is extremely extended but remains largely underexploited.
This is primarily due to the poor knowledge of the capacities of these resources in terms of
biotic and abiotic resistances as well as their potential for quality or yield performances.
They are also bearing many traits of low agronomical interest such as large plant height,
lodging sensitivity, free threshing and hulled kernels which make the breeders reluctant to
use them because of the linkage drag of these negative traits. Moreover, these species are
often difficult to cross with wheat because of the presence of Kr genes (Lein 1943; Snape
et al. 1979; Falk and Kasha 1981). Only few recombinations are established between wheat
and alien chromosomes and it is almost impossible to evaluate the quantity of foreign DNA
introduced. We can suspect that the bad crossability and the low recombination will soon
be overcome with the positional cloning of the genes involved in these processes (Ph1, Kr,
SKr; G Moore, personal communication; M Bernard and C Feuillet, unpublished results).
However, the linkage drag and the evaluation of the sizes of the introgressions still remain
a problem since these phenomena depends on the power of the evaluation of these latter
and thus of the genotyping capacities available. It was demonstrated that cytogenetically
controlled introgressions of alien fragments of chromosomes in wheat may have a positive
effect on resistance to various traits as well as for yield or bread making quality (Jarwal et
al. 1996; Singh et al. 1998; Villareal et al. 1995, 1998; Hoisington et al. 1999; Kim et al.
2003; Reynolds et al. 2001, 2005).
At the present time, low attentions have been paid on the study of wheat related species
especially in genomic areas while genomics has exploded in wheat in the last five years
leading to better marker-assisted selection and to the positional cloning of a number of
genes of agronomic interest. The genomic efforts should primarily seek on the
development of molecular markers because they are easy to produce and to use and
because they are involved in all the further analyses including QTL detection, positional
cloning and diversity studies. In polyploid wheats, microsatellites also referred to as
Simple Tandem Repeats (SSRs) constitute the marker of choice because of their
co-dominant inheritance, their even distribution along the genome, their high
polymorphism level, their good reproducibility and their genome specificity (Plaschke et


Results and Discussion - Grass species can be a reservoir of new alleles for wheat improvement
- 66 -
al.1995; Röder et al. 1995, 1998; Bryan et al. 1997; Guyomarc’h et al. 2002a, b; Nicot et al.
2004). However, they are expensive to develop because it is needed to create and screen
enriched libraries, to sequence a lot of clones and to test numerous pairs of primers prior to
have a useful marker. In addition, because of their genome specificity, genomic SSRs
developed from wheat cannot be used on related species (Sourdille et al. 2001).
A new type of SSRs was recently developed from the large wheat EST collections
(599,989 ESTs; http://www.ncbi.nlm.nih.gov/dbEST; EST-SSRs) which were developed in
the past five years. Compared to the genomic SSRs derived from enriched genomic DNA
libraries (g-SSRs), EST-SSRs give better profiles (Holton et al. 2002; Gupta et al. 2003)
and recently, Zhang et al. (2005a) demonstrated that bread wheat EST-SSRs showed a high
level of transferability to close and wild relatives of wheat because they are mainly derived
from conserved coding regions. They can thus be used as a starting point for further
genomic studies on wheat-related orphan species such as Aegilops, Agropyron, Enhardia,
Elymus, Thynopyron or other Triticum species. Some of these species can be used to
derived synthetic wheats which have already been shown to possess a high genetic
diversity (Lage et al, 2003; Zhang et al, 2005b) as well as favorable qualitative (Kema et al,
1995; Ma et al. 1995; Lage et al, 2001; Mujeeb-Kazi et al. 2001) and quantitative traits
(Villareal et al. 2001).
In this paper, we report the results of the genetic study of 168 accessions from 18 different
species from the grass family representing 17 different genomes using a set of 116
EST-SSRs that we recently developed (Zhang et al., 2005a). The objectives of this study
were: (1) to evaluate the transferability of the EST-SSRs to these species; (2) to
characterize the allelic diversity on a set of accessions for each species; and (3) estimate
the EST-SSR PIC values within T. aestivum and T. durum species.
Materials and Methods
Plant Material A total of 168 accessions, representing 18 grass species and 17 genomes of the Triticeae
tribe were used (see electronically supplementary data). This included diploid and
polyploid species and autogamous as well as allogamous species. Between two and six
accessions for each species were randomly chosen among our collection except for T.
aestivum and T. durum where respectively 22 and 25 varieties were selected. Seeds were


Results and Discussion - Grass species can be a reservoir of new alleles for wheat improvement
- 67 -
mainly obtained from the Centre of Biological Resources on Cereal Crops
(INRA-Clermont-Ferrand), and from Jacques David (INRA Montpellier, tetraploid and
Aegilops species), and Philippe Barre (INRA Lusignan, Lolium species). For each species,
between five and ten seeds from self pollinated ears (when available or possible) were
sown for further DNA extraction.
DNA extraction, PCR amplification and SSR detection DNA was extracted from fresh leaves ground in liquid nitrogen using a CTAB protocol as
previously described (Tixier et al. 1998). A set of 116 EST-SSRs (Zhang et al., 2005a) was
selected (see electronically supplementary data) according to their ability to be transferable
to the studied species. PCR reactions using the M13 protocol were carried out as described
in Nicot et al. (2004) with an annealing temperature of 60°C for 30 cycles (30 sec 94°C, 30
sec 60°C, 30 sec 72°C) and 56°C for 8 cycles. Amplification products were visualized
using an ABI PRISM®3100 Genetic Analyzer (Applied Biosystems). Finally, fragment
sizes were calculated using GENESCAN and GENOTYPER softwares (Applied Biosystems),
where different alleles are represented by different amplification sizes for tandem repeats.
Two alleles are considered as identical when they show the same fragment size.
Estimation of PIC values and phylogenetic relationships Allelic polymorphism information content (PIC) values were calculated in each case using
the formula PIC= 1-∑ (Pi)2 , where Pi is the proportion of the population carrying the ith
allele, calculated for each SSR locus (Botstein et al. 1980). As an estimate of the genetic
diversity, the number of bands per locus and per individuals (NB) was computed as follows:
NB = (N x 100)/(116 x Transferability (%) x Number of individuals) where N is the total number
of bands observed for each species, 116 is the total number of EST-SSRs tested and
Transferability is the percentage of EST-SSRs that give an amplification product on related
species.
Results Because EST-SSRs are derived from coding sequences, they frequently amplified several
copies of the same gene in polyploid wheats resulting in the detection of multiple fragments.
In this study, 53% of the 116 EST-SSRs amplified more than one band in T. aestivum and T.
durum suggesting either the detection of homoeologous copies or duplication of the genes in

Table 1: Transferability of EST-SSRs from T.aestivum to related species. Transferability is
computed as the percentage of EST-SSRs giving an amplification product on at least one of the
accessions tested.
Species Sub-species Genome N of accessions Transferability
aestivum AABBDD 22 100%
spelta AABBDD 5 99.1%
compactum AABBDD 5 100%
T. aestivum sphaerococcum AABBDD 5 99.1%
macha AABBDD 5 99.1%
vavilovi AABBDD 5 99.1%
petropavlovskyi AABBDD 3 100%
carthlicum AABB 5 93.0%
dicoccum AABB 5 94.0%
T. turgidum dicoccoides AABB 5 94.7%
durum AABB 25 96.5%
polonicum AABB 5 87.7%
turgidum AABB 5 90.4%
monococcum AmAm 5 83.3%
T. monococcum boeoticum AbAb 5 83.3%
urartu AuAu 5 85.1%
Ae. speltoides SS 4 79.0%
Ae. searsii SsSs 2 74.6%
Ae. bicornis SbSb 2 80.0%
Ae. longissima SlSl 3 73.7%
Ae. tauschii DD 5 76.3%
Ae. umbellulata UU 2 77.2%
Ae. peregrina UUSvSv 2 78.1%
Ae. comosa subven MM 3 76.3%
Ae. ventricosa DDMvMv 3 82.5%
Hordeum vulgare HH 5 62.3%
Secale cereale RR 5 72.8%
Lolium perenne 6 43.0%
Avena sativa 5 58.8%
Zea mays 5 40.4%
Oryza sativa 5 30.1%
Brachypodium 2 43.9%

Results and Discussion - Grass species can be a reservoir of new alleles for wheat improvement
- 68 -
the genome. Among these, 70% revealed only one band in the diploid species indicating that
most of the fragments originated from homoeologous copies. When several bands were
detected in diploid species, this could be due either to the presence of several copies of the
genes or to a DNA mixture of heterogeneous varieties or to residual heterozygosity which
can be frequent, especially in allogamous species. For these latter species, 69.3% (79) of the
116 EST-SSRs gave more than one band and among these, 32.5% (37) gave only one band in
polyploid species. Only thorough sequence analyses of the different fragments and genetic
mapping could allow concluding about the different hypothesis. Concerning the 47% of the
EST-SSRs that amplified only one fragment in polyploid wheats, this suggests either that
they were specific of one copy or that they amplified different copies but of the same size.
Characterization of the transferability of wheat EST-SSRs on a large set of
species We studied the transferability of these EST-SSRs to the different species. Transferability
was considered as positive when an amplification product was detected on at least one of the
different accessions used for each species. Considering this set of markers, transferability
was complete (100%) for T. aestivum sub-species compactum and petropavlovskyi, and
almost complete (99.1%) for sub-species spelta, sphaerococcum, macha and vavilovi (Table
1). Similarly, an average of 92.7% of transferability was observed for the six tetraploid
subspecies. The highest value was observed for T. durum (96.5%) which was expected
since this species is closely related to T. aestivum. Similar values were observed for T.
carthlicum, T. dicoccum and T. dicoccoides (respectively 93%, 94% and 94.7%) suggesting
also close relationships. Lower values were noticed for T. turgidum (90.4%) and T.
polonicum (87.7%) indicating a larger divergence between these two species and bread
wheat.
For the ancestral diploid species of hexaploid wheat, the transferability ranged from 76.3%
for Ae. tauschii (DD) to 85.1.3% for T. urartu (AuAu), with an average of 83.9% (Table 1).
A higher value was expected for Ae. tauschii since this species is known to be the donor of
the D genome of hexaploid wheat, an event which occurred only recently (8,000 years ago).
Thus, sequences should have diverged only weakly. For the species bearing the S genome
which is supposed to be close to the B genome of bread wheat, transferability varied from
73.7% for Ae. longissima to 80% for Ae. bicornis. Ae. speltoides also exhibited a high
value (79%) confirming that it can be considered as a good candidate for B genome donor
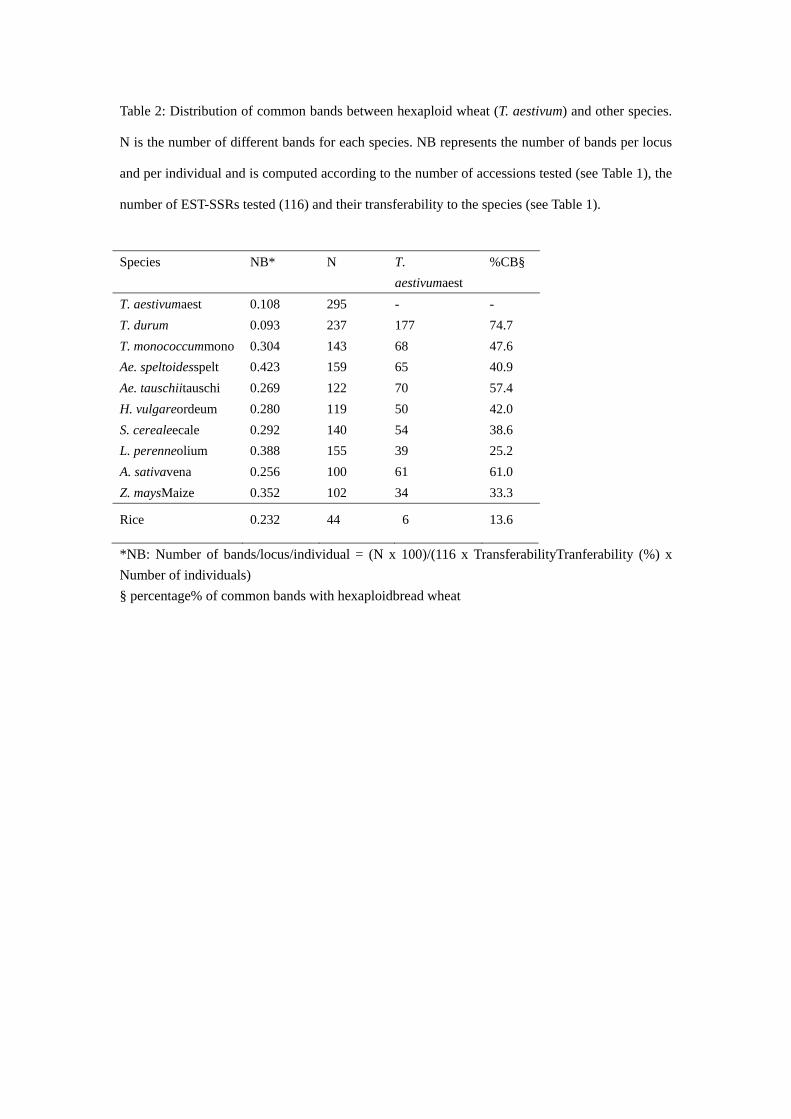
Table 2: Distribution of common bands between hexaploid wheat (T. aestivum) and other species.
N is the number of different bands for each species. NB represents the number of bands per locus
and per individual and is computed according to the number of accessions tested (see Table 1), the
number of EST-SSRs tested (116) and their transferability to the species (see Table 1).
Species NB* N T. aestivumaest
%CB§
T. aestivumaest 0.108 295 - - T. durum 0.093 237 177 74.7 T. monococcummono 0.304 143 68 47.6 Ae. speltoidesspelt 0.423 159 65 40.9 Ae. tauschiitauschi 0.269 122 70 57.4 H. vulgareordeum 0.280 119 50 42.0 S. cerealeecale 0.292 140 54 38.6 L. perenneolium 0.388 155 39 25.2 A. sativavena 0.256 100 61 61.0 Z. maysMaize 0.352 102 34 33.3
Rice 0.232 44 6 13.6
*NB: Number of bands/locus/individual = (N x 100)/(116 x TransferabilityTranferability (%) x Number of individuals) § percentage% of common bands with hexaploidbread wheat

Results and Discussion - Grass species can be a reservoir of new alleles for wheat improvement
- 69 -
species. For the A genome species, transferability was similar between the three sub
species (T. monococcum 83.3%; T. boeoticum, 83.3%; T. urartu 85.1%) but was the highest
for T. urartu indicating that this sub species was closer to T. aestivum. The transferability to
other wild relatives of common wheat was also high ranging from 76.3% for Ae. comosa to
82.5% for Ae. ventricosa. This indicates that EST-SSRs can be very useful to study these
species for which no genomic tools were previously developed.
We also analyzed the transferability to less related grass species but which are more or
even largely studied (Table 1). It was found to be good with rye (Secale cereale, 72.8%),
barley (Hordeum vulgare, 62.3%) and oat (Avena sativa, 58.8%). For rye-grass (Lolium
perenne) and maize (Zea mays), transferability was respectively of 43% and 40.4%. For
Brachypodium, about 44% of the EST-SSRs were transferable which confirmed that this
species can be used as a model, especially for marker development (G. Moore, personal
communication).
Globaly, we can conclude that transferability of EST-SSRs across a wide range of grass
species was good indicating that they can be used either as genomic tools for orphan
species or for comparative studies for cultivated crops.
Analysis of the allelic diversity within species Polymorphism information content (PIC) values which provide an estimate of the
discriminatory power of each EST-SSR locus were computed for T. aestivum and T. durum
using respectively 60 and 52 EST-SSRs. For each species, EST-SSRs were chosen
according to their ability of revealing polymorphism and to the absence of missing data.
For T. aestivum, PIC values ranged from 0.08 to 0.80 (average 0.40 ± 0.20) which was
similar to what was observed for T. durum (0.09 to 0.80; average 0.39 ± 0.19). For these
two species, 355 bands were detected from the 116 amplified EST-SSRs (average 3.1
bands/locus). The primer pair CFE300 detected the largest number of bands (13) while the
primer pair CFE264 detected the lowest number (2). We can conclude from this that
EST-SSRs are polymorphic enough to serve as molecular markers in wheat.
The total number of bands was computed for 11 species, including T. aestivum and T.
durum, the three ancestral diploid species of bread wheat and six members of the grass
family (Table 2). For each of these species, we calculated the mean number of bands per
locus and per accession (NB) which can be considered as representative of the genetic


Results and Discussion - Grass species can be a reservoir of new alleles for wheat improvement
- 70 -
diversity of the species. This value was corrected according to the transferability of the
EST-SSRs for each species to take into account only markers giving amplification products
(see M&Ms). Ae. speltoides showed the highest NB value (0.423) followed by Lolium,
maize and T. monococcum species (respectively 0.388, 0.352 and 0.304) suggesting a high
level of genetic diversity within these species. For the three formers, this can be explained
by the fact that these are allogamous species. On the contrary, T. aestivum and T. durum
exhibited the lowest values (0.108 and 0.093 respectively) indicating lower genetic
diversity. As expected and except for maize, widely cultivated species (wheat and barley)
exhibited lower genetic diversity compare to wild species such as Ae. speltoides, T.
monococcum and Ae. tauschii. This confirmed that breeding contributed to the reduction of
the diversity within cultivated species.
The percentages of common bands between species were also investigated (Table 2). T.
aestivum and T. durum shared the highest percentage of common bands (74.6%) indicating
a recent common ancestral origin. Among the three ancestral diploid species of bread
wheat, Ae. tauschii had the highest percentage of common bands with T. aestivum (57.4%),
followed by T. monococcum (47.6%) and Ae. speltoides (40.9%). This suggests that the A
and D genome donors showed a better conservation with the corresponding genomes of
common wheat while the B genome of wheat was less related to the B genome of Ae.
speltoides. Among the other grass species, T. aestivum showed almost the same percentage
of common bands with rye, oat and rye-grass (average 39%) while the percentages were
higher for barley (43.5%) and lower for maize (33%) confirming that this latter species is
less related to wheat. These results clearly suggest that the wild related species can serve as
a source of new alleles for cultivated species such as wheat providing that they can easily
be crossed with wheat and that recombination can occur between homologous
chromosomes which is the case with T. monococcum, Ae. speltoides and Ae. tauschii.
Discussion Bread wheat EST-SSRs were tested to evaluate their transferability on a larger set of grass
species (18) compared to our previous work (eight; Zhang et al., 2005a) and to characterize
their allelic diversity. We expected the transferability to be complete for all T. aestivum sub
species while it was very high but not complete for T. spelta, sphaerococcum, macha and
vavilovi. In each case, one SSR did not give any amplification product on the five accessions

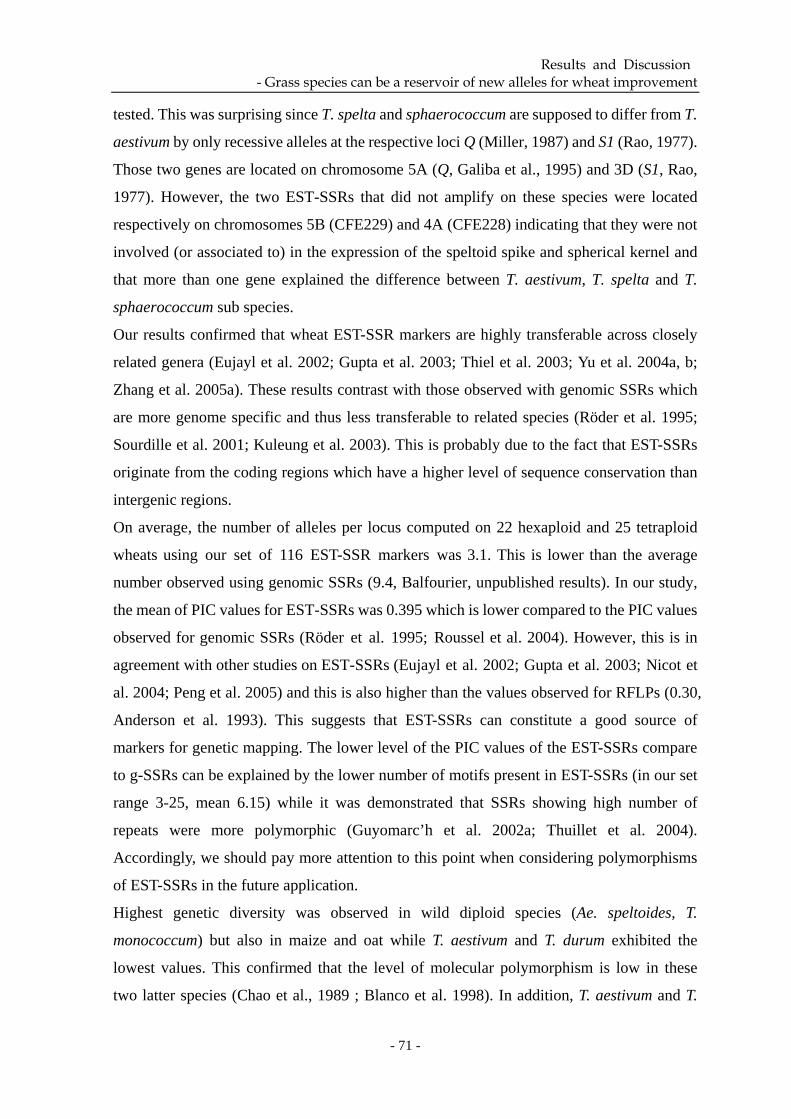
Results and Discussion - Grass species can be a reservoir of new alleles for wheat improvement
- 71 -
tested. This was surprising since T. spelta and sphaerococcum are supposed to differ from T.
aestivum by only recessive alleles at the respective loci Q (Miller, 1987) and S1 (Rao, 1977).
Those two genes are located on chromosome 5A (Q, Galiba et al., 1995) and 3D (S1, Rao,
1977). However, the two EST-SSRs that did not amplify on these species were located
respectively on chromosomes 5B (CFE229) and 4A (CFE228) indicating that they were not
involved (or associated to) in the expression of the speltoid spike and spherical kernel and
that more than one gene explained the difference between T. aestivum, T. spelta and T.
sphaerococcum sub species.
Our results confirmed that wheat EST-SSR markers are highly transferable across closely
related genera (Eujayl et al. 2002; Gupta et al. 2003; Thiel et al. 2003; Yu et al. 2004a, b;
Zhang et al. 2005a). These results contrast with those observed with genomic SSRs which
are more genome specific and thus less transferable to related species (Röder et al. 1995;
Sourdille et al. 2001; Kuleung et al. 2003). This is probably due to the fact that EST-SSRs
originate from the coding regions which have a higher level of sequence conservation than
intergenic regions.
On average, the number of alleles per locus computed on 22 hexaploid and 25 tetraploid
wheats using our set of 116 EST-SSR markers was 3.1. This is lower than the average
number observed using genomic SSRs (9.4, Balfourier, unpublished results). In our study,
the mean of PIC values for EST-SSRs was 0.395 which is lower compared to the PIC values
observed for genomic SSRs (Röder et al. 1995; Roussel et al. 2004). However, this is in
agreement with other studies on EST-SSRs (Eujayl et al. 2002; Gupta et al. 2003; Nicot et
al. 2004; Peng et al. 2005) and this is also higher than the values observed for RFLPs (0.30,
Anderson et al. 1993). This suggests that EST-SSRs can constitute a good source of
markers for genetic mapping. The lower level of the PIC values of the EST-SSRs compare
to g-SSRs can be explained by the lower number of motifs present in EST-SSRs (in our set
range 3-25, mean 6.15) while it was demonstrated that SSRs showing high number of
repeats were more polymorphic (Guyomarc’h et al. 2002a; Thuillet et al. 2004).
Accordingly, we should pay more attention to this point when considering polymorphisms
of EST-SSRs in the future application.
Highest genetic diversity was observed in wild diploid species (Ae. speltoides, T.
monococcum) but also in maize and oat while T. aestivum and T. durum exhibited the
lowest values. This confirmed that the level of molecular polymorphism is low in these
two latter species (Chao et al., 1989 ; Blanco et al. 1998). In addition, T. aestivum and T.


Results and Discussion - Grass species can be a reservoir of new alleles for wheat improvement
- 72 -
durum shared a high number of bands while the three ancestral diploid species of bread
wheat (T. monococcum, Ae. speltoides, Ae. tauschii) had on average less than one half of
common bands with these two species. In addition, allogamous species such as Ae.
speltoides, rye-grass and maize showed highest diversity compare to autogamous species.
Similar results were observed by Wang et al. (2005) who noticed that the level of
polymorphism was significantly higher among species than within species and was related
to the degree of out-crossing for each species. Polymorphism ranged from 57% for
self-incompatible species to 20% for self-pollinated species. Our results suggest that the
wild ancestral species may serve as sources of new alleles for cultivated wheats. This can
be done by creating new synthetic wheats which can be used in breeding programs to
develop new progenitors with enhanced capacities for stress tolerance useful in the view of
a more sustainable agriculture. Previous studies of synthetic derived wheats have already
revealed an increased diversity in the synthetics using AFLP (Lage et al, 2003) and SSR
markers (Zhang et al, 2005b). It has also been proven that these synthetic wheats possess
favorable qualitative (Kema et al, 1995; Ma et al. 1995; Lage et al, 2001; Mujeeb-Kazi et
al. 2001) as well as quantitative traits (Villareal et al. 2001). However, they also carry a
large number of unfavorable alleles and they thus need to be backcrossed to elite cultivars
to produce agronomically acceptable progenitors.
As a conclusion, common wheat EST-SSRs showed a high level of transferability to
numerous grass species including Pooideae species (oats, barley, wheats, rye) as well as
Panicoideae species (maize). They can thus be used as a starting point for genomic studies
of orphan wild wheat-related species in order to exploit these latter as reservoir of new
alleles for wheat genetic improvement.
Acknowledgements
The authors thank gratefully G Gay and A Loussert for growing the plants and P Barre, P
Barret and J David for providing with rye-grass, maize and T. turgidum sub species
respectively. G Boutet and C Pont are also greatly acknowledged for their help in
managing the robotics of the genotyping platform. This work was funded by the China
Scholarship Council (CSC). All these experiments comply with the current laws of France.


Results and Discussion - Grass species can be a reservoir of new alleles for wheat improvement
- 73 -
References Anderson, J. A., G. A. Churchill, J. E. Autrique, S. D. Tanksley, and M. E. Sorrells, 1993: Optimizing parental selection
for genetic linkage maps. Genome 36: 181-186
Blanco A., M. P. Bellomo, A. Cenci, C. De Giovanni, R. D'Ovidio, E. Iacono, B. Laddomada, M. A. Pagnotta, E.
Porceddu, and A. Sciancalepore, 1998: A genetic linkage map of durum wheat. Theor. Appl. Genet. 97: 721-728
Botstein D., R. L. White, M. Skolnick, and R. W. Davis, 1980: Construction of a genetic linkage map in man using
restriction fragment length polymorphisms. Am J Hum Genet 32: 314-331
Bryan G. J., A. J. Collins, P. Stephenson, A. Orry, J. B. Smith, and M. D. Gale, 1997: Isolation and characterisation of
microsatellites from hexaploid bread wheat. Theor Appl Genet 94: 367-377
Chao S., P. J. Sharp, A. J. Worland, E. J. Warham, R. M. D. Koebner,and M. D. Gale, 1989: RFLP-based genetic maps of
wheat homoeologous group 7 chromosomes. Theor. Appl. Genet. 78: 495-504.
Eujayl I., M. E. Sorrells, M. Baum, P. Wolters, and W. Powell, 2002: Isolation of EST-derived microsatellite markers for
genotyping the A and B genomes of wheat. Theor Appl Genet 104: 399-407
Falk D. E., and K. J. Kasha, 1981: Comparison of the crossability of rye, Secale cereale: and Hordeum bulbosum onto
wheat, Triticum aestivum: Can J Genet Cytol 23:81-88
Galiba G., S. A. Quarrie, J. Sutka, A. Morgounov, and J. W. Snape, 1995: RFLP mapping of the vernalization, Vrn1: and
frost resistance, Fr1: genes on chromosome 5A of wheat. Theor Appl Genet 90: 1174-1179
Gupta P. K., S. Rustig, S. Sharma, R. Singh, N. Kumar, and H. S. Balyan, 2003: Transferable EST-SSR markers for the
study of polymorphism and genetic diversity in bread wheat. Mol Gen Genomics 270: 315-323
Guyomarc’h H., P. Sourdille, G. Charmet, K. J. Edwards, and M. Bernard, 2002a: Characterisation of polymorphic
microsatellite markers from Aegilops tauchii and transferability to the D-genome of bread wheat. Theor Appl
Genet 104: 1164-1172
Guyomarc’h H., P. Sourdille, K. J. Edwards, and M. Bernard, 2002b: Studies of the transferability of microsatellites
derived from Triticum tauschii to hexaploid wheat and to diploid related species using amplification,
hybridization and sequence comparisons. Theor Appl Genet 105: 736-744
Hoisington D., M. Khairallah, T. Reeves, J. M. Ribaut, B. Skovmand, S. Taba, and M. Warburton, 1999: Plant genetic
resources: What can they contribute toward increased crop productivity? Proc Natl Acad Sci USA 96:
5937-5943
Holton T. A., J. T. Christopher, L. McClure, N. Harker, and R. J. Henry, 2002: Identification and mapping of
polymorphic SSR markers from expressed gene sequences of barley and wheat. Molecular Breeding 9: 63-71
Jarwal S. D., I. D. Jolly, and A. K. Kenneth-Smith, 1996: The salt-tolerant grasses puccinellia, Puccinellia spp.: and tall
wheat grass, Agropyron elongatum:: a literature survey of their salt tolerance, establishment, water use, and
productivity. Technical Memorandum - Division of Water Resources, Institute of Natural Resources and
Environment, CSIRO pp13
Kema G. H. J., W. Lange, and C. H. Silfhout, 1995: Differential suppression of stripe rust resistance in synthetic wheat
hexaploids derived from Triticum turgidum subsp. dicoccoides and Aegilops squarrosa. Phytopathology 85:
425-429.
Kim W., J. W. Johnson, R. A. Graybosch, and C. S. Gaines, 2003: The effect of T1DL.1RS wheat-rye chromosomal
translocation on agronomic performance and end-use quality of soft wheat. Cereal Research Communications.
31: 301-308.
Kuleung C., P. S. Baenziger, and I. Dweikat, 2003: Transferability of SSR markers among wheat, rye and triticale. Theor
Appl Genet 108:1147-1150


Results and Discussion - Grass species can be a reservoir of new alleles for wheat improvement
- 74 -
Lage J., B. Skovmand, and S. B. Andersen, 2001: Field evaluation of Russian wheat aphid, Homoptera: Aphididae:
resistance in Triticum dicoccum derived synthetic hexaploid wheats. Abstract, Annual meeting, ESA, San Diego,
USA, December 2001.
Lage J., M. L. Warburton, J. Crossa, B. Skovmand, and S. B. Andersen., 2003: Assessment of genetic diversity in
synthetic hexaploid wheats and their Triticum dicoccum and Aegilops tauschii parents using AFLPs and
agronomic traits. Euphytica 134:305-317.
Lein A., 1943: Die Genetische Grundlage der Kreuzbarkeit zwischen Weizen und Roggen. Indukt Abstamm und Vererb
Lehre 81: 28-61
Ma H., R. P. Singh, and A. Mujeeb-Kazi, 1995: Resistance to stripe rust in Triticum turgidum, T. tauschii and their
synthetic hexaploids. Euphytica 82:117-124.
Miller T. E., 1987: Systematics and evolution. In Wheat breeding, its scientific basis. Lupton FGH, ed: London, New
York Chapman and Hall. pp 1-30
Mujeeb-Kazi A., A. Cortes, V. Rosas, S. Cano, J. Sanchez, L. Juarez, and R. Delgado, 2001: Genetic diversity for
improving scab resistance in wheat. Proc of the Warren E Kronstad symp CIMMYT, Mexico. Pp126-129.
Nicot N., V. Chiquet, B. Gandon, L. Amilhat, F. Legeai, P. Leroy, M. Bernard, and P. Sourdille, 2004: Study of simple
sequence repeat, SSR: markers from wheat expressed sequence tags, ESTs: Theor Appl Genet 109: 800-805
Plaschke J., M. Ganal, and M. Röder, 1995: Detection of genetic diversity in closely related bread wheat using
microsatellite markers. Theor Appl Genet 91: 1001-1007
Peng H. J., and N. V. Lapitan, 2005: Characterization of EST-derived microsatellites in the wheat genome and
development of eSSR markers. Funct Integr Genomics 5: 80-96
Rao M. V. P., 1977: Mapping of the Sphaerococcum gene ‘S’ on chromosome 3D of wheat. Cereal Research
Communication 5: 15-17
Reynolds M. P., D. F. Calderini, A. G. Condon, S. Rajaram, and Z. Bedo, 2001: Physiological basis of yield gains in wheat
associated with the Lr19 translocation from Agropyron elongatum. Euphytica 119: 137-141
Reynolds M. P., A. Pellegrineschi, B. Skovmand, 2005: Sink-limitation to yield and biomass: a summary of
some investigations in spring wheat. Annals of Applied Biology 146: 39-49.
Röder M. S., J. Plaschke, S. U. König, A. Börner, M. E. Sorrells, S. D. Tanksley, and M. W. Ganal, 1995: Abundance,
variability and chromosomal location of microsatellites in wheat. Mol Gen Genet 246: 327-333
Röder M. S., V. Korsun, K. Wendehake, J. Plaschke, M. H. Tixier, P. Leroy, and M. W. Ganal, 1998: A microsatellite
map of the wheat genome. Genetics 149: 2007-2023
Roussel V., J. Koenig, M. Beckert, and F. Balfourier, 2004: Molecular diversity in French bread wheat accessions related
to temporal trends and breeding programmes. Theor Appl Genet 108: 920-930
Singh R. P., J. Huerta-Espino, S. Rajaram, and J. Crossa, 1998: Agronomic effects from chromosome translocations
7DL.7Ag and 1BL.1RS in spring wheat. Crop Sci 38: 27-33
Snape J. W., V. Chapman, J. Moss, C. E. Blanchard, and T. E. Miller, 1979: The crossability of wheat varieties with
Hordeum bulbosum. Heredity 42:291-298
Sourdille P., M. Tavaud, G. Charmet, and M. Bernard, 2001: Transferability of wheat microsatellites to diploid Triticeae
species carrying the A, B and D genomes. Theor Appl Genet 103: 346-352
Thiel T., W. Michalek, R. K. Varshney, and A. Graner, 2003: Exploiting EST databases for the development and
characterization of gene-derived SSR-markers in barley, Hordeum vulgare: Theor Appl Genet 106:411-422
Thuillet A. C., T. Bataillon, P. Sourdille, and J. David, 2004: Factors affecting polymorphism at microsatellite loci in
bread wheat, Triticum aestivum L. Thell:: effects of mutation processes and physical distance from the
centromere. Theor Appl Genet 108: 368-377


Results and Discussion - Grass species can be a reservoir of new alleles for wheat improvement
- 75 -
Tixier, M. H., P. Sourdille, G. Charmet, G. Gay, C. Jaby, T. Cadalen, S. Bernard, P. Nicolas, and M. Bernard, 1998:
Detection of QTLs for crossability in wheat using a doubled-haploid population. Theor Appl Genet 97:
1076-1082
Villareal RL, Toro E, Mujeeb-Kazi A, Rajaram S, 1995: The 1BL/1RS chromosome translocation effect on yield
characteristics in a Triticum aestivum L. cross. Plant Breeding 114: 497-500
Villareal R. L., O. Banuelos, A. Mujeeb-Kazi, and S. Rajaram, 1998: Agronomic performance of chromosomes 1B and
T1BL.1RS near-isolines in the spring bread wheat Seri M82. Euphytica 103: 195-202
Villareal R. L., K. Sayre, O. Banuelos, and A. Mujeeb-Kazi, 2001: Registration of four synthetic hexaploid wheat,
Triticum turgidum/Aegilops tauschii: germplasm lines tolerant to waterlogging. Crop Sci 41: 274.
Wang M. L., N. A. Barkley, J. K. Yu, R. E. Dean, M. L. Newman, M. E. Sorrells, and G. A. Pederson, 2005: Transfer of
simple sequence repeat, SSR: markers from major cereal crops to minor grass species for germplasm
characterization and evaluation. Plant Genetic Resources 3: 45-57
Yu J. K., M. La Rota, R. V. Kantety, and M. E. Sorrells, 2004a: EST derived SSR markers for comparative mapping in
wheat and rice. Mol Gen and Genomics 271(6::742-51
Yu J. K., T. M. Dake, S. Singh, D. Benscher, W. L. Li, B. Gill, and M. E. Sorrells, 2004b: Development and mapping of
EST-derived simple sequence repeat markers for hexaploid wheat. Genome 47:805-818
Zhang L. Y., M. Bernard, P. Leroy, C. Feuillet, and P. Sourdille, 2005a: High transferability of bread wheat EST-derived
SSRs to other cereals. Theor Appl Genet 111: 677-687
Zhang P., S. Dreisigacker, A. E. Melchinger, M. van Ginkel, D. Hoisington, and M. L. Warburton, 2005b: Quantifying
novel sequence variation in CIMMYT synthetic hexaploid wheats and their backcross-derived lines using SSR
markers. Molecular Breeding 15: 1-10.


Results and Discussion - Grass species can be a reservoir of new alleles for wheat improvement
- 76 -
2.3 Comments and perspectives
This work allows proposing some conclusions concerning the transferability of the wheat
EST-SSRs and their exploitation for genomic studies in orphan species. First, this type of
marker was proven highly transferable to wild wheat relatives. Second, these species are
only poorly studied while we demonstrated that they might constitute a huge source of new
variability for bread wheat improvement. It would be now interesting to try to introduce
some new alleles at relevant genes such as biotic as well as abiotic resistance genes issued
from these species within the elite wheat germplasm and look if this leads to an
improvement of the introgressed lines. Introgressions would be easily followed and
reduced using EST-SSRs.


Results and Discussion -Transferability of EST-SSRs between rice and wheat
- 77 -
3 Transferability of EST-SSRs between rice and wheat
3.1 Transferability from bread wheat to rice In the first study (Zhang et al. 2005), the transferability of wheat EST-SSRs to rice was
estimated to be 28.3%. However, when five accessions of rice are tested, the transferability
is increased and reached 30.1% of wheat EST-SSRs that are transferable to at least one rice
accession. Among these latter, 60% gave an amplification product on at least two rice
accessions. In order to investigate the syntenic relationships between wheat and rice
chromosomes, the EST-SSRs were first assigned to wheat chromosomes and we surveyed
their location on rice chromosome by blasting wheat EST bearing SSRs against the 12 rice
pseudo-molecules. Our results were consistent with the known structural relationships
between wheat and rice genomes as revealed by previous studies (Devos and Gale. 1997;
Sorrells et al. 2003). For example, wheat ESTs bearing SSRs matching sequences on rice
chromosome 1 (R1) were largely from wheat homoeologous group 3, whereas R2 and R3
were generally related to wheat homoeologous groups 6 and 4, respectively.
As a conclusion, wheat EST-SSRs show quite a high level of transferability to rice. Wheat
ESTs containing SSRs also demonstrated the structural relationships between wheat and
rice genomes. Therefore, SSRs derived from bread wheat can be used in comparative
genomics involving rice and wheat.
3.2 Transferability from rice to bread wheat The recent sequencing of the rice (Oryza sativa) genome (IRGSP, 2005;
http://rgp.dna.affrc.go.jp/IRGSP/) has provided thousands of potentially new markers in
order to increase the grass map densities. However, not all the markers can be easily
transferred from rice to wheat and only genes are well conserved between the two species.
The markers should thus be derived from low-copy sequences, which are unfortunately
less polymorphic than the others. This is why rice EST-SSRs can be of main interest to
saturate wheat genetic maps. At the UMR INRA-UBP, we recently decided to focus our
efforts on the establishment of the physical map of chromosome 3B (Safar et al. 2004,
Feuillet et al. unpublished results). This chromosome bears numerous genes involved in a
lot of important traits such as grain yield and seed weight (Berke et al. 1992a,b), kernel
color (Sears 1944; Metzger and Silbaugh 1970; Nelson et al. 1995), chromosome pairing
(Sears 1982; Dong et al. 2002), seed dormancy (Osa et al. 2003), numerous resistance
genes (Mcintosh et al. 1977; Hare and Mcintosh 1979; Ma and Hughes 1995; Liu and
Anderson et al, 2003) and isozymes (Hart et al. 1993; Mcintosh et al. 1998). In order to


Results and Discussion -Transferability of EST-SSRs between rice and wheat
- 78 -
anchor accurately the physical map to the genetic map, we thus need to develop more
molecular markers. Despite the fact that it is the largest among the wheat chromosomes
(Dvorak et al. 1984; Gill et al. 1991), comparisons with chromosomes related to wheat
group 3 from other species such as chromosome 1 from rice indicated that this group is the
best conserved in gene content and order (Gale and Devos 1998; Sorrells et al. 2003; La
Rota and Sorrells 2004).
Therefore, the purposes of this part were (a) to investigate the characteristics and the
diversity of the SSRs issued from genes located on rice chromosome 1; (b) to develop rice
EST-SSR markers from the distal region of the long arm of rice chromosome 1 and to
study their transferability to wheat and its close and wild relatives; (c) to assign amplifying
primer pairs to chromosomes by using nulli-tetrasomic (NT) lines to confirm the syntenic
relationships with wheat homoeologous group 3 and to investigate their potential for
comparative mapping.
3.3 Analysis of rice EST-SSRs
3.3.1 Characteristics of SSRs in genes on rice chromosome 1
In the study of rice EST-SSRs, 12,078 perfect and imperfect SSRs were identified from
4,100 genes containing SSRs on rice chromosome 1. Like in wheat ESTs, the trinucleotide
repeats were the most common (60%) in rice chromosome 1 genes in CDS as well as in
introns, (CCG)n motif being the most abundant. Concerning the other types of motifs, AC
dinucleotide was the most frequent in whole genes and in introns, while CG was more
abundant in CDS. In addition, four-repeat motifs occurred as frequently in the whole genes,
CDS and introns.
3.3.2 Amplification of rice EST-SSRs on rice
Among the 4,100 genes containing SSRs, 200 were randomly selected in two well
conserved regions between rice chromosome 1 and homoeologous group 3 of wheat. A
total of 332 SSRs were found among which 170 were located in CDS and 162 in introns.
From the CDS sequences with SSRs, primers were designed for 106 EST-SSRs among
which 102 gave an amplification product on rice (96%).
On rice, some differences were observed between the expected and the observed size of the
amplification product. Among the 102 primer pairs, four (3.9 %) gave an amplification
product smaller than expected, suggesting (1) the occurrence of deletions within the

Table 3-3: Chromosomal assignment on wheat NT lines for 18 EST-SSRs derived from rice chromosome 1
Marker Motif Repeat Forward primer Reserve primer Chromosome
cfr5 cctccg 4.2 GGTCGGGATGTACCAGCA TGAACGCCTCGAACAGCC 1B, 6B
cfr17 cag + cag 4+4 TCGCAGTCAGTCGGGAGC GCCTGGCTTGTAGCTGTAATC 3D
cfr20 gcc 7 GACAGGAAGGTGTCGTGC GGATGGTTATCGACTCCG 3B, 3D
cfr22 cggcga 4 GCGGTGCTCTGGGTGAGG GACGGCGTCTCCTCGATC 1B, 3A
cfr35 cgc 6 CTCGCCGTGTTCCTCCAC CGCCCTGTACGTCTCGCT 7A, 7B
cfr37 gcg 4 CGGAGCAGATGAGGGAGATC CACCGCTCGACGACGAG 1D
cfr39 ggc 4 CCACAAGCTCCTCCCGTT CGAACACGCACTGGAAGTAC 3A, 3B
cfr46 gtc 4 CCTCATCGACGCCACGTAC CGAAGACGCACGACTTGC 3B, 3D
cfr52 gtc 4 ATGGACGTGGAGAAGGTGG CAGAAGAAAGACAGGCAGGG 2AL, 6B, 7B
cfr60 gaa+agc 4+5 GGATCAGGCTCCTCCTCG CAGCCGCAGCTCCTTCAT 3A, 3B
cfr68 cca 4 GAGTCCCTCCCCTTCTCCCT CGAATGCGAATGCGGATG 3D
cfr75 tga 4 GGTGCTTTCGATGGTGTTC ATCCCAAGGCTCCATAAG 5B, 7A
cfr79 cga 4 CGACCAGGAAATGTGGCG CGATGTCCACGAGGCTCC 3A, 3B
cfr88 aga 3 GCAGGTAGAGGAGAGGATGATG ATGAGCGGCTCCGACATG 1D, 4A, 4B
cfr93 acg 4 GGAGCAGCGGATGAACAG GGACTCCATCAGCCACCG 1A
cfr97 gccgac 4 CCCACCAACGACTTCAAC AAGGAGCAGACGAAGTGC 1A, 1B
cfr11 gcg 5 GAGCCAAAGCCAAAGCCC GCTACCGCACCCAGTCCT not assigned
cfr36 acg 5 CTCTCGGTGACCCGCTGT GAGCCACGCCAAGCACTC too complex

Results and Discussion -Transferability of EST-SSRs between rice and wheat
- 79 -
genomic sequences; (2) a lack of specificity of some primer pairs which may have
amplified a different copy belonging to the same multigenic family; (3) a slight variation
between the amplified copy and the consensus sequence. Only one primer pair (CFR35)
yielded two products: one band was consistent with expected product length while the
other was larger, suggesting the possible simultaneous amplification of a different copy of
the same gene during the PCR.
3.3.3 Transferability of rice EST-SSRs
The transferability was investigated from rice to T. aestivum (eight common wheat
varieties), T. durum, T. monococcum, Ae. speltoides, Ae. tauschii, Secale cereale, Hordeum
vulgare, and Agropyrum elongatum. Concerning the eight common wheat lines, 45 (44%)
out of 102 primer pairs gave one product in at least one cultivar and 29 (28.4%) amplified
in at least two cultivars. Eighteen (17.6%) amplified in all eight cultivars among which, 15
were trinucleotide repeats, while the remaining three were hexanucleotide repeats. For
transferability from rice to other species, similar results were observed for T. durum
(AABB), T. monococcum (AA) and Ae. speltoides (BB) where transferability on most of
the cultivars tested account for about 18%. For the other species, 13.7% and 14.7% of rice
EST-SSRs were transferable to Ae. tauschii (DD) and rye (RR) respectively while lower
levels of transferability were found for barley (8.8%) and Agroprum elongatum (6.9%).
3.3.4 Assignment to wheat chromosomes
The 18 primer pairs that yielded products in almost all common wheat cultivars were used
to test on Chinese Spring aneuploid lines. Overall, 16 markers were assigned to wheat
chromosomes. The two remainings were not assigned because: one gave too complex
profiles to be properly assigned; another amplified a product in all NT and DT lines
suggesting different products of the same size on at least two of the three homoeologous
chromosomes. Among the 16 markers, four were assigned to a single locus while the 12
others were assigned to a maximum of three loci. Most of them (8) were found at loci
located on the same homoeologous group (Table 3-3). The 29 EST-SSR loci were assigned
to wheat chromosomes, 10, 14 and 5 loci being placed on the A, B and D genomes
respectively. No locus was found on chromosomes 2B, 2D, 4D, 5A, 5D, 6A, 6D and 7D.
The distribution on other chromosomes ranged from 1 locus on chromosome 2A, 4A, 4B,
and 5B to 5 loci on chromosome 3B. According to the syntenic relationships between

Table 3-4: Distribution of rice EST-SSR loci according to their assignment to wheat chromosomes and homoeologous groups
Homoeologue group 1 2 3 4 5 6 7 Total
chromosome A 2 1 4 1 0 0 2 10
chromosome B 3 0 5 1 1 2 2 14
chromosome D 1 0 4 0 0 0 0 5
Total 6 1 13 2 1 2 4 29

Results and Discussion -Transferability of EST-SSRs between rice and wheat
- 80 -
wheat homoeologuous group 3 and rice chromosome 1, the marker derived from rice
chromosome 1 should have been assigned to group 3 chromosomes of wheat. In our study,
8 out of 16 assigned rice markers were located on wheat chromosomes 3A, 3B, and 3D and
overall, 13 loci were found on wheat homoeologuous group 3 chromosomes with no
significant bias observed, 4, 5 and 4 loci being located on wheat chromosomes 3A, 3B, and
3D respectively (Table 3-4). In addition, six loci were assigned to wheat homoeologous
group 1 where a well known duplication exists with homoeologous group 3 (Salse J.
personal communication)
As a conclusion, the SSRs derived from coding DNA sequence on rice chromosome 1 also
showed quite a high level of transferability across its distant relative (Triticeae) and thus
may be successfully used for comparative genomics studies such as genome analysis,
localization of expressed genes, survey of orthologous relationship, and fine mapping of
regions of interest.
3.4 Discussion, comments and perspectives
In this part, 96.2% of the primer pairs successfully amplified products in rice species, and
about 80% of them produced strong and clear profiles. About 96% of the primer pairs
yielded fragments of the expected size contrary to genomic SSRs, where only 36% did in
common wheat, with many of them resulting in a smear (Röder et al. 1995). For 18 primer
pairs that amplified in almost of the lines tested, 16.7% (3/18) exhibited polymorphism
among the eight wheat cultivars. This was much lower than the results described in
previous studies (about 25%, Eujayl et al. 2001; Gupta et al. 2003; Thiel et al. 2003; Gao et
al. 2004; Nicot et al. 2004), and than that observed for genomic SSRs (53%, Eujayl et al.
2001). Two reasons can explain this fact: 1) these rice primer pairs that amplify in common
wheat, most likely reside in well conserved regions between two species; 2) the
characteristics of EST-SSRs, i. e. a lower number of repeat units, can also account for this
lower percentage of polymorphism. Three polymorphic primers were screened in two
mapping populations (ITMI and Courtot X Chinese Spring segregating populations), for
genetic mapping in common wheat. But they failed to be mapped because very complex
profiles were yielded.
SSRs derived from ESTs are especially valuable as molecular markers because they are
derived from gene transcript and are more likely to be conserved among species. Therefore
these markers may be more transferable than genomic SSRs (Gao et al. 2003; Yu et al.


Results and Discussion -Transferability of EST-SSRs between rice and wheat
- 81 -
2004b; Gupta et al. 2003; Zhang et al. 2005). However, because rice is very distant relative
to wheat, a lower level of transferability noticed on at least one line was observed for rice
EST-SSRs toward wheat and its close and wild relatives: T. aestivum (44%), T. durum
(18.6%), T. monococcum (17.6%), Ae. speltoides (17.6%), T. tauschii (13.7%), rye (14.7%),
barley (8.8%) and Agroprum elongatum (6.9%). The similar transferability from common
wheat to rice was reported in previous study (45%, Yu et al. 2004a). Considering those
amplifying in at least two lines, the transferable rate was 28.4% from common wheat to
rice which was consistent with the transferability from wheat to rice in our previous study
(28.3%, Zhang et al. 2005). When primers amplifying in all cultivars were investigated,
only 17.6% (18) of transferability was detected. This suggested that DNA sequence was
well conserved for 18 primers through 65 million years’ divergence, while several bases in
the flanking regions were subjected to mutate for the other primers.
In order to evaluate the utility of EST-SSRs as anchor markers we assigned these 18
markers to wheat chromosomes by using Chinese Spring NT and DT lines. Sixteen
markers were assigned to wheat chromosomes. Because these markers were developed
from rice chromosome 1, as expected, most of them (50%) were located on wheat
homoeologous group 3, according the orthologous relationship between rice and wheat
while the others were on the other groups. Similar results are mentioned by Munkvold et al
(2004) who found that 59% of wheat group 3 mapped–EST unigenes showed homology to
rice 1 when constructing group 3 chromosome bin map of wheat. Our results supported the
structural relationships between wheat and rice reported in previous comparative maps at
the macro level. In our study, 12 among the 16 markers were assigned to a maximum of
three loci. Sixty seven percent of them were found at loci located on the same
homoeologous group. Likewise, 70% of markers detected multiple loci in the study for
assessing the efficiency of EST-SSRs in comparative mapping (Yu et al. 2004b). For
instance, CFR22 amplified two fragments but only one was assigned to wheat chromosome
3A while the other was located on wheat chromosome 1B. This can be explained by the
fact that these markers developed from expressed genes were frequently duplicated in the
genome. Moreover, most of the additional loci mapped to wheat homoeologous group 1. A
duplication between wheat homoeologous groups 3 and 1 was already evidenced (Salse J
personal communication). Our results are thus consistent with what was previously
described.
Even in the most conserved region, all wheat chromosome deletion bins containing only

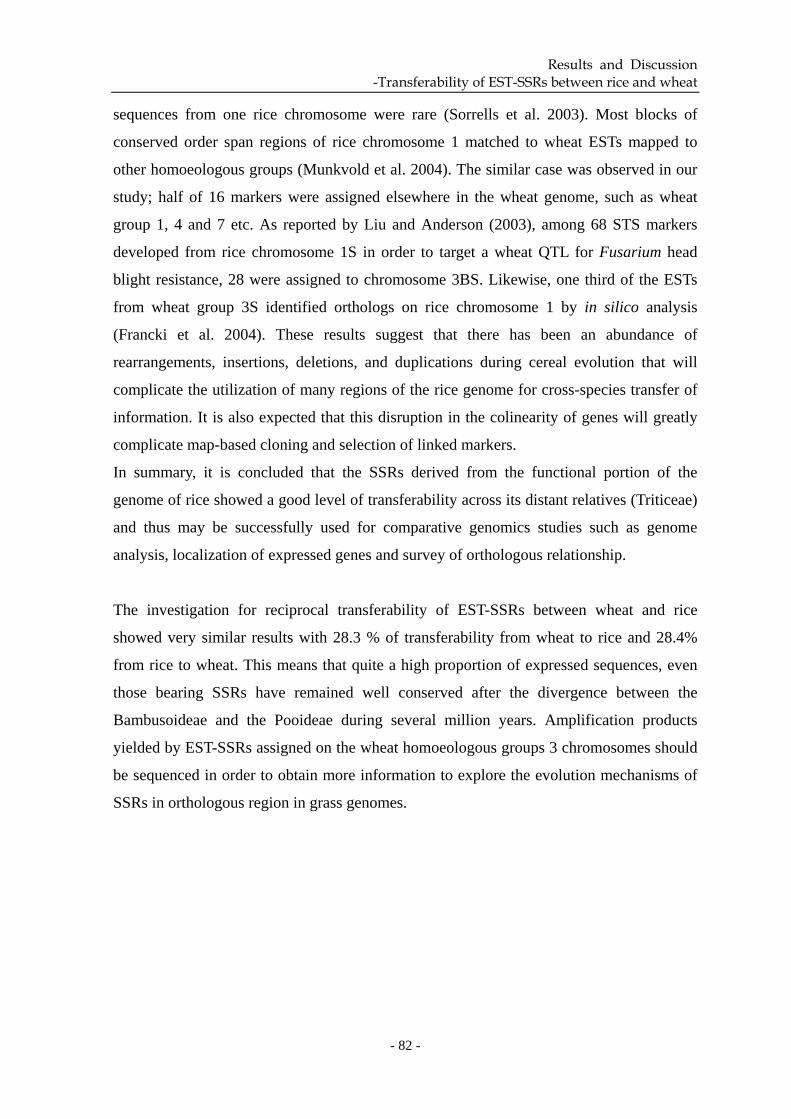
Results and Discussion -Transferability of EST-SSRs between rice and wheat
- 82 -
sequences from one rice chromosome were rare (Sorrells et al. 2003). Most blocks of
conserved order span regions of rice chromosome 1 matched to wheat ESTs mapped to
other homoeologous groups (Munkvold et al. 2004). The similar case was observed in our
study; half of 16 markers were assigned elsewhere in the wheat genome, such as wheat
group 1, 4 and 7 etc. As reported by Liu and Anderson (2003), among 68 STS markers
developed from rice chromosome 1S in order to target a wheat QTL for Fusarium head
blight resistance, 28 were assigned to chromosome 3BS. Likewise, one third of the ESTs
from wheat group 3S identified orthologs on rice chromosome 1 by in silico analysis
(Francki et al. 2004). These results suggest that there has been an abundance of
rearrangements, insertions, deletions, and duplications during cereal evolution that will
complicate the utilization of many regions of the rice genome for cross-species transfer of
information. It is also expected that this disruption in the colinearity of genes will greatly
complicate map-based cloning and selection of linked markers.
In summary, it is concluded that the SSRs derived from the functional portion of the
genome of rice showed a good level of transferability across its distant relatives (Triticeae)
and thus may be successfully used for comparative genomics studies such as genome
analysis, localization of expressed genes and survey of orthologous relationship.
The investigation for reciprocal transferability of EST-SSRs between wheat and rice
showed very similar results with 28.3 % of transferability from wheat to rice and 28.4%
from rice to wheat. This means that quite a high proportion of expressed sequences, even
those bearing SSRs have remained well conserved after the divergence between the
Bambusoideae and the Pooideae during several million years. Amplification products
yielded by EST-SSRs assigned on the wheat homoeologous groups 3 chromosomes should
be sequenced in order to obtain more information to explore the evolution mechanisms of
SSRs in orthologous region in grass genomes.

Results and Discussion - Phylogenetic studies
- 83 -
4 Phylogenetic studies of Triticeae using wheat EST-SSRs
Since wheat EST-SSRs are transferable to a large number of wheat related species. It was
expected that they could be used for studying the relationships within the Triticeae species.
This part was the subject of the third manuscript which was accepted for publication in
Theoretical and Applied Genetics. This paper discusses the relationships among the
polyploid wheat species and also the relations between ancestral diploid species and
polyploid species.
4.1 Transferable bread wheat EST-SSRs can be useful for phylogenetic
studies among the Triticeae species (Theor Appl Genet, DOI
10.1007/s00122-006-0304-4)


Results and Discussion - Phylogenetic studies
- 84 -


Results and Discussion - Phylogenetic studies
- 85 -


Results and Discussion - Phylogenetic studies
- 86 -

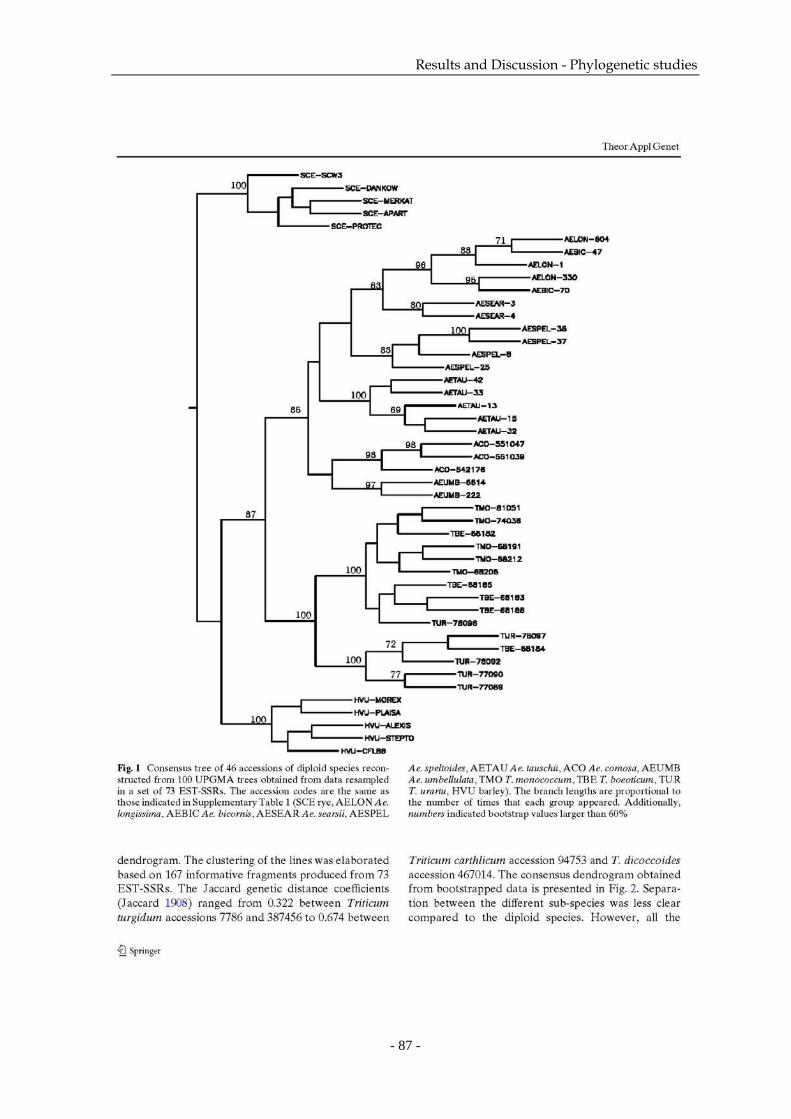
Results and Discussion - Phylogenetic studies
- 87 -


Results and Discussion - Phylogenetic studies
- 88 -


Results and Discussion - Phylogenetic studies
- 89 -


Results and Discussion - Phylogenetic studies
- 90 -


Results and Discussion - Phylogenetic studies
- 91 -


Results and Discussion - Phylogenetic studies
- 92 -


Results and Discussion - Phylogenetic studies
- 93 -


Results and Discussion - Phylogenetic studies
- 94 -


Results and Discussion - Phylogenetic studies
- 95 -
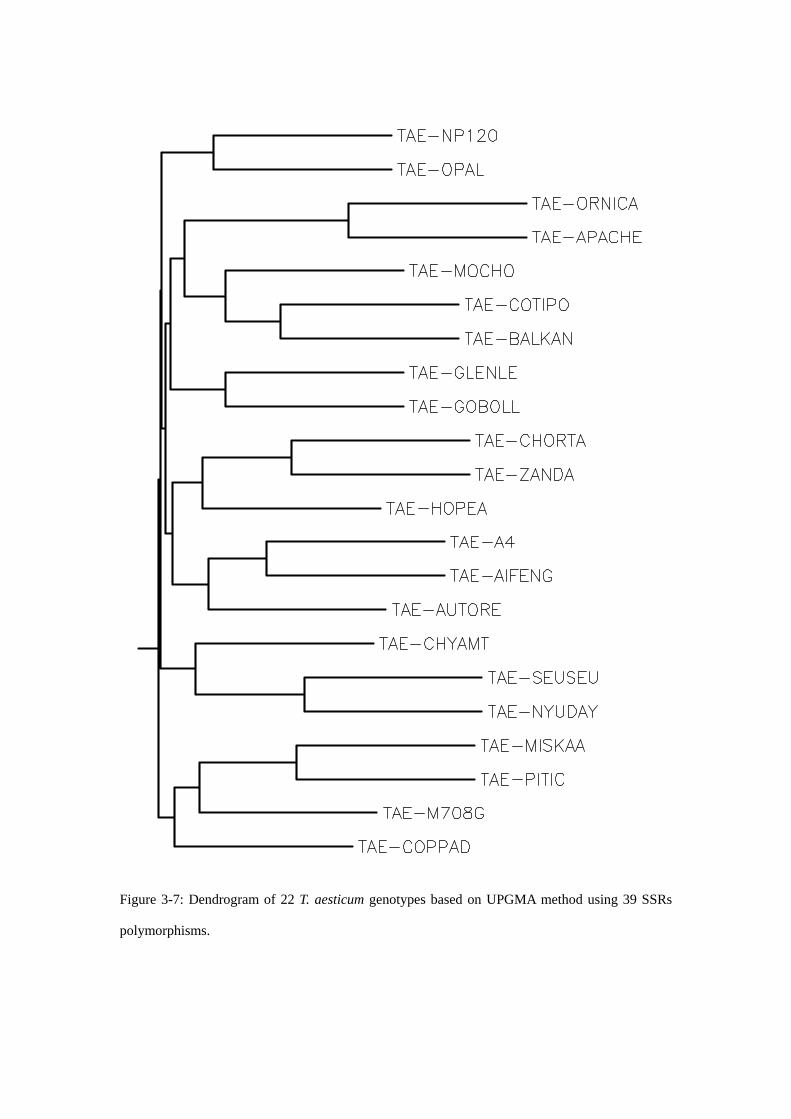
Figure 3-7: Dendrogram of 22 T. aesticum genotypes based on UPGMA method using 39 SSRs
polymorphisms.

Results and Discussion - Phylogenetic studies
- 96 -
4.2 Comparison of the classification of T. aestivum lines obtained using
g-SSRs and EST-SSRs
We decided to compare phylogenetic trees of 22 bread wheat cultivars reconstructed using
39 g-SSRs distributed on all of the 21 chromosomes of bread wheat (Roussel et al, 2002),
and a similar set of 42 EST-SSRs.
For the 39 g-SSRs, 368 informative fragments were obtained and the Jaccard (1908)
genetic distance coefficients ranged from 0.7884 between cvs Ornicar and Apache to
0.9863 between cvs Chortandinka and M708g. For the 42 EST-SSRs, 206 informative
fragments were obtained and the coefficients ranged from 0.2571 between cvs A4 and
Np120 to 0.6024 between cvs Chyamtang and Ornicar. These results clearly show that the
g-SSRs are able to reveal a larger diversity compare to EST-SSRs, which are obviously
less polymorphic because located in coding sequences.
In the following section, in each case the consensus dendrograms summarized 100
phylogenetic UPGMA-trees obtained from bootstrapped data.
In the dendrogram reconstructed from g-SSR data (Fig 3-7), no clear clustering was
obtained and most of the bootstrap values were lower than 60%. However, there is a trend
in forming five groups. The first one is made of only two lines from India (NP120) and the
Netherlands (Opal). The second one contains five European lines (Ornicar, Apache, Mocho,
Balkan, Gobolloi) together with a Canadian line (Glenlea) and a Brasilian line (Cotipora).
The third group can be divided into two sub-groups, one with European lines
(Chortandinka, Zanda, Hopea) and the other with Asian lines (A4, Aifeng, Aurore). Three
Asian cultivars (Chyamtang, Seuseun, Nyuday) formed the fourth group while three
Middle Eastern cultivars (Miskaagani, M708G, Coppadra) and the Mexican line (Pitic)
clustered together to form the fifth group. Globally, the lines from the same geographic
region tend to cluster together suggesting a spatial organization.
Similarly, no clear clustering was identified in the tree reconstructed from EST-SSR data
(Fig 3-8). A large group contains all the lines except Nyuday (Japan) and Chyamtang
(Nepal). Within the large group, sub-groups were obtained but they gathered lines from
different origins except the one with Ornicar, Apache (Fra), Opal (Netherlands) and Hopea
(Finland) which included only European lines.
We combined the data collected from g-SSRs and EST-SSRs to make a new dendrogram.
Overall, 574 informative fragments were used to calculate Jaccard (1908) genetic distance

Figure3-8: Dendrogram of 22 T. aesticum genotypes based on UPGMA method using 42 EST-
SSRs polymorphisms.

Results and Discussion - Phylogenetic studies
- 97 -
coefficients which ranged from 0.4596 between cvs Ornicar and Apache to 0.7482 between
cvs A4 and Pitic. By pooling data from the two types of SSRs, a new dendrogram was
rebuilt for the 22 accessions of T. aestivum (Fig 3-9). Like for the two other trees, no clear
clustering was obtained. Similarly as for EST-SSRs, a large group containing most of lines
was obtained, only Nyuday (Japan) and Chyamtang (Nepal) being excluded. Within the
large group, French cultivars (Apache, Ornicar) were separated and grouped together.
Cultivars Aifeng (China) and A4 (Afghanistan) were associated as well as the cvs Cotipora
(Brasil) and Mocho (Portugal). The other lines with possible common origins were
distributed in all the other sub-groups.
Comparing the two trees obtained using g- and EST-SSRs, the values of genetic distance
(GD) were considerably different. The GD values obtained with EST-SSRs were lower
(mean GD of 0.43) than those with g-SSRs (mean GD of 0.89) probably because the
regions detected by EST-SSRs are well conserved among species. Concerning the tree
reconstructed based on pooled data, GD values were a mean of those for EST- and g-SSRs
(mean GD of 0.6), and new relationships were observed. The three dendrograms were
significantly different and no clear conclusion on a better capacity of one or the other type
of marker to discriminate between the lines was drawn.
4.3 Genetic diversity of Triticale species The genetic diversity of eight Triticale varieties was also investigated by using wheat
EST-SSRs. Polymorphism information content (PIC) values which provide an estimate of
the discriminatory power of each EST-SSR locus were computed using 47 EST-SSRs. In
this case, EST-SSRs were chosen according to their ability to reveal polymorphism and to
the absence of missing data. PIC values ranged from 0.23 to 0.77 (average 0.41 ± 0.17)
which was similar to those obtained for T. aestivum (average 0.40 ± 0.20) and for T. durum
(average 0.39 ± 0.19). This value was lower than that of g-SSRs (mean value of 0.54),
reported by Tams et al. (2004).
For the 47 EST-SSRs, 185 informative fragments were obtained. The Jaccard genetic
distance coefficients were calculated using these data and ranged from 0.25 between cvs
Trimaran and Tricolor to 0.65 between cvs Lamberto and Bienvenu. The consensus
dendrogram was reconstructed by using UPGMA method (Fig. 3-10). In this tree, the
varieties were clustered according to their geographic origin (France and Poland). Within
the French cultivars, two groups were formed, one where four accessions were clustered

Figure 3-9: Integrated dendrogram of 22 T. aesticum genotypes based on UPGMA method pooled
data from 42 EST-SSRs and 39 g-SSRs polymorphisms.

Results and Discussion - Phylogenetic studies
- 98 -
together (Zeus, Ampiac, Bienvenu and Matinal), the other with the remaining three
(Trimaran, Tricolor and Carnac). All these results were consistent with the known pedigree
of the lines (A Bouguennec, personnal communication). Our result demonstrated thus that
common wheat EST-SSRs can be successfully used for diversity estimation in relatives of
wheat.
4.4 Phylogenetic relationship for species with the D genome
In order to confirm the relationship between Ae. tauschii and polyploid wheats, one set of
ten markers evenly distributed on the D genome of hexaploid wheat (Zhang et al. 2005)
was selected to investigate the relationships between this genome of hexaploid, tetraploid
and Ae. tauschii species.
In this case, 169 informative fragments obtained from 10 EST-SSRs assigned to the D
genome of bread wheat were used. The Jaccard genetic distance coefficients (1908) were
calculated using these data and ranged from 0.2105 between T. aestivum cvs NP120 and
Chyamtang to 0.9615 between Ae. tauschii accession 33 and T. durum cv Peru1. The
consensus dendrogram which summarized 100 phylogenetic UPGMA-trees obtained from
bootstrapped data is shown in Fig. 3-11.
Two distinct groups were formed. Hexaploid wheats (ABD) and Ae. tauschii (D) species
were clustered together and formed one large group because both have a D genome
originating from a common ancestor. All Ae. tauschii accessions were grouped together,
accession 42 being slightly isolated from all the other accessions. A close relationship was
shown between accessions 13 and 32, and between accessions 15 and 33. Since tetraploid
species (AB) have no D genome, they clustered together to form another group.
4.5 Phylogenetic relationships between all the species
In order to examine the phylogenetic relationships among all the 32 species or sub-species,
the most informative accession (with as fewer missing data as possible) of each group
among all those tested was selected. They are indicated in annex 2. A set of 73 EST-SSRs
was selected and the Jaccard genetic distance coefficients were calculated based on the 867
informative fragments. The GD coefficients ranged from 0.224 between T.
sphaerocococcum and T. petropavlovskyi to 1.00 between T. polonicum and Oryza sativa. A
dendrogram was reconstructed, which summarized 100 phylogenetic UPGMA-trees
obtained from bootstrapped data (Figure 3-12). In this phylogenetic tree, all the subspecies
with the same genome were clustered together without ambiguity. The hexaploid

Figure 3-10 Dendrogram of 8 Tritical genotypes based on UPGMA method using data based on 47
EST-SSRs.

Results and Discussion - Phylogenetic studies
- 99 -
(AABBDD) and tetraploid wheat (AABB) were grouped together with the boostrapped
values of 100. Ae. tauschii, the D genome donor of bread wheat was related to Ae.
ventricosa (DDMvMv) which also carries a D genome. Among the diploid ancestral species,
Ae. tauschii was the most closely relative to hexaploid wheats followed by the A- (T.
urartu and further T. monococcum and T. boeoticum) and the B-genome (Ae. speltoides and
Ae. searsii and further Ae. bicornis and Ae. longissima) donors respectively. When more
distant species are considered, Avena sativa and Hordeum vulgare were closer to hexaploid
wheat whereas Oryza sativa and Lolium perenne appeared to be the most distant species.
In the hexaploid group, T. sphaerococcum, T. petropavlovskyi, T. vavilovi and T. spelta
were clustered together while T. compactum, T. macha and T. aestivum were separated
from this group and from each other. In the tetraploid species, T. durum, T. polonicum and
T. turgidum were clustered together, and the remaining species (T. carthlicum, T. dicoccum)
were separated from each other. Triticale was clustered into the tetraploid group which was
consistent with the fact that the cultivars tested were all hexaploids and only had the A and
B genomes of polyploid wheats. The S genome species were split into two groups, one
with Ae. bicornis (SbSb) and Ae. longissima (SlSl) and the other with Ae. speltoides (SS)
and Ae. searsii (SsSs). Ae. umbellulata (UU) and Ae. peregrina (UUSvSv) were clustered
with the S-genome species indicating close relationships between the U and S genomes.
4.6 Discussion
As expected, EST-SSRs revealed a lower number of alleles compare to gSSRs. This is
because they arise from coding regions, which are known to evolve slower compare to
non-coding regions. Similarly, the tree obtained using g-SSRs gave a better representation
of the relationships between the lines compared to the one issued from EST-SSRs. Because
g-SSRs are random genomic DNA markers, most of them detect polymorphism located in
the non-coding regions of the genome (Brown et al. 2001). They are thus less constrained
by selection, can exhibit a higher number of alleles and are thus more informative (Roussel
et al. 2004, 2005). This suggests that more EST-SSRs are needed to achieve the same
resolution than the g-SSRs. Gupta et al. (2003) reported similar results on wheat. They
assessed the degree of genetic diversity among 52 elite wheat genotypes by using 78 wheat
EST-SSRs. They recommended the use of one or more of the other available marker
systems (for example g-SSRs) together with EST-SSRs. Thereby, the genetic diversity,
based on data pooled by combining EST-SSRs and g-SSRs, will give more reliable patterns,

Figure 3-11 Dendrogram for 58 accessions (22 T. aestivum, 23 T. durum, 5 Ae. tauschii,)
reconstructed using the UPGMA method based on data of a set of 10 EST-SSRs assigned to the D
genome.

Results and Discussion - Phylogenetic studies
- 100 -
since these will be based on a relatively much larger proportion of the entire genome.
Triticale (xTriticosecal Wittm), an amphiploid species derived from the intergeneric hybrid
between wheat and rye, has gained considerable importance in recent years as a cattle feed
grain, due to its favorable amino acid composition and performance in less productive
environments. From our investigations, we found that the seven French cultivars we
analysed were split into two groups. This can be explained by the origins of these cultivars.
Varieties Trimaran, Carnac and Tricolor were breeded by Florimond-Desprez, and have a
common ancestor in their pedigree which explain the clustering of these three lines (A
Bouguennec, personnal communication). Similarly the other four varieties have also
common ancestors. The results are thus consistent with the known pedigree of the lines.
Our study also gave evidence that Ae. tauschii was the D-genome donor of hexaploid
wheat. Dvorak et al. (1998) used the variation at 27 RFLP loci to determine the genetic
distance between wheat and Aegilops and found 16 alleles shared by the two species. Data
presented in their studies pointed to subsp. strangulate as the source of the wheat D
genome. This finding supports previous investigation using isozymes, and HMW glutenin
subunits (Nakai 1978; Lagudah et al. 1991). However, using microsatellites, Lelley et al.
(2000) did not support this hypothesis and the problem of which specific genotype of Ae.
tauschii was the major source of the wheat genome still remains unresolved.
Concerning the tree constructed for all species, hexaploid, tetraploid, Triticale and
D-genome donor species were grouped with a better consistency compared to the
remaining species (the A and B genome donors, and wild relatives of common wheat). This
may be attributed to the method used for selecting the samples and the low number of data
points (867) used. However, in this tree, the hexaploid and tetraploid species showed a
very close relationship that was consistent with the phylogeny of the polyploid wheats.
They also appeared to be closer to the D- (Ae. tauschii) and A-genome donor species than
to the B-genome donor species. This result agreed with those reported by Buchner et al.
(2004) and Galili et al. (2000) based on RFLP analysis and with those from Zhang et al.
(2002) based on DNA sequence analysis.
Early cytogenetic studies suggested that the A genome of common wheat was contributed
by T. monococcum (Sax 1922; Lilienfeld and Kihara 1934). More recent studies showed
that T. urartu contributed the A genome to hexaploid wheat (Dvorak et al 1993; Huang et
al 2002). In our phylogenetic trees, T. urartu also showed a closer relationship with
hexaploid wheat within the three possible A genome donors. Our results thus confirmed the

Figure 3-12 Dendrograms for 32 representatives from 32 species reconstructed by UPGMA
method. Numbers on the branche indicate the bootstrap values for 100 replicates. Values greater
than 60% are shown

Results and Discussion - Phylogenetic studies
- 101 -
known phylogenetic relationship among common wheat and its ancestral species, Ae.
tauschii was the likely progenitor of the D genome and T. urartu the one of the A genome.
Some discrepancies were observed with phylogenetic trees reconstructed based on
cytoplasmic genomes which allows to trace the female donor of present cytoplasm (Ishii et
al. 2001; Wang et al. 1997) suggesting that the evolution was not parallel between the
cytoplasmic and the nuclear genomes in Aegilops (Sasanuma et al. 2004).
4.7 Comments and perspectives
As a conclusion, bread wheat EST-SSRs showed that they can be useful for estimating
intraspecific genetic diversity. However, they give better results when they are combined
with g-SSRs. A fair comparison might have been to estimate the relationships either within
or between species on a given set of lines starting from many EST-SSRs as well as g-SSRs.
Then an estimate of the efficient number of SSRs (in each case) needed to achieve a given
precision of the GD/GS would have been obtained by resampling the data.
EST-SSRs are also proved useful for taxonomic and phylogenetic studies even between
distant species such as rice, maize, rye, barley and wheat. Trully speaking, we did not
assess the genetic diversity but only the relative classification of the accessions. However,
better information would be obtained if sequences of the amplification products were
analyzed. We would then access to the SSR itself and to the variations in terms of type of
motif, number of repeats, point mutation within and outside the SSR.


GENERAL CONCLUSION


General Conclusion
- 102 -
General Conclusion
1. Analysis of the wheat ESTs
1.1 Main results
Among the 301 wheat EST-derived SSRs selected, the trinucleotide repeats were the most
common (77%), (GCC)n motif being the most abundant and SSRs with four repeats
occurring the most frequently.
About 80% of the primer pairs gave an amplification product with some differences
between their expected and observed sizes. In general, EST-SSRs markers produced high
quality patterns compare to g-SSRs. Dinucleotide repeats displayed higher level of
polymorphism than trinucleotide repeats. The combination W7984 x Opata (37.5%) was
the most polymorphic, the average level of polymorphism being 25.4% for the four
populations. Most of the EST-SSRs gave less than five amplification products using our
sample, one third giving three bands probably corresponding to the three homoeologous
chromosomes while 50 % gave only one band suggesting that these latter were specific of
one of the three copies or that the three copies had identical sizes or that these SSRs were
located within unique genes.
Overall, 81 (62 on ITMI reference map and 19 on the CtCS map) new loci were added to
the wheat genetic maps. More loci mapped to the B genome compared to the A and D
genomes confirming that the former exhibits more polymorphism than the other two. Only
few loci mapped to group 5 chromosomes suggesting a better conservation and less
polymorphism within the genes from these chromosomes compared to the others. Most of
the loci located in the distal regions of chromosomes, which was consistent with the known
location of genes in wheat.
1.2 Perspectives
According to our results, developing new markers from ESTs can be a good way to
improve rapidly the wheat genetic map with non anonymous markers. However, we must
be aware that (1) the primers should be designed accurately in order to avoid to be at a
junction between or on two different exons. In this case, no useful amplification will occur.

General Conclusion
- 103 -
One way to overcome this would be to use the rice sequence since there is a good
conservation of the splicing junction between the two species; (2) the level of
polymorphism will be low which will make them difficult to map. This problem can be
overcome by combining both SSR length and sequence variation using SSCP analysis that
is able to discriminate between two strands differing by only a limited number of base pair
changes or other methods. Since SSRs are known to evolve faster than other type of
sequences, it is likely that they show higher levels of mutations, even within coding
sequences; (3) the markers that are going to be developed will be located in the distal ends
of the chromosomes. However, this is maybe not a problem since markers are mainly
developed to identify and follow genes of agronomical interest. Most of these genes are
also located distally on the chromosomes. Therefore, developing markers in these regions
will be helpful for identifying linkage with QTLs and for further positional cloning of the
genes underlying these QTLs.
In order to answer the questions concerning the various numbers of bands, it would be
interesting to confirm the presence of the three homoeologous copies by doing some
hybridization using the EST as a probe when only one amplification product is observed.
For those giving several bands, we could also sequence the different copies in order to
compare the sequences and study the differences concerning the SSR between them.
2. Transferability of the wheat EST-SSRs
2.1 Main results
Transferability to closely related Triticeae species ranged from 73.7% for Ae. longissima to
100% for some wheat sub species (T. compactum) and was lower for less close relatives
such as barley (50.4%) or rice (28.3%). BLAST analysis of the EST sequences against the
twelve rice pseudo-molecules showed that the EST-SSRs are mainly located in the
telomeric regions, and that the wheat ESTs have highest similarity to genes on rice
chromosomes 2, 3 and 5. Interestingly, most of the SSRs giving an amplification product
on barley or rice had a similar repeated motif as the one found in wheat suggesting a
common ancestral origin.
On average, the number of alleles per locus detected by EST-SSR markers was 3.1 on our
sample of hexaploid wheats. The PIC values simultaneously estimated for T. aestivum and


General Conclusion
- 104 -
T. durum were similar for the two species (0.40 and 0.39 respectively). The allelic diversity
within species revealed that allogamous species such as Ae. speltoides, Lolium perenne and
maize showed the highest values (respectively 0.423, 0.388 and 0.352) suggesting higher
level of genetic diversity within these species compare to T. aestivum and T. durum which
exhibited the lowest values (0.108 and 0.093 respectively). T. aestivum and T. durum
shared the largest number of alleles (74.6%) while among the three ancestral diploid
species of bread wheat, Ae. tauschii had the highest percentage of common alleles with T.
aestivum (57.4%), followed by T. monococcum (47.6%) and Ae. speltoides (40.9%).
2.2 Perspectives
Our results indicate that wheat EST-SSRs have a good potential for genetic map
elaboration in orphan species. Despite the fact that these latter have a great interest for
numerous traits they are only poorly studied because they carry many undesirable
characters. If favorable alleles can be identified in these genotypes, existence of linked
molecular markers will be necessary to trail their introgression within elite germplasm.
However, because no genomic tools have been developed for these species and especially
molecular markers, such a marker assisted selection was not possible. EST-SSRs that are
transferable across the species will allow overcoming of this drawback. Introgressions
could thus be reduced to a minimum, avoiding the linkage drag of large fragments of alien
chromosomes bearing numerous undesired genes (forward and backward selection).
Moreover, because of the large genetic diversity existing in wild species, there could be a
simultaneous improvement of the bread wheat genetic diversity that has tended to decrease
dramatically since the last 40 years.
3. Phylogenetic studies
3.1 Main results
When diploid species only are concerned, all the accessions bearing the same genome were
clustered together without ambiguity while the separation between the different
sub-species of tetraploid as well as hexaploid wheats was less clear. Phylogenetic trees
reconstructed based on data of 16 EST-SSRs mapping on the A genome showed that T.
aestivum and T. durum had closer relationships with T. urartu than with T. monococcum
and T. boeoticum, confirming that T. urartu is the A genome ancestor of polyploid wheats.
Similarly, another tree reconstructed from data of 10 EST-SSRs mapping on the B genome


General Conclusion
- 105 -
showed that Ae. speltoides had a closest relationship with T. aestivum and T. durum,
suggesting that it was the main contributor of the B genome of polyploid wheats.
No clear clustering of the hexaploid varieties was identified in the tree reconstructed from
EST-SSR data and the results were better using g-SSRs. It was not possible to compare the
two trees because they were too different from each other. Result was better with Triticale
where varieties could be separated according to their origin. Similarly, studying the
hexaploid and tetraploid species together with Ae. tauschii species using D-genome
EST-SSRs made easier the separation in different groups. Moreover, when all the 32
species or sub-species are analyzed together, the clustering is much better and the
phylogeny between all the species seems to appear more clearly.
3.2 Perspectives
In this study, we used only a limited number of markers (16 and 10 for A and B genome
analyses respectively) which make our classification not highly statistically significant.
However, we showed that EST-SSRs constitute a good tool for phylogenetic studies within
the Grass family. We have some evidence that when amplification occurs in different
species, the microsatellite motif is often present in all the species and sometimes similar
between the species even if the number of repeats is not the same. However, a better study
would consist in amplifying in as many species as possible a significant number of
EST-SSRs and sequencing the amplification products. Then, we could do a more
significant phylogenetic study of the relationships between all the species by comparing
homologous sequences of the same gene. It would then be possible to draw a scheme of the
molecular evolution of all these species on a sufficient number of sequences and reconsider
or confirm the classification within the Grass family.
4. Transferability of rice EST-SSRs
4.1 Main results
Rice as a model for grass species has been largely studied to understand other
agronomically important grass genomes. Here, the diversity of SSRs on rice chromosome 1
was surveyed, and primer pairs were developed to explore the colinearity between rice and
wheat, and to investigate their potential for comparative genomics. A total of 12,078
perfect as well as imperfect SSRs were identified from 4,100 genes containing SSRs on


General Conclusion
- 106 -
rice chromosome 1. Like in wheat, the trinucleotide repeats were the most common in rice
chromosome 1 genes (whole genes, CDS and introns) (CCG)n motif being the most
abundant in the three cases. (AC)n dinucleotide motif was most abundant in whole gene
and in intron while CG was more frequent in CDS. 106 EST-SSRs were developed from
CDS from 200 genes. 96% (102) of the primer pairs led to an amplification product in rice
among which 96% (98) yielded a product with an expected size. The level of transferability
from rice to eight related species of wheat (T. aestivum, T. durum, T. monococcum, Ae.
speltoides, Ae. tauschii, rye (Secale cereale), barley (Hordeum vulgare L.), Agropyron
elongatum) ranged from 28.4% (T. aestivum ) to 6.9% (Agroprum elongatum). Sixteen
markers were assigned to wheat chromosomes using NT and DT lines among which half of
them were located on the wheat homoeologous group 3 suggesting that micro-colinearity is
quite well conserved between wheat and rice in this region.
4.2 Perspectives
Our results show that due to their conservation and high transferability to the related
species, rice EST–SSRs will be useful for comparative genomics studies. However,
because the transferable EST-SSRs are better conserved, they are less prone to detect
polymorphism and can thus be difficultly mapped. This problem can be hurdled by
combining both SSR length and sequence variation using SSCP analysis. Though the
structural syntenic relationships between wheat and rice at the macro level were
demonstrated, the fact that only half of markers were assigned to wheat homoeologous
group 3 suggests the complexity of micro-colinearity between rice and Triticeae. However,
available rice genomic sequences can serve as excellent resources for the saturation
mapping of the target region containing agronomically important genes with gene-based
markers (such as EST-SSRs, etc), and finally may facilitate synteny-based positional
cloning of gene from large genome cereal species
5. Conclusion
As a conclusion, we can say that it should be worth continuing the development of
EST-SSRs in wheat which will be helpful for numerous genetic studies as well as the
identification and cloning of genes of agronomical interest. Based on syntenic relationships
between Triticeae and rice, the rice genome sequence can also serve as excellent resources
for the saturation mapping of the target regions containing agronomically important genes


General Conclusion
- 107 -
through a comparative approach, and finally may facilitate synteny-based positional
cloning of genes within large genomes of cereal species, such as bread wheat. EST-SSRs
can exhibit perfect marker-trait association, and can remarkably increase selection
efficiency in application of marker-assisted selection (MAS), particularly for traits with
low heritability. In addition, these markers will greatly help the exploration and
exploitation of the genetic diversity existing among the Triticeae. They will probably
constitute a breakthrough in wheat breeding by bringing a new vision of the way to
increase the diversity and the sustainability of the crop which will lead to a better
management of the natural resources such as water and a lower utilization of intrans.
Moreover, numerous questions remain to be answered:
- Despite the huge number of EST sequences, it has still not been evidenced a
clear correlation between certain classes of genes and the presence of the SSR.
Especially, the multicopy families have never been studied and it could be
interesting to evaluate the different copies in order to see if all of them have the
same SSR and if it has evolved differently between the copies.
- How can the SSRs be maintained or supressed in the different homoeologous
copies? Is this randomly done or does this depend on the place of the SSR within
the sequence?
- When the SSR is common to different species, this is because it has a
common ancestral origin. However, we have no idea if newly synthetized SSR can
occur, which are the mechanisms of this occurrence, are they genome or species
specific, etc.
It was generally admitted that because of the low transferability, SSRs cannot be used for
comparative genomics and synteny. However, EST-SSRs have proven the contrary.
Studying the evolution of the SSRs (motif, number of repeats, point mutations…) within
the grass family will probably lead to modify and reconsider the classification made on
phenotypic traits. This will also probably contribute to understand the origin of the B
genome of the bread wheat which still remains unexplained. Probably its polyphyletic
origin would be confirmed by identifying the various species that may have contributed to
its elaboration.

REFERENCES


References
- 108 -
References:
Ahn S, Anderson JA, Sorrells ME, Tanksley SD (1993) Homoeologous relationships of rice, wheat and maize chromosomes. Mol Gen Genet 241: 483-490
Akagi H, Yokozeki Y, Inagaki A and Fujimura T (1998) Origin and evolution of twin microsatellites in the genus Oryza. Heredity 81:187 – 197
Akhunov ED, Goodyear AW, Geng S, Qi LL, Echalier B, Gill BS, Miftahudin KR, Gustafson JP, Lazo G, Chao S,, erson OD, Linkiewicz AM, Dubcovsky J, La Rota M, Sorrells ME, Zhang D, Nguyen HT, Kalavacharla V, Hossain K, Kianian SF, Peng J, Lapitan NLV, Gonzalez-Hernandez JL, Anderson JA, Choi DW, Close TJ, Dilbirligi M, Gill KS, Walker-Simmons MK, Steber C, McGuire PE, Qualset C, Dvorak J (2003) The organization and rate of evolution of wheat genomes are correlated with recombination rates along chromosome arms. Genome Res. 2003 13: 753-763.
Akkaya MS, Bhagwat AA, Cregan PB (1992) length polymorphisms of simple sequence repeat DNA in soybean. Genetics 132: 1131-1139
Altschul SF, Gish W, Miller W, Myers EW, Lipman DJ. (1990) Basic local alignment search tool. J Mol Biol 215:403-10
Andersen JR and Lubberstedt T (2003) Functional markers in plants. Trends Plant Sci 8 (11): 554-560
Anderson JA, Stack RW, Liu S, Waldron BL, Fjeld AD, Coyne C, Moreno-Sevilla B, Mitchell Fetch J, Song QJ, Cregan PB, Frohberg RC (2001) DNA markers for Fusarium head blight resistance QTLs in two wheat populations. Theor. Appl. Genet. 102: 1164–1168
Arcot SS, Wang Z, Weber JL, Deininger PL, Batzer MA (1995) Alu repeats: a source of the genesis of primate microsatellites. Genomics 29: 136-144
Arens P, Odinot P, Van Heusden AW, Lindhout P, Vosman B (1995) GATA and GACA repeats are not evenly distributed throughout the tomato genome. Genome 38: 84-90
Areshchenkova T, Gannal MW (2002) Comparative analysis of polymorphism and chromosomal location of tomato microsatellite markers isolated from different sources. Theor Appl Genet 104: 229-235
Bachtrog D, Weiss S, Zangert B, Brem G and Schlotterer C (1999) Distribution of dinucleotide microsatellites in the Drosophila melanogaster genome. Mol Biol Evol 16 (5): 602 -610
Backermann JS, Weber JL (1992) Survey of human and rat microasellites. Genomics 12: 627 - 631
Bandopadhyay R, Sharma S, Rustgi S, Singh R, Kumar A, Balyan HS and Gupta PK (2004) DNA polymorphism among 18 species of Triticum-Aegilops complex using wheat EST-SSRs. Plant Science 166: 349-356
Bao Jinsong , Harold Corke and Mei Sun (2006) Analysis of Genetic Diversity and Relationships in Waxy Rice (Oryza sativa L.) using AFLP and ISSR Markers. Genet Res Crop Evol 53: 323 - 330
Bariana H.S., Hayden MJ, Ahmed NU, Bell JA, Sharp PJ, McIntosh RA (2001) Mapping of durable adult plant and seedling resistances to stripe rust and stem rust diseases in


References
- 109 -
wheat. Aust. J. Agric. Res. 52: 1247–1255
Barret P (1993) Utilisation des microsatellites pour la cartographie du génome des Brassica. Groupe de travail marqueurs moléculaires chez les végétaux, Méribel 232-242
Barrett B, Griffith A, Schreiber M, Ellison N, Mercer C, Bouton J, Ong B, Forster J, Sawbridge T, Spangenberg G, Bryan G and Woodfield D (2004) A microsatellite map of white clover. Theor Appl Genet 109:596-608
Barrier M, Friar E, Robichaux R, Purugganan M (2000) Interspecific evolution in plant microsatellite structure. Gene 241: 101-105
Becker J, Heun M (1995) Barley microsatellites: allele variation and mapping. Plant Mol Biol 27: 835-845
Beckman JS, Soller M (1990) Toward a unified approach to genetic mapping of eukaryotes based on sequence tagged microsatellite sites. Biotechnology 8: 930-932
Bell CJ, Ecker J (1994) Assignment of 30 microsatellite loci to the linkage map of Arabidopsis. Genomics 19: 137-144
Ben Amer IM, Börner A, Röder MS (2001) Detection of genetic diversity in Lybian wheat genotypes using wheat microsatellite markers. Genet Res Crop Evol 48:579–585
Bennet MD, Smith JB (1991) Nuclear DNA amounts in angiosperms. Proc. R. Soc. Lond. B 334: 309-345
Bennet MD, Leitch IJ (1995) Nuclear DNA amounts in angiosperms. Ann. Bot. 76: 113-176
Benson G (1999) TANDEM REPEATS FINDER: a program to analyze DNA sequences. Nucleic Acids Res 27:573–580
Bernardo R (2001) What if we knew all the genes for a quantitative trait in hybrid crops? Crop Sci 41:1-4
Bertin P, Grégoire D, Massart S, de Froidmont D (2001) Genetic diversity among European cultivated spelt revealed by microsatellites. Theor Appl Genet 102: 148-156
Bhattramakki D, Dong JM, Chhabra AK, Hart GE (2000) An integrated SSR and RFLP linkage map of Sorghum bicolor (L.) Moench. Genome 43:988-1002
Blackburn EH, Szostak JW (1984)The molecular structure of centromeres and telomeres. J. A. Rev. Biochem. 53: 163−194
Bother RV, Seberg O, Jacobsen N (1992) Genetic resources in the Triticeae. Hereditas, 116:141-150
Von Bothmer, R., Larson, S. 1992. Chloroplast DNA variation and the phylogeny of Hordeum (Poaceae). Am. J. Bot., 79, ...
Botstein D, White RL, Skolnick M, Davis RW (1980) Construction of a genetic linkage map in man using restriction fragment length polymorphisms. Am J Hum Genet 32(3):314-31
Boutin-Ganache I, Raposo M, Raymond M, Deschepper CF (2001) M13-tailed primer improve the readability and usability of microsatellite analyses performed with two different allele-sizing methods. Biotechniques 31: 24–28
Brandolini A, Castagna R, Empilli s (2000) Morpho-agronomic variability of the diploid


References
- 110 -
wheat Triticum monococcum L. Plant Genetic Resources Newsletter 124:36-40
Branlard G, Dardevet M, Saccomano R, Lagoutte F, Gourdon J (2001) Genetic diversity of wheat storage proteins and bread wheat quality. Euphytica 119:59-67
Branlard G, Dardevet M, Amiour N, Igrejas G (2003) Allelic diversity of HMW and LMW glutenin subunits and omega-gliadins in French bread wheat (Triticum aestivum L.). Genet Res Crop Evol 50: 669-679
Bothmer, R. von, Seberg, O., and Jacobsen, N. (1992) Genetic resources in Triticeae. Hereditas 116:141-150.
Brown GR, Kadel EE III, Bassoni DL, Kiehne KL, Temesgen B, van Buijtenen JP, Sewell MM, Marshall KA, Neale DB (2001) Anchor reference loci in loblolly pine (Pinus taeda L.) for integrating pine genomics. Genetics 159:799–809
Brown SM, Hopkins MS, Mitchell SE, Senior M L, Wang TY, Duncan RR, Gonzalez-Candelas F, Kresovich S (1996) Multiple methods for the identification of polymorphic simple sequence repeats (SSRs) in sorghum [Sorghum bicolor (L.) Moench]. Theor Appl Genet 93: 190-198
Bryan G, Collins A, Stephenson P, Orry A, Smith J, Gale M (1997) Isolation and characterization of microsatellite from hexaploid bread wheat. Theor Appl Genet 94: 557-563
Buchner P, Prosser IM and Hawkesford MJ (2004) Phylogeny and expression of paralogous and orthologous sulphate transporter gene in diploid and hexaploid wheats. Genome 47:526-534
Bull LN, Pabonpena CR, Freimer NB (1999) Compound microsatellite repeats: practical and theoretical features. Genome Res. 9: 830-838
Burstin J, Deniot G, Potier J, Weinachter C, Aubert G, Baranger A (2001) Microsatellite polymorphism in Pisum sativum. Plant Breed 120:311–317
Cadalen T, Boeuf C, Bernard S, Bernard M (1997) An intervarietal molecular marker map in Triticum aestivum L. em. Thell. and comparison with a map from a wide cross. Theor Appl Genet 94: 367-377
Cardle L, Ramsay L, Milbourne D, Macaula M, Marshall D and Waugh R (2000) Computational and experimental characterization of physically clustered simple sequence repeats in plant. Genetics 156: 847-854
Carels N and Bernardi G (2000) Two classes of genes in plants. Genetics 154: 1819-1825
Casa AM, Mitchell SE, Hamblin MT, Sun H, Bowers JE, Paterson AH, Aquadro CF, Kresovich S (2005) Diversity and selection in sorghum: simultaneous analyses using simple sequence repeats. Theor Appl Genet 111:23-31
Chao S, Sharp PJ, Worland AJ, Warham EJ, Koebner RMD, Gale MD (1989) RFLP-based genetic maps of wheat homoeologous group 7 chromosomes. Theor Appl Genet 78: 495-504
Charmet G, Balfourier F (1995) The use of geostatistics for sampling a core collection of perennial ryegrass population. Genet Res Crop Evol 42:303-309
Chebotar S, Röder MS, Korzun V, Saal B, Weber WE, Börner A (2003) Molecular studies on genetic integrity of open-pollinating species rye (Secale cereale L.) after long-term


References
- 111 -
genebank maintenance. Theor Appl Genet 107: 1469-1476
Chen K, Gray JC, Wildman SG (1975) Fraction I protein and the origin of polyploid wheats. Science 190: 1304-1305
Chen Xiwen, Shaoying Guo, Defu Chen, Pin Liu, Xiangdong Jia and Lijun Sun (2006) Assessing Genetic Diversity of Chinese Cultivated Barley by STS Markers. Genet Res Crop Evol Online
Chin ECL (1996) Maize simple repetive DNA sequences: abundance and allele variation. Genome 39:866-873
Cho YG, Ishii T, Temnykh S, Chen X, Lipovich L, McCouch SR, Park WD, Ayres N and Cartinhour S (2000) Diversity of microsatellites derived from genomic libraries and GenBank sequences in rice (Oryza sativa ). Theor Appl Genet 100: 713-722
Condit R, Hubbel SP (1991) Abundance and DNA sequence of two-base repeat regions in tropical tree genomes. Genome 34: 66-71
Cordeiro GM, Casu R, McIntyre CL, Manners JM and Henry RJ (2001) Microsatellite markers from sugarcane (Saccharum spp.) ESTs cross transferable to erianthus and sorghum. Plant Science 160: 1115-1123
Crollius HR, Jaillon O, Dasilva C, Ozouf-Costaz C, Fizames C, Fischer C, Bouneau L, Billault A, Quetier F, Saurin W, Bernot A, Weissenbach J (2000) Characterization and repeat analysis of the compact genome of the freshwater pufferfish Tetraodon nigroviridis. Genome Res 10: 939-949
Debrauwere H, Gendrel CG, Lechat S, Dutreix M (1997) Differences and similarities between various tandem repeat sequences: minisatellites and microsatellites. Biochimie 79: 577-586
De Lacy IH, Skovmand, Huerta J (2000) Characterization of Mexican wheat landraces using agronomically useful attributes. Genet Res Crop Evol 47: 591-602
Devos KM, Atkinson MD, Chinoy CN, Gale MD (1992) RFLP-based genetic map of homoeologous group 3 chromosomes of wheat and rye. Theor Appl Genet 83: 931-939
Devos KM, Bryan GJ, Collins AJ, Stephenson P, Gale MD (1995) Application of two microsatellite sequences in wheat storage proteins as molecular markers. Theor Appl Genet 90: 247-252
Dib C, Faure S, Fizmes C, Samson D, Drouot N, Vignal A, Millasseau P, Mare S, Hazan J, Seboun E, Lathrop M, Gypapy G, Morissette J and Weissenbach J (1996) A comprehensive genetic map of the human genome on 5,264 microsatellites. Nature 380: 152–154
Dietrich WF, Miller J, Steen R, Merchant MA, Damron-Boles D, Husain Z, Dredge R, Daly M, Ingalis KA, O''Coner TJ, Evans CA, de Angelis MM, Levinson DM, Kruglyak L, Goodman N, Copeland NG, Jenkins NA, Hawkins TL, Stein L, Page DC and Lander ES (1996) A comprehensive genetic map of the mouse genome. Nature 380: 149–152
DjèY, Heuertz M, Lefèbvre C, Vekemans X (2000) Assessment of genetic diversity within and among germplasm accessions in cultivated sorghum using microsatellite markers. Theor Appl Genet 100: 918-925


References
- 112 -
Dover GA, Tautz D (1986) . Phil. Trans. R. Soc. 312: 275−290
Drake JW, Glickman BW, Ripley LS (1983) Updating the Theory of Mutation. Am. Scient. 71, 621−630
Dvorak J, Di Terlizzi P, Zhang HB, Resta P (1993) The evolution of polyploid wheats: identification of the A genome donor species. 36: 21-31
Dvorak J, Luo MC, Yang ZL and Zhang HB (1998) The structure of the Aegilops tauschii genepool and the evolution of hexaploid wheat. Theor Appl Genet 97: 657-670
Edwards KJ, Barker JHA, Daly A, Jones C, and Karp A (1996) Microsatellite libraries enriched for several microsatellite sequences in plants. Biotechniques 20: 758-760
Efstratiadis A, Posakony JW, Maniatis T, Lawn RM, O'Connell C, Spritz RA, DeRiel JK, Forget BG, Weissman SM, Slightom JL, Blechl AE, Smithies O, Baralle FE, Shoulders CC, Proudfoot NJ (1980) The structure and evolution of the human beta-globin gene family. Cell. 21(3): 653–668.
Elgar G, Clark MS, Meek S, Smith S, Warner S, Edwards YJK, Bouchireb N, Cottage A, Yeo GSH, Umrania Y, Williams G, Brenner S (1999) Generation and analysis of 25 Mb of genomic DNA from the pufferfish Fugu rubipres by sequence scanning. Genome Res. 9: 960-971
Endo TR, Gill BS (1996) The deletion stocks of common wheat. J. Heredity 87: 295-307
Eujayl I., M. E., Sorrells, M. ME, Baum, P. M, Wolters, P and W. Powell, W (2002:) Isolation of EST-derived microsatellite markers for genotyping the A and B genomes of wheat. Theor Appl Genet 104: 399-407
Fahima T, Röder M, Wendehake K, Kirzhner V, Nevo E (2002) Microsatellite polymorphism in nature populations of wild emmer wheat, Triticum dicoccoides, in Israel. Theor Appl Genet 104:17-29
Feillet P (1965) Contribution à l’étude des proteines de blé. Influence des facteurs génétiques, agronomiques et technologiques. Ann. Technol. Agric. 14, numéro hors série, 95p
Feldman M (1976) Wheats. In Evolution of crop plants. NW Simmonds (ed), Longman, London pp120-128
Felix I, Martinant JP, Bernard M, Bernard S and Branlard G (1996) Genetic characterization of storage proteins in a set of F1-derived haploid lines in bread wheat. Theor Appl Genet 92: 340-346
Felsenstein J (1985) Confidence-limits on phylogenies – An approach using the bootstrap. Evolution 39: 783-791
Felsenstein J (1988) Phylogenies from molecular sequences: Inference and reliability. Annual Review of Genetics 22: 521 – 565
Felsenstein J (1993) PHYLIP (Phylogeny Inference Package) version 3.5c. Distributed by the author. Department of Genetics, University of Washington, Seattle
Flavell RB, Rimpau J, Smith DB (1977) Repeated sequence DNA relationship in four cereals genomes. Chromosoma 63: 205-222
Frankel OH (1977) Natural variation and its conservation. In Genetic diversity of plants. A. Muhammed & R.C. von Botstel, (eds) New York, USA, Plenum Press pp 21-24.


References
- 113 -
Gale MD, Miller TE (1988) The introduction of alien genetic variation into wheat. In: Lupton FGH (ed) Wheat breeding: its scientific basis, pp 173–210
Galili S, Avivi Y, Millet E and Feldman M (2000) RFLP-based analysis of the three RbcS subfamilies in diploid and polyploidy species of wheat. Mol Gen Genet. 263(4):674-680
Gao LF, Tang JF, Li HW, Jia JZ (2003) Analysis of mocrosatellites in major crops assessed by computational and experimental approaches. Mol Breed 12:245-261
Gao LF, Jing RL, Huo NX, Li y, Li PX, Zhou RH, Chang XP, Tang JF, Ma ZY and Jia JZ (2004) One hundred and one new microsatellite loci derived from ESTs (EST-SSRs) in bread wheat. Theor Appl Genet 108:1392-1400
DeLacy IH, Skovmand and Huerta J (2000) Characterization of Mexican wheat landraces using agronomically useful attributes. Genet Res Crop Evol 47: 591-602
Gendrel CG, Boulet A, Dutreix M (2000) (CA/GT)n microsatellites affect homologous recombination during yeast meiosis. Genes & Development 14:1261-1268
Ghebru B, Schmidt R, Bennetzen J (2002) Genetic diversity of Eritrean sorghum landraces assessed with simple sequence repeat (SSR) markers. Theor Appl Genet 105: 229-236
Ghariani S., N. Trifi-Farah , M. Chakroun, S. Marghali1 and M. Marrakchi (2003) Genetic diversity in Tunisian perennial ryegrass revealed by ISSR markers. Genet Res Crop Evol 50: 809 - 815
Goodman M. (1985) Rates of molecular evolution: the hominoid slowdown. Bioessays 3: 9−14
Gortner G, Pfenninger M, Kahl G, Weising K (1996) Northern blot analysis of simple repetitive sequence transcription in plants. Electrophoresis 17: 1183-1189
Gothridge KM, Dupal MP, Kolloker R, Jones ES, Smith KF, Foster W (2001) AFLP analysis of genetic diversity within and between populations of perennial ryegrass (Lolium perenne L.) Euphytica 122:191-201
Greaves DR, Patient RK (1985) (AT)n is an interspersed repeat in the Xenopus genome. EMBO J. 4: 2617−2626
Grenier C, Bramel-Cox PJ, Hamon P (2001) Core Collection of Sorghum: I. Stratification Based on Eco-Geographical Data. Crop Sci 41:234-240
Grivet L, Glaszmann JC, Vincentz M, Silva F and Arruda P (2003) ESTs as a source for sequence polymorphism discovery in sugarcane:example of the Adh genes. Theor Appl Genet 106:190-197
Gupta PK andVarshnney RK (2000) The developement and use of microsatellite markers for genetic analysis and plant breeding with emphasis on bread wheat. Euphytica 113: 163-185
Gupta PK, Rustgi S, Sharma S, Singh R, Kumar N, Balyan HS (2003) Transferable EST-SSR markers for the study of polymorphism and genetic diversity in bread wheat. Mol Genet Genomics 270:315–323
Guthridge KM, Dupal MD, Jones ES, Kölliker R, Smith KF, Forster JW (2001) AFLP analysis of genetic diversity within and between populations of perennial ryegrass (Lolium perenne L.). Plant and Animal Genome IX, San Diego, California. P320.


References
- 114 -
Guyomarc’h H, Sourdille P, Charmet G, Edwards KJ, Bernard M (2002a) Characterisation of polymorphic microsatellite markers from Aegilops tauchii and transferability to the D-genome of bread wheat. Theor Appl Genet 104: 1164-1172
Guyomarc’h H, Sourdille P, Edwards KJ, Bernard M (2002b) Studies of the transferability of microsatellites derived from Triticum tauschii to hexaploid wheat and to diploid related species using amplification, hybridization and sequence comparisons. Theor Appl Genet 105: 736-744
Hackauf B, and Wehling P (2002) Identification of microsatellite polymorphisms in an expressed portion of the rye genome. Plant Breed 121:17–25
Hamada H, Petrino MG, Kakunaga T (1982) A novel repeated element with Z-DNA-forming potential is widely found in evolutionary diverse eukaryotic genomes. Proc Natl Acad Sci USA 79: 6465-6469
Hammer K, Laghetti G, Olita G, Perrino P, Xhuveli L (2000) Collecte dans les montagnes d’Albanie, 1995. Publications IPGRI pgnewsletter07
Harding RM, Boyce AJ, and Clegg JB (1992) The evolution of tandemly repetive DNA: recombination rules. Genetics 132:847-859
Harry DE, Temeagen B, Neale DB (1998) Codominant PCR-based markers for Pinus taeda developed from mapped cDNA clones. Theor Appl Genet 97: 327-336
Hassan MD, Gustafson JP (1996) Molecular evidence for Triticum speltoides as a B-genome progenitor of wheat (Triticum eastivum). Genome 39: 543-548
Hentschel CC (1982) Homocopolymer sequencs in th espacer of a sea urchin histone gene repeat are sensitive to S1 nuclease. Nature 295, 714−716
Holton T. A., J. T., Christopher, L. JT, McClure, N. L, Harker, N and R. J. Henry, RJ (2002:) Identification and mapping of polymorphic SSR markers from expressed gene sequences of barley and wheat. Molecular Breeding 9: 63-71
Huang X, Madan A (1999) CAP3: a DNA sequence assembly program. Genome Res 9: 868–877
Huang XQ, Hsam SLK, Zeller FJ, Wenzel G, Mohler V (2000) Molecular mapping of the wheat powdery mildew resistance gene Pm24 and marker validation for molecular breeding. Theor. Appl. Genet. 101: 407–414
Huang SX, Sirikhachornkit A, Su XJ, Faris J, Gill BS, Haselkorn, Gornicki P (2002) Genes encoding plastid acetyl-CoA carboxylase and 3-phosphoglycerate kinase of the Triticum / Aegilops complex and the evolutionary history of polyploidy wheat. PNAS 99(12): 8133-8138
HUNTER RL, MARKERT CL. (1957) Histochemical demonstration of enzymes separated by zone electrophoresis in starch gels. Science 125(3261):1294-5
Hurtado M, C. Romero, S. Vilanova, A. Abbott, G. Llácer, M. Badenes (2002) Genetic linkage maps of two apricot cultivars ( Prunus armeniaca L.), and mapping of PPV (sharka) resistance. Theor Appl Genet 105: 182-191
Ishii T, Mori N and Ogihara Y (2001) Evaluation of allelic diversity at chloroplast microsatellite loci among common wheat and its ancestral species. Theor Appl Genet 103: 896-904


References
- 115 -
Jaaska V (1980) Electrophoretic survey of seedling esterases in wheats in relation to their phylogeny. Theor Appl Genet 56: 273-283
Jaccard P (1908) Nouvelles recherches sur la distribution florale. Bull Soc Vand Sci Nat 4 : 223-270
Jacob HJ, Brown DM, Bunker RK, Daly MJ, Dzau VJ, Goodman A, Kolike G, Kren V, Kurtz T, Lernmark A, Levan G, Mao Y, Pettersson A, Pravence M, Simon JS, Szpirer C, Szpirer J, Trolliet MR, Winer ES and Lander ES (1995) A genetic linkage map of the laboratory rat. Rattus norvegicus Nature Genet 9: 63–69
Jaradat AA (2001) Spatial and temporal genetic structure of wild emmer wheat in Jordan I. phenotupic traits. Istrael Journal of Plant Science 49:S53-S64
Jeffreys AJ, Wilson V, Thein SL (1985) Hypervariable 'minisatellite' regions in human DNA. Nature 314, 67−72
Jin L, Zhong YX, and Chakraborty R (1994) The exact numbers of possible microsatellite motifs. American Journal of Human Genetic 55: 582-583
Johnson RC, Johnston WJ, Golob CT, Nelson MC, Soreng RJ (2002) Characterization of the USDA Poa pratensis collection using RAPD markers and agronomic descriptors. Gneet Res Crop Evol 49:349-361
Jong E van Z, Guthridge KM, Spangenberg GC and Forster JW (2002) Development and characterization of EST-derived simple sequence repeat (SSR) markers for pasture grass endophytes. Genome 46: 277-290
Kaneko T, Zhang W., Ishii M, Ito K, Takeda K (2002) Differentiation and geographical distribution of β -amylase isozyme in barley. Genet Res Crop Evol 49(6): 599-605
Kantety RV, La Roa M, Matthew DE, and Sorrells ME (2002) Data mining for simple sequence repeats in expressed sequence tags from barlay, maiz, rice, sorghum and wheat. Plant Mol Biol 48:501-510
Katti MV, Ranjekar PK, Gupta VS (2001) Differential distribution of simple sequence repeats in eukaryotic genome sequences. Mol Biol Evol 18: 1161-1167
Kerby K, Kuspira J and Jones BL (1988) Biochemical data bearing on the relationship between the genome of Triticum urartu and the A and B genomes of the polyploid wheats. Genome 30(4):576-81
Khlestkina EK, Röder MS, Efremova TT, Börner A, Shumny VK (2004a) The genetic diversity of old and modern Siberian varieties of common spring wheat as determined by microsatellite markers. Plant Breeding 123:122-127
Khlestkina EK, Than MHM, Pestsova EG, Röder MS, Malyshev SV, Korzun V and Börner A (2004b) Mapping of 99 new microsatellite-derived loci in rye (Secale cereale L.) including 39 expressed sequence tags. Theor Appl Genet 109(4):725-32
Kim HS, Ward RW (1997) Genetic diversity in Eastern U.S. soft winter wheat (Triticum aestivum L. em. Thell.) based on RFLPs and coefficients of parentage. Theor Appl Genet 94: 472-479
Kölliker R, Jones ES, Drayton MC, Dupal MP , Forster JW (2001) Development and characterisation of simple sequence repeat (SSR) markers for white clover (Trifolium repens L.) Theor Appl Genet 102: 416 – 424


References
- 116 -
Kosambi DD (1944) The estimation of map distances from recombination values. Ann Eugen 12: 172-175
Krzanowski WJ (1995) The authentication of basmati rice using near infrared spectroscopy: some further analysis. J Near Infrared Spectrosc 3: 111-117
Kurata N, Moore G, Nagamura Y, Foote T, Yano M et al. (1994) Conservation of genomic structure between rice and wheat. Nat Biotechnol 12: 276-278
Lage J, Warburton ML, Crossa J, Skovmand B, Andersen SB (2003) Assessment of genetic diversity in synthetic hexaploid wheats and their Triticum dicoccum and Aegilops tauschii parents using AFLPs and agronomic traits. Euphytica 134: 305-317
Lagerkrantz U, Ellegren H, Anderson L (1993) The abundance of various polymorphic microsatellite motifs differs between plants and vertebrates. Nucl Acid Research 21: 1111-1115
Lagudah ES, Appels R and McNeil D (1991) The Nor-D3 locus of Triticum tauschii: natural variation and genetic linkage to markers in chromosome 5. Genome 34:384-394
Lander ES, Green P, Abrahamson J, Barlow A, Daly MJ, Lincoln SE, Newburg L (1987) MAPMAKER: An interactive computer package for constructing primary genetic linkage maps of experimental and natural populations. Genomics 1: 174-181
La Rota M, Sorrells ME (2004) Comparative DNA sequence analysis of mapped wheat ESTs reveals complexity of genome relationships between rice and wheat. Funct Integr Genomics 4: 34-46
Law CN, Snape JW, Worland AJ (1988) Aneuploidy in wheat and its uses in genetic analysis. In: Lupton FGH (ed) Wheat breeding: its scientific basis, pp 71–108
Le Clerc V, Bazante F, Baril C, Guiard J, Zhang D (2005) Assessing temporal changes in genetic diversity of maize varieties using microsatellite markers. Theor Appl Genet 110: 294-302
Lefort-Buson M, Hebert Y, Damerval C (1988) Les outils d’évaluation de la diversité génétique et phénotypique. Agronomie 8: 173-178
Lelley T, Stachel M, Grausgruber H, and Vollmann J (2000) Analysis of relationships between Aegilops tauschii and the D genome of wheat utilizing microsatellites. Genome 43:661-668
Leisova L, Ovesna J (2001) The use of microsatellite analysis for the identification of wheat varieties. Czech J Genet Plant Breed 37:29–33
Leroy P (1997a) IWMMN Report # 2, dated April 9, 1997
Leroy P (1997b) IWMMN Report # 5, dated December 18, 1997
Levinson G, Gutman GA (1987) Slipped-strand mispairing: a major mechanism for DNA sequence evolution. Mol Biol Evol 4: 203-221
Li C, Rossnagel GB, Scoles GJ (2000) The development of oats microsatellite markers and their use in identifying relationships among Avena species and oat cultivars. Theor Appl Genet 101: 1259 -1268
Li YC, Röder MS, Fahima T (2002) Genetic effects on microsatellite diversity in wild emmer wheat, Triticum dicoccoides, at Yehudiyya microsite. Heredity 89: 127-132


References
- 117 -
Lilienfeld FA, Kihara H (1934) Genomanalyse bei Triticum und Aegilops von H. Kihara.V. Triticum timopheevi Zhuk. Cytologia 6: 87-122
Litt M, Luty JA (1989) A hypervariable microsatellite revealed by in vitro amplification of a dinucleotide repeat within te cardiac muscle actin gene. Am. J. Hum. Genet. 44: 397-401
Liu F, Bothme RV, Salomon B (2000) Genetic diversity in European accessions of the Barley Core Collection as detected by isozyme electrophoresis. Genet Res Crop Evol 47(6): 571-581
Loridon K, Cournoyer B, Goubely C, Depeiges A, Picard G (1998) Length polymorphism and allele structure of trinucleotide microsatellites in natural accessions of Arabidopsis thaliana. Theor Appl Genet 97: 591-604
Maestra B, Naranjo T (1998) Homoeologous relationships of Aegilops speltoides chromosomes to bread wheat. Theor Appl Genet 97: 181-186
Maestri E, Malcevschi A, Massari A, Marmiroli N (2002) Genomic analysis of cultivated barley (Hordeum vulgare) using sequence-tagged molecular markers. Estimates of divergence based on RFLP and PCR markers derived from stress-responsive genes, and simple-sequence repeats (SSRs). Mol Genet Genomics 267:186–201
Majewski J and Ott J (2000) GT repeats are associated with recombination on human chromosome 22. Genome Res 10:1108-1114
Malosetti M, Abadie T (2001) Sampling strategy to develop a core collection of Utuguayan maize landraces based on morphological traits. Genet Res Crop Evol 48:381-390
Manifesto MM, Schlatter AR, Hopp HE, Suarez HE, Dubcovsky J (2001) Quantitative evaluation of genetic diversity in wheat germplasm using molecular markers. Crop Sci 41:682–690
Maric S, Bolaric S, Martincic J, Pejic I, Kozumplik V (2004) Genetic diversity of hexaploid wheat cultivars estimated by RAPD markers, morphological traits and coefficient of parentage. Plant Breeding 123: 366-369
Martinez I, Bernard M, Nicolas P, Bernard S (1994) Study of an androgenetic performance and molecular characterization of a set of wheat-rye addition lines. Theor Appl Genet 89: 982-990
Matsuoka Y, Mitchell SE, Goodman M, Doebley J, Kresovich S (2002) Microsatellites in Zea-variability, patterns of mutations, and use for evolutionary studies. Theor Appl Genet 104: 436-450
McFadden ES, Sears ER (1946) The origin of Triticum spelta and its free-threshinghexaploid relatives. J. Hered. 37: 81-89
McKhann H, Camilleri C, Bérard A, Bataillon T, David JL, Reboud X, Le Corre V, Caloustian C. Gut IG, Brunel D (2004) Nested core collections maximizing genetic diversity in Arabidopsis thaliana. Plant J 38:193-202
Menkir A, Kling JG, Badu-Apraku B, Ingelbrecht I (2005) Molecular marker-based genetic diversity assessment of Striga-resistant maize inbred lines. Theor Appl Genet 110: 1145-1153
Metakovsky EY, Branlard G (1998) Genetic diversity of French common wheat germplasm


References
- 118 -
based on gliadin alleles. Theor Appl Genet 96: 209-218
Metzgar D, Bytof J and Wills C (2000) selection against frameshift mutation limits microsatellit expansion in coding DNA.Genome Res 10: 72-80
Miyamoto MM, Cracraft J (1991) Phylogenetic analysis of DNA sequences. Oxford University Press, New York.
Mohammadi SA and Prasanna BM (2003)Analysis of genetic diversity in crop plants – salient statistical tools and considerations. Crop Sci 43:1235–1248
Moore G, Devos KM, Wang Z, Gale MD (1995) Grasses line-up and form a circle. Curr Biol 5: 737-739
Moore SS, Sargeant LL, King TJ, Mattick JS, George M, Hetzel JS (1991) the conservation of dinucleotide microsatellites among mammalian genomes allows the use of heterologous PCR primer pairs in closely related species. Genomics 10: 654-660
Morgan AR, Coulter MB, Flintoff WF, Paetkau VH. (1974) Enzymatic synthesis of deoxyribonucleic acids with repeating sequences. A new repeating trinucleotide deoxyribonucleic acid, d(T-C-C)n-d(G-G-A)n. Biochemistry. 13(8): 1596–1603.
Morgante M and Olivieri AM (1993) PCR-amplified microsatellites as markers in plant genetics. Plant J 3:175-182
Morgante M, Hanafey M, and Powell W (2002) Microsatellite are preferentially associated with nonrepetive DNA in plant genomes. Nature genetics 30:194-200
Munkvold JD, Greene RA, Bermudez-Kandianis CE, La Rota CM, Edwards H, Sorrells SF, Dake T, Bensher D, Kantety R, Linkiewicz AM, Dubcovsky J, Akhunov ED, Dvorak J, Miftahudin, Gustafson JP, Pathan MS, Nguyen HT, Matthews DE, Chao S, Lazo GR, Hummel DD, Anderson OD, Anderson JA, Gonzalez-Hernandez JL, peng JH, Lapitan N, Qi LL, Echalier B, Gill BS, Hossain KG, Kalavacharla V, Kianan SF, Sandhu D, Erayman M, Gill KS, McGuire PE, Qualset CO, Sorrells ME (2004) Group 3 chromosome bin maps of wheat and their relationship to rice chromosome 1. Genetics 168: 639-650
Murray EE, Lotzer J, Eberle M (1989) Codon usage in plant genes. Nucleic Acids Research 17(2):477-498
Nadir E, Margalit H, Gallil T, Ben Sasson SA (1996) Microsatellite spreading in the human genome. Evolutionary mechanisms and structural implications. Proc Natl Acad Sci USA 93: 6470-6475
Nakai Y (1978) Variation and geographical distribution of esterase zymograms in Aegilops squarrosa. Wheat Inf Serv 45: 21-25
Natarajan AT, Sharma NP (1974) Chromosome banding patterns and the origin of the B genome in wheat. Genet Res. 24: 103-108
Ni J, Colowit PM, Mackill DJ (2002) Evaluation of genetic diversity in rice subspecies using microsatellite markers. Crop Sci 42:601-607
Nicot N., V., Chiquet, B. V, Gandon, L. B, Amilhat, F. L, Legeai, P. F, Leroy, M. F, Bernard, M and P. Sourdille, P (2004:) Study of simple sequence repeat, (SSR:) markers from wheat expressed sequence tags, (ESTs:). Theor Appl Genet 109: 800-805


References
- 119 -
Nieto-Lopez RM, Casanova C, Soler D (2000) Evaluation and characterization of a collection of wild Spanish populations of the general Elymus and Thinopyrum using morphological and agronomical traits. Agronomie 20:111-122
Ogihara Y, Mochida K, Kawaura K, Murai K, Seki M, Kamiya A, Shinozaki K, Carninci P, Hayashizaki Y, Shin-I T, Kohara Y, Yamazaki Y (2004) Construction of a full-length cDNA library from young spikelets of hexaploid wheat and its characteization by large-scale sequencing of expressed sequence tags. Genes Genet Syst 79:227–232
Okamoto M (1962) Identification of the chromosomes of common wheat belong to the A and B genomes. Can J Genet Cytol 4: 31-37
Olivero M, Ruggiero T, Coltella N, Maffe A, Calogero R, Medico E, Di Renzo MF (2003) Amplification of repeat-containing transcribed sequences (ARTS): a transcriptome fingerprinting strategy to detect functionally relevant microsatellite mutations in cancer. Nucleic Acids Res. 31(7): 33-41
Ostrander, E.A., Jong, P.M., Rine, J., and Duyk, G. (1992) Construction of small-insert genomic DNA libraries highly enriched for microsatellite repeat sequences. Proc. Natl. Acad. Sci. 89: 3419-3423
Panaud O, Chen X, McCouch SR (1995) Frequency of microsatellite sequences in rice (Oryza sativa L.) Genome 38: 1170-1176
Poulsen GB, Kahl G, Weising K (1993) Abundance and polymorphism of simple repetitive DNA sequence in Brassica napus L. Theor Appl Genet 85: 994-1000
Potokina E, Prasad M, Malysheva L, Röder MS, Graner A (2006) Expression genetics and haplotype analysis reveal cis regulation of serine carboxypeptidase I (Cxp1), a candidate gene for malting quality in barley (Hordeum vulgare L.) Funct & Integr Genomics 6(1):25-35
Powell W, Machray GC, Provan J (1996) Polymorphism revealed by simple sequence repeats. Trends Plant Sci 7: 215-222
Powell W, Machray GC, Provan J (1996)Polymorphism revealed by simple sequence repeats. Trends Plant Sci 7: 215-222
PLASCHKE, J., M. W. GANAL, and M. S. RÖDER, 1995 Detection of genetic diversity in closely related bread wheat using microsatellite markers. Theor. Appl. Genet. 91:1001-1007
Prasad M, Varshney RK, Roy JK, Balyan HS, Gupta PK (2000) The use of microsatellites for detecting DNA polymorphism, genotype identification and genetic diversity in wheat. Theor Appl Genet 100:584–592
Rafalski and Tingey (1993) Genetics diagnostics in plant breeding: RAPDs, microsatellite and machines. Trends Genet 9:275-280
Ramsay L, Macaulay M, Cardle L, Morgante M, Ivanissevich SD, Maestri E, Powell W, Waugh R (1999) Intimate association of microsatellite repeats with retrotransposons and other dispersed repetitive elements in barley. Plant J 17: 415-425
Raupp WJ, Singh S, Brown-Guedira GL, Gill BS (2001) Cytogenetic and molecular mapping of the leaf rust resistance gene Lr39 in wheat. Theor. Appl. Genet. 102:

References
- 120 -
347–352
Ravel C, Praud S, Murigneux A, Linossier L, Dardevet M, Balfourier F, Dufour P, Brunel D and Charmet G (2005) Identification of Glu-B1-1 as a candidate gene for the quantity of high-molecular-weight glutenin in bread wheat (Triticum aestivum L.) by means of an association study. Theor. Appl. Genet. 112: 738-743
Rees H, Walters MR (1965) Nuclear DNA and the evolution of the wheat. Heredity 20: 73-82
Richard GF, Dujon B (1997) Trinucleotide repeats in yeast. Research in Microbiology 148: 731-744
Riley R, Unrau J, Chapman V (1958) Evidence on the origin of the B genome of wheat. J. Hered. 49: 91-98
Röder MS, Korzun V, Wendehake K, Plaschke J, Tixer MH, Leroy P and Ganal MW (1998) A microsatellite map of wheat. Genetics 149: 2007–2023
Röder MS, Plaschke J, Konig SU, Börner K, Sorrells ME, Tanksley SD, Ganal MW (1995) Abundance, variability chromosomal location of microsatellite in wheat. Mol Gen Genet 246:327-333
Röder MS, Wendehake K, Korzun V, Bredemeijer G, Laborie D, Bertrand L, Isaac P, Rendell S, Jackson J, Cooke R, Vosman B, Ganal M (2002) Construction and analysis of a microsatellite-based database of European wheat varieties. Theor Appl Genet 106:67-73
Rohrer GA, Alexander LJ, Keele JW, Smith TP, Beattie CW (1994) A microsatellite linkage map of the porcine genome. Genetics 136: 231-245
Rongwen J, Akkaya MS, Bhagwat AA, Lavi U, Cregan PB (1995) The use of microsatellite DNA markers for soybean genotype identification. Theor Appl Genet 90: 43-48
Rossetto M, McNally J, J. Henry R (2002) Evaluating the potential of SSR flanking regions for examining taxonomic relationships in the Vitaceae. Theor Appl Genet 104: 61-66
Roussel V, Koenig J, Beckert M, Balfourier F (2004) Molecular diversity in French bread wheat accessions related to temporal trends and breeding programmes. Theor Appl Genet 108: 920-930
Roussel V, Leisova L, Exbrayat F, Stehno Z, Balfourier F (2005) SSR allelic diversity changes in 480 European bread wheat varieties released from 1840 to 2000. Theor Appl Genet 111: 162-170
Roy JK, Lakshmikumaran MS, Balyan HS, Gupta PK (2004) AFLP-based genetic diversity and its comparison with diversity based on SSR, SAMPL, and phenotypic traits in bread wheat. Biochemical Genetics 42: 43-59
Rudd S (2003) Expressed sequence tags, alternative or complement to whole genome sequences? Trends Plant Sci 8:321-329
Ruiz M, Metakovsky EV, Rodriguez-Quijano M, Vazquez JF, Carillo JM (2002) Assessment of storage protein variation in relation to some morphological characters in a sample of Spanish landraces of common wheat (Triticum aestivum L. spp.


References
- 121 -
aestivum). Genet Res Crop Evol 49: 371-382
Russell JR, Fuller JD, Macaulay M, Hatz BG, Jahoor A, Powell W and Waugh R (1997) Direct comparison of level of genetic variation among barley accessions detected by RFLPs, AFLPs, SSRs and RAPDs. Theor Appl Genet 95 : 714 -722
Russell JR, Booth A, Fuller JD, Baum M, Ceccarelli S, Grando S, Powell W (2003) Patterns of polymorphism detected in the chloroplast and nuclear genomes of barley landraces sampled from Syria and Jordan. Theor Appl Genet 107: 413-421
Russell J, Booth A, Harrower B, Hedley P, Machray G, Powell W (2004) A comparison of sequence-based polymorphism and haplotype content in transcribed and anonymous regions of the barley. Genome 47:389–398
Saal B, Wricke G (1999) Development of simple sequence repeat markers in rye (Secale cereale L.). Genome 42:964-972
Sabot F, Guyot R, Wicker T, Chantret N, Laubin B, Chalhoub B, Leroy P, Sourdille P, Bernard M (2005) Updating transposable elements annotations from large wheat genomic sequences reveals diverse activities and gene association of elements. Mol Gen Genet (DOI: 10.1007/s00438-005-0012-9)
Saghai-Maroof MA, Biyashev RM, Yang GP, Zhang Q, Allard RW (1994) Extraordinarily polymorphic microsatellite DNa in barley: species diversity, chromosomal locations and population dynamics. Proc Natl Acad Sci USA 91: 5466-5470
Saha MC, Mian MAR, Eujayl I; Zwonitzer JC; Wang, LJ, May GD (2004) Tall fescue EST-SSR markers with transferability across several grass species, Theor. Appl. Genet. 109:783–791
Sakamura T (1918) Kurze Mitteilung über die Chromosomenzahlen und die Verwandtschafts-verhaltnisse der Triticum. Arten. Bot. Mag. (Tokyo) 32: 15-154
Samadi S, Erard F, Estoup A, Jarne P (1998) The influence of mutation, selection and reproductive systems on microsatellite variability: a simulation approach. Genetical Research 71: 213-222
Sarkar P, Stebbin GL (1956) Morphological evidence concerning the origin of the B genome of wheat. Am. J. Bot. 43: 297-304
Salhi-Hannachi Amel , Chatti Khaled, Mars Messaoud, Marrakchi Mohamed and Trifi Mokhtar (2005) Comparative Analysis of Genetic Diversity in Two Tunisian Collections of Fig Cultivars Based on Random Amplified Polymorphic DNA and Inter Simple Sequence Repeats Fingerprints. Genet Res Crop Evol 52: 563 - 573
Sasanuma T, Chabane K, Endo TR, Valkoun J (2002) Genetic diversity of wheat wild relatives in the Near East detected by AFLP. Euphytica 127: 81-93
Sax K (1922) Sterility in wheat hybrids. II. Chromosome behavior in partially sterile hybrids. Genetics 7: 513-552
Schlotterer C (1998) Are microsatellites really simple sequence? Curr Biol 8:R132-R134
Schlotterer C and Tautz D (1992) Slippage synthesis of simple sequence DNA. Nucleic Acids Res 20:211-215
Schlotterer C, Ritter R, Harr B and Brem G (1998) High mutation rates of log microsatellite allele in Drosophila melanogaster provide evidence for allele specific


References
- 122 -
mutation rates. Mol Biol Evol 15: 1269 – 1274
Schmidt T, Boblenz K, Metzlaff M, Kaemmer D, Weising K, Kahl G (1993) DNA fingerprinting in sugar beet (Beta vulgaris) – identification of double-haploid breeding lines. Theor Appl Genet 85: 653-657
Schug MD, Wetterstrand KA, Gaudette MS, Lim RH, Hutter CM, Aquadro CF (1998) The distribution and frequency of microsatellite loci in Drosophila melanogaster. Mol Ecol 7(1):57-70
Scott KD, Eggler P, Seaton G, Rossetto M, Ablett EM, Lee LS, Henry RJ (2000) Analysis of SSRs derived from grape ESTs. Theor Appl Genet 100:723–726
Scotti I, Vendramin GG, Matteotti LS, Scarponi C, Sari-Gorla M, Binelli G (2000) Postglacial recolonization routes for Picea abies K. in Italy as suggested by tha analysis of sequence-characterized amplified reion (SCAR) markers. Molecular Ecology 9: 699-708
Sears ER (1954) The aneuploids of common wheat. Mo Agric Exp Sta Res Bull 572: 1-58
Sears ER (1966) Nullisomic-tetrasomic combinations in hexaploid wheat. In: Riley R, Lewis KR (eds) Chromosome manipulation and plant genetics. Oliver and Boy, London, pp 29–45
Senior ML, Heun M (1993) Mapping maize microsatellites and polymerase chain reaction confirmation of the targeted repeats using a CT primer. Genome 36: 884-889
Shen SH, Slighton JL, Smithies O (1981) A history of the human fetal globin gene duplication. Cell 26, 191−203
Sia EA, Kokoska RJ, Dominska M, reenwell P and Petes TD (1997) Microsatellite instability in yeast: dependence on repeat unit size and DNA mismatch repair genes. Mol & Cell Bio 17 5) : 2851-2858
Sjakste T, Rashal I, Röder M (2002) Inheritance of microsatellite alleles in pedigrees of Latvian barley varieties and related European ancestors. Theor Appl Genet 106: 539-549
Smith JSC, Chin ECL , Shu H , Smith OS , Wall SJ , Senior ML , Mitchell SE, Kresovich S, Ziegle J (1997) An evaluation of the utility of SSR loci as molecular markers in maize (Zea mays L.): comparisons with data from RFLPS and pedigree. Theor Appl Genet 95: 163 - 173
Soleimani VD, Baum BR, Johnson DA (2002) AFLP and pedigree-based genetic diversity estimates in modern cultivars of durum wheat [Triticum turgidum L. subsp. durum (Desf.) Husn.] Theor Appl Genet 104: 350-357
Somers DJ, Isaac P, Edwards K (2004) A high-density microsatellite consensus map for bread wheat (Triticum aestivum L.). Theor Appl Genet 109: 1105-1114
Sorrells ME, Wilson WA (1997) Direct classification and selection of superior alleles for crop improvement. Crop Sci 37:691-697
Sorrells ME, La Rota M, Bermudez-Kandianis CE, Greene RA, Kantety R et al. (2003) Comparative DNA sequence analysis of wheat and rice genomes. Genome Res 13 : 1818-1827
Sourdille P, Cadalen T, Guyomarc’h H, Snape JW, Perretant MR, Charmet G, Boeuf C,


References
- 123 -
Bernard S, Bernard M (2003) An update of the Courtot x Chinese Spring intervarietal molecular marker linkage map for QTL detection of agronomic traits in wheat. Theor Appl Genet 106: 530-538
Sourdille P, Singh S, Cadalen T, Brown-Guedira GL, Gay G, Qi L, Gill BS, Dufour P, Murigneux A, Bernard M (2004) Microsatellite-based deletion mapping system for the establishment of genetic map – physical map relationships in wheat. Funct Integr Genomics 4: 12-25
Stachel M, Lelley T, Grausgruber H, Vollmann J (2000) Application of microsatellites in wheat (Triticum aestivum L.) for studying genetic differentiation caused by selection for adaptation and use. Theor Appl Genet 100:242-248
Stallings RL (1994) Distribution of trinucleotide microsatellites in different categories of mammalian genomic sequence: implications for human genetic diseases. Genomic 21: 116-121
Stephenson P, Bryan G, Kirby J, Collins A, Devos K, Busso C, Gale M(1998) Fifty new microsatellite loci for the wheat genetic map. Theor Appl Genet 97: 946-949
Streisinger G, Okada Y, Emrich J, Newton J, Tsugita A, Terzaghi E, Inouye M.Streisinger G, Okada Y, Emrich J, Newton J, Tsugita A, Terzaghi E, Inouye M. (1966) Frameshift mutations and the genetic code. Cold Spring Harb Symp Quant Biol. 31: 77-84.
Struss D, Plieske J (1998) The use of microsatellite markers for detection of genetic diversity in barley populations. Theor Appl Genet 97: 308-31
Subramanian S, Mishra PK, and Singh L (2003) Genome-wide analysis of microsatellite repeats in humans, their abundance and density in specific genomic region. Gemone Biol 4:R13
Tams SH, Bauer E, Oettler G and Melchinger AE (2004) Genetic diversity in European winter triticale determinated with SSR markers and coancestry coefficient. Theor Appl Genet 108: 1385-1391
Tanyolac B, Linton E, Ozkan H (2003) Low genetic diversity in wild emmer (T. turgidum L. subsp. dicoccoides (Körn. ex Asch. et Graebn.) Thell.) from South-eastern Turkey revealed by Restriction Fragment Length Polymorphism. Genet Res Crop Evol 50: 829-833
Tanyolac B (2003) Inter-simple sequence repeat (ISSR) and RAPD variation among wild barley (Hordeum. vulgare subsp. spontaneum) populations from west Turkey. Genet Res Crop Evol 50: 611 - 614
Tarter JA, Goodman MM, Holland JB (2004) Recovery of exotic alleles in semiexotic maize inbreds derived from crosses between Latin American accessions and a temperate line. Theor Appl Genet 109: 609-617
Tautz D (1989) Hypervariability of simple sequences as a general source for polymorphic DNA markers. Nucleic Acid Research 12: 6463-6471
Tautz D (1993) Notes on the definition and nomenclature of tandemly repetitive DNA sequences, In: Pena SDJ, Chakraborty JT, Epplen JT and Jeffreys AJ (eds), DNA Fingerprinting: State of the Science. Birkhäuser Verlag Basel, Switzerland, pp 21-28.
Tautz D, Rentz M (1984) Simple sequences are ubiquitous repetitive components of eukaryotic genomes. Nucleic Acid Res 12: 4127-4138


References
- 124 -
Tautz D, Trick M, Dover GA (1986) Cryptic simplicity in DNA is a major source of genetic variation. Nature 322: 652-656
Thiel T, Michalek W, Varshney RK, Graner A (2003) Exploiting EST databases for the development and characterization of gene-derived SSR-markers in barley (Hordeum vulgare). Theor Appl Genet 106:411-422
Thomas MR, Scott NS (1993) Microsatellite repeats in grapevine reveal DNA polymorphisms when analysed as sequence-tagged sites (STSs). Theor Appl Genet 86: 985-990
Thuillet AC, Bru D, David J, Roumet P, Santoni S, Sourdille P, Bataillon T (2002) Direct estimation of mutation rate for 10 microsatellite loci in durum wheat, Triticum turgidum Thel ssp durum desf. Mol Biol & Evol 19: 122-125
Thuillet AC, Bataillon T, Sourdille P, David J (2004) Factors affecting polymorphism at microsatellite loci in bread wheat (Triticum aestivum L. Thell): effects of mutation processes and physical distance from the centromere. Theor Appl Genet 108: 368-377
Toth G, Gaspari Z, Jurka J (2000) Microsatellite in different eukaryotic genomes: survey and analysis. Genome Research 10: 967-981
Treco D and Arnheim N (1986) The evolutionarily conserved repetitive sequence d(TG.AC)n promotes reciprocal exachange and generates unusual recombinant tetrads during yeast. Mol Cell Biol 6: 3934-3947
Turpeinen M, Vanhala T, Nevo E, Nissila E (2003) AFLP genetic polymorphism in wild barley (Hordeum spontaneum )populations in Israel. Theor Appl Genet 106: 1333-1339
Udupa SM, Baum M (2001) High mutation rate and mutational bias at (TAA)n microsatellite loci in chickpea (Cicer arietinum L.). Mol Genet Genomics 265: 1097 -1103
Terzi V, Pecchioni N, Faccioli P, Kuera L, Stanca AM (2001) Phyletic relationships within the genus Hordeum using PCR-based markers. Genet Res Crop Evol 48: 447 - 45
Van Deynze AE, Nelson JC, Yglesias ES, Harrington SE, Braga DP et al. (1995) Comparative mapping in grasses. Wheat relationships. Mol Genet Genomics 248 : 744-754
Varshney RK, Sigmund R, Borner A, Korzun V, Stein N, Sorrells MS, Langridge P and Graner A (2005) Interspecific transferability and comparative mapping of barley EST-SSR markers in wheat, rye and rice. Plant Sci. 168, 195–202
Varshney RK, Thiel T, Stein N, Langridge P and Grande A (2002) In silico analysis on frequency and distribution of microsatellites in ESTs of some cereal species. Cellular & Molecular Biology Letters 7: 537-546
Vedel F, Delseny M (1987) Repetitivity and variability of higher-plant genomes. Plant Physiol. Biochem. 25: 191-210
Vos P, Hogers R, Bleeker M, Reijans M, Van de Lee T, Hornes M, Frijters A, pot J, peleman J, Kuiper M, Zabeau M (1995) AFLP: a new technique for DNA fingerprinting. Nucleic Acids Res. 23: 4407-4414
Wang AJH, Quigley GJ, Kolpak FJ, Crawford JL, Vanboom JH, Vandermarel G, Rich A


References
- 125 -
(1979) Molecular structure of a left handed double helical DNA fragment at atomic resolution. Nature 282, 680−686 (1979).
Wang Z, Weber JL, Zhong G and Tanksley SD (1994) Survey of plant short tandem DNA repeats. Theor Appl Genet 88:1-6.
Wang GZ, Miyashita NT and Tsunewaki K (1997) Plasmon analyses of Triticum (wheat) and Aegilops: PCR-single-strand conformational polymorphism (PCR-SSCP) analyses of organellar DNAs. PNAS 94: 14570-14577
Wang YH, Liu SJ, Ji SL, Zhang WW, Wang CM, Jiang L, Wan J M (2002) Fine mapping and marker-assisted selection (MAS) of a low glutelin content gene in rice. Cell Res 15(8):622-30
Ward RW, Yang ZL, Kim HS, Yen C (1998) Comparative analyses of RFLP diversity in landraces of Triticum aestivum and collections of T. tauschii from China and Southwest Asia. Theor Appl Genet 96:312-318
Weber JL (1990) Informativeness of human (dC-dA)n.(dG-dT)n poymorphisms Genomics 7:524-530
Weber JL, May PE (1989) Abundant class of human DNA polymorphisms which can be typed using the polymerase chain reaction –Am. J. Hum. Genet. 44: 388-396
Weintraub H, Groudine M (1976) Chromosomal subunits in active genes have an altered conformation. Science 193, 848−856
Weising K, Winter P, Huttel B and Kahl G (1998). Microsatellite markers for molecular breeding. J Crop Production 1: 113–143
Weissenbach J, Gyapay G, Dib C, Vignal A, Morissette J, Millasseau P, Vaysseix G and Lathrop,M (1992) A second-generation linkage map of the human genome. Nature 359: 794–801
Wells RD, Ohtsuka E, Khorana HG (1965) Studies on polynucleotides. L. Synthetic deoxyribopolynucleotides as templates for the DNA polymerase of Escherichia coli: a new double-stranded DNA-like polymer containing repeating dinucleotide sequences. J Mol Biol. 14(1): 221-37.
Wicker T, Yahyaoui N, Guyot R, Schlagenhauf E, Liu ZD, Dubcovsky J, Keller B (2003) Rapid genome divergence at orthologous low molecular weight glutenin loci of the A and Am genomes of wheat. Plant Cell 15: 1186-1197
Williams JGK, Kubelik AR, Livak KJ, Rafalski JA, Tingey SV (1990) DNA polymorphisms amplified by arbitrary primers are useful as genetic marker. Nucl Acid Res 18:6531-6535
Wolf RK, Plaetke R, Jeffreys AJ, White R (1989) Unequal crossing over between homologous chromosomes is not the major mechanism involved in the generation of new alleles at VNTR loci. Genomics 5: 382-384
Woodhead M, Russell J, Squirrell J, Hollingsworth PM, Cardle L, Ramsay L, Gibby M and Powell W (2003) Development of EST-SSRs from the Alpine Lady-fern, Athyrium distentifolium. Molecular Ecology Notes 3: 287-290
Wren JD, Forgacs E, Fondon JW (2000) Repeat polymorphisms within gene region: Phenotypic and evolutionary implications. American Journal of Human Genetics

References
- 126 -
67:345-356
Wu KS, Tanksley SD (1993) Abundancen polymorphism and genetic mapping of microsatellites in rice. Mol Gene Genet 241: 225-235
Yamanaka S, Suzuki E, Tanaka M, Takeda Y, Watanabe JA, Watanabe KN (2003) Assessment of cytochrome P450 sequences offers a useful tool for determining genetic diversity in higher plant species. Theor Appl Genet 108:1–9
Yanagisawa T, Kiribuchi-Otobe C, Hirano H, Suzuki Y, Fujita M (2003) Detection of single nucleotide polymorphism (SNP) controlling the waxy character in wheat by using a derived cleaved amplified polymorphic sequence (dCAPS) marker. Theor Appl Genet 107: 84-88
Yu J, Lu H, Bernardo R (2001) Inconsistency between SSR groupings and genetic backgrounds of white corn inbreds. Maydica 46:133-139
Yu JK, La Rota M, Kantety RV and Sorrells ME (2004a) EST derived SSR markers for comparative mapping in wheat and rice. Molecular Genetics and Genomics 271(6):742-51
Yu JK, Dake TM, Singh S, Benscher D, Li WL, Gill B and Sorrells ME (2004b) Development and mapping of EST-derived simple sequence repeat markers for hexaploid wheat. Genome 47:805-818
Yu SB, Xu WJ, Vijayakumar CHM, Ali J, Fu BY, Xu JL, Jiang YZ, Marghirang R, Domingo J, Aquino C, Virmani SS, Li ZK (2003) Molecular diversity and multilocus organization of the parental lines used in the International Rice Molecular Breeding Program. Theor Appl Genet 108: 131-140
Zhang W, Qu LJ, Gu H, Gao W, Liu M, Chen J and Chen Z (2002) Studies on the origin and evolution of tetraploid wheats based on the internal transcribed spacer (ITS) sequences of nuclear ribosomal DNA. Theor Appl Genet 104:1099-1106
Zhang LS, Becquet V, Li SH and Zhang D (2003) Optimization of multiplex PCR and multiplex gel electrophoresis in sunflower SSR analysis using infrared fluorescence and tailed primers. Acta Botanica Sinica 45(11): 1312-1318
Zhou H, Xie Z, Ge S (2003) Microsatellite analysis of genetic diversity and population genetic structure of a wild rice (Oryza rufipogon Griff.) China. Theor Appl Genet 107:332-339
Zietkiewicz E, Rafalski A and Labuda D (1994) Genome fingerprinting by simple sequence repeat (SSR)-anchored polymerase chain reaction amplification. Genomics 20, 176-183.


ANNEXES


Fifteen international agriculturalresearch centres supported by the
CGIAR


Annex 1
Fifteen international agriculture Research centres:
Africa Rice Center (WARDA)
CIAT - Centro Internacional de Agricultura Tropical
CIFOR – Center for International Forestry Research
CIMMYT – Centro Internacional de Mejoramiento de Maiz y Trigo
CIP – Centro Internacional de la Papa
ICARDA – International Center for Agricultural Research in the Dry Areas
ICRISAT – International Crops Research Institute for the Semi-Arid Tropics
IFPRI – International Food Policy Research Institute
IITA – International Institute of Tropical Agriculture
ILRI – International Livestock Research Institute
IPGRI – International Plant Genetic Resources Institute
IRRI – International RICE Research Institute
IWMI – International Water Management Institute
World Agroforestry Centre (ICRAF)
World Fish Venter


The list of plant genotypes used for transferability assessment and phylogenetic
analysis


Annex 2
Annex 2
phylogenetic analyses
Species Sub-species Genome Accession Country Code
A 4 AFG TAE-A4
AIFENG NO 4 CHN TAE-AIFENG
APACHE FRA TAE-APACHE
AURORE AUS TAE-AUTORE
BALKAN YUG TAE-BALKAN
CHINESE SPRING CHN TAE-CHINESE
CHORTANDINKA RUS TAE-CHORTA
CHYAMTANG NPL TAE-CHYAMT
COPPADRA TUR TAE-COPPAD
COTIPORA BRA TAE-COTIPO
GLEANLEA CAN TAE-GLENLE
GOBOLLOI 15 HUN TAE-GOBOLL
HOPEA FIN TAE-HOPEA
M708/G25/N163 ISR TAE-M708/G
MISKAAGANI LBN TAE-MISKAA
MOCHO DE ESPIGA BRANCA PRT TAE-MOCHO
NP 120 IND TAE-NP120
NYU DAY JPN TAE-NYUDAY
OPAL DEU TAE-OPAL
ORNICAR FRA TAE-ORNICA
PITIC 62 MEX TAE-PITIC
SEUSEUN 27 KOR TAE-SEUSEU
ZANDA BEL TAE-ZANDA
EPEAUTRE BLANC FRA TSP-BLANC
EPEAUTRE BLOND OU DORE FRA TSP-BLOND
EPEAUTRE DE L’AVEYRON FRA TSP-AVEYRO
EPEAUTRE NAIN BEL TSP-NAIN
EPEAUTRE NOIR VELU FRA TSP-NOIR
CANUTO GBR TCO-CANUTO
MIDEA ITA TCO-MIDEA
RYMAR USA TCO-RYMAR
KUBBWEISEN SWE TCO-KUBBWE
LO TO MAI CHN TCO-LOTOMA
TSPHAEROCOCCUM FRA TSH-SPHAER
LANDRACE 1 IND TSH-LAND01
LANDRACE 2 IND TSH-LAND02
LANDRACE 3 PAK TSH-LAND03
81128 AFG TSH-81128
TMACHA FRA TMA-MACHA
LANDRACE 4 GEO TMA-LAND04
LANDRACE 5 GEO TMA-LAND05
List of the accessions used for transferability assessment and
AABBDD
T. aestivum
aestivum AABBDD
spelta AABBDD
compactum AABBDD
sphaerococcum AABBDD
macha
- 1 -

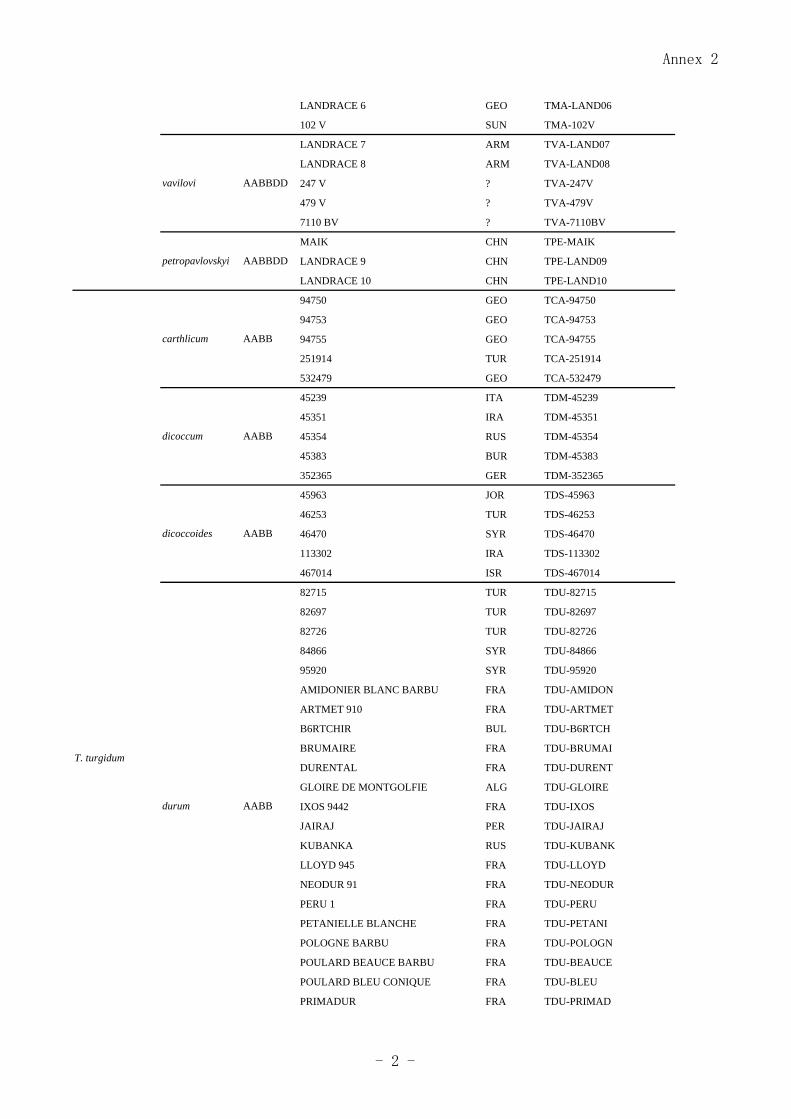
Annex 2
LANDRACE 6 GEO TMA-LAND06
102 V SUN TMA-102V
LANDRACE 7 ARM TVA-LAND07
LANDRACE 8 ARM TVA-LAND08
247 V ? TVA-247V
479 V ? TVA-479V
7110 BV ? TVA-7110BV
MAIK CHN TPE-MAIK
LANDRACE 9 CHN TPE-LAND09
LANDRACE 10 CHN TPE-LAND10
94750 GEO TCA-94750
94753 GEO TCA-94753
94755 GEO TCA-94755
251914 TUR TCA-251914
532479 GEO TCA-532479
45239 ITA TDM-45239
45351 IRA TDM-45351
45354 RUS TDM-45354
45383 BUR TDM-45383
352365 GER TDM-352365
45963 JOR TDS-45963
46253 TUR TDS-46253
46470 SYR TDS-46470
113302 IRA TDS-113302
467014 ISR TDS-467014
82715 TUR TDU-82715
82697 TUR TDU-82697
82726 TUR TDU-82726
84866 SYR TDU-84866
95920 SYR TDU-95920
AMIDONIER BLANC BARBU FRA TDU-AMIDON
ARTMET 910 FRA TDU-ARTMET
B6RTCHIR BUL TDU-B6RTCH
BRUMAIRE FRA TDU-BRUMAI
DURENTAL FRA TDU-DURENT
GLOIRE DE MONTGOLFIE ALG TDU-GLOIRE
IXOS 9442 FRA TDU-IXOS
JAIRAJ PER TDU-JAIRAJ
KUBANKA RUS TDU-KUBANK
LLOYD 945 FRA TDU-LLOYD
NEODUR 91 FRA TDU-NEODUR
PERU 1 FRA TDU-PERU
PETANIELLE BLANCHE FRA TDU-PETANI
POLOGNE BARBU FRA TDU-POLOGN
POULARD BEAUCE BARBU FRA TDU-BEAUCE
POULARD BLEU CONIQUE FRA TDU-BLEU
PRIMADUR FRA TDU-PRIMAD
T. turgidum
carthlicum AABB
dicoccum AABB
dicoccoides AABB
durum AABB
vavilovi AABBDD
petropavlovskyi AABBDD
- 2 -


Annex 2
VILLEMUR FRA TDU-VILLEM
14140 ? TPO-14140
45274 TUR TPO-45274
68405 ? TPO-68405
330554 CHY TPO-330554
384266 ETH TPO-384266
7786 ETH TTU-7786
134952 POR TTU-134952
191104 SPA TTU-191104
341300 TUR TTU-341300
387456 ETH TTU-387456
68191 ? TMO-68191
68206 ? TMO-68206
68212 ? TMO-68212
74036 ? TMO-74036
81051 ? TMO-81051
68182 ? TBE-68182
68183 ? TBE-68183
68184 ? TBE-68184
68185 ? TBE-68185
68186 ? TBE-68186
77089 ? TUR-77089
77090 ? TUR-77090
78092 ? TUR-78092
78096 ? TUR-78096
78097 ? TUR-78097
8 ? AESPEL-8
25 ? AESPEL-25
37 ? AESPEL-37
38 ? AESPEL-38
3 ? AESEAR-3
4 ? AESEAR-4
CLAE 70 ? AEBIC-70
CLAE 47 1323 ? AEBIC-47
CLAE PI 330486 ? AEBIC-330
1 ? AELON-1
PI 604110 AEG-280-37 ? AELON-604
13 ? AETAU-13
15 ? AETAU-15
32 ? AETAU-32
33 ? AETAU-33
42 ? AETAU-42
CLAE 6614 A ? AEUMB-6614
PI 222762 1823 ? AEUMB-222
PI 487202 SY20160 ? APE-487202
PI 487278 SY20240 ? APE-487278
PI 54217684 TK 157008 ? ACO-542176
Ae. peregrina UUSvSv
Ae. tauschii DD
Ae. umbellulata UU
Ae. bicornis SbSb
Ae. longissima SlSl
Ae. speltoides SS
Ae. searsii SsSs
AABB
turgidum AABB
T. monococcum
monococcum AmAm
boeoticum AbAb
urartu AuAu
polonicum
- 3 -


Annex 2
PI 551039 JM 3738 ? ACO-551039
PI 551047 JM 3856 ? ACO-551047
10 ? AEVEN-10
11 ? AEVEN-11
17 ? AEVEN-17
ALEXIS ? HVU-ALEXIS
CFL 86 126 ? HVU-CFL86
MOREX ? HVU-MOREX
PLAISANT ? HVU-PLAISA
STEPTOE ? HVU-STEPTO
APART ? SCE-APART
DANKOWSKYNOWE ? SCE-DANKOW
MERKATOR ? SCE-MERKAT
PROTECTOR ? SCE-PROTEC
SCW 3 ? SCE-SCW3
Ampiac FRA TRITI-AMPI
Bienvenu FRA TRITI-BIEN
Matinal FRA TRITI-MATI
Tricolor FRA TRITI-TRIC
Lamberto POL TRITI-LAMB
Zeus FRA TRITI-ZEUS
Trimaran FRA TRITI-MATRA
Carnac FRA TRITI-CAMA
Clerpin FRA LOLIUM-CLE
Clerpin Pature FRA LOLIUM-PAT
Herbie NL LOLIUM-HER
Kerval FRA LOLIUM-KER
Magella NL LOLIUM-MAG
Ohio NL LOLIUM-OHI
Kassandra GRC AVENA-KASS
Pol SWE AVENA-POL
Revisor DEU AVENA-REVI
Rhea FRA AVENA-RHEA
Tomba DEU AVENA-TOMB
Pa91 ? ZEA-PA91
B73 ? ZEA-B73
F2 ? ZEA-F2
Mo4 ? ZEA-MO4
A188 ? ZEA-A188
AZUCENA ? ORYZA-AZU
KASACATM ? ORYZA-KASA
NIPPONBARE ? ORYZA-NIPP
KONL ? ORYZA-KONL
IR64 ? ORYZA-IR64
sylvaticum ? BRACH-SYLV
distachyum ? BRACH-DIST
Avena sativa
Zea mays
Oryza sativa
Ae. ventricosa DDMvMv
Hordeum vulgare HH
Brachypodium
Secale cereale RR
Tritical
Lolium perenne
Ae. comosa subven MM
- 4 -


List of EST-SSRs developed from common wheat

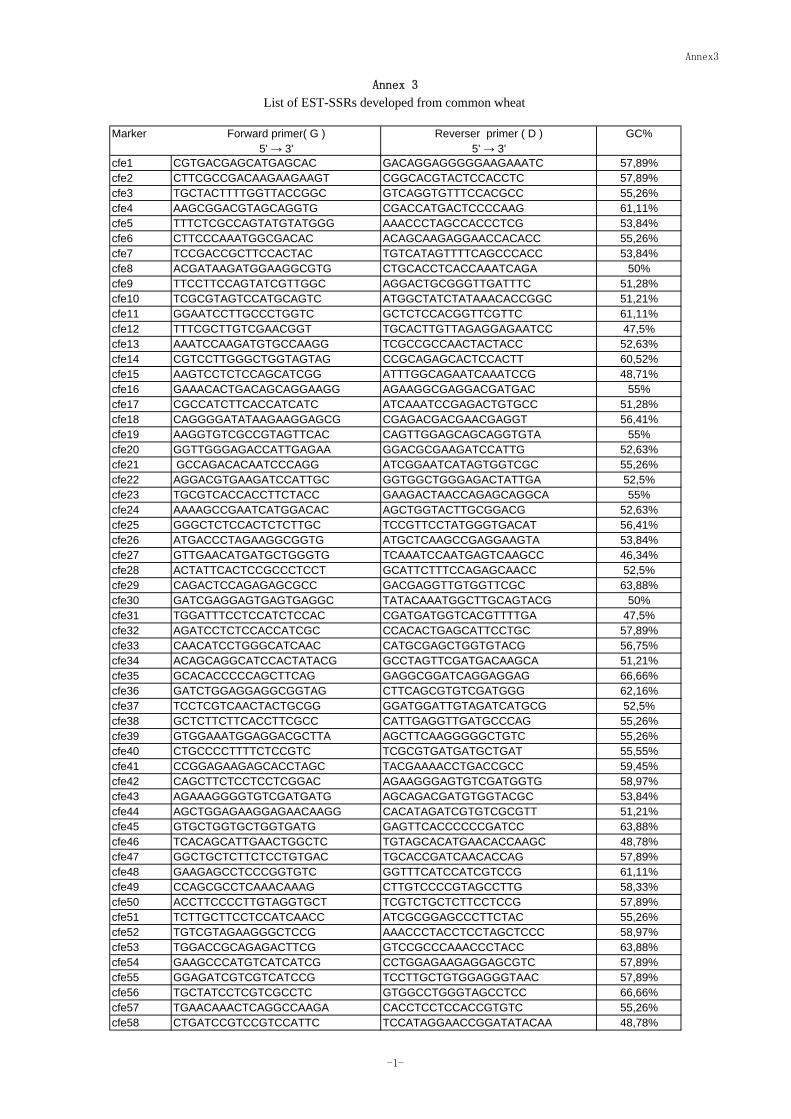
Annex3
Marker Forward primer( G ) Reverser primer ( D ) GC%5' → 3' 5' → 3'
cfe1 CGTGACGAGCATGAGCAC GACAGGAGGGGGAAGAAATC 57,89%cfe2 CTTCGCCGACAAGAAGAAGT CGGCACGTACTCCACCTC 57,89%cfe3 TGCTACTTTTGGTTACCGGC GTCAGGTGTTTCCACGCC 55,26%cfe4 AAGCGGACGTAGCAGGTG CGACCATGACTCCCCAAG 61,11%cfe5 TTTCTCGCCAGTATGTATGGG AAACCCTAGCCACCCTCG 53,84%cfe6 CTTCCCAAATGGCGACAC ACAGCAAGAGGAACCACACC 55,26%cfe7 TCCGACCGCTTCCACTAC TGTCATAGTTTTCAGCCCACC 53,84%cfe8 ACGATAAGATGGAAGGCGTG CTGCACCTCACCAAATCAGA 50%cfe9 TTCCTTCCAGTATCGTTGGC AGGACTGCGGGTTGATTTC 51,28%cfe10 TCGCGTAGTCCATGCAGTC ATGGCTATCTATAAACACCGGC 51,21%cfe11 GGAATCCTTGCCCTGGTC GCTCTCCACGGTTCGTTC 61,11%cfe12 TTTCGCTTGTCGAACGGT TGCACTTGTTAGAGGAGAATCC 47,5%cfe13 AAATCCAAGATGTGCCAAGG TCGCCGCCAACTACTACC 52,63%cfe14 CGTCCTTGGGCTGGTAGTAG CCGCAGAGCACTCCACTT 60,52%cfe15 AAGTCCTCTCCAGCATCGG ATTTGGCAGAATCAAATCCG 48,71%cfe16 GAAACACTGACAGCAGGAAGG AGAAGGCGAGGACGATGAC 55%cfe17 CGCCATCTTCACCATCATC ATCAAATCCGAGACTGTGCC 51,28%cfe18 CAGGGGATATAAGAAGGAGCG CGAGACGACGAACGAGGT 56,41%cfe19 AAGGTGTCGCCGTAGTTCAC CAGTTGGAGCAGCAGGTGTA 55%cfe20 GGTTGGGAGACCATTGAGAA GGACGCGAAGATCCATTG 52,63%cfe21 GCCAGACACAATCCCAGG ATCGGAATCATAGTGGTCGC 55,26%cfe22 AGGACGTGAAGATCCATTGC GGTGGCTGGGAGACTATTGA 52,5%cfe23 TGCGTCACCACCTTCTACC GAAGACTAACCAGAGCAGGCA 55%cfe24 AAAAGCCGAATCATGGACAC AGCTGGTACTTGCGGACG 52,63%cfe25 GGGCTCTCCACTCTCTTGC TCCGTTCCTATGGGTGACAT 56,41%cfe26 ATGACCCTAGAAGGCGGTG ATGCTCAAGCCGAGGAAGTA 53,84%cfe27 GTTGAACATGATGCTGGGTG TCAAATCCAATGAGTCAAGCC 46,34%cfe28 ACTATTCACTCCGCCCTCCT GCATTCTTTCCAGAGCAACC 52,5%cfe29 CAGACTCCAGAGAGCGCC GACGAGGTTGTGGTTCGC 63,88%cfe30 GATCGAGGAGTGAGTGAGGC TATACAAATGGCTTGCAGTACG 50%cfe31 TGGATTTCCTCCATCTCCAC CGATGATGGTCACGTTTTGA 47,5%cfe32 AGATCCTCTCCACCATCGC CCACACTGAGCATTCCTGC 57,89%cfe33 CAACATCCTGGGCATCAAC CATGCGAGCTGGTGTACG 56,75%cfe34 ACAGCAGGCATCCACTATACG GCCTAGTTCGATGACAAGCA 51,21%cfe35 GCACACCCCCAGCTTCAG GAGGCGGATCAGGAGGAG 66,66%cfe36 GATCTGGAGGAGGCGGTAG CTTCAGCGTGTCGATGGG 62,16%cfe37 TCCTCGTCAACTACTGCGG GGATGGATTGTAGATCATGCG 52,5%cfe38 GCTCTTCTTCACCTTCGCC CATTGAGGTTGATGCCCAG 55,26%cfe39 GTGGAAATGGAGGACGCTTA AGCTTCAAGGGGGCTGTC 55,26%cfe40 CTGCCCCTTTTCTCCGTC TCGCGTGATGATGCTGAT 55,55%cfe41 CCGGAGAAGAGCACCTAGC TACGAAAACCTGACCGCC 59,45%cfe42 CAGCTTCTCCTCCTCGGAC AGAAGGGAGTGTCGATGGTG 58,97%cfe43 AGAAAGGGGTGTCGATGATG AGCAGACGATGTGGTACGC 53,84%cfe44 AGCTGGAGAAGGAGAACAAGG CACATAGATCGTGTCGCGTT 51,21%cfe45 GTGCTGGTGCTGGTGATG GAGTTCACCCCCCGATCC 63,88%cfe46 TCACAGCATTGAACTGGCTC TGTAGCACATGAACACCAAGC 48,78%cfe47 GGCTGCTCTTCTCCTGTGAC TGCACCGATCAACACCAG 57,89%cfe48 GAAGAGCCTCCCGGTGTC GGTTTCATCCATCGTCCG 61,11%cfe49 CCAGCGCCTCAAACAAAG CTTGTCCCCGTAGCCTTG 58,33%cfe50 ACCTTCCCCTTGTAGGTGCT TCGTCTGCTCTTCCTCCG 57,89%cfe51 TCTTGCTTCCTCCATCAACC ATCGCGGAGCCCTTCTAC 55,26%cfe52 TGTCGTAGAAGGGCTCCG AAACCCTACCTCCTAGCTCCC 58,97%cfe53 TGGACCGCAGAGACTTCG GTCCGCCCAAACCCTACC 63,88%cfe54 GAAGCCCATGTCATCATCG CCTGGAGAAGAGGAGCGTC 57,89%cfe55 GGAGATCGTCGTCATCCG TCCTTGCTGTGGAGGGTAAC 57,89%cfe56 TGCTATCCTCGTCGCCTC GTGGCCTGGGTAGCCTCC 66,66%cfe57 TGAACAAACTCAGGCCAAGA CACCTCCTCCACCGTGTC 55,26%cfe58 CTGATCCGTCCGTCCATTC TCCATAGGAACCGGATATACAA 48,78%
List of EST-SSRs developed from common wheat Annex 3
-1-


Annex3
cfe59 CAGTGGGTGTACTGGGTCG CATGGTGATGGCAAGGAAG 57,89%cfe60 ACCTCTCTCCACTCCGGC CCACCTCGTACACCTCACG 64,86%cfe61 CTCCCCAAATTCCACCCTAT GACCGGGAACCTGTCCTC 57,89%cfe62 GAGCGAGATCCAGTCCAGAG AACCAGCCTTGACCATTCC 56,41%cfe63 AAGAGGTCGGGGAACAGG GTGATGAGGAGCTTGGTGC 59,45%cfe64 CACTTACCAAACTCCGGCTC ACGCCTTCGACACCGAAT 55,26%cfe65 TGTCCTCACACTCGCTCATC CACCTTGTAGCCGATGACG 56,41%cfe66 ACTGGATCTTCTGGGTCGG ACAGAGAGGACACTGAACGACA 53,65%cfe67 CATCCATCCATCCATCAGAG ATGGCCCGGTAGAAGGAC 55,26%cfe68 CGCCGTCATCTACAACAAGA CATGCACAGACACTGAACGA 50%cfe69 TGCAACTTCTCCTCCTTCGT CGCTGGTTTTAGAGGACTGG 52,5%cfe70 TTACTCACCGCGCTCCTC CGTCTTGGTCAGGAACGG 61,11%cfe71 ACGACACCGCGACTTCTC GCATGTGCCCTCTCCATC 61,11%cfe72 GACGGCCTCGATCTCCTT CACCTCACCTCATCTCACCA 57,89%cfe73 ATCCCACTCGATCATCTTGC GAGTCCTTCACCCGCCAC 57,89%cfe74 AGGCCGTAGGGACCATTC TCTAAAAGCACCGGACGC 58,33%cfe75 GGGAATACGTGCGTGAGATT GAACCGGAGGAGTCCGTG 57,89%cfe76 CCGGTCTAGTCTCAAGTGTGG TTGAAGAGCAGCGACTTGC 55%cfe77 AGCTCTCGGCTCACCTCTC CAGTGTCACCGGCTCGTC 64,86%cfe78 TGGATCACGAAGTTGTGGAA ATCGAGGAGGAGGGGCTC 55,26%cfe79 CTCCTTCATCCAGGGGCT AGAACCACTCCAAGACGGC 59,45%cfe80 TTCAGACTGGCCTCCGTC GTACAGCATCGGCAAGGAC 59,45%cfe81 CGTCCGATCAACTCGACC ACGCTTGCACCTCAGTCC 61,11%cfe82 AGGCTGAGCGTGAACACC CAAGAGCACGACGAATTTAGC 53,84%cfe83 CCTCGATGAAGAACCCGTC TTTCGGAGTTCCCACGTC 56,75%cfe84 CAACCTCCGACGAGGAGTC GAGCGACGGGTTCTTCATC 60,52%cfe85 ACCTTGAAGCAACAGCCG CCGTAGGGTTTTGGGATTTT 50%cfe86 CGTCAGTTCAAATGGCTGC TCCAGGAATGGGTTTACTGC 51,28%cfe87 GAGGTTCTTGTGGAGCATCG CAACTCCTTCGACACCTTCC 55%cfe88 GCTTACACAGAAGGGCGATT GGTCCTGGTTGTCCGTTG 55,26%cfe89 TGGGAATAACACATAGCAGTGG TGCTTTTCAGTCAGTCACCG 47,61%cfe90 TGCTCCCTCATGTACTGGC CAGAAGACGCACACACGC 59,45%cfe91 CAAGCGAAACCAACGGAG CCACTACTCAAGAGGCGGAG 57,89%cfe92 CAGCCAGCCTTTCTTCTCC TTGGGGACCAACTGGAATAA 51,28%cfe93 CTAGGGTTAGGTCAGTTTCCCC GCTCTCCACCTGCGTGAT 57,5%cfe94 ATGACCTTCACCCGCAAG TATCGCGCTGTTGATTTCC 51,35%cfe95 GAACCATGAACCAGATTTGACA ATACATTCGAGCCACCCTTG 45,23%cfe96 CATTGGTCTGTTTGACAACTGC ATCCTGATTCGGACTTTCCC 47,61%cfe97 GCTTCAATCAAGGACAGGATG TCCATTTGGGTAACACGGAT 46,34%cfe98 AACAACCGCTGAGATCGG GATTCATGGCGAGGTCGG 58,33%cfe99 CAGGCAGACACGCAACAG CACAGTCAACTCCTTTGTACGC 55%cfe100 GCAGTTCTTCCAGTTCAGAGG AGGGACAACAGTTACGTGGC 53,65%cfe101 GAACATGCAAGACACGAGTAGC TACTTCAGCCAGGGCCAG 55%cfe102 AGAACAGGAGCACGAGCAG GACGGAGGAGGGTACTTCG 60,52%cfe103 TCGCACCAGCTACAACACTC CCATGATTTGTCCGCTTCTT 50%cfe104 TTGCAGCCTAGCGAGCAG CCGGTGTGCTGTCAGATGT 59,45%cfe105 GATGCCGTGGAGCAGTCT GATGAGCCACATGAATGCC 56,75%cfe106 CGTCGATCCTATACTACGGAGG GGTACAAGCCCTGCTCGAC 58,53%cfe107 TAGATCCGTTTAGCGCCG GGCACACGGGTACAATCTCT 55,26%cfe108 AGCGCCAATACTTATCCCCT GTCCTCTAAGTCCATCAGCCC 53,65%cfe109 CTCATCGAAGGGGTTGCG ACAGGCGAGGGAGAAACC 61,11%cfe110 AGAGCCGAAATAGTCTCGCA TGCCACCATCCTGAGCTAC 53,84%cfe111 TACGGCTCCAAGAACGAGAT CTGCCCACTGCATGTCTG 55,26%cfe112 GACTACATGCGGGCCATC GACAGGAGCAGCATCGACC 62,16%cfe113 CAGAAGTGAGAATGAATGAGCG AACACAGCCACAGCACTGAC 50%cfe114 AGGGCAAGAGCATGACG ACCAAAGCGTTCACCGATAC 54,05%cfe115 GATGACCAAGAGACCAGGGA ACATACAATGCTTCCGCACA 50%cfe116 CGAGTCCTTCACCTCGGTC CTGCCCTTGCTCACCTTG 62,16%cfe117 ATATCGCTCGCGCATCTAAT AGATTCCTCTGAACTAGCCCG 48,78%cfe118 GAACGCCTCCATCAGCTC ATCCGCATTCATCTCCTTTG 52,63%cfe119 CAAACGCCAACCTCCTCC GGTGTTGAGCACACGCAG 61,11%cfe120 CACGTCCTGCTTGTGGTAGA CGAGACACACGCTGGTTG 57,89%cfe121 TGTGCTGGAACTCCTCACC AACGCACCTCCTCCCTTC 59,45%cfe122 GCGATCTTGCAGGTCATGTA AGAGAGGGCAAAGTAAGCTCG 51,21%
-2-


Annex3
cfe123 CTCGTCAGGAAACCGTCG CGTCGAAGCAACACAATTACA 51,28%cfe124 TCTCCAGCAGCAATAACGG TTACAGAGTCGCAAACGGC 52,63%cfe125 AGGACTTGGCCCTAACGC AACGATGGAACAAGGAAACG 52,63%cfe126 GCAGGCCAACACATCCTTAT AGACCCTCCTGACCGACC 57,89%cfe127 CGAGTACAGCCCCAGCCT GACCAAGGACAACCGCAC 63,88%cfe128 GGCATCCATGTCCTTCTCTC TCTGTCTCCTTAGCTTTCCCC 53,65%cfe129 TAGCGATTTGTTGGTTGTTCG ACGTATCTACAAGCACACGGG 47,61%cfe130 GACCCAAAACCAACACCG CGATGGTAGATCGGAGGC 58,33%cfe131 CGTCTGGGGGTGAGATAATG ATGCTTCAGGTGTGGCTTCA 52,5%cfe132 ATATGTCGAGCTTCGGCG GGATTGAAACTGGCAAAGGA 50%cfe134 CGGGTGATGGAGGAGAGG TTCCATTCTACTCAACGCAAA 51,28%cfe135 TAGGAGGGTAAACAAGGAGCC TGGATTGGAGGAAGGAACTG 51,21%cfe136 TGGAGACAGAGCCCACAAG CCTCGATCTGCATGGTCC 59,45%cfe137 GAGAAATAAGCGGTGCTTGC GGAACTTCTTGGCGAGATCA 50%cfe138 CATCGTGCTGCGTCAAAG CATTATCTTCAGCATAGCCGC 51,28%cfe139 AGAAGAAGGTGAGAGATGGAGG CAGGGGAGGTAGAACTCGG 56,09%cfe140 CCAGTGGCACCTCAACCTC CTCAAGCTGTAGTCGTTGTTGC 56,09%cfe141 CACCGTCAAACCAACAACAG AGGAACTACGCCGTGCTG 55,26%cfe142 GTACCTCCTGTCAAAGCCCA GTTCGACGACATCGGAAACT 52,5%cfe143 CGACTAACGACCAAAGCACA CATCCACACCCACAAGGAG 53,84%cfe144 AGCATTGCCCAAGAGCAC CGTGGGAGAGAACACACGC 59,45%cfe145 TTGGAGGGGAAGGAGGAC CAGAGAGAACACACGCAAGG 57,89%cfe146 CCGAGGCTCTTCACATCG TCAGAACGACCAAGCAGATG 55,26%cfe147 GCGTCCGAGGCTCTTCAC ACTGTCCAGGCGATGCTC 63,88%cfe148 CGGGCTTTATTGAAACCTCA GTGTCACGTTGGGCATTAGA 47,5%cfe149 CTGATTACGCGAGCCCAG CGCAGAAAGGGCAGTAAGAC 57,89%cfe150 ACGCACGCACCTGTCTATC AAGAGCAACCCTGGTAACACA 52,5%cfe151 CAGATGGGCACTCCCTTG ACCGTGATGGAGATCGAGAC 57,89%cfe152 CTTCTTCCGCGACTACCTCA GCATGTCCTGGTCGTCCTC 58,97%cfe153 GGTGTGTCCTTCCCATGC TAATGTCAGCGGAAGAGCCT 55,26%cfe154 AGAACTTGAACTCTGGGAGCC TCAACCTCCTCATCGGATTC 51,21%cfe155 GGCACGAGCTTCCTTCTAGG GGCTTGACCGTCGTGTACTT 57,5%cfe156 TGTGCGCCATCTGCTACTC CTCCTAGATCCCGCGTCTC 60,52%cfe157 ACGAACTCGGAAGTCTAGCG CATGATCGCCTCCACCTC 57,89%cfe158 CGTGGTAGTGTCCGTGACC CACATGGGCTATGGAGGC 62,16%cfe159 GAGGATGATGGACGTGCTG GAGGTCGGCGTAGCTCTG 62,16%cfe160 TTCCCTTCCCCCTCACTC TCGACATGGAGAGCATCG 58,33%cfe161 GTCTGAATATGGGGAGGAGATG AAAACACCGGCAAGAATCAG 47,61%cfe162 GCTATTCTGCCCGTTCCTC ACCATTACCAGGTGAACCCA 53,84%cfe163 CTTCCCGTCCCCTCTCTC GCTTGCCCTTGAACTTGC 61,11%cfe164 GGAACCCAGGCGAGGTAG AGCCTAGCAGCATAGCATCC 60,52%cfe165 TCCTAATCCCCCGACCTC AAACAATTTCTGCTCCCACG 52,63%cfe166 ACCAGCTCAACAAAATGCG CACGTTCCACGCTACTACCA 51,28%cfe167 GCCTTCTTCACCTCGCTG ACCGCATCTTGTTGAGCTG 56,75%cfe168 ATGCTCTGAAGTCTAAGGTCGC CAGAAACCAGAAACAAGCAGC 48,83%cfe169 AGGAAGAGGAAGGTGAGATGG GGAACTTCTCCAGCGACG 56,41%cfe170 ATGAAGTTCGTCGCCGTC TAGCAGAAGAGGTAACCGAAGG 52,5%cfe171 AAGATCCGGTACGAGGTGC ACGTGGTGAGGTTTCTGCTC 56,41%cfe172 GCCATGCAGAACTGGCTC TGCCATCCATCGACACTAAC 55,26%cfe173 GCTGGAGTAGAGCGTGCG TCGTCCTTCTCCTCGGTG 63,88%cfe174 CCTCTCCATTCCGTGTGG AGAAGGGGGACTCGATGG 61,11%cfe175 GTCCTTGGCCGTCTCCTT AAGCCTCTCCCAAACCCTC 59,45%cfe176 GATTGTGCTACGACGGTGC TCCTTGTCGAGATTCCGC 56,75%cfe177 GTCGATCCGTGGTGATCTG CGCCCAACTAGGTCGAATC 57,89%cfe178 AGCTTGCTATCCATGTCCTCA GTGCAAGGAGCACTGCGA 53,84%cfe179 CCAAACACAGTGCAAGCG TGCTGCCTATCGTACTCGTG 55,26%cfe180 GCCTGTTCAAAATGCAGGAT AGTGCTGGGAGGTAATGGTG 50%cfe181 AAGCCACTCTTTAATCCAGCC GTGTAGAAGGTGAGCAGGGC 53,65%cfe182 CTGACGCAGAAGAAGCACTG TTGCCGTAGAAGGGGTAGG 56,41%cfe183 TCCGGTGAGAGCATAGCAG TCCGACCGTGTCTACAAGC 57,89%cfe184 GCGTCCGCTCACGAGACT ACCTGTGGCTCCGTTGTG 63,88%cfe185 AAGCGCGACCAGAAGTACAG CAGCAACTACGAAACAAAGTGC 50%cfe186 CAACTGCGACGGACCCTT GCTGGCTAGTGGTGATACGG 60,52%cfe187 GCTGACCACCACAGAGACAG CGGGCTGAAGATGACCAG 60,52%
-3-


Annex3
cfe188 ATCTTCGTAGCATTGGCAGG GCAAAGAGCTTCTGGAATGG 50%cfe189 ATACAGAACCGGACACGAGG CACCAAGGACAACACCACC 56,41%cfe190 GAGGCTGCCAAGCAGAAG AGCAAATCAAGCGCGAAC 55,55%cfe191 GAGGGGCGTGCTTAGCCT TCTGCAAGGACCCCGAGT 63,88%cfe192 AGAAGAAGCCCAAGGAGGAG TCTTTCCCTTCACAACCACC 52,5%cfe193 TTCAAAGGTGTGAGCGTGAG ACACTCTTGTCGCCCCAC 55,26%cfe194 TCGAGAGCCGGAAACCTC AATTCGGCACGAGCACAG 58,33%cfe195 CCACAAGTAGATGGATCACCG GCTGGAGAAATACCCTGCAA 51,21%cfe196 AATCCATACAACGGTGCCAT AACTGGAAAGAAGCGCAGAA 45%cfe197 GCCCAACTTCACCATTTCAT GTGTGGAGACCATGCGAAC 51,28%cfe198 CGTCCGGTAACACCAACAG ACGTCCCGGCAGTAGAAGTA 56,41%cfe199 ATCATCGTCTGTGGTTTCGC CGGGACATTGAAACATCAAG 47,5%cfe200 CAGCACTGGAAATAGCTCAGG GCGCAAGCAGAACAAGAAG 52,5%cfe201 CCAGGAACCACCAACGAC CTTCCTCCCCACTTGTTCC 59,45%cfe202 CGCGAACTTCCTGGACTC AAACGAGAAAGGCTCACCGT 55,26%cfe203 TTCAGAGACAAGAGAATGGCG TTGCACTTCCAGTTGCCTC 50%cfe204 CAGAACCAGTGGGAGCAGTT CGTGTGACGTGTGCCTTC 57,89%cfe205 TTACCATCGCTCCAGACTCC GACCTACATCTTCAAGCACGC 53,65%cfe206 ACGAATTGGACATCGAGAGG CATCATCCTTGGTGTTCGC 51,28%cfe207 CCAACATCGTACTCCGGC CCGTAGTCAATCACCACACG 57,89%cfe208 CCGACCAGAAAGACGAGAAG TGGATGGTTGATGACATGCT 50%cfe209 GAGTCAGGCGATGTACGATG GCACTACCAACACAGCCAGA 55%cfe210 TGCAGGTCCTTGGAGTCG GTCGGAGAGAGGCGATGG 63,88%cfe211 CCAATGACAAGAAGGGTGCT GCTCCTTGGACTGGAGGTC 56,41%cfe212 CCCATGACGACCTTGCTATT GAAAACCTCGCAGGCAAC 52,63%cfe213 AGAGGATGGTGTGGCCTG TCGTGAACGTGGTGATGC 58,33%cfe214 CGATACCACCTACCCCGTC GACCTCCATCTCGTCCCG 64,86%cfe215 TGGCATCTGTAGAGGAGTTGG GGAGTCCATGACCTTGTCGT 53,65%cfe216 CTCCTCTGAGCAAATGGTCC GGATAGGTAGTGGTTCTCGGC 56,09%cfe217 TTCTCCAACCATACGATCAGG ACACCGGCGGATATGGAG 53,84%cfe218 GGATCGAGAGCGAGGACAT CTCCACTCCCGTCAGCTC 62,16%cfe219 AAGCTCACCCTCATCGCC AGGAACAGATGCGCCAAG 58,33%cfe220 GCCATTGCTGCTGAGCTT ATATGTCGCCTCGGAATGAG 52,63%cfe221 CTACTGGAGGTACGCCGAC TCCAGCCATCTCTTGTCCTC 58,97%cfe222 CCGACGATGATGTCAATAACC CAAACCTCTTCCTCTCACGC 51,21%cfe223 CGCGTCCGTTCTCTTCATTA GCTTGGCTGCTCTCTGTAGG 55%cfe224 TCTCCGACAAGCTCTGCTG GTACGGCACCTCCACGAC 62,16%cfe225 GCACGTCCTTGCACACTG CTCCATCCTCATGGCGAC 61,11%cfe226 CTCGCTCTCGCCTACTCG TCAGAATAATGGTGTGCCTCC 56,41%cfe227 CTCCTTGAACTGCACGATGA GCTCACCAAGAAACTACGCC 52,5%cfe228 CACACCACCACTGTCCTCC GAACTCGTGCATCCCGTC 62,16%cfe229 TCACAGGGATGACGACGAT GAGCGACGAGGAGCTGAG 59,45%cfe230 CACGAGAGCTAGGGGAACTG TTGTGAGAGATATGCCAAGCC 53,65%cfe231 GGCGACTGCTCTTCTCGG CAGAAGGGAAAGTTTGCAGC 57,89%cfe232 TTCTGGTTGTGAGCGAGTTG ATTGACGGCGAGGTGAAG 52,63%cfe233 GAGGAAGGGAAGGGAGGAG GTTGCCGTGGAGGTTGTC 62,16%cfe234 CCTCCTGCTGCTAATCTTGG TCTTGGAGATGATGTCGGC 53,84%cfe235 CGAGGACGACTCTTCTCCAC TGCAGGGTAGCAGCGATAG 58,97%cfe236 TAGAGTTCGACGCAGGGC GCAACTGATGAGCACACGAT 55,26%cfe237 GAATGCGTGATCTTGGTGG GCGCCATAGCCTCCTCTAC 57,89%cfe238 CGATGACAGCGAATGGTG GCGGCAATGTCCTTCAAC 55,55%cfe239 GAAGAGGCTGCGGTACAAAG AATCTTGGAATCGCCGAAC 51,28%cfe240 GAGGGAGTCGAAGCGGTC GACGTGGAGTTCGTGGACTA 60,52%cfe241 GAAGCTGGTCACGTTTACAGG TTAATCAAGCCACACGCCTT 48,78%cfe242 GAGTTCCTGCCGAGGTTG CTCTCCTCTCCCACACAAGC 60,52%cfe243 CCTCGCAAAGCATAGGTAGC CTAAAGTTCCTCGGCACGAC 55%cfe244 CGTCAGGTCAGCATCAACAG GGTCGAGTCGTATGGCAGC 58,97%cfe245 GGCACCATGTCCCTTAGTGT AGCTGGCTTTCTTCCTTGGT 52,5%cfe246 AGAAACCCAGCCCCAGAC CGCTTCCTGTCATCTCCTTC 57,89%cfe247 AGCTTGACGAGCCACGAC AGTGACAGCAACAATGACCG 55,26%cfe248 CATCCTCTCCACCAAGCG GACGAGTAGGACACCCCGTA 60,52%cfe249 CGTTGCACTTGTCGTTGC ACCATTTCAGAGCGCGAG 55,55%cfe250 TCATCATCGCCTCCATCTC CAACCGCAAGAAACCAGG 54,05%cfe251 TCGTCGATAGCGTCTCCTG ACAACCGCACAAGCGAAC 56,75%
-4-

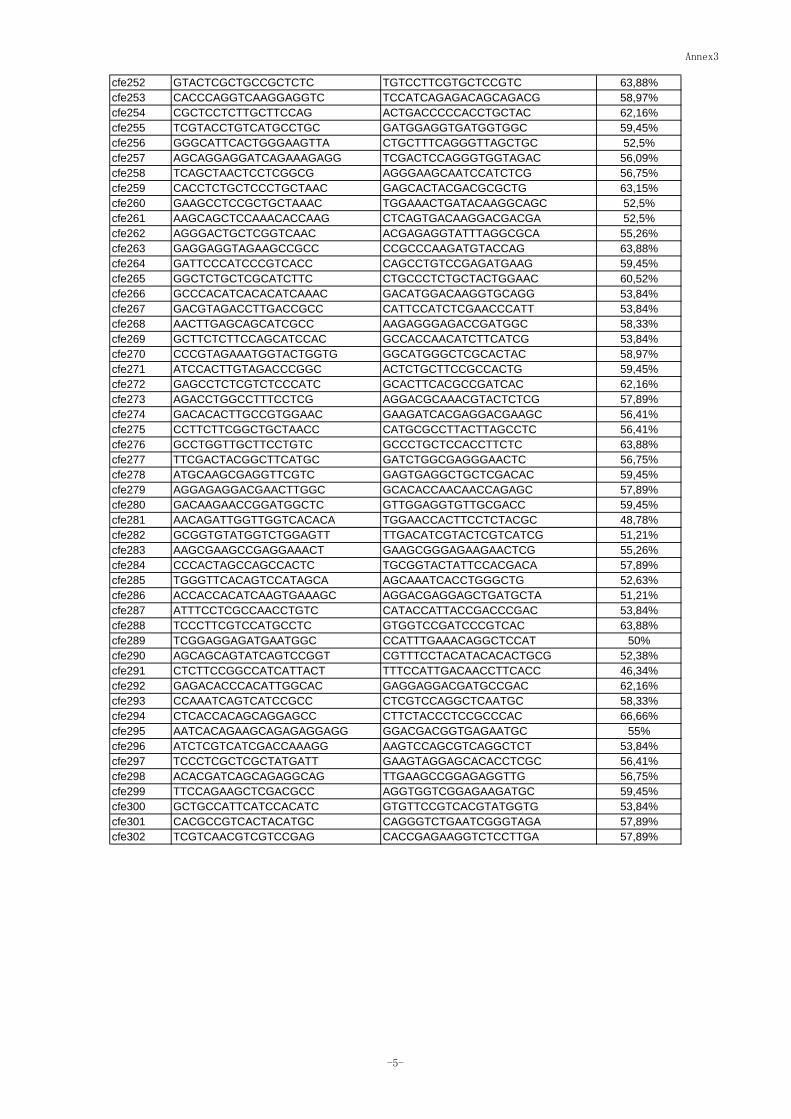
Annex3
cfe252 GTACTCGCTGCCGCTCTC TGTCCTTCGTGCTCCGTC 63,88%cfe253 CACCCAGGTCAAGGAGGTC TCCATCAGAGACAGCAGACG 58,97%cfe254 CGCTCCTCTTGCTTCCAG ACTGACCCCCACCTGCTAC 62,16%cfe255 TCGTACCTGTCATGCCTGC GATGGAGGTGATGGTGGC 59,45%cfe256 GGGCATTCACTGGGAAGTTA CTGCTTTCAGGGTTAGCTGC 52,5%cfe257 AGCAGGAGGATCAGAAAGAGG TCGACTCCAGGGTGGTAGAC 56,09%cfe258 TCAGCTAACTCCTCGGCG AGGGAAGCAATCCATCTCG 56,75%cfe259 CACCTCTGCTCCCTGCTAAC GAGCACTACGACGCGCTG 63,15%cfe260 GAAGCCTCCGCTGCTAAAC TGGAAACTGATACAAGGCAGC 52,5%cfe261 AAGCAGCTCCAAACACCAAG CTCAGTGACAAGGACGACGA 52,5%cfe262 AGGGACTGCTCGGTCAAC ACGAGAGGTATTTAGGCGCA 55,26%cfe263 GAGGAGGTAGAAGCCGCC CCGCCCAAGATGTACCAG 63,88%cfe264 GATTCCCATCCCGTCACC CAGCCTGTCCGAGATGAAG 59,45%cfe265 GGCTCTGCTCGCATCTTC CTGCCCTCTGCTACTGGAAC 60,52%cfe266 GCCCACATCACACATCAAAC GACATGGACAAGGTGCAGG 53,84%cfe267 GACGTAGACCTTGACCGCC CATTCCATCTCGAACCCATT 53,84%cfe268 AACTTGAGCAGCATCGCC AAGAGGGAGACCGATGGC 58,33%cfe269 GCTTCTCTTCCAGCATCCAC GCCACCAACATCTTCATCG 53,84%cfe270 CCCGTAGAAATGGTACTGGTG GGCATGGGCTCGCACTAC 58,97%cfe271 ATCCACTTGTAGACCCGGC ACTCTGCTTCCGCCACTG 59,45%cfe272 GAGCCTCTCGTCTCCCATC GCACTTCACGCCGATCAC 62,16%cfe273 AGACCTGGCCTTTCCTCG AGGACGCAAACGTACTCTCG 57,89%cfe274 GACACACTTGCCGTGGAAC GAAGATCACGAGGACGAAGC 56,41%cfe275 CCTTCTTCGGCTGCTAACC CATGCGCCTTACTTAGCCTC 56,41%cfe276 GCCTGGTTGCTTCCTGTC GCCCTGCTCCACCTTCTC 63,88%cfe277 TTCGACTACGGCTTCATGC GATCTGGCGAGGGAACTC 56,75%cfe278 ATGCAAGCGAGGTTCGTC GAGTGAGGCTGCTCGACAC 59,45%cfe279 AGGAGAGGACGAACTTGGC GCACACCAACAACCAGAGC 57,89%cfe280 GACAAGAACCGGATGGCTC GTTGGAGGTGTTGCGACC 59,45%cfe281 AACAGATTGGTTGGTCACACA TGGAACCACTTCCTCTACGC 48,78%cfe282 GCGGTGTATGGTCTGGAGTT TTGACATCGTACTCGTCATCG 51,21%cfe283 AAGCGAAGCCGAGGAAACT GAAGCGGGAGAAGAACTCG 55,26%cfe284 CCCACTAGCCAGCCACTC TGCGGTACTATTCCACGACA 57,89%cfe285 TGGGTTCACAGTCCATAGCA AGCAAATCACCTGGGCTG 52,63%cfe286 ACCACCACATCAAGTGAAAGC AGGACGAGGAGCTGATGCTA 51,21%cfe287 ATTTCCTCGCCAACCTGTC CATACCATTACCGACCCGAC 53,84%cfe288 TCCCTTCGTCCATGCCTC GTGGTCCGATCCCGTCAC 63,88%cfe289 TCGGAGGAGATGAATGGC CCATTTGAAACAGGCTCCAT 50%cfe290 AGCAGCAGTATCAGTCCGGT CGTTTCCTACATACACACTGCG 52,38%cfe291 CTCTTCCGGCCATCATTACT TTTCCATTGACAACCTTCACC 46,34%cfe292 GAGACACCCACATTGGCAC GAGGAGGACGATGCCGAC 62,16%cfe293 CCAAATCAGTCATCCGCC CTCGTCCAGGCTCAATGC 58,33%cfe294 CTCACCACAGCAGGAGCC CTTCTACCCTCCGCCCAC 66,66%cfe295 AATCACAGAAGCAGAGAGGAGG GGACGACGGTGAGAATGC 55%cfe296 ATCTCGTCATCGACCAAAGG AAGTCCAGCGTCAGGCTCT 53,84%cfe297 TCCCTCGCTCGCTATGATT GAAGTAGGAGCACACCTCGC 56,41%cfe298 ACACGATCAGCAGAGGCAG TTGAAGCCGGAGAGGTTG 56,75%cfe299 TTCCAGAAGCTCGACGCC AGGTGGTCGGAGAAGATGC 59,45%cfe300 GCTGCCATTCATCCACATC GTGTTCCGTCACGTATGGTG 53,84%cfe301 CACGCCGTCACTACATGC CAGGGTCTGAATCGGGTAGA 57,89%cfe302 TCGTCAACGTCGTCCGAG CACCGAGAAGGTCTCCTTGA 57,89%
-5-

Result of amplification, polymorphismand transferability for 301 EST-SSRs


Annex4
Td Tm As At Sc Hv B Os
AB A B D R H
cfe1* 4 150 165 + A - - - - + - - - - 3D
cfe2* CGC 4 175 271, 270 + A + + + + + + + + + + + + 6A, 6B, 6D
cfe3 GAG 4 289 143-150 + C + + + + + + - - - - - 2AL, 2D, 5A
cfe4* GAG 6 217 222, 228, 236 + A + + + + + + + + + - 3B, 4B
cfe5 GGA 6 245 -cfe6 CGT 7 239 300 + B + + + + + + + + + + 2AL, 2B, 2D
cfe7 GGC 4 313 -cfe8* CG 6 277 291 + B + + + + + - - - - - - - 4BS
cfe9 TA 22 185 197-209 + C + + + + + - - - - - - - -
cfe10 AGG 8 324 315, 326, 341 + B - + + + + + + + + 7A, 7B,7D
cfe11* CGG 8 224 240 + A - + + - - + - - - 4A
cfe12 ATC 8+4 247 -cfe13* CGG 5 227 379, 382 + A - + + + + - - - - 2AL, 2D
cfe14 TC 4 242 255 + B + + + - + - - - - - 2B
cfe15* TCA 4 135 151 + A - + + - - - - - - 5A
cfe16 CAT 4 221 238 + B + + + + + + + - - - 5D
cfe17* TCA 4 247 265 + A - + + + + - - - - -
cfe18* GTCA 3 257 273-277 + A + + + + + - + + - - - -
cfe19 TGC 4 266 281, 291 + B - + + + - - - + - 7A, 7B
cfe20* AGG 4 186 142, 155 + A - + + + + + - + - 7D
cfe21 ATG 5 267 -cfe22* TTC 4 141 158, 161 + A + + + + + + + + + + + + 4A
cfe23 CGA 5 231 235 + B + + + + + + + + + + 1B
cfe24 CGC 5 239 333, 244 + C + + + + - + + - - - -cfe25* ATC 4 110 124 + A + + + + + + + + + + + 1B
cfe26* CAG 8 187 191, 195 + A + + + + + - + - + - 1A, 1B
cfe27 CTG 8 252 262-268 + B + + + + + + + + + + 5A, 5B, 5D
cfe28 AGC 7 202 -cfe29* GA 7 201 213, 219 + A - + + + + + + + - 3D
cfe30* TGTA 8 194 210 + A - + + - - - - - - 3A
cfe31 GCC 4 246 -cfe32* CCG 5 119 134 + A - + + + + + - - - 6B
cfe33* TACG 3 185 201 + A - + + + - + - - - -
cfe34* TG 8 235 224, 257 + B + + + + - + + - + - 4BL, 5A, 5B
cfe35 CCG 4 119 + B + + + + + + + + + + + 6A
cfe36 GCG 4 131 143, 147 + B + + + + + + - - + + 4D
cfe37* TACG 3 150 161, 165 + A - + + + + + + + - 5A, 5B
cfe38 GCG 5+4 271 -cfe39 TG 7 259 -cfe40 CGC 5 180 364 + B + + + + - - - + - - 6A
cfe41 GCGG 5 195 213 + B + + + + + - - + + + - - - 1D
cfe42 GGA 6 221 229 + C + + + + + + + - - + - 7D
cfe43 CCT 4 261 272 + A + + + + - + + - + + -
cfe44* AGC 4 219 234 + A - + + + + + - + - -
cfe45* TGG 6 105 124 + A - - + + + + + + + + -
cfe46 GGC 6 197 -cfe47* GAA 4 132 148, 157 + A + + + + + + + + + + + 1A, 1D
cfe48 TGC 5 259 268 + B - + - + - + + - - -
cfe49 GAG 5 151 -cfe50 GGC 4 247 237 + C - - - - - - - - - -
cfe51 GGC 7 178 -cfe52* TC 16 160 159-182 + A + + + + - - - - - - - 2B
cfe53* TC 10 104 120 + A + + + + - - - + - - 2AL
cfe54 CAG 5 172 -cfe55 CTT 7 218 67 + c - + - - - - - - - 2AL, 2D, 3D
cfe56 CGG 8+4 156 237,275,304 + B + + + + + + + + + + - -
Ampli-fication
Polymorphism Amplification in relatives
Result of amplification, polymorphism and transferability of the wheat EST-SSRs.
QualityAl-OP EU-RE AR-REC CT-CS
Annex 4
Polymorphism amongat least one mapping
population.
Chromosomalassignment
Markername
Repeatedmotif
Numberof repeats
Expectedproduct
length (bp)
Real productsize (bp)
- 1 -


Annex4
cfe57 GGC 16 182 114,130,135 + C - + + + + + - - - 2AL, 2D
cfe58* TTA 4 202 222 + A + + + + + + + + + - - + - 4A, 4D
cfe59 CCGT 3 223 213.236 + B + + + + + + + - + + 4A
cfe60* TCT 4 136 151 + A - + + + + + + + + -
cfe61 AGG 8 126 136 + D - + - + + - - - - -
cfe62 CAA 5 247 252 + D - + - - - - - - - 4A, 6A
cfe63* GGC 4 149 150.28 + A - + + + + + + + + 7B
cfe64 AGGCG 5 139 155-160 + A + + + + + + + + - + 2B, 5A, 7D
cfe65 AG 9 284 294.3 + B + + + + + + - + - + 7D
cfe66* GGC 4 223 239 + A + + + + + + + - + - 2D
cfe67 AG 11 175 186, 222 + A + + + + + + + + + - + 2D
cfe68* GGC 4 260 382 + A - + + + + + + - +cfe69 CGA 4 178 -cfe70 GCA 4 251 -cfe71 GCC 6 143 245, 251 + B - + + + + + - - - 3B, 3D
cfe72 CTT 5 235 247, 250, 265 + B + + + + + + + + + + - + - 4BL, 4D
cfe73 TCC 4 150 -cfe74* TCGC 5 233 248 + A - - - + + - - - - 6D
cfe75* CTC 7+4 135 149 + A - - + + + + + + - 7B
cfe76* GGC 4 136 152 + A - + - + + + + + + 1B
cfe77 GGC 6 146 160 + B - + + + + - + - - 1A
cfe78* CGT 4 218 328, 335 + A + + + + + - + - 1D
cfe79 GGA 4 220 233 + B + + + + + + + + + -
cfe80 CA 8 198 200-213 + B + + + + + + + + + + - 6A, 6B, 6D
cfe81 GCG 7 201 -cfe82* GCG 4 254 270 + A + + + + - + + + + + + - -
cfe83 GA 14 244 -cfe84 CCT 4 128 -cfe85 GGC 6 290 -cfe86* CAG 5 133 148, 154 + A + + + + + + + + + + + 1B
cfe87* GAG 6 143 146, 159 + A + + + + + + + + + + + + + 6D
cfe88 CCG 6 227 121 + D - - - - - - - - - -
cfe89 GAA 6 241 247-257 + B - + + + + - - - - 4A, 4BL
cfe90* CTG 6 159 174 + A - + + + + + + + + 4D
cfe91 CGC 3 297 -cfe92 CGC 6 189 -cfe93 CGG 6 238 -cfe94 CCAT 6 105 119 + B - + + + + - - - - 6D
cfe95 CAT 7 247 259, 266 + B + + + + - + + - - - 6D
cfe96 CAA 10 135 150, 154 + B - + + + + + + - - 2B
cfe97 AGCC 3 150 380 + C + + - + + - - - - -
cfe98 GTC 7 139 148 + A - + + + + - + - - -
cfe99 CCGC 3 234 -cfe100 TG 6 234 249, 254, 271 + B + + + + + + + + + - 7A, 7B, 7D
cfe101 CAG 4 286 135, 175 + D - - + + + - + - - -
cfe102 GCG 5 169 181 + B - + + + + + + + - 7D
cfe103* GAAG 3 104 119, 255 + A + + + + + + + + + + 1A
cfe104 GCC 5 101 115 + C + + + + + + + - - - -
cfe105* CAT 6 198 350 + A + + + + + + + + + + -
cfe106 TG 6 157 -cfe107 CGA 5 157 166, 175 + B + + + - + + + + - - - 3B, 3D
cfe108 CGG 5+5 278 -cfe109 CTC 7 138 150 + D - - - - - - - - - -
cfe110* AC 7 363 420-460 + A - - - - - - - - - 4A, 4BL
cfe111 TCT 8 228 245 + c - - - - + - - - - 3D
cfe112 GCG 4 134 148 + B + + + + + + + + + + + -
cfe113 GAG 4 329 124 + A - - + + - - - - - - 2
cfe114 AGT 5 174 193 + B - + + + + + + - - - 5A
cfe115 CTA 4 171 153, 188 + C - - + + - - - - - - 4BL
cfe116 CCT 6 248 -cfe117 GAG 4 121 137 + B - + + - + + + - - 3D
cfe118 GGA 4 308 130, 415 + B + + + + + + - - - - -
cfe119* GCC 4 130 212, 226 + A + + + + + + + + + + + + + 2B, 7B
- 2 -


Annex4
cfe120 CTG 6 204 -cfe121 CGG 9 107 135, 196, 215 + B + + + + + + - - + - 5A
cfe122 AGC 4 140 96 + D - + - - - - - - - -
cfe123 CTC 4 212 263 + D - - - - - + + - - -
cfe124* GAACCC 3 263 269, 279 + A + + + + + + + + + - 6B, 6D
cfe125* CAG 6 235 254, 260 + A + + + + + + - + + - - 6A, 6B
cfe126* TCT 10 224 134, 420 + A + + + + + + + + + + + - - 2B
cfe127 TGC 8 142 158 + C - - - + + - - + - 3B
cfe128 TTC 10 124 -cfe129 GAT 5 128 146 + B - - + - + - - - - 3B, 3D
cfe130 CGA 4 168 178 + B - + + - - - + - - -
cfe131 AGC 6 137 152 + B - + + + + + - - - 3A, 3B, 3D
cfe132* GGC+GGC 4 145 159, 165 + A - + + + + + + + - 6A
cfe134* GATCT 4 228 135 + C - + + + + + + + + 3A
cfe135* ACAG 4 197 212 + A + + + + + + + + + + 7D
cfe136* AG 7 160 140,145,149 + A + + + + + + + + + + + - 1B, 1D
cfe137* AG 20 267 136,143,145 + A - + + + + + + + - -
cfe138* GC 7 234 219.249 + A - + - + + - - - - 4A, 7D
cfe139* GGC 6 185 233 + A + + + + + + + + + + -
cfe140 CAG 4+5 117 125,131,137 + C - + + + + + + + + 2B
cfe141* ATC 4+5 311 327 + A - - - - - - - - - -
cfe142* GAT 5+5 137 154 + A + + + + - + + - + - 4A
cfe143 CAGG 4 150 166 + - + + + + + + + - 5D
cfe144 CCT+ GGC 4+9 159 -cfe145 GGC 6+5 248 -cfe146 AGA 4 307 -cfe147 CGG 4 227 265 + C - + + - - - - - - -
cfe148 TATG 4 152 145.169 + B + + + + + + + + - - - 4A, 4D
cfe149 TCC 7 240 -cfe150* CGT 6 118 132 + A + + + + + + + - + - 1A, 1B, 1D
cfe151* CAC 4 150 165 + A - + + + + + + + + -
cfe152* CGA 5 150 263 + A + + + + + + + + + + - 6A, 6B, 7A
cfe153 AAC 4 238 -cfe154* CGC 4 141 158.162 + A + + + + + + + + + + + 3A, 3D
cfe155 CTAGG 5 249 -cfe156 GGAC 6 288 286.298 + C - - + + + + + + + 5D, 6A, 6B
cfe157 GAG 6 323 -cfe158* GCC 4 130 147 + A - + + + + + + - - -
cfe159* CAG 6 163 183.194 + A - + + + + + + + + 5A, 5D
cfe160 CGC 7 109 123 + C - + + + + - - + - 4A
cfe161* CATGG 3 135 153 + A - + + - - - - - - 3A
cfe162 GGCGGT 3 232 247.252 + B + + + + + + + - - - - 5B, 5D
cfe163 CCG 8 102 111-117 + B - + + + + + - + - 3A, 3B, 3D
cfe164 GCG 5 134 148 + B + + + + + + + + + + - 6A, 6B, 6D
cfe165 GTGC 4 303 -cfe166 CGT 7 131 142.148 + A + + + + + + + + + + - 7A, 7B, 7D
cfe167* GGC 4 187 202 + A + + + + - + + + + - - 1A
cfe168* CAG 4 153 171 + A + + + + + + + + + + 6A
cfe169* CGG 4 150 165 + A - + + + + - + + + 2B, 2D, 6A
cfe170 CGC 4 158 351-383 + B + + + + + + + + - + + -
cfe171 ATGC 5 310 213 + A + + + + + + + + + + -
cfe172* TG 8 123 192.211 + A + + + + + + + + - - - 3D
cfe173 CGC 6 131 142 + C + + + + + - + + - - - 3A, 3B, 3D
cfe174 GAC 4 254 249 + A - - + + + + - - - -
cfe175* GGC 6 216 198 + A - + + + + + + + + 2AL
cfe176 GCG 4 100 126-150 + D + + + - + + + - - - - -
cfe177 GGA 4 138 417 + D + + + + + + + - - - + - - -
cfe178 GCC 4 120 135 + D + + - - - - - - - - -
cfe179 AGG 5 315 327 + C + + + + + + - + - - - - 6A
cfe180 GCA 8 118 90,123,156 + B + + + + + + + + + - 5A, 5B, 5D
cfe181 TC 8 218 234.249 + B + + + + + + + + + + - 4D
cfe182 AAC 4 238 -cfe183 AG 14 215 229-240 + B + + + + + + + + + + + 2B
- 3 -


Annex4
cfe184 CGG 4 100 115 + C + + + + - + + - - - -
cfe185 TG 10 281 292-294 + B - + + + + + - - - 1A, 3A, 3B, 3D
cfe186* TG 7 200 218 + A + + + + + + - - - - - 5A
cfe187* GGC 4 249 257 + A + + + + + + + + - + -
cfe188* TGC 5 244 229, 262 + A + + + + + + + + + + 4BL
cfe189* TGG 5 221 211, 239, + A + + + + + - + - - - 1A
cfe190* CAC 6 266 270, 279 + A + + + + + + + - + - 1B,1D
cfe191 CCG 6 132 128-144 + B + + + + + + + + + + 1B
cfe192 CGC 6 309 236- + D + + + + + + + + + + + -
cfe193* GGC 4 270 283 + A + + + + + + - - + - - - - 1A
cfe194 GT 22 156 177 + D - + + + + - - - - -
cfe195* GAA 4 143 387, 396 + A + + + + + + + + + + + + 3A
cfe196 GGTT 5 110 118,122,127 + B - + + + + + + + - 6A, 6B, 6D
cfe197* TAA 4 293 305.309 + A - + - + + - - - - 4BL, 4D
cfe198 AGC 6 196 204.212 + B + + + + + + + + - - -
cfe199* TGC 9 209 218-227 + A + + + + + + + - - - -
cfe200 GCT 4 213 274 + D -
cfe201 GGAGG 4 126 -cfe202* CGC 6 262 361 + A - + + + + - - + - 7A, 7B
cfe203 CAC 4 191 133 + C + + + - - - - - - - -
cfe204 CCTT 4 192 195,201,204 + B + + + + + + + + - + - 4A, 5B, 5D
cfe205* CAG 5 129 135.144 + A - + + + + + - + - 4D
cfe206 CGC 5 169 -cfe207 GCG 7 139 -cfe208* AGG 4 249 262 + A + + + + + + + + + + + 5A
cfe209 CAG 6 217 228-259 + B - + + + + + + + - 2B, 2D
cfe210 CCG 5 121 134 + B - + + + + + + + + -
cfe211 GGC 5 156 120,158,161 + B + + + + + + + + + + 3B, 5B, 5D
cfe212 CGG 7 207 213,217,222 + B - + + + + + + + + 2B, 2D
cfe213 CGC 7 288 302 + B + + + + + + + - - - 4D, 7A, 7B
cfe214 CCG 6 107 122 + B + + + + + + + + + - 6B
cfe215 GAG 6 200 -cfe216 CCT 6 319 -cfe217 CGC 5 246 -cfe218 GGGGGC 4 181 193 + B - - - + + + - + - 4D
cfe219* CCG 4 208 340 + A - + + + + + + + - -
cfe220 CTG 5+4 246 239.262 + B + + + + + + - + + - 2AL, 3B, 3A
cfe221 CAG 6 250 -cfe222 GAT 4 238 258 + C + + + + + + + - - - 6A, 6D
cfe223* ATAC+TCCT 5+7 157 164-173 + A + + + + + - - + - + + 7B
cfe224 GCC 7+4 275 185-219 + D + + + + + + + + + + + + - -
cfe225* ACG 5 349 359 + A - + + - + - + + - 3D
cfe226* TCTCC 4 170 143 + D - + + - + - - - + -
cfe227* CGC 5 161 177 + A + + + + + + + + - + - 2D
cfe228* CTG 13 207 214 + A + + + + + + - - + + + - 4A
cfe229* ACA 4 298 315 + A - + + + + + + + - 5B
cfe230 CTC 8 317 334 + B + + + + + - - - - - 5B
cfe231 CGG 4 335 360 + D - - - - - - - - - -
cfe232 GTG 4 245 131 + B + + + + - + - - - - - -
cfe233 CGG 4 186 201 + C + + + - + - - - - - -
cfe234* GTCC 6 237 251-571 + A - + + + + + + + - 4A, 4D
cfe235 CGC 4 186 145-258 + D - + + + + + + - + -
cfe236 CGTA 4 110 120-127 + B + + + - - - - - + - - 2B
cfe237 GGT 5+4 274 -cfe238* GAG 6 141 157 + A + + + + + + + + + + - -
cfe239 GGT 6 262 277, 285 + B - + + + + + + + - 5B, 5D
cfe240 TCC 5 213 209-227 + B + + + + + + + + + + 3A, 5A, 5B, 7D
cfe241 TG 8 168 186 + B + + + + - - - - - - - 5B
cfe242 GGC 5 218 293-360 + B + + + + + - - - - + - 1A, 1B
cfe243 (CCA)CC(CCA) 4+4 303 339-289 + D - + - - - - - + - -
cfe244 CAC 4 170 184 + B + + - - - + - - - - 4D
cfe245* AC 12 239 464 + A - + - + - - - - - 6B
cfe246 GAA 5 300 -
- 4 -


Annex4
cfe247 GCG 6 126 132, 136 + B + + + + + + + + + + 4D, 5A, 5D
cfe248 CCA 4 202 184, 215 + B - + + + + + + + - 7A
cfe249 GCT 7 271 490 + C - - - - - - - - - -
cfe250* CCG 5 127 141 + A - + + - - - - + - 4A
cfe251 GCC 6 201 -cfe252 GGA 5 131 144, 147 + B + + + + + + - - - - 7B, 7D
cfe253 ACG 6 147 278 + C + + + + + + + + + - + - 7A, 7B, 7D
cfe254 GTA 7 259 279-292 + C + + + + + + + - - - - - 1B, 4A
cfe255* CCA 4 146 157, 159 + A - + + + + + + + - 1B, 1D
cfe256 CA 12 285 -cfe257* AGC 7 265 272, 274, 280 + A + + + + + + + + + + + - 1A, 1B, 1D
cfe258* AAG 4 144 161 + A + + + + + + - + - + - 3A, 3B
cfe259 TC 25 142 -cfe260* CCT 7 149 252-258 + A + + + + + + + + + + + - 7A, 7B, 7D
cfe261 TC 11 248 252-259 + A + + + + + + + + + + + + 7A, 7B, 7D
cfe262 CGG 5+6+4 367 -cfe263* AGC 5 174 186 + A + + + + + + - - + - 1A
cfe264* CCT 4 254 254-259 + A + + + + + + + - + - - - -
cfe265 AAGGG 4 304 339 + B + + + + - + + - - - -
cfe266* ACC 4 251 266 + A - + + + + + + + + 1B
cfe267* GGA 6 172 128, 133 + A + + + + + + + + + + 1A
cfe268 CCT 5 207 -cfe269 GCT 4 229 -cfe270* GTG 7 126 141-145 + A - + + + + + + + - 4D, 5A, 5B
cfe271* CGG 5 139 154 + A - + + - - + - - - 1B
cfe272* GCA 4 132 147 + A - + + + + + + + + -
cfe273* GGC 6 111 334 + A + + + + + + + - + - - - 6A
cfe274* CCA 5 180 195-197 + A + + + + + + + - + - 4BL
cfe275 GGA 4 180 -cfe276* AGG 6 125 137, 143 + A - + + + - + + + - 1A, 1B
cfe277* ACA 4 202 208-216 + A + + + + + + + + + + + - 6D
cfe278* CA 12 178 195-212 + A + + + + + + + + + + - 3B, 7D
cfe279* CTT 4 246 264 + A - + + + - + + + - 6B
cfe280 CGC 4 167 -cfe281* ACG 5 215 228 + A - + - + + - - - - 2D, 5D
cfe282* GAC 7 149 156, 163, 172 + A + + + + + + + + + + + + 3A, 3B, 3D
cfe283 CCCG 4 247 186 + C + + + + + + + + + + 2AL, 2B
cfe284* AATC 4 240 114, 258 + A - + + + + - - + - 7A
cfe285* TGC 7 114 130 + A - + + + + - + + - -
cfe286 AGG 15 187 201 + B + + + + + + + + + + + - 2B, 3A, 3D
cfe287 GGC 7 234 224 + C - - + - - - - - - 3A
cfe288* CTC 5 210 320-327 + A + + + + + + + + + + + 6B
cfe289 CAG 12+4 191 -cfe290 CGC 4 132 -cfe291 AATC 6 118 134 + C + + + + + + + - - - - 4D
cfe292 AAC 4 316 -cfe293 CCT 4 227 224 + B + + - - + - - - - - -
cfe294* AGC 4 250 260 + A + + + + + + + + + - 3D
cfe295 CAG 7 179 174, 184, 194, + B + + + + + + - - + - 3A, 3D, 5D
cfe296 CGC 4 244 -cfe297* CGG 4 150 286, 291 + A - + + + + + + + + 6A, 6B
cfe298 GAC 7 200
cfe299 GGA 4 113 249-253 + B + + + + + + + + + + 4A, 5A, 5D
cfe300* AC 13 249 265 + A + + + + + + + + + + + 4A
cfe301 AC 15 177 188-194 + B + + + + + + + + + + + + + 5D
cfe302* GCA 6 283 295-303 + A + + + + + - + - - - - 3B
“+” means either polymorphism or amplification. “–” means absence of either polymorphism or amplification.
Td: T. durum; Tm: T. monococcum; As: Ae. speltoides; At: Ae. tauschii; Sc: Secale cereale (rye); Hv: Hordeum vulgare(barley); B: Brachypodium ; Os: Oryza sativa (rice).
The PCR product qualities were represented by letters A, B, C and D. A means that the amplification product is strong andclear; B means strong but no clear band; C means weak, but able to be scored and D means too weak to be scored.
- 5 -


Genetic map in ITMI and CTCS


XGliA5
Xfba393
Xcfa2135
Xbcd738
Xfba92
Xcfa2056
Xfba234
Xfbb255
Xfba266
Xcfa2158
Xcfa2153
Xcfd15
Xpsp3151
Xcfa2129
Xcfa2219
XksuH9
XksuE18XksuE19
Xbcd22
XksuG34
CHROMOSOME 1ACHROMOSOME 1A
CTCS
XksuD14
Xcdo426XksuE18
Xrz244
Xcdo312
Xcdo1160
XksuH14
XksuE11Xcdo393
Xbcd1072Xbcd98
ITMI
Xmwg733
Xmwg632Xmwg912
Xwg241
Xwmc104Xbarc148Xcfa2226Xwmc24Xgpw2277Xbarc28Xgwm164
Xgwm136
Xcnl5Xgpw2069Xwmc120Xgpw2006Xgwm357Xgwm135
Xwmc93
Xgwm497Xgwm666
Xgwm99
Xgwm33Xbarc263Xgpw2032
Xwg605
CTCS
CHROMOSOME 1BCHROMOSOME 1B
Xfbb260Xcfa2158
Xcfd65
Xbcd442
Xcfd20
XksuG34
Xfba178
Xcdo393
Xmta14
Xgwm259
Xpsp3000
Xcfd59
Xcfd48
Xpsp3100
Xcfa2292
Xgwm274Xgwm268Xgwm124XksuA1
XksuD14
Xfbb67
Xfbb35
Xcdo637
Xcdo1196
XksuE11
Xbcd508
Xcdo346
ITMI
Xbcd762Xcdo1173Xcdo618
Xbcd304
Xcdo388
XksuE18XksuE19Xnor
XksuF43
Xbcd1562
Xpsp3000Xgpw363Xgwm33Xgpw1170Xwmc85Xgwm550
Xgwm11Xcfd170Xcfa2241
Xgwm264Xwmc230Xwmc51
Xgwm18Xgwm413Xgwm273Xgwm582Xwmc52Xgwm498Xbarc187Xbarc240Xbarc137Xbarc181Xbarc174Xgwm131Xbarc61Xwmc156
Xcfd251
Xwmc44Xgwm259Xwmc113Xgwm140Xbarc80
Xcfa2147-1Xcfa2147-2
Xbarc188Xbarc81Xgwm153Xgwm274Xgwm268Xgwm124
Xbcd386Xwg605
Xgwm403Xmwg733
Xmwg938
Xmwg912
XksuE11
XksuI27
Xbcd1434
Xwg605
Xglk136
Xglk163Xglk136
XksuE19
Xfba250
Xfbb250
Xgwm106
Xpsp3037
Xcfd19
Xcfd32
Xcfd27Xcfd63
Xcfa2158
Xcfd61 Xcfd21Xcfd83 Xcfd28Xcfd72 Xcfd59Xcfd65Xcfd58
CTCS
ITMI
CHROMOSOME 1DCHROMOSOME 1D
Xfba259
Xfbb250
Xwhs179
Xabc156
Xfbb237
Xfba250Xmwg967
Xfbb194Xcdo312
Xmwg733
XATPase
Xbcd1261
XAdh
XGlu1D
Xgwm33Xbarc152Xcfd15Xwmc222Xgwm106Xcfd92Xgdm60
Xgwm458Xgdm19Xcfd19
Xgwm232Xcfa2147Xgdm111Xcfd282Xcfa2187Xbarc119Xbarc62
Xgwm337Xbarc229.2Xbarc99Xbarc229.1Xbarc169Xgwm603
Xwmc216
Xcfa2170
Xbarc66Xgwm642
XksuE11XksuI27Xwg241
Xbcd508
XksuD14Xbcd1434
Xmwg938
XksuE18
Xgdm33Xbarc149
Xgdm126
Xgpw7068
Xgpw7082
Xcfe103Xcfe204
Xcfe257
Xcfe193
Xcfe242b
Xcfe242c
Xcfe190bXcfe125
Xcfe136
Xcfe191
Xcfe190a
Xcfe148a
Xcfe25


ITMI
CTCSXfba88
Xfba300
Xgsy333
Xcfa2099
Xcfa2058Xfba345
Xcfa2086
Xglk594
Xwg645
Xgwm515Xcfd2Xcfa2263Xcfa2164
Xwmc177
Xcfa2043
Xwmc170Xcfa2121
Xgwm382
Xfba106
Xbcd348.1Xcdo447
Xcdo456.1
Xcdo456.2
Xksud18
Xfba178
Xfba272
Xbcd152
Xbcd543
Xbcd1095
Xbcd292
Xfba314
Xcfd50
Xgwm614Xcfd36Xgwm636Xbarc212Xbarc124Xgwm296Xgwm497
Xgwm210
Xgwm372Xgpw2204Xgwm275
Xgwm359Xgwm512Xgwm71-1Xwmc177
Xgwm339Xgwm448Xgwm425Xgwm515Xgwm95Xgwm10Xgwm473Xgwm122Xgwm328Xgpw2111Xgwm249Xgwm71-2Xgwm558Xbarc5Xwmc261
Xgwm445Xgwm47-1Xgwm294Xgwm312Xgwm47-2Xgwm356Xgwm311Xgwm265Xgwm382
Xcfd267
CHROMOSOME 2ACHROMOSOME 2A
Xbcd348.2
Xbcd855
Xcdo405
XksuE16XksuD22
XksuF41
XksuH16
Xpsr388
Xpsr107
XksuD18
Xfbb121
Xcfd11
Xfbb75
Xfbb353
Xwmc175Xfba345
Xfba209
XksuF1
Xfbb226
Xfbb324
Xgwm55Xcfa2043
Xcfd73
Xgwm382Xcfd25
CTCSXfbb274
Xbcd1184
Xrz444
Xcdo405
Xbcd1119
Xbcd1779
Xmwg546
Xfbb113
Xcmwg660
Xksud23
Xbcd1231
ITMI
Xgwm388Xgwm191Xcnl6Xcfa2278Xgwm120
Xgwm16Xgwm501Xcfd73Xwmc175Xgwm47
Xcfd267Xgwm526
Xgwm619Xcfd50
Xgwm210Xwmc25
Xbarc7Xbarc13Xbarc91Xbarc18Xgwm630Xgwm374Xbarc167Xbarc128Xbarc160Xwmc272Xwmc245Xgwm55-2Xgwm319Xwmc265Xgwm129Xgwm55-1
Xgwm382
Xbarc200Xgwm257Xwmc154Xwmc83Xgwm429Xgwm410Xgwm148
CHROMOSOME 2BCHROMOSOME 2B
Xbcd135
XksuF11
XksuD22
Xbcd348
CTCS
Xgwm249
Xcfd11Xcfd77-1
Xcfd53
Xcfd36
Xcfd56
Xgwm539
Xcfd62
Xcfd44
Xgwm382
Xcfd50
Xcfd77-2Xcfd17Xgwm358
Xcfd43
Xcfd51
Xgwm608
Xgwm349Xwmc167
Xgwm261Xgwm296Xgwm455
Xfbb189
Xfba349
Xbcd102
Xcdo1379
Xbcd262
Xcdo405
Xbcd111
Xtam8
Xcdo1008
XksuH16
Xcmwg682
Xgwm157Xcfd73Xgpw1184
Xwmc25Xwmc11Xgdm35Xgdm5Xcfd36Xbarc124Xgwm210Xgwm296
Xbarc168Xcfd255Xgwm102Xcfd160-2Xcfa2262
Xgwm515Xcfd160-1Xcfd116Xbarc145Xgdm19Xgwm30Xwmc245Xcfd17Xwmc18Xcfd2Xgwm249
Xgwm539Xbarc11Xcfd233Xgwm608Xcfd168-1Xcfd270
Xcfd239Xcfd267Xcfd168-2
Xbarc228Xgwm349Xgwm320Xgwm301Xgwm311Xgdm6Xgdm93Xgdm87Xwmc167Xbarc159Xgwm382Xcfd161
Xcnl1Xcnl3Xcfd175Xgwm37
Xcfa2040
Xgwm455Xwmc112Xgwm261Xgwm484Xgdm107
XksuH9
ITMI
CHROMOSOME 2DCHROMOSOME 2D
Xcfe274
Xcfe227
Xcfe213b
Xcfe183
Xcfe52Xcfe236Xcfe119
Xcfe195
Xcf67


CTCSXfbb370
Xgwm369
Xgwm2
Xpsr78Xcdo113
Xbcd358
Xbcd15
Xpsp3047
Xfba242Xcfa2234Xcfa2164Xcfa2134
Xcfa2193Xwmc175Xcfa2183Xcfa2076Xwmc169Xcfa2037
Xglk683
Xcdo460
Xcdo1345
Xcdo638
Xtam33
Xmwg30
Xbcd1773
Xabc172.2
Xabc172.1Xmwg12Xcdo482
Xbcd451
Xcfd2
Xcfa2262Xwmc264
Xwmc11Xgpw1106Xbarc57Xbarc12Xgwm369
Xgwm2Xgwm30Xgwm666-1Xbarc45Xbarc19Xbarc67Xbarc25Xgwm674Xgwm5Xgwm32
Xgwm162Xgwm247Xgwm155Xgwm480Xgwm666-2Xbarc197
Xcnl4
Xgwm114
Xgwm391
ITMI
CHROMOSOME 3ACHROMOSOME 3A
XksuH2
Xbcd907
Xcdo460
Xtam61
Xabg471
Xbcd1418
Xfbb378
Xbcd131
Xfba360
Xbg131
Xtam63
Xmwg11
Xcfa2191Xcfa2226Xcfd143Xgwm493Xbarc147Xbarc133Xbarc75Xbarc102Xgwm389Xgwm533-1
Xcfa2170
Xgwm566Xgwm72Xcfd4Xgwm285Xgwm77Xgpw1146Xgwm376Xgwm284
Xgwm533-2Xwmc43Xgwm264
Xcnl3Xgwm131Xgwm108Xgwm112Xbarc164
Xgwm114Xpsp2151Xgwm547
Xgwm299Xbarc77Xbarc84
Xgwm247Xgwm181Xgwm340
XksuH7Xpsr689
ITMI
CTCSXE3M3iXfba189
XksuG30Xcfd79
Xglk538
Xcfd4
Xfba189
XksuF34
Xfwm4
Xpsp3081
Xgwm131
CHROMOSOME 3BCHROMOSOME 3B
XksuG62
Xpsr170
Xcdo549
Xbcd1802
Xabc171
Xcdo407
Xabc176
Xbcd515
XksuE14
Xfbb117
Xcfd35Xcnl2-2Xgwm114
Xgwm71Xgwm161Xcfd141Xgwm183
Xgdm62Xgdm72Xbarc8Xcfd34Xgpw1168Xcfd2Xgwm341Xbarc6Xgwm497Xgwm456Xgpw1146Xcfd4Xgdm8Xgdm128Xgwm52Xcfd219
Xgwm383 Xcfd152Xcnl5Xgwm645Xgwm664Xpsp3019Xcfd201Xcfd127
Xcfd213Xgwm314Xbarc42Xcfd211
Xwmc43Xgwm2
Xgwm3Xcfd223Xcnl2-1
XksuD19XksuH15
ITMICTCS
CHROMOSOME 3DCHROMOSOME 3D
Xcfd55
Xcfd35
Xfbb278
Xcfd79
Xcfd70
Xfba213
Xgwm383
Xgwm314
Xcfd9
Xpsr394
Xcfd34
Xfwm4
Xcfd64
Xcfe220
Xcfe278
Xcfe166
Xcfe282
Xcfe107
Xcfe87
Xcfe154
Xcfe286


Xfbb1
Xfbb332
XksuF8
XksuG12
XksuE3
Xbcd1670
Xcdo545
Xbcd1975
Xbcd129
Xgwm637Xcfd88
Xcfd31Xbarc153Xbarc184
Xcfa2174 Xgwm4Xgwm165Xwmc96Xwmc173.1Xbarc206Xbarc106Xbarc138Xgwm601
Xgwm397Xcfa2173Xwmc173.2Xwmc258Xbarc170
Xgpw1142
Xcfd257Xwmc262Xwmc232Xgwm160
Xbcd1652
Xpsr115
Xcfd2
Xpsr103
Xpsr392
Xwmc173.1
Xgwm610Xwmc173.2
Xgwm397Xcfa2121 Xcfa2026Xgwm165Xgwm192Xcfa2256 Xcfd24Xcfd16Xcfd71
ITMI
CTCS
CHROMOSOME 4ACHROMOSOME 4A
Xpsr160
Xbarc78Xbarc52Xbarc70
Xgwm610
Xbcd402
Xcdo795
Xcdo938
Xmwg2025
Xfbb67Xfba177
Xwmc48Xgwm107Xcfa2091
Xgwm149Xbarc60Xbarc163Xcfd39Xgwm251Xgwm375Xgwm6Xgwm538
Xgwm113Xgwm66Xgwm368Xgwm513Xcfd283Xgwm495Xgwm165
Xgpw7026
Xbcd1262
XksuG10
Xglk556
XE1M1c
Xcfd22
Xbcd15
XksuH11
Xcdo1312
XksuG30Xfba177
Xcfd59
Xgwm107Xgwm165Xgwm192Xgwm495Xgwm314
Xgwm6
Xcfd54Xcfa2149
Xcfd39
CHROMOSOME 4BCHROMOSOME 4B
ITMICTCS
XksuC2
Xcdo1312Xwg114
ITMI
Xbcd265
XksuF8
Xfbb178
Xcdo1312
Xbcd1431
Xfbb226
Xfba177
Xwmc48Xgdm129Xcfd106 Xgwm608
Xcfd81Xbarc98Xgwm165Xgdm61Xcfd193Xgpw5144Xgdm125Xcfd89Xcfa2173
Xcfd39
Xgwm194
Xgpw2220Xbarc225
Xgwm609Xgwm624Xbarc122
Xgwm608Xfba211
Xcfd84
Xcfd54Xgwm194
Xcfd71
Xcfd23Xpsp3103
CHROMOSOME 4DCHROMOSOME 4D
CTCS
Xcfe4Xcfe254Xcfe142
Xcfe228Xcfe148bXcfe295Xcfe300Xcfe252
Xcfe204
Xcfe199 Xcfe72
Xcfe264
Xcfe59

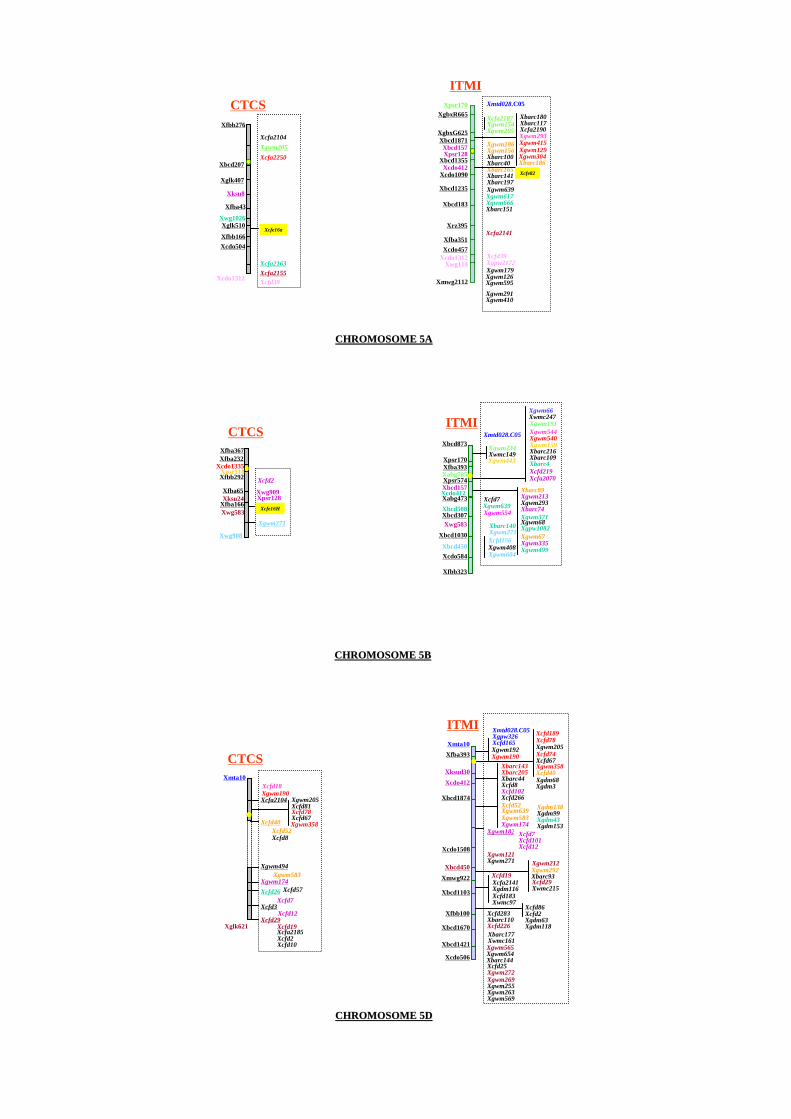
Xbcd1871
Xbcd1355
Xcdo1090
Xbcd1235
Xbcd183
Xrz395
Xfba351
Xwg114
Xmwg2112
XgbxG625
XgbxR665Xpsr170
Xcdo457
Xgwm205
Xbcd207
Xglk407
Xksu8
Xfba43
Xwg1026Xglk510
Xfbb166
Xcdo504
Xcfa2163
Xcfa2155
Xcfa2250
Xcfd39
Xcfa2104
Xfbb276
CHROMOSOME 5ACHROMOSOME 5A
Xbarc180Xbarc117Xcfa2190
Xcfa2141
Xgwm129Xgwm415Xgwm293
Xgwm304Xbarc186
Xgwm186Xgwm156Xbarc100Xbarc40Xbarc165Xbarc141Xbarc197Xgwm639Xgwm617Xgwm666Xbarc151
Xcfd39
Xgwm179Xgwm126Xgwm595
Xgwm410Xgwm291
Xmtd028.C05
Xcfa2187Xgwm154Xgwm205
Xgpw2172
CTCS
ITMI
Xpsr128Xbcd157
Xcdo1312
Xcdo412
Xcdo1312
Xwg908
Xfba166
Xfba65
Xfbb292
Xfba232
Xgwm271
Xcfd2
Xfba367Xbcd873
Xbcd307
Xbcd1030
Xcdo584
Xfbb323
Xabg473
Xpsr574
Xfba393Xpsr170
Xcfd156
Xgwm604Xgwm408
Xwg583 Xbarc140Xgwm271
Xcfd7Xgwm639Xgwm554
Xgwm335
Xgpw1082Xgwm68
Xbarc89Xgwm213Xgwm293Xbarc74Xgwm371
Xgwm499
Xgwm67
Xmtd028.C05
Xgwm234Xwmc149Xgwm443
Xgwm159Xbarc216Xbarc109Xbarc4
Xgwm191
Xgwm540Xgwm544
Xcfd219
Xgwm66Xwmc247
Xcfa2070
CTCSITMI
CHROMOSOME 5BCHROMOSOME 5B
Xabg705
Xcdo412
Xbcd450
Xwg909Xpsr128
Xbcd157
Xbcd508
Xpsr118Xcdo1335
Xksu24
Xwg583
Xcfd52Xcfd8
Xcfa2104
Xcfd40
Xgwm494
Xgwm174
Xcfd26
Xcfd3
Xcfd29
Xgwm583
Xcfd57
Xcfd7
Xcfd12
Xcfd19Xcfa2185Xcfd2Xcfd10
Xcfd18Xgwm190
Xgwm205Xcfd81Xcfd78Xcfd67Xgwm358
Xmta10
CHROMOSOME 5DCHROMOSOME 5D
Xcfd19
Xgwm182
Xcfd74
Xbarc143Xbarc205Xbarc44Xcfd8Xcfd102Xcfd266
Xcfd283Xbarc110
Xcfd25
Xgpw326Xcfd165
Xcfd29Xwmc215
Xcfd183Xwmc97
Xmtd028.C05
Xcfd40
Xcfd67Xgwm190Xgwm192
Xcfd189
Xgwm205
Xgwm358
Xcfd52
Xgwm583Xgwm639
Xgwm174
Xcfd7Xcfd101Xcfd12
Xgwm121Xgwm271 Xgwm212
Xgwm292Xbarc93
Xcfd86Xcfd2Xgdm63Xgdm118Xcfd226
Xgwm565Xgwm654Xbarc144
Xgwm272Xgwm269Xgwm255Xgwm263Xgwm569
Xcfd78
Xcfa2141Xgdm116
Xbarc177Xwmc161
Xmta10
Xfba393
Xksud30
Xcdo412
Xbcd1874
Xcdo1508
Xbcd450
Xmwg922
Xbcd1103
Xfbb100
Xbcd1670
Xbcd1421
Xcdo506
CTCS
ITMI
Xglk621
Xgdm68Xgdm3
Xgdm138Xgdm99Xgdm43Xgdm153
Xcfe16a
Xcfe82
Xcfe16H


Xcfe179
Xpsr167
Xmwg652
XksuH4
Xcdo270
Xbcd1860
Xcdo388
Xfbb164
Xfba111
Xmwg2053
XksuG8Xwg487
Xmta15
XE3M3p
XE5M5p
Xcfd30
Xgwm169
Xfbb40XksuG49
Xcfd1
Xpsp3152Xcfd82
Xcfa2114Xgwm427
Xbarc3Xbarc195Xgwm494Xcfd190Xgpw1150Xbarc171Xwmc163
Xgpw3087Xgpw3100Xgpw2295Xgwm459Xgwm334
Xwmc256Xgpw2060Xwmc201Xbarc107Xbarc113
Xgwm169Xgwm570Xgwm617Xgpw2344Xgwm427
Xgpw2082
CTCS
ITMI
CHROMOSOME 6ACHROMOSOME 6A
Xpsr8
Xpsr10
Xfbb40Xfbb82
Xfbb283Xfba397Xfbb95Xfba367Xcdo772Xpsr463
Xtam36Xfbb170
Xpsr8
Xfbb82
Xbarc204
Xpsr167
Xrz995
XksuH14
Xcdo507
Xfba42
Xfbb327
Xfbb59
Xpsr167
Xcfd13
X -Amy1
XksuG12
Xgwm608
Xfbb250
Xfba328
XksuG8
Xwmc182
CHROMOSOME 6BCHROMOSOME 6B
Xcfd13Xbarc48Xgwm508Xgwm133Xgwm644Xbarc198Xwmc95Xgwm70Xgwm191Xgwm361Xgwm193
Xgpw1079Xgwm132Xgwm518
Xcnl3Xwmc105Xgwm626Xgwm88Xgpw5130Xwmc182Xbarc79Xbarc24
Xgwm219Xbarc178Xbarc134
Xgwm613
Xgwm118
CTCS
ITMI
Xpsr141
XksuH4Xfba67Xfba399Xfba344
Xfba328Xfbb364
Xfba111
Xwg341
Xmwg74Xfbb82Xfbb70
Xfbb82
Xpsr8
Xpsr899
Xfba307
XksuG48
Xfba85
Xpsr106
Xcdo270
Xbcd1716
Xfbb231
Xfba81
XksuE14
Xbcd1510
XksuD27
Xmwg2053
Xgwm55-1
Xcfd33
Xcfd19
Xpsr371
Xglk547
Xcfd5
XksuE3
Xcfd38
Xcfd47
Xgwm55-2Xcfd75Xcfd42
Xcfd80Xcfd37
Xcfd76
Xcfd45Xcfd60
Xcfd49Xcfd135Xbarc183Xbarc173
Xgdm132Xgpw1034Xcfd13Xgwm469
Xcfd213 Xcfd132Xgdm141Xgdm36Xgdm127Xgwm325Xgdm108Xwmc113Xcfd19
Xgpw1019Xbarc196Xgpw1101Xbarc123Xbarc23Xgdm14Xcfd37Xgwm55Xbarc146Xcfd188Xbarc202
Xbarc175Xcfd95Xcfd287Xcfd47Xgpw8068Xgwm582Xgpw5130Xgpw5224Xbarc204Xgpw312Xgpw4183Xgpw2232
Xgdm98Xbarc21Xcfd60
CTCS
ITMI
CHROMOSOME 6DCHROMOSOME 6D
Xfbb59 Xfbb70
Xcmwg669Xcsb112Xfbb169XksuD1Xtam28
Xabg20Xabc175
Xpsr964Xpsr8Xfba187Xfba381Xfbb354Xfbb319Xmwg916Xpsr627Xcdo534Xtam31Xfbb231
Xgpw3029Xgpw8068
Xcfe273
Xcfe80
Xcfe273aXcfe80b
Xcfe135
Xcfe86
Xcfe211a


Xfbb264
Xcdo545
Xfba127Xfba109
Xcdo475
Xfba42Xabc158Xfba248
Xcdo962
Xfba354
Xfba69
Xfbb145
Xfba382
Xfba134
XksuH9
Xfba243
Xfba17
XEF1R
Xfba109
Xfbb222
Xfbb366
Xcfd6
XksuA5
Xcfa2123
Xpsp3094
Xcfa2019
Xfba350
Xcfa2240
Xcfa2110
Xcfd62
Xcfa2056
Xwmc182
Xpsp3050
Xcfa2293
Xcfa2040Xcfa2257
Xcfa2049Xcfd242
Xcfa2174Xcfa2028Xwmc83
Xgpw2107Xgpw2297Xgwm233Xgwm350Xgwm471
Xbarc127Xgwm60
Xgwm130
Xgwm260Xbarc108Xwmc17Xgpw2269Xbarc121Xbarc49Xbarc29Xgpw1100Xgwm573Xgwm276
Xgwm282Xgwm332Xgwm63Xwmc116
Xgwm635Xgwm666CTCS
ITMI
CHROMOSOME 7ACHROMOSOME 7A
Xwg380
Xfba42
Xbcd310
Xwg514
Xcdo686
Xabc310
XksuD2Xfbb67
Xfbb189
Xcdo414
XksuE18
Xgwm569Xcfa2106Xgpw1054Xgwm573
Xbarc176Xgwm16Xgwm46Xgwm297Xgpw1164Xgwm43Xbarc85Xbarc72Xbarc90Xbarc65Xpsp2153Xcfd81Xgwm644Xgwm333
Xgwm537Xgwm400
Xgpw1100Xgwm112Xgpw1113
Xgwm302Xgwm274
Xgwm322Xcfa2040
Xbarc50Xbarc20Xbarc182Xgwm146Xgpw1144Xgwm577Xwmc276
Xcnl2Xgwm611Xcnl1Xgpw1045
Xgwm68
Xgwm344
Xfbb53
XksuD18
Xfba32
Xwg514
Xfbb175
Xpsr129
XksuD2
Xpsp3081
Xpsr121
XksuF2
XksuA3
Xwmc182
Xcfd74
Xgwm131
Xpsp3033
Xwmc166
CHROMOSOME 7BCHROMOSOME 7B
CTCS
ITMI
Xfba8
Xwg834
Xmwg710
Xbcd707
Xcdo775
Xabc173
Xmwg975
Xfba204
Xrz2
Xgwm44
Xpsr103
Xcfd41
Xcfd31
Xcfd21XksuA1
Xgwm111-2
Xgwm437
XksuE9
Xpsr160
Xcfd46
Xcfd14
Xfba204
Xgwm37
Xgwm428
Xpsp3003
Xfwm7
Xgwm111-1
Xcfd66
Xcfd68Xcfa2099
Xpsp3133
Xcfa2040
Xcfd69
CHROMOSOME 7DCHROMOSOME 7D
Xgwm111Xwmc121Xcfa2174
Xcfd25Xbarc111
Xgdm86Xgdm130Xgwm146Xgwm635 Xcnl6
Xgpw1142
Xgdm84Xbarc26Xgwm437Xwmc94Xgdm46Xgdm67Xbarc172Xbarc121
Xgwm428Xcnl1Xgdm150Xbarc53Xbarc76Xgwm37
Xgwm295Xbarc154Xbarc126Xgwm350Xbarc125
CTCS ITMI
Xwg719 Xgwm121
Xgpw8014Xgpw4129Xgpw334
Xcfe261Xcfe260
Xcfe253b
Xcfe213a
Xcfe187
Xcfe247aXcfe27
Xcfe42
Xcfe22


Protocol & Products

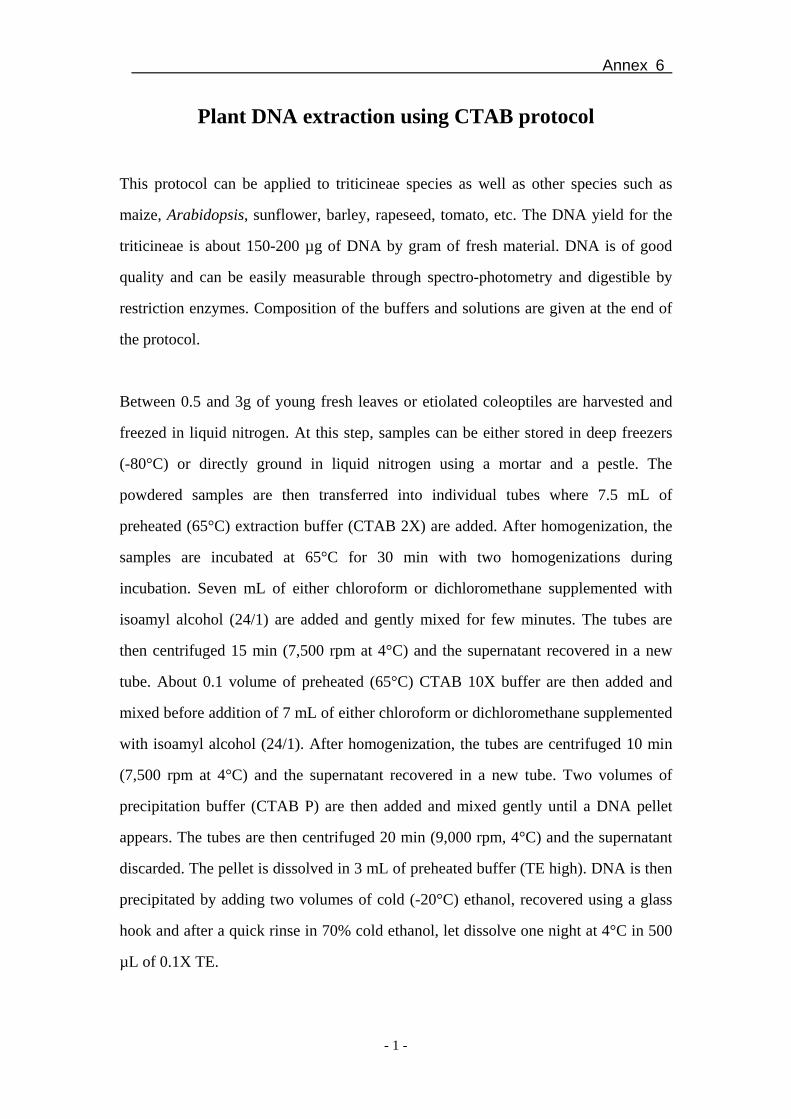
Annex 6
- 1 -
Plant DNA extraction using CTAB protocol
This protocol can be applied to triticineae species as well as other species such as
maize, Arabidopsis, sunflower, barley, rapeseed, tomato, etc. The DNA yield for the
triticineae is about 150-200 µg of DNA by gram of fresh material. DNA is of good
quality and can be easily measurable through spectro-photometry and digestible by
restriction enzymes. Composition of the buffers and solutions are given at the end of
the protocol.
Between 0.5 and 3g of young fresh leaves or etiolated coleoptiles are harvested and
freezed in liquid nitrogen. At this step, samples can be either stored in deep freezers
(-80°C) or directly ground in liquid nitrogen using a mortar and a pestle. The
powdered samples are then transferred into individual tubes where 7.5 mL of
preheated (65°C) extraction buffer (CTAB 2X) are added. After homogenization, the
samples are incubated at 65°C for 30 min with two homogenizations during
incubation. Seven mL of either chloroform or dichloromethane supplemented with
isoamyl alcohol (24/1) are added and gently mixed for few minutes. The tubes are
then centrifuged 15 min (7,500 rpm at 4°C) and the supernatant recovered in a new
tube. About 0.1 volume of preheated (65°C) CTAB 10X buffer are then added and
mixed before addition of 7 mL of either chloroform or dichloromethane supplemented
with isoamyl alcohol (24/1). After homogenization, the tubes are centrifuged 10 min
(7,500 rpm at 4°C) and the supernatant recovered in a new tube. Two volumes of
precipitation buffer (CTAB P) are then added and mixed gently until a DNA pellet
appears. The tubes are then centrifuged 20 min (9,000 rpm, 4°C) and the supernatant
discarded. The pellet is dissolved in 3 mL of preheated buffer (TE high). DNA is then
precipitated by adding two volumes of cold (-20°C) ethanol, recovered using a glass
hook and after a quick rinse in 70% cold ethanol, let dissolve one night at 4°C in 500
µL of 0.1X TE.


Annex 6
- 2 -
After complete re-suspension, DNA is purified by adding 100 µg of RNAse A and
incubating 30 min at 37°C. One volume of a solution of phenol/chloroform/isoamyl
alcohol (25/24/1) is then added and mixed gently for 2 min. After centrifugation (10
min, 12,000 rpm, room temperature) the supernatant is recovered in a new tube
containing one volume of chloroform/isoamyl alcohol (24/1) and gently mixed for 2
min. The tubes are then centrifuged (10 min, 12,000 rpm, room temperature) and the
supernatant is recovered in a new tube containing 50 µmoles of sodium chloride.
DNA is then precipitated by adding two volumes of cold (-20°C) ethanol, recovered
using a glass hook and after a quick rinse in 70% cold ethanol, let dissolve one night
at 4°C in 250 µL of 0.1X TE.
DNA concentration can then be measured using a spectro-photometer and adjusted at
the desired concentration. Quality of the DNA is checked on a 0.8% agarose gel in
TAE 1X buffer.


Annex 6
- 3 -
Buffers and solutions used in the CTAB protocol
Chloroform/Isoamyl alcohol (24:1)
- chloroform 96%
- isoamyl alcohol (also methyl-3, butanol-1) 4%
CTAB 10%:
- CTAB 10 %
- NaCl 0.7 M
Extraction buffer (CTAB 2X):
- CTAB 2 %
- Tris 100 mM
- EDTA 20 mM
- NaCl 1.4 M
- PVP 40 1 %
Precipitation buffer (CTAB-P):
- CTAB 1 %
- Tris 0.7 M
- EDTA 10mM
TE 1X (pH 8.0):
- Tris 10 mM
- EDTA 1 mM
For TE 0.1X, dilute ten times.
TE High (pH 8.0)
- Tris 10mM


Annex 6
- 4 -
- EDTA 50mM
- NaCl 500mM
Phenol/chloroforme/isoamyl alcohol (25/24/1)
- Phenol 50%
- Chloroform 48%
- Isoamyl alcohol 2%
RNAse A:
- Dissolution buffer (pH 7.5):
- Tris 10 mM
- NaCl 15 mM
Add RNAse A at the appropriate concentration and boil 15 min at 100 °C. Store at
-20°C
TAE 50X (pH 8.0):
- Tris 2 M
- EDTA 50 mM
- Acetic acid 1 M

Résumé Bien que la génomique du blé tendre (T. aestivum L.) a connu un essor important ces cinq dernières années, peu d’efforts ont été faits dans le domaine de la génomique des espèces sauvages apparentées au blé. Le premier objectif de cette thèse a été de développer de nouveaux marqueurs moléculaires utilisables sur le blé et transférables vers un nombre important d’espèces cultivées ou sauvages de graminées. Pour cela, nous nous sommes intéressés aux microsatellites localisés dans des séquences de gènes exprimés (EST) afin d’exploiter le nombre important d’EST de blé présentes dans les bases de données et parce que les gènes sont les régions du génome les mieux conservées entre les différentes espèces. A partir d’environ 1 000 contigs d’EST portant un microsatellite nous avons constaté que les motifs tri nucléotidiques étaient les plus fréquents (~80%). Nous avons développé 301 couples d’amorces (EST-SSR) que nous avons testés sur huit variétés de blé tendre et huit espèces apparentées. Environ 80% d’entre eux ont donné un produit d’amplification chez le blé, celui-ci étant en général de grande qualité et polymorphe dans 25,4% des cas (nombre moyen d’allèles = 3,1/locus, valeur PIC moyenne = 0,40). Sur les 240 EST-SSR amplifiables, 177 ont été assignés aux chromosomes de blé grâce aux lignées aneuploïdes et 81 nouveaux locus ont été intégrés aux cartes génétiques de référence. La portabilité des EST-SSR vers les autres espèces apparentées est excellente pour les sous espèces de blé (100% pour T. aestivum ssp compactum) et diminue avec l’éloignement phylogénétique pour atteindre encore 28% avec le riz. D’un point de vue évolutif, la projection des séquences d’EST sélectionnées sur la séquence du génome de riz montre une localisation préférentielle près des télomères et une meilleure similarité entre ces deux espèces au niveau des chromosomes 2, 3 et 5 de riz. De même, lorsque l’on s’intéresse aux microsatellites donnant un produit d’amplification à la fois chez le blé, l’orge et le riz, nous remarquons que le motif existe et est fréquemment similaire chez les trois espèces, ce qui suggère une origine commune. D’un point de vue de la diversité allélique des EST-SSR chez les espèces apparentées, nous montrons qu’elle est plus importante chez les espèces allogames telles que Ae. speltoides, le ray-grass ou le maïs (respectivement 0,423, 0,388 et 0,352) alors que les espèces autogames comme le blé tendre ou dur montrent des valeurs plus faibles (respectivement 0,108 et 0,093). Le développement réciproque d’une centaine (106) d’EST-SSR à partir de gènes du chromosome 1 de riz donne des résultats de portabilité vers le blé tendre similaires aux précédents (28,5%) et confirme les relations de colinéarité connues entre le chromosome 1 de riz et les chromosomes du groupe d’homéologie 3 du blé. Le deuxième objectif de cette thèse était d’exploiter les EST-SSR montrant une bonne portabilité pour valider leur capacité dans le cadre d’analyses phylogénétiques chez les Triticées et les graminées. Les résultats indiquent que ces marqueurs permettent de classer les lignées et les espèces conformément aux connaissances concernant la phylogénie et les pedigrees. Ils confirment également que les espèces T. monococcum ssp urartu, Ae. speltoides et Ae. tauschii sont respectivement apparentées aux donneurs des génomes A, B et D du blé tendre. Nous pouvons donc conclure que les EST-SSR sont des marqueurs intéressants et puissants pour étudier les espèces sauvages orphelines et pour faire des analyses de génomique comparative au sein de la tribu des Triticées et plus généralement de la famille des graminées.

Abstract Despite recent progress in wheat (T. aestivum L.) genomics, only few efforts have been made in the genomics of wild and closely related wheat species. The first aim of this PhD was to develop new molecular markers useful on wheat and transferable to other cultivated as well as wild grass species. We focused our work on microsatellites (SSRs) located in expressed gene sequences (ESTs) to exploit the large number of wheat ESTs present in the databases and also because the genes are the best conserved regions of the genome between the different species. From about 1,000 EST contigs bearing a microsatellite, we observed that the trinucleotide motifs were the most frequent (~80%). We developed 301 primer pairs (EST-SSRs) that were evaluated on a set of eight wheat cultivars and eight related species. About 80% of the primer pairs gave an amplification product on wheat. Most of the time, we had high quality patterns. The level of polymorphism was estimated to be 25.4% on wheat (mean of 3.1 allele/locus and PIC value of 0.40). Among the 240 EST-SSRs that gave an amplification product on wheat, 177 were assigned to wheat chromosomes using aneuploid lines and 81 new loci were added and integrated to the reference wheat genetic maps. Transferability of wheat EST-SSRs to related species was very good for wheat subspecies (100% for T. aestivum ssp compactum) and decreased while the phylogenetic distance increased. However, transferability reached 28% with rice. The alignment of the selected wheat EST-SSRs on the rice genome sequence showed a preferential localisation in the telomeric regions and a better similarity of wheat ESTs on rice chromosomes 2, 3 and 5. Moreover, a thorough study of the EST-SSRs giving an amplification product in wheat, rice and barley indicates that the motif is present and is frequently similar in the three species suggesting a common ancestral origin. The allelic diversity of the EST-SSRs among the wheat related species was higher in allogamous species such as Ae. speltoides, Lolium perenne and maize (respectively 0.423, 0.388 and 0.352) while autogamous species such as bread and durum wheats showed lower values (respectively 0.108 et 0.093). Reciprocal development of 106 rice EST-SSRs originating from genes of the rice chromosome 1 gave similar results concerning the transferability to wheat (28.5%) as those observed for wheat EST-SSRs and confirmed the known syntenic relationships between rice chromosome 1 and wheat homoeologous group 3. The second aim of the PhD was the exploitation of the EST-SSRs showing a good transferability to validate their capacities for phylogenetic analyses among the Triticeae and the grasses. The results indicate that these markers are able to properly classify the lines and the species according to the known data about their phylogeny and their pedigrees. The results also confirmed that T. monococcum ssp urartu, Ae. speltoides and Ae. tauschii species are closely related to the ancestral donors of the A, B and D genomes of bread wheat respectively. Thus, we can conclude that wheat EST-SSRs are interesting and powerful markers to study wheat related orphan species and to make phylogenetic and comparative genomics analyses among the Triticeae tribe and more generally among the grass family.